 Peng Yang
 Lei Wang
 Runtao Zhang
- State Grid Hebei Electric Power Research Institute, Shijiazhuang, Hebei, China
Large-scale photovoltaic (PV) integration into microgrids often leads to reduced inertia, diminished damping, and increased generation intermittency. To address these challenges, this paper proposes a coordinated control and optimization strategy for PV–hybrid energy storage systems. An inertia coefficient k, derived from the energy equivalence between the rotational kinetic energy of a synchronous generator and the stored energy of batteries, is introduced. An optimized inertia control scheme is designed to suppress low-frequency load fluctuations based on microgrid frequency variations, thereby mitigating disturbance-induced frequency deviations, while a supercapacitor voltage-deviation control loop is incorporated to attenuate high-frequency load fluctuations and stabilize DC bus voltage. An optimization model targeting improved dynamic frequency response stability is then formulated and solved using a multi-objective design approach based on an improved particle swarm optimization (PSO) algorithm, with feasible steady-state initialization ranges specified for key parameters. MATLAB/Simulink simulations under scenarios of sudden load increase, continuous load variation, and low-inertia supercapacitor operation demonstrate that the proposed method outperforms conventional control strategies by reducing frequency excursions, lowering the rate of change of frequency (RoCoF), improving the frequency nadir, providing virtual inertia, and enhancing overall system stability.
1 Introduction
In the context of the “dual-carbon” targets, renewable energy technologies have been developing rapidly, with the steadily declining cost of photovoltaic (PV) power generation offering substantial growth potential in the power sector (Wanxing et al., 2019). However, as PV systems are stationary power sources interfaced to the grid through power electronic converters and lack rotating components found in conventional generators, they inherently reduce system inertia and may impair transient stability (Zhao et al., 2022). Furthermore, the proliferation of distributed generators (DGs) (Hu et al., 2025) has placed additional stress on the stability of conventional power grids. To mitigate these challenges, the concept of the virtual synchronous generator (VSG) has been proposed, which emulates the electromechanical characteristics of synchronous machines to provide virtual inertia and damping for power electronic interfaces (Rathnayake et al., 2022), thereby enhancing the stability of distributed generation when integrated into the grid (Karimi et al., 2019).
Due to the stochastic nature of DGs (Hu et al., 2022) and their inherent lack of inertia and damping, energy storage systems (ESSs) must be installed on the DC side to supply virtual inertia. Commonly deployed ESSs can be broadly categorized into power-type and energy-type storage (Yuan et al., 2024). Power-type devices, such as supercapacitors, offer high power density and are suitable for compensating short-term, high-frequency load variations (Ruirui et al., 2022). In contrast, energy-type storage, such as batteries, features high energy density and is capable of mitigating long-term, low-frequency load fluctuations (Yanan et al., 2019). However, both types are subject to overcharge and over-discharge constraints. Consequently, optimizing the power and energy configuration of ESSs in conjunction with improved VSG control strategies is of particular importance (Shen et al., 2021). In (Zhang et al., 2019a), an output model for ESSs was developed based on the inertia and frequency regulation characteristics of VSGs, and its validity was verified through simulations of step disturbances. Nonetheless, random load fluctuations were not considered. In (Zhijiang et al., 2015), the current signal was decomposed into high- and low-frequency components via a low-pass filter, and the corresponding power components were allocated to the battery and supercapacitor, thereby realizing coordinated power sharing. However, this approach did not address the charge state constraints of the supercapacitor.
At present, most photovoltaic (PV) systems can provide virtual inertia only when coupled with energy storage. In (Zhang et al., 2019b), a virtual rotational inertia control strategy based on hybrid static energy storage was proposed, introducing a constant rate-of-change ratio factor. However, under continuous load variations, this constant factor fails to track system frequency deviations effectively, thereby limiting its capability to regulate the output of the energy storage system. This limitation highlights the need for a ratio factor that can adaptively adjust in response to system frequency changes. Adaptive regulation methods, however, are highly sensitive to the selection of initial parameter values. In (Yang et al., 2019), inverter-side adaptive control was developed based on system stability and small-signal model analysis, but the approach still required manual initialization of key parameters. Although these parameters can indeed enhance system stability, the methodology for determining optimal initial values remains an open problem requiring further investigation.
In summary, this paper first establishes a conversion relationship between the rotational kinetic energy of synchronous machines, as influenced by frequency variations, and the energy capacity of batteries, based on which a dynamic inertia coefficient control scheme for batteries is proposed. To mitigate DC-side voltage fluctuations, a supercapacitor voltage deviation control strategy is introduced. Furthermore, to handle uncertainties in key system parameters, an improved particle swarm optimization (PSO) algorithm is integrated into the DC-side control for adaptive parameter tuning, thereby enhancing control accuracy. The convergence performance of the improved algorithm is compared with the original to determine optimal steady-state initial values. Finally, MATLAB/Simulink simulations under scenarios including sudden load increase, continuous load variation, and supercapacitor charge states in low-inertia regions validate the proposed control strategy’s effectiveness by analyzing DC-side hybrid energy storage output and AC-side system stability.
2 VSG integrated control strategy
2.1 VSG control
To study the grid-support capabilities of VSGs, most studies simplify the model by adding an ideal DC voltage source on the DC side. However, with the increasing adoption of distributed generation (DG), the DC side should incorporate new energy generation units. This paper introduces a hybrid energy storage system on the DC side, based on photovoltaic (PV) power generation, to replace the ideal DC source, thereby providing energy for the VSG. Since inverters are static components, they do not have rotational inertia or damping characteristics. Therefore, introducing the rotational characteristics of traditional synchronous machines into inverters can effectively improve grid connection stability and give DG inertia and damping. According to the second-order model of synchronous machines, the following motion formula reflects the inertia and damping characteristics of VSG.
In the formula: J is the virtual rotational inertia; Pm is the VSG mechanical power; D is the virtual damping coefficient;ω0 = 2πf0 is the virtual rated angular velocity of the VSG, and f0 is the rated frequency of 50 Hz.
As can be seen from Formula 1, J and D can increase the inertia and damping of DG, thereby improving grid friendliness. Since VSG participates in grid frequency regulation by changing the input power, its input active power can be divided into two parts: one is the active power reference value Pref, and the other is the power deviation value caused by frequency changes, expressed as.
In the formula: Dp is the active power frequency droop coefficient.
As can be seen from Formula 2, the command power of the VSG is related to both the given reference value and the change in frequency. This is an advantage of VSG control over traditional control, demonstrating that VSG control has primary frequency regulation capability, thereby improving the grid connection reliability of DG. For reactive power-voltage control, traditional synchronous machines adjust the excitation current to change the terminal voltage and reactive power output. Similarly, this paper adopts a reactive power-voltage droop characteristic, expressed as,
In the Formula 3: Dq is the reactive power-voltage droop coefficient; E0 is the rated value of the VSG voltage amplitude; Dv is the voltage difference proportional coefficient.
2.2 VSG power distribution strategy
For hybrid energy storage units, when the system load changes, the battery and supercapacitor work together to provide power. However, since the energy density of the battery is greater than that of the supercapacitor, while the power density of the supercapacitor is greater than that of the battery, the hybrid energy storage control strategy described in this paper is for the battery to handle the slower-changing low-frequency components, while the supercapacitor handles the faster-changing high-frequency components.
Formula 1 gives the model of VSG during the transient process, that is
In the Formula 4: Jω·dΔω/dt represents the power change in the VSG caused by frequency, which is related to the rate of change in frequency; ΔPe is electrical power deviation; ΔPm is mechanical power deviation; DΔω represents the change in damping torque caused by frequency changes. From Formula 2, it can be seen that ΔPm is related to the frequency change, and its steady-state value is DpΔω. Thus, ΔPe and DΔω represent power demand, while Jω·dΔω/dt and ΔPm represent VSG output changes. From this, the following formulas can be derived.
From Formula 5: ΔPbat is the change in battery power; ΔPsc is the change in supercapacitor power. As can be seen from Formulas 6 and 7, the slower-changing ΔPm is allocated to the battery output, while the faster-changing -Jω·dΔω/dt is allocated to the supercapacitor output. When the system frequency changes, due to the inertia of the VSG,ω does not undergo sudden changes. Therefore, the battery handles the low-frequency components of load changes, while the supercapacitor handles the high-frequency components to mitigate voltage fluctuations. When the system frequency remains stable, dΔω/dt = 0, and the supercapacitor output is 0 W.
3 Photovoltaic hybrid energy storage systems
3.1 Structure of photovoltaic hybrid energy storage system
This paper establishes a power grid system with photovoltaic power as the main power source. The system includes photovoltaic power sources, hybrid energy storage, an AC main grid, and daily loads. The hybrid energy storage consists of batteries and supercapacitors. The structure of the photovoltaic hybrid energy storage system is shown in Figure 1. In the figure, Ppv represents the power reference value of the photovoltaic power source, Pbat represents the power reference value of the energy storage batteries, Psc represents the power reference value of the supercapacitors, Pg represents the power reference value of the synchronous machine, and Pl represents the load power.
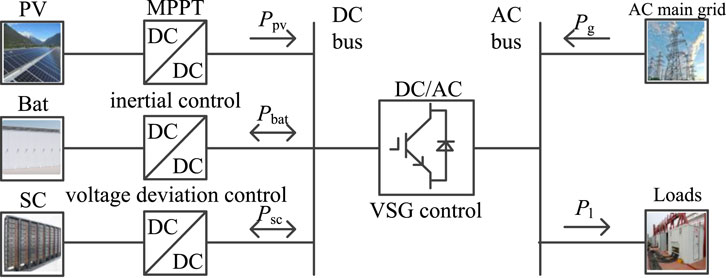
Figure 1. Structure of photovoltaic hybrid energy storage system.
From Figure 1, we can see the power change of the hybrid energy storage system:
In the Formula 8: ΔPl is the change in load power; ΔPg is the change in synchronous machine power; ΔPpv is the change in photovoltaic power.
The hybrid energy storage system consists of a parallel structure of batteries and supercapacitors, which together provide energy to the VSG. Since both DG and loads exhibit significant fluctuations, the microgrid can stabilize grid frequency through the VSG when DG and load power change. Specifically, photovoltaic systems employ MPPT control strategies, energy storage batteries use inertial control based on grid frequency changes, and supercapacitors utilize voltage deviation control based on changes in DC bus voltage, thereby ensuring the stability of system frequency and voltage.
3.2 Virtual inertia of batteries
In power systems, inertia and damping often originate from the mechanical components of synchronous machine rotors. Ignoring the effects of damping and assuming a pole pair number of 1, the rotational kinetic energy of the rotor component is as follows:
In the Formula 9: EG is the rotational kinetic energy of the generator; JG is the rotational inertia of the generator; ωG is the synchronous angular velocity of the generator.
Unlike rotating components, batteries lack inertia but can rapidly access stored electrical energy through appropriate control, thereby simulating virtual inertia to provide system support. However, the energy storage systems installed in photovoltaic power plants are primarily used to mitigate the random fluctuations in sunlight intensity. If they can rapidly mobilize large amounts of electrical energy, they still have the capability to address sudden changes in system frequency. Therefore, through appropriate power control, energy storage batteries can be used for rapid charging and discharging over short periods to mitigate load variations. It is evident that, in theory, energy storage batteries possess inertial response capabilities similar to those of synchronous machines.
As defined by the state of charge (SOC) of the battery, the charge at time t is:
In the formula: SSOC(t) is the charge level of the battery at time t; QN is the rated capacity of the battery; Qbat is the remaining charge of the battery at time t; ibat(t) is the current magnitude of the battery at time t.
From Formula 10, we can obtain the energy stored in the battery.
In the formula: Ubat is the voltage amplitude of the battery; SSOC(0) is the initial charge of the battery.
From Formula 11, we obtain.
In the formula: Jbat is the virtual rotational inertia of the battery.
From Formula 12, it can be seen that when the battery outputs power as the system frequency changes, it can be equivalent to a synchronous machine with a rotational inertia of Jbat, thereby converting its static energy into virtual rotational kinetic energy. From Formula 12, we obtain.
According to Formula 13, the virtual rotational inertia Jbat of the battery is related to its own rated voltage, rated capacity, state of charge, and system frequency. Substituting Formula 11 into Formula 13, we obtain
In the formula: k is the inertia coefficient, expressed as, the ratio of the rate of change in the charge of the battery to the rate of change in the speed of the synchronous machine.
As shown in Formula 15, if the rate of change in the charge of the battery is much greater than the rate of change in the synchronous machine’s rotational speed, expressed as, k is much greater than 1, and since the battery acts as a stationary component with no rotational inertia and can independently regulate power, it can temporarily simulate rotational kinetic energy far greater than that of the synchronous machine. During frequency regulation, the value of k can be set according to system requirements to provide stable and effective support to the system. Based on the definition of the virtual rotational inertia of the battery in Formula 14, combined with the dynamic changes in system frequency, the power output of the battery can be effectively controlled to regulate system frequency and provide inertia support.
4 Comprehensive control strategy for photovoltaic hybrid energy storage systems
4.1 Energy storage dynamic inertia coefficient control
As can be seen from the previous section, if k is set as a constant, it is impossible to accurately provide the corresponding inertia based on the system’s inertial requirements. If k is too small, it will affect the system’s frequency decay process; if k is too large, it will be detrimental to the system’s frequency recovery process. Therefore, it is particularly important to set k to dynamically change with the system frequency. When the system is disturbed, the system’s angular frequency oscillation curve is shown in Figure 2.
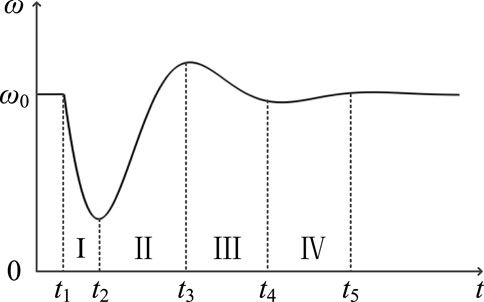
Figure 2. System angular frequency oscillation curve.
In Figure 2, ω0 is the rated angular velocity of the synchronous generator, ω0 = 2πf0, where f0 is the rated frequency, 50 Hz; ω is the mechanical angular velocity of the synchronous machine.
As shown in Figure 2, when the system experiences a sudden increase in load, the system angular frequency can be divided into four intervals. Interval I: t1—t2, the frequency decrease interval, where the rotor angular velocity is less than the rated angular velocity, and the angular velocity change rate dω/dt first increases and then decreases to 0. Therefore, in this interval, k should be increased to prevent the frequency from dropping too deeply; Interval II: t2—t3, the frequency recovery interval, where the rotor angular velocity remains below the grid rated angular velocity but is gradually increasing, and the angular velocity change rate dω/dt>0. In this interval, k should be reduced to enable ω to quickly recover to near the rated value; Interval III: t3—t4, the frequency overshoot interval, where the rotor angular velocity exceeds the rated angular velocity, and dω/dt>0. Therefore, k can be appropriately increased to accelerate ω in the opposite direction away from the rated value; Interval IV: t4—t5, the frequency stabilization interval, where k can be appropriately decreased to restore ω to near the rated value. The changes in k under different conditions are shown in Table 1.
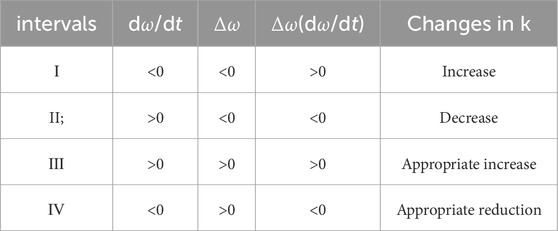
Table 1. Changes in k under different conditions.
According to Table 1, the selection strategy for k can be obtained.
In the 16: k0 is the inertia coefficient when the system is in a stable state; kω is the inertia adjustment coefficient; Tω is the change threshold of dω/dt.
From Formula 11 we obtain
According to Formula 17, we obtain
In the formula: f is the system frequency; Δf = f-f0 is the frequency deviation value.
Combining Formulas 17 and 18, we can derive the battery control block diagram, as shown in Figure 3.
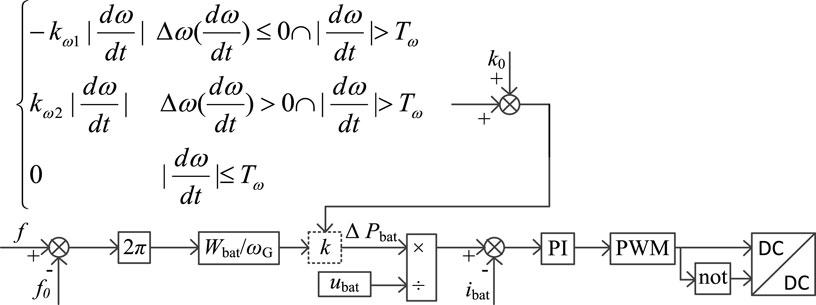
Figure 3. Block diagram of dynamic inertia coefficient control for energy storage batteries.
As can be seen from Figure 3, energy storage inertia control is related to system frequency. After power calculation and comparison with current values, two PWM pulses are finally output through PI regulation.
When the system load undergoes disturbances, whether due to sudden increases or decreases, the battery, as the DC-side power source, must first verify whether its SSOC is within the appropriate operating range. The inertia zone of the battery is shown in Figure 4. If the SSOC of the battery is within the safe charge/discharge zone, the range of SSOC changes can be indirectly controlled by adjusting the value of k, thereby controlling the charge/discharge current and simulating rotational inertia to provide inertial support for the system. If the SSOC is in the low inertia zone, the battery can continue to provide simulated inertia for a short time until its SSOC enters the charge/discharge prohibited zone; If the SSOC is in the discharge prohibited zone, expressed as, SSOC < 10%, the discharge current must be controlled to 0 A; At this point, the battery cannot operate, and the supercapacitor must continue to assume the power allocated to the battery. If the charge level is in the charging prohibited zone, expressed as, SSOC > 90%, the charging current must be controlled to 0 A. The battery cannot provide inertial support, and the supercapacitor must continue to assume the power allocated to the battery.

Figure 4. Inertial region of energy storage batteries.
4.2 Supercapacitor voltage deviation control
Based on the above analysis, the battery performs reasonable charging and discharging through inertial control based on system frequency changes. The voltage deviation control of the supercapacitor is shown in Figure 5, where udc is the DC bus voltage, iref is the supercapacitor current reference value, and isc is the supercapacitor output current. The DC-side supercapacitor uses voltage-current control, adding the frequency-dependent Δu to the DC bus voltage to ensure DC-side voltage stability.
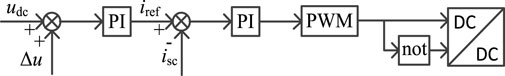
Figure 5. Supercapacitor voltage deviation control.
As shown in Figure 5, in order to maintain the stability of the DC side voltage, supercapacitor voltage deviation control is introduced into the AC side VSG control, and the output signal is added to the DC side. The voltage change Δu is obtained from the frequency deviation, expressed as:
In the formula: kv is the voltage coefficient.
The DC-side voltage varies with the system. If the system frequency decreases, Δu decreases accordingly, the DC-side voltage decreases, and the supercapacitor outputs power; if the system frequency increases, Δu increases accordingly, the DC-side voltage increases, and the supercapacitor absorbs power. As the power is gradually adjusted, the DC-side voltage tends to stabilize, and the supercapacitor’s absorption/output power gradually decreases and tends to 0 W, with the required power ultimately provided by the battery. During the process of DC-side voltage changes, the output power of the supercapacitor can also be expressed as:
In the formula: Δudc is the change in bus voltage; Δisc is the change in supercapacitor output current; C is the supercapacitor value.
Combining Formula 6, we obtain
Combining Formulas 7, 19, and 20, we obtain
Combining Figure 4 with Formula 22, it can be seen Formula 23 that when the supercapacitor’s SSOC is in the high-inertia region, the magnitude of the power draw is primarily related to the system’s frequency change rate. If the frequency changes rapidly, the supercapacitor draws more power; conversely, if the frequency changes slowly, the supercapacitor draws less power, thereby canceling out the high-frequency components of the frequency. When the supercapacitor’s SSOC is in the charge/discharge prohibited zone, the kv can be manually set to 0, causing the supercapacitor to cease operation. At this point, the battery must continue to assume the power originally allocated to the supercapacitor.
5 Improved multi-objective PSO algorithm
The above text analyzes and calculates the key parameters of hybrid energy storage systems, but there are certain issues with the selection of initial value ranges. Considering the nonlinearity of the entire control system and the mutual influence between the AC-side VSG and DC-side hybrid energy storage, the particle swarm optimization (PSO) algorithm can effectively accomplish this task. However, the traditional PSO algorithm has issues such as being prone to local optima and convergence oscillations. Therefore, an improved PSO algorithm is proposed.
5.1 Objective function design
The design of the objective function directly affects the effectiveness of the final parameter selection. To improve the system’s frequency response, an algorithm will be used to select the inertia coefficient k0 at steady state, thereby enhancing the system’s frequency stability. A better frequency response should include rapid frequency recovery, fewer frequency deviations, and a smaller RoCoF. Therefore, a multi-objective optimization function can be designed as shown in Formula 24, which simultaneously considers the integral time absolute error (ITAE) of frequency, the lowest frequency point, and the RoCoF. ITAE reflects the convergence speed of frequency, while the lowest frequency point and RoCoF reflect the stability performance of frequency.
Formula 24 uses the weighted sum method, which involves multiplying all terms by their respective weighting factors and then summing them. This allows the multi-objective function to be converted into a single-objective function. The weighting factors serve two purposes: first, they scale the terms, making those with higher weights more important; second, they ensure that the units of the objective function match those of the ITAE units (Hz·s2). Therefore, here we set k1 = 1,k2 = 1s2,k3 = 1s3.
5.2 Adaptive design of inertial weighting factors
The traditional PSO algorithm starts from random particles, calculates the particle positions corresponding to the optimal values of the objective function, and then sends the particles into iteration until the global optimal particle positions corresponding to the global optimal solutions of the objective function are obtained.
If inertial weighting factor is large, it can enhance the global search capability of particles and accelerate the convergence speed of the algorithm, but it may also cause the algorithm to fail to converge. If inertial weighting factor is small, it can ensure the convergence of the algorithm, but it will also slow down the convergence speed of the algorithm. Therefore, w can be set to a large value in the early stage of the algorithm and a small value in the later stage. For cognitive and social factors, a larger q1 will give the particle stronger global search capabilities, while a larger q2 will give the particle stronger local search capabilities. Therefore, a larger q1 and a smaller q2 can be set at the beginning of the run, and the opposite can be set at the end of the run to avoid getting stuck in a local optimum. The expressions for w, q1, and q2 are as follows:
In the Formula 25, Formula 26, Formula 27: wmax and wmin are the maximum and minimum values of the inertial weighting factor w, respectively; qmax and qmin are the maximum and minimum values of the learning factor, respectively; k is the current iteration count; kmax is the maximum iteration count. Through the above calculation formula, the inertial weighting factor w can adapt more smoothly to the iterative state, enabling the improved PSO algorithm to solve for the optimal value more quickly.
6 Simulation analysis
To validate the effectiveness of the photovoltaic hybrid energy storage VSG control strategy proposed in this paper in providing inertia support for the system and reducing DC bus voltage fluctuations, a microgrid simulation model as shown in Figure 1 was established on the Matlab/Simulink platform. In this model, the photovoltaic system operates in maximum power point tracking (MPPT) mode with a rated output of 20 kW. The hybrid energy storage system employs a bidirectional DC/DC converter connected to the AC side, which also includes a synchronous generator with a rated power of 20 kW. A variable load is then connected to the grid. The simulation parameters are shown in Table 2.
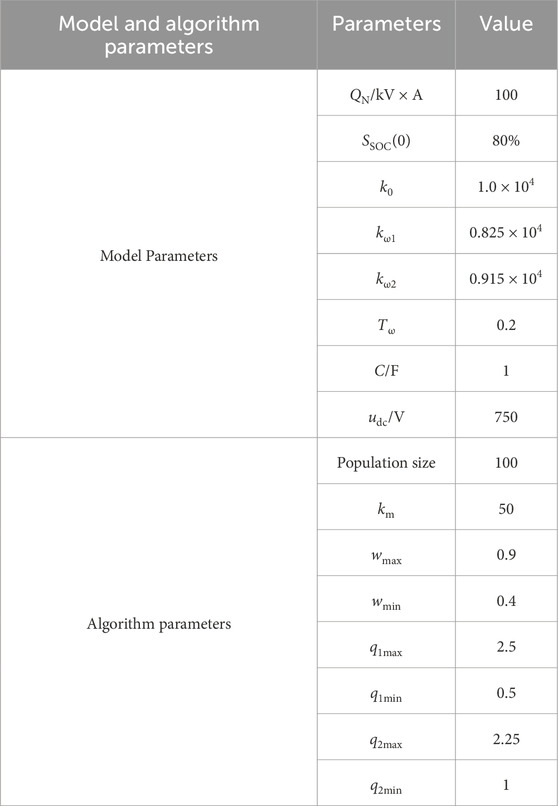
Table 2. Simulation parameters.
The improved PSO converges much faster than the traditional PSO because its inertia coefficient can be adjusted adaptively according to the iteration number and state. From the results of the improved PSO’s iterative calculations, it can be seen that the inertia coefficient k0 of the system in steady state is 1.0 × 10⁴.
6.1 Sudden load increases analysis
This paper sets the load surge simulation conditions as follows: the simulation duration is 6 s, the initial load is 25 kW, and the load surges by 15 kW at 3 s. The system frequency comparison and battery output are shown in Figure 6; the DC bus voltage and supercapacitor output are shown in Figure 7.
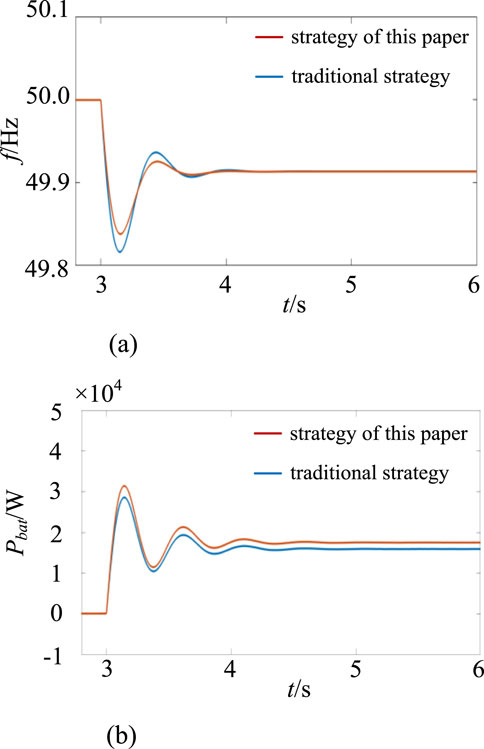
Figure 6. System frequency and battery output waveform. (a) System frequency. (b) Battery output.
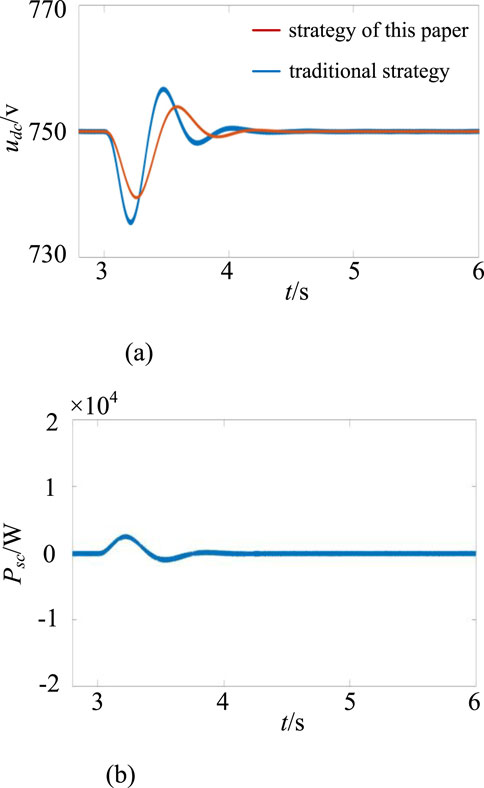
Figure 7. DC bus voltage and supercapacitor output waveform. (a) DC bus voltage. (b) Supercapacitive output.
As shown in Figure 6a, when there is a sudden increase in load on the AC side of the system, the frequency drops rapidly. By comparing the traditional inertia control introduced to the battery with the dynamic coefficient control proposed in this paper, it is found that when dynamic coefficient control is introduced, the battery can flexibly respond to frequency fluctuations caused by sudden increases in load, providing greater inertia during the frequency decline phase, with the lowest frequency point increasing from 49.813 Hz to 49.841 Hz. During the frequency recovery phase, reducing inertia is more conducive to frequency recovery. Compared to traditional inertia control, introducing dynamic coefficient control into the battery can effectively provide inertia support during system frequency fluctuations, thereby reducing the maximum frequency deviation and minimizing RoCoF. As shown in Figure 6b, when dynamic coefficient control is introduced using energy storage batteries, the system can provide more inertia. During sudden load increases, active power output can be rapidly increased to 31 kW, approximately 3 kW more than traditional inertial control, and eventually stabilizes around 15 kW, thereby virtually generating inertia response and providing power support for the system.
As shown in Figure 7a, a sudden increase in load causes a drop in the DC bus voltage. For the two control methods described below, when supercapacitors are introduced for voltage deviation control, they delay bus voltage fluctuations and reduce the magnitude of voltage drops. In contrast, traditional inertial control cannot mitigate significant voltage fluctuations, and in severe cases, may cause the system to shut down due to low voltage. Figure 7b shows the output waveform of the supercapacitor under voltage deviation control. Since the supercapacitor is configured in this study to handle the high-frequency components of the load and smooth out voltage fluctuations, it only outputs power during load surges, with output being 0 at other times. The situation for load reductions is similar and will not be elaborated upon here.
6.2 Analysis under continuous load variations
To test the performance of the model proposed in this paper under continuously changing loads, the simulation conditions were set as follows: simulation duration of 8 s, initial load of 20 kW, and random active power fluctuations of ±40 kW within the simulation cycle, as shown in Figure 8. The changes in system frequency and battery output with and without the control strategy proposed in this paper are shown in Figure 9; the DC bus voltage and supercapacitor output are shown in Figure 10.
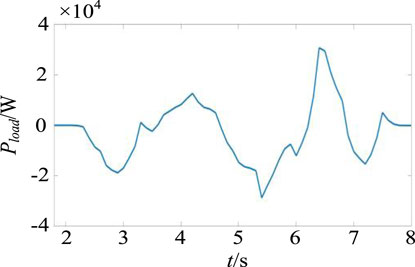
Figure 8. Load power fluctuations.
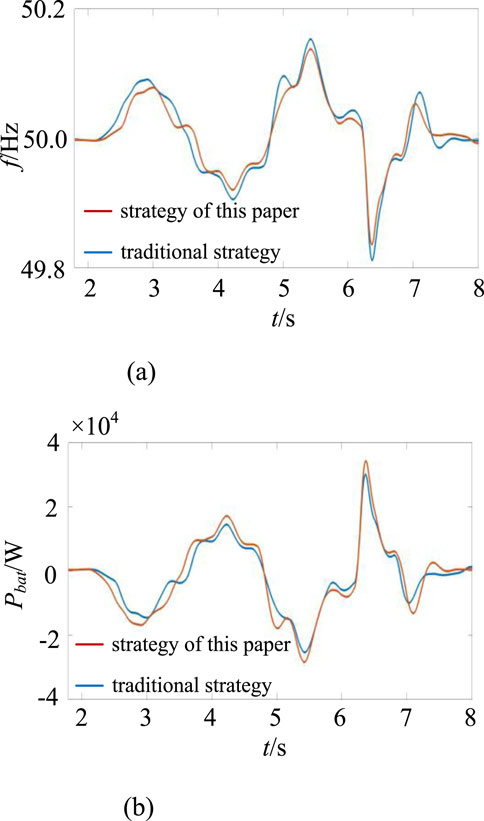
Figure 9. System frequency and battery output waveform. (a) System frequency. (b) Battery output.
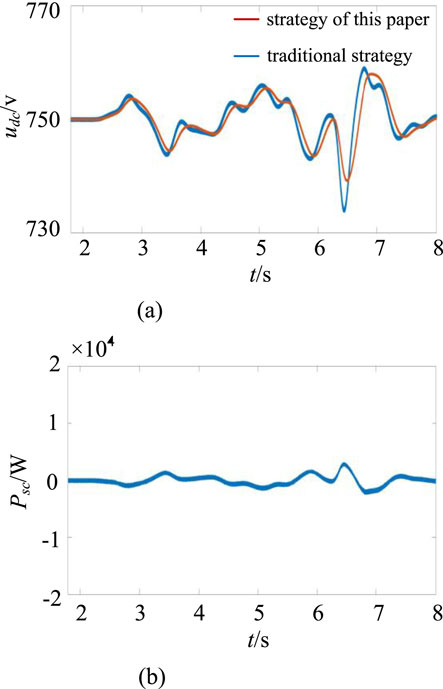
Figure 10. DC bus voltage and supercapacitor output waveform. (a) DC bus voltage. (b) DC bus voltage.
As shown in Figure 9a, an increase in load causes the system frequency to decrease, while a decrease in load causes the system frequency to increase. Under dynamic coefficient control, the range of frequency fluctuations is smaller compared to traditional inertial control. Under both control methods, the highest frequency point decreases from 50.153 Hz to 50.138 Hz, and the lowest frequency point increases from 49.812 Hz to 49.836 Hz. This demonstrates that introducing dynamic coefficient control with energy storage batteries can flexibly provide inertial support for the system and reduce RoCoF. As shown in Figure 9b, under continuous load fluctuations, dynamic coefficient control can more effectively provide active power output to the system compared to traditional control, thereby mitigating load fluctuations.
As shown in Figure 10a, an increase or decrease in load causes a drop or rise in the DC bus voltage. Compared to traditional inertial control, voltage deviation control is more effective in reducing bus voltage fluctuations. The maximum voltage point decreases from 758.4 V to 756.2 V, and the minimum voltage point increases from 733.6 V to 738.4 V, thereby mitigating the amplitude of voltage fluctuations. The output of the supercapacitor is shown in Figure 10b. The supercapacitor utilizes its power density to smooth out the high-frequency components of the load and provide power support.
Figure 11 shows the variation of the inertia coefficient k under two simulation conditions. As can be seen from Figure 11, k varies with the angular frequency of the system, which plays an important role in providing short-term inertia support to the system by energy storage batteries. The spikes in the variation of k are caused by the sudden change in dω/dt at the frequency inflection point.
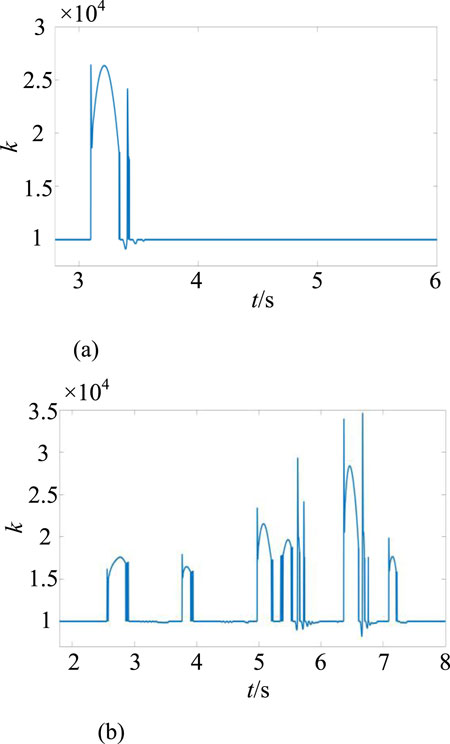
Figure 11. Changes in inertia coefficient k. (a) Sudden increase in load. (b) Continuous load changes.
6.3 Simulation analysis of supercapacitor’s SSOC in low inertia zone
To verify the stability of the system when the supercapacitor’s SSOC is in the low inertia zone, the simulation conditions were set as follows: the simulation duration was 6 s, and a sudden load increase of 70 kW occurred at the 3-s mark. Using the supercapacitor’s SSOC in both the high-inertia zone and low-inertia zone as references, the system frequency and battery output waveforms are shown in Figure 12, while the DC bus voltage and supercapacitor output waveforms are shown in Figure 13.
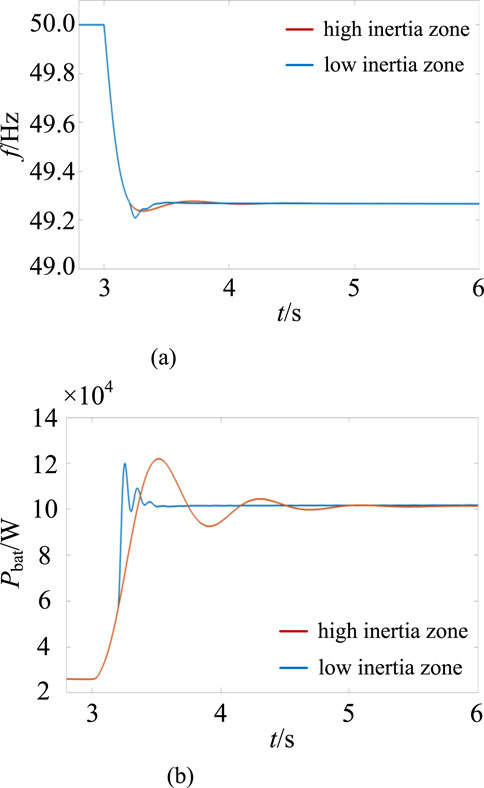
Figure 12. System frequency and battery output waveform. (a) System frequency. (b) Battery output.
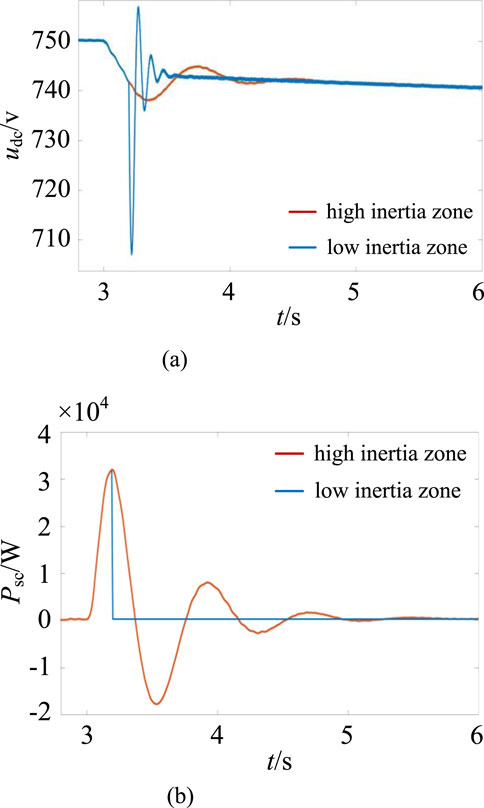
Figure 13. DC bus voltage and supercapacitor output waveform. (a) DC bus voltage. (b) Supercapacitor output.
As shown in Figure 12, due to the system being subjected to a large load impact, the frequency drops sharply. The supercapacitor, due to excessive discharge current, transitions from the low inertia zone to the discharge prohibition zone at 3.3 s, causing the supercapacitor’s discharge current to immediately drop to 0 A. As shown in Figure 12a, when the supercapacitor’s SSOC is in the high-inertia zone, the hybrid energy storage system provides power jointly, with the lowest frequency point at 49.215 Hz, followed by stabilization at 49.27 Hz. When the supercapacitor’s SSOC is in the low-inertia zone, after 3.3 s, only the battery provides power, resulting in greater frequency fluctuations and drops, followed by stabilization. As shown in Figure 12b, when the supercapacitor’s SSOC is in the low inertia zone, the supercapacitor’s discharge current becomes 0 A at the 3.3-s mark. At this point, the battery must provide a large amount of power in a short time to compensate for the supercapacitor’s power deficiency.
As shown in Figure 13a, a sudden increase in load causes fluctuations in the DC bus voltage. When the supercapacitor’s SSOC is in the low inertia zone, the supercapacitor stops outputting power at the 3.3 s mark, unable to stabilize the bus voltage normally. The voltage drops sharply from 750 V to 708 V, followed by significant fluctuations, prolonging the transition time. Significant fluctuations in bus voltage can, in severe cases, lead to system shutdown. As shown in Figure 13b, when the supercapacitor’s SSOC transitions to the discharge-prohibited zone, its output instantly drops to 0 W. At this point, the battery must continue to compensate for the missing power from the supercapacitor.
7 Conclusion
This paper addresses issues such as inertia support and power distribution in photovoltaic hybrid energy storage VSG systems. It proposes dynamic inertia coefficient control of energy storage batteries to mitigate the low-frequency components of load fluctuations and voltage deviation control of supercapacitors to mitigate the high-frequency components of load fluctuations, thereby achieving power support and distribution. A simulation platform was established to create a scenario with sudden load increase, continuous load fluctuations and the supercapacitor’s SSOC operating in the low-inertia zone, verifying that the proposed control strategy enhances system stability while ensuring reasonable power allocation within the hybrid energy storage system. Through theoretical analysis and simulation verification of the control strategy, the following conclusions were drawn.
1. Since photovoltaic and hybrid energy storage are both stationary components that differ from generators, they have no rotating mechanical kinetic energy or inertia. The control proposed in this paper can flexibly provide inertia support for the system, reducing damage caused by frequency fluctuations.
2. Compared with traditional inertia coefficient control, dynamic inertia coefficient control of energy storage batteries controls the change in k value based on the tracked DG virtual angular frequency, thereby providing inertia to the system more effectively and improving system stability. Considering factors such as insufficient power density of energy storage batteries, voltage deviation control is introduced to mobilize the power release of supercapacitors to smooth out DC bus voltage fluctuations, thereby making reasonable use of the advantages of energy storage batteries and supercapacitors.
Data availability statement
The raw data supporting the conclusions of this article will be made available by the authors, without undue reservation.
Author contributions
PY: Writing – review and editing, Writing – original draft. LW: Writing – review and editing, Writing – original draft. RZ: Writing – original draft, Writing – review and editing. CS: Writing – review and editing, Writing – original draft. ZC: Writing – original draft, Writing – review and editing.
Funding
The author(s) declare that financial support was received for the research and/or publication of this article. State Grid Hebei Electric Power Co., Ltd. Research Project (Grant No. kj2023-015).
Conflict of interest
Authors PY, LW, RZ, CS, and ZC were employed by State Grid Hebei Electric Power Research Institute.
Generative AI statement
The author(s) declare that no Generative AI was used in the creation of this manuscript.
Any alternative text (alt text) provided alongside figures in this article has been generated by Frontiers with the support of artificial intelligence and reasonable efforts have been made to ensure accuracy, including review by the authors wherever possible. If you identify any issues, please contact us.
Publisher’s note
All claims expressed in this article are solely those of the authors and do not necessarily represent those of their affiliated organizations, or those of the publisher, the editors and the reviewers. Any product that may be evaluated in this article, or claim that may be made by its manufacturer, is not guaranteed or endorsed by the publisher.
References
Hu, Z., Liu, S., Luo, W., and Wu, L. (2022). Resilient distributed fuzzy load frequency regulation for power systems under cross-layer random denial-of-service attacks. IEEE Trans. Cybern. 52 (4), 2396–2406. doi:10.1109/TCYB.2020.3005283
Hu, Z., Su, R., Veerasamy, V., Huang, L., and Ma, R. (2025). Resilient frequency regulation for microgrids under phasor measurement unit faults and communication intermittency. IEEE Trans. Industrial Inf. 21 (2), 1941–1949. doi:10.1109/TII.2024.3495785
Karimi, A., Khayat, Y., Naderi, M., Dragicevic, T., Mirzaei, R., Blaabjerg, F., et al. (2019). Inertia response improvement in ac microgrids: a fuzzy-based virtual synchronous generator control. IEEE Trans. Power Electron. 35 (4), 4321–4331. doi:10.1109/tpel.2019.2937397
Rathnayake, D. B., Razzaghi, R., and Bahrani, B. (2022). Generalized virtual synchronous generator control design for renewable power systems. IEEE Trans. Sustain. Energy 13 (2), 1021–1036. doi:10.1109/tste.2022.3143664
Ruirui, L., Qi, L., Pu, Y., Shuo, L., Cai, S., and Weirong, C. (2022). Capacity optimization configuration of multi-microgrid systems with electric-hydrogen hybrid energy storage considering power interaction constraints. Power Syst. Prot. Control 50 (14), 53–64. doi:10.19783/j.cnki.pspc.211311
Shen, X., Nie, C., and Lyu, H. (2021). Optimization control strategy for off-grid wind power hydrogen production alkaline electrolyzer arrays considering electrical and thermal characteristics. J. Electr. Eng. 36 (03), 463–472. doi:10.19595/j.cnki.1000-6753.tces.200283
Wanxing, S., Ming, W., Yu, J., Lingfeng, K., Jing, P., Haifeng, S., Wu, W., et al. (2019). Key technologies and engineering practices for grid integration and consumption of distributed renewable energy power generation clusters. J. Electr. Eng. China 39 (08), 2175–2186+1. doi:10.13334/j.0258-8013.pcsee.182456
Yanan, L., Qian, W., Song, W., and Haifeng, S. (2019). Variational modal decomposition-fuzzy control strategy for smoothing wind power output in hybrid energy storage systems. Power Syst. Prot. Control 47 (7), 58–65.
Yang, Y., Mei, F., Zhang, C. Y., Huiyu, M., Hongfei, C., and Jianyong, Z. (2019). Cooperative adaptive control strategy for the rotor inertia and damping coefficient of virtual synchronous generators. Electr. Power Autom. Equip. 39 (3), 125–131. doi:10.16081/j.issn.1006-6047.2019.03.020
Yuan, T., Guo, J., Yang, Z., and Jinjun, W. (2024). Capacity optimization of electric-hydrogen hybrid energy storage for mitigating wind power fluctuations. J. Chin. Electr. Eng. 44 (04), 1397–1406. doi:10.13334/j.0258-8013.pcsee.222572
Zhang, B., Zhang, X., Jia, J., Yamin, Z., and Xiangwu, Y. (2019a). Configuration method for VSG energy storage units based on inertial support and primary frequency regulation requirements. Automation Electr. Power Syst. 43 (23), 202–209.
Zhang, X., Lingfei, L., and Zixuan, B. (2019b). Virtual rotational inertia control technology based on mixed static energy. Electr. Power Autom. Equip. 39 (11), 50–56. doi:10.16081/j.epae.201911003
Zhao, E. S., Han, Y., Zhou, S. Y., Xiangyu, L., and Ping, Y. (2022). Review and prospects of microgrid inertia and damping simulation technology. Chin. J. Electr. Eng. 42 (04), 1413–1428. doi:10.13334/j.0258-8013.pcsee.210543
Keywords: photovoltaics, primary frequency regulation, batteries, supercapacitor, inertia control, voltage deviation control, virtual synchronousgenerator, improved particle swarm optimization (PSO) algorithm
Citation: Yang P, Wang L, Zhang R, Su C and Cheng Z (2025) Integrated coordinated control and optimization of photovoltaic hybrid energy storage for primary frequency regulation. Front. Energy Res. 13:1693093. doi: 10.3389/fenrg.2025.1693093
Received: 26 August 2025; Accepted: 18 September 2025;
Published: 16 October 2025.
Edited by:
Zhijian Hu, Laboratoire d’analyse et d’architecture Des Systèmes (LAAS), FranceReviewed by:
Junyi Zhai, China University of Petroleum, Beijing, ChinaBo Zhang, North China Electric Power University, China
Copyright © 2025 Yang, Wang, Zhang, Su and Cheng. This is an open-access article distributed under the terms of the Creative Commons Attribution License (CC BY). The use, distribution or reproduction in other forums is permitted, provided the original author(s) and the copyright owner(s) are credited and that the original publication in this journal is cited, in accordance with accepted academic practice. No use, distribution or reproduction is permitted which does not comply with these terms.
*Correspondence: Peng Yang, MTg3MDQ0OTkyMzlAMTYzLmNvbQ==