 Sri Mumpuni Ngesti Rahaju1 Handi2
 Ibham Veza2,3*
 Irianto4Mohd Farid Muhamad Said5,6*Muhammad Faizullizam Roslan5,6
- 1Department of Electrical Engineering, Faculty of Engineering, Universitas Bung Karno, Jakarta, Indonesia
- 2Department of Mechanical Engineering, Faculty of Engineering, Universitas Bung Karno, Jakarta, Indonesia
- 3Centre for Renewable Energy System Modeling and Policy Innovation, Aras Energy Consulting, Jakarta, Indonesia
- 4Department General Education, Faculty of Resilience, Rabdan Academy, Abu Dhabi, United Arab Emirates
- 5Institute for Sustainable Transport, Universiti Teknologi Malaysia, Johor Bahru, Malaysia
- 6Faculty of Mechanical Engineering, Universiti Teknologi Malaysia, Johor Bahru, Malaysia
Acetone–Butanol–Ethanol (ABE) fuels and Artificial Neural Network (ANN) models have gained increasing attention. ABE–diesel blends are now being studied using ANN models. The application of ANN enables accurate prediction of diesel engine performance and emissions behavior fueled with ABE-diesel blends, showing the potential of ABE-based fuels for efficient and cleaner combustion with ANN. However, the dependence of traditional diesel fuels on fossil-derived sources continues to contribute significantly to particulate matter (PM) and nitrogen oxides (NOx) emissions. This challenge has motivated the use of bio-derived oxygenated fuels as practical drop-in solutions. Among these, ABE stands out as a promising candidate because of its favorable miscibility with diesel, established fermentation pathways, and inherent oxygen content that promotes cleaner and more efficient combustion. Yet, evidence regarding in-cylinder behavior and emission trade-offs at low blend ratios remains fragmented. This study experimentally investigates ABE–diesel blends at 5% (ABE5) and 10% (ABE10) by volume in a single-cylinder diesel engine operating at 1,200 rpm under five staged load conditions. In-cylinder pressure data and regulated emissions were measured to evaluate performance, combustion, and emission responses. These datasets were then used to train Cascade ANN and Elman ANN to predict brake specific fuel consumption (BSFC), brake thermal efficiency (BTE), and emissions (CO, CO2, NOx, HC) from several inputs. The results demonstrate that ABE5 consistently improved efficiency at light-to-medium loads, achieving up to 14.5% reduction in BSFC at 1 Nm and 17.5% increase in BTE compared to diesel. At higher loads (5 Nm), ABE5 converged with diesel, showing only a marginal penalty of −2.8% in BTE. In contrast, ABE10 showed mixed outcomes, with occasional gains at moderate loads but efficiency penalties at high loads (BSFC +6.5% vs. diesel at 5 Nm). Emission analysis revealed that ABE5 reduced CO by up to 48%, CO2 by 37% at low load and ∼16% at full load, NOx by up to 32% at full load, and HC by up to 22%, while ABE10 tended to increase HC at low-to-medium loads. ANN predictions achieved good accuracy, with correlation coefficients above 0.93 for all outputs. The Elman ANN captured nonlinear performance-emission dynamics effectively, while the Cascade ANN model provided slightly higher precision for efficiency metrics. Error metrics remained consistently low, with mean absolute percentage error below 1%. Overall, this study shows that low-level ABE blending (5%) offers a practical pathway to reduce fossil diesel consumption while improving efficiency and mitigating emissions.
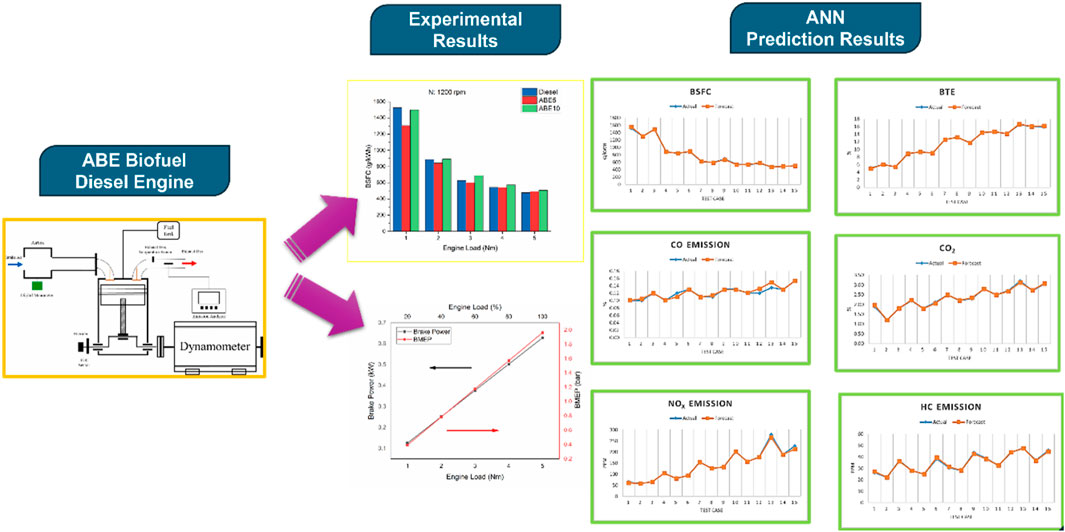
GRAPHICAL ABSTRACT |
Highlights
• Demonstrated up to 14.5% BSFC reduction and 17.5% BTE improvement with ABE5.
• Showed ABE5 reduced CO (48%), CO2 (37%), NOx (32%), and HC (22%) at engine loads.
• Identified ABE10 caused mixed efficiency gains and emission penalties at high load.
• Developed Cascade ANN and Elman ANN for ABE-diesel blends in diesel engine.
• Established reproducible framework linking ABE experiments to predictive ANN modeling.
1 Introduction: ABE as a promising biofuel and artificial intelligence
Diesel engines continue to play a pivotal role in transportation, agriculture, and stationary power generation because of their durability, high efficiency, and adaptability (Elkelawy et al., 2025). However, their extensive reliance on fossil-derived fuels has made them a major contributor to greenhouse gas (GHG) emissions, particulate matter (PM), and nitrogen oxides (NOx) (Oberschelp et al., 2023). These pollutants not only exacerbate climate change but also pose significant challenges for air quality and public health. With global commitments to net-zero emissions intensifying, there is a pressing need for near-term decarbonization strategies that can reduce the environmental footprint of compression ignition (CI) engines while preserving their cost-effectiveness and operational reliability (Setiawan and Setiyo, 2022; Setiyo, 2022; Yuvenda et al., 2022).
One of the most accessible approaches to lowering the carbon intensity of diesel engines is the introduction of bio-derived oxygenated fuels through co-firing or blending (Masi, 2021; Rahayu et al., 2022). Oxygenated fuels provide additional in-cylinder oxygen that improves premixing quality and mitigates soot precursor formation (Shao et al., 2024). They have the potential to reduce PM, carbon monoxide (CO), and unburned hydrocarbons (HC), while at the same time influencing ignition delay and heat release characteristics (Tripathi and Krishnasamy, 2024; Abdullah et al., 2021). Among the different oxygenated options, Acetone–Butanol–Ethanol (ABE) blends have gained particular attention (Rahaju et al., 2022; Aguado-Deblas et al., 2022; Kumar et al., 2023). ABE is produced via well-established fermentation processes and offers several attractive features: good miscibility with diesel, moderate energy density, and favorable oxygen content (Voß, 2024). These attributes enable ABE to act as a cleaner additive while maintaining acceptable ignition quality when blended at modest fractions. Recent advances in separation and purification technologies, such as integrated fermentation–distillation systems, have further improved the production outlook of ABE, reducing energy intensity and enhancing cost-competitiveness, thereby supporting the feasibility of large-scale deployment (Shanmugam et al., 2023).
On the engine side, prior studies have shown that oxygenated fuel blends can substantially alter combustion behavior (Fayad et al., 2022; Atelge et al., 2023; Xiao et al., 2022). Specifically, they can extend ignition delay, restructure the heat release profile, and reduce smoke emissions. The impact on NOx, however, is often more nuanced (Pirouzfar et al., 2024; Vellaiyan, 2025; Jacob and Ashok, 2022; Mao et al., 2024; Ds et al., 2025), depending on local in-cylinder temperature history, dilution levels, and blend ratio. While multiple investigations have reported promising reductions in particulate and gaseous emissions with ABE–diesel blends (Aguado-Deblas et al., 2022; Han et al., 2021; Hespel et al., 2023; Veza et al., 2019), the majority of these works focus on high or intermediate blend levels, controlled ignition modes, or single operational conditions. Comprehensive insights into low-fraction ABE blends (≤10%) under constant speed with staged load conditions remain sparse. This regime is of high practical importance, particularly for generator sets and urban duty cycles, where engines typically operate at near-constant speeds but varying loads.
In parallel with experimental studies, artificial intelligence and machine learning approaches have gained momentum in engine modeling (Shateri et al., 2024; Bhattacharya and Majumdar, 2024; Ineza Havugimana et al., 2023). Artificial neural networks (ANNs) have emerged as robust surrogates capable of capturing nonlinear and multidimensional interactions in combustion and emission processes from relatively small but high-quality datasets (Wilk-Jakubowski et al., 2025; Üstün, 2025; Li et al., 2021; Fu et al., 2022). They have been successfully applied to both steady-state and transient conditions, often outperforming empirical correlations. In particular, the Cascade forward neural network provides efficient direct input–output mapping (Gündoğdu and Elbir, 2021; Thakkar and Chaoui, 2022; Rahaju et al., 2023), while the Elman recurrent neural network is well suited to capture temporal and sequence-dependent combustion dynamics. When applied to biofuel datasets, these architectures can offer complementary predictive strengths, enabling both accurate forecasting and deeper mechanistic understanding.
Despite these advances, there remains a clear research gap. Existing studies have not systematically combined experimental analysis of low-level ABE–diesel blends with predictive modeling frameworks capable of generalization across multiple operating points. The lack of generalized predictive tools limits the scalability of current findings and hinders the development of optimization strategies for practical adoption.
For that reason, the present study aims to close these gaps by integrating experimental evaluation with machine learning prediction. A single-cylinder diesel research engine operating at 1,200 rpm under systematically varied load conditions was employed to investigate diesel, ABE5, and ABE10 blends. High-resolution in-cylinder pressure traces and detailed exhaust emission measurements formed the empirical foundation, which was subsequently used to train and validate Cascade and Elman neural networks under a transparent and reproducible workflow. This dual approach not only quantifies the impact of ABE addition on engine performance, combustion, and emissions, but also establishes robust predictive models with low error margins.
By explicitly coupling experimental analysis with advanced machine learning architectures, this work contributes both practical insights for the near-term adoption of ABE–diesel blends and methodological advances for predictive biofuel research. The outcomes are expected to guide stakeholders in energy, transportation, and policy sectors by offering empirical validation, predictive capability, and a reproducible framework that links fuel properties to real-world engine outcomes.
2 Novelty of study: contribution of machine learning as prediction tools to predict ABE-diesel engine performance, combustion and emission
The novelty of this study can be summarized in two main contributions. First, it delivers a focused investigation of low-ratio ABE–diesel blends at 5% and 10% under fixed-speed operation with load variation, addressing an under-reported regime that is particularly relevant for generator sets and urban duty cycles. Second, it introduces a dual-model strategy that combines Cascade forward networks, which excel in direct input–output mapping, with Elman recurrent networks, which capture sequence-dependent combustion dynamics. This complementary use of neural architectures strengthens predictive accuracy and provides deeper insights into the nonlinear behavior of ABE–diesel blends. Figure 1 illustrates the contribution of the study.
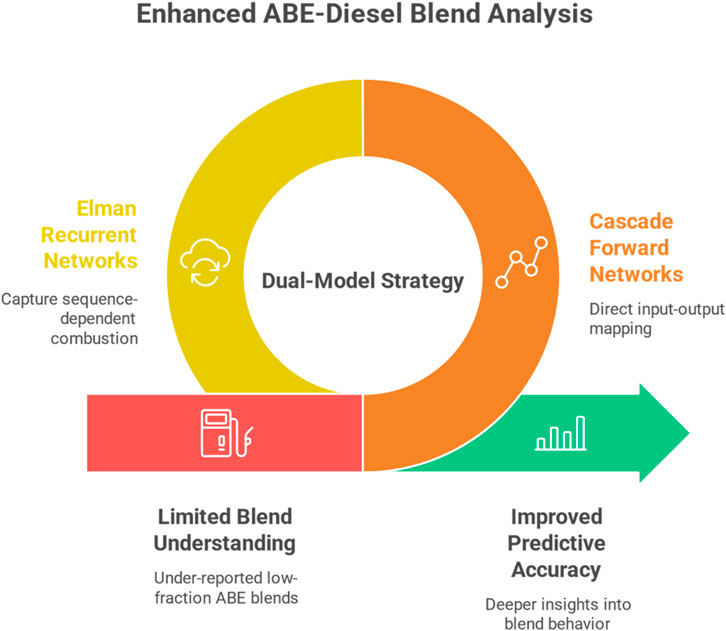
Figure 1. Novelty and contribution of the present study (ABE-diesel blends with ANN).
3 Methodology: diesel engine and ANN set-up
3.1 Engine set-up for diesel engine fueled with ABE-diesel blends
The experiments were carried out on a single-cylinder diesel engine, with its specifications summarized in Figure 2. The schematic arrangement illustrated in Figure 3. An eddy-current brake dynamometer was employed to vary and control the applied engine load, while the intake air flow rate was measured through an airbox. Fuel consumption was determined using a calibrated glass burette. Three different fuels were prepared and tested (one pure diesel and two ABE–diesel blend ratios i.e., ABE5 and ABE10). Here, ABE10 refers to a mixture of 10% ABE with 90% diesel fuel. The engine speed was maintained constant at 1,200 rpm, whereas the applied load was varied to cover a broad range of operating conditions. Emission measurements, including CO, CO2, NOx, and HC were recorded using a gas analyzer.
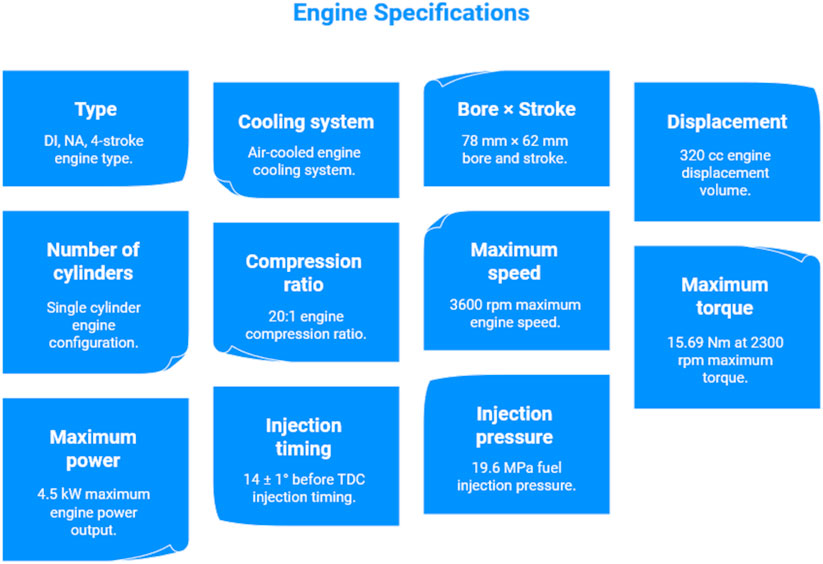
Figure 2. Engine specifications for ABE-diesel blends.
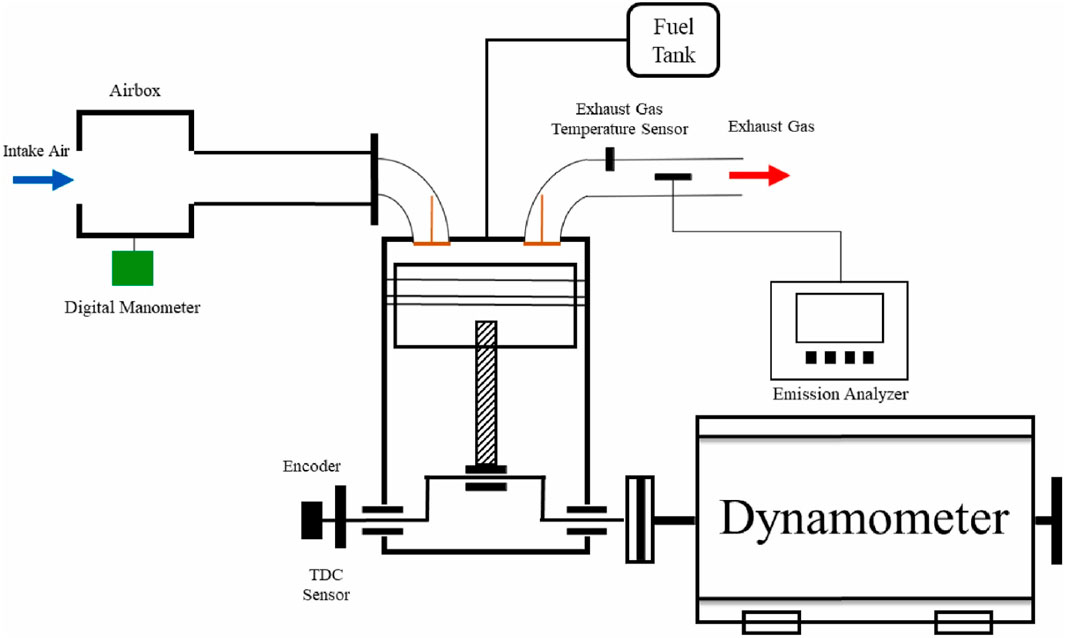
Figure 3. Experimental setup of the diesel engine test rig for ABE-diesel blends.
Figure 3 illustrates the experimental configuration employed for evaluating ABE–diesel blends in a compression ignition engine. The intake air enters through an airbox equipped with a digital manometer to measure pressure. Fuel from the fuel tank is injected into the cylinder, and combustion gases are released through the exhaust line, where an exhaust gas temperature sensor and an emission analyzer record CO, CO2, NOx, and HC. The engine shaft is connected to an eddy-current brake dynamometer that controls load and torque. A TDC sensor and encoder are installed to synchronize combustion measurements. This arrangement allowed systematic variation of engine load at a fixed speed of 1,200 rpm while monitoring performance, combustion, and emission characteristics.
3.2 ANN set-up for diesel engine fueled with ABE-diesel blends
The total dataset was divided into 70% for training, 15% for validation, and 15% for testing to ensure independent model assessment. The developed neural network comprises three layers: an input layer, a hidden layer, and an output layer. The input layer consists of ten variables representing fuel properties, blending ratio and engine operating conditions. The fuel properties of diesel and ABE blends (5% and 10% by volume) are summarized in Table 1. The reported cetane index represents an estimated value based on empirical correlation, not a direct experimental measurement. The calculation was performed following the ASTM D976 method.
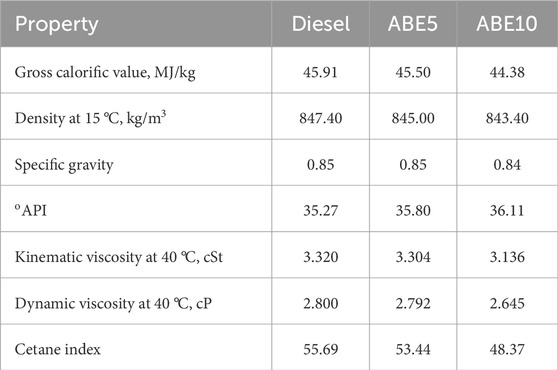
Table 1. Fuel properties of diesel and ABE blends (5% and 10% by volume) (Veza et al., 2021a; Veza et al., 2024).
Diesel shows the highest gross calorific value (45.91 MJ/kg), while ABE5 and ABE10 show slightly reduced values of 45.50 MJ/kg and 44.38 MJ/kg, respectively, indicating that the energy content decreases as the proportion of ABE increases. The densities of the fuels follow a similar trend, with diesel at 847.40 kg/m3 and ABE blends showing slightly lower values (845.00 kg/m3 for ABE5 and 843.40 kg/m3 for ABE10). Specific gravity values remained nearly constant (0.84–0.85), consistent with the small density variation. The API increased slightly with higher ABE content (35.27 for diesel vs. 36.11 for ABE10), reflecting the lower density of the blends.
Viscosity analysis shows that both kinematic and dynamic viscosities decrease with ABE addition. Diesel has a kinematic viscosity of 3.32 cSt and a dynamic viscosity of 2.80 cP, while ABE10 records the lowest values (3.14 cSt and 2.65 cP). This reduction enhances fuel atomization during injection but may also affect lubrication. The cetane index, an indicator of ignition quality, decreases significantly with ABE addition, from 55.69 for diesel to 53.44 for ABE5 and 48.37 for ABE10. The lower cetane index of ABE blends may lead to longer ignition delays and altered combustion phasing, which can influence engine performance and emissions.
Overall, the addition of ABE reduces fuel energy content, density, viscosity, and cetane index while slightly increasing oAPI. These changes suggest that while ABE blends can improve fuel atomization and contribute oxygen for cleaner combustion, they may also affect ignition quality and engine power output. Detailed results on ABE physico-chemical properties can be found in (Veza et al., 2021a; Veza et al., 2024).
3.2.1 Cascade ANN
The Cascade ANN architecture consists of three layers: an input layer, a hidden layer, and an output layer. The input layer receives ten variables that represent the experimental parameters. These inputs are processed through a hidden layer containing ten neurons, where each neuron computes a weighted sum of the inputs (W), adds a bias term (b), and passes the result through an activation function (f) (Figure 4). The hidden layer output is then connected to the output layer, which contains a single neuron. The output neuron applies another weighted summation and activation process to generate the final prediction. Feedback connections are also incorporated to improve the learning process. This configuration enables the network to capture nonlinear relationships between input parameters and the output response.
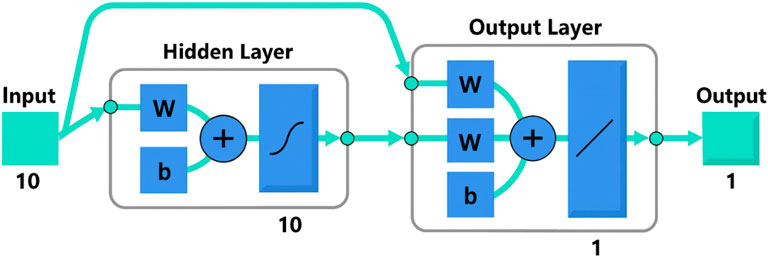
Figure 4. Architecture of the Cascade ANN model used for ABE-diesel blends prediction.
3.2.2 Elman neural networks
In Elman neural networks, the inputs are processed in the hidden layer containing 10 neurons, where each neuron performs a weighted summation of the inputs (W), adds a bias term (b), and applies a nonlinear activation function (Figure 5). The hidden layer also incorporates bias nodes (labeled 0 and 1) to improve flexibility in model fitting. The processed signals are then passed to the output layer, which contains a single neuron that generates the final predicted value. Feedback connections are integrated within the structure to enhance learning efficiency and stability. This architecture enables accurate mapping of nonlinear relationships between experimental parameters and the output response.
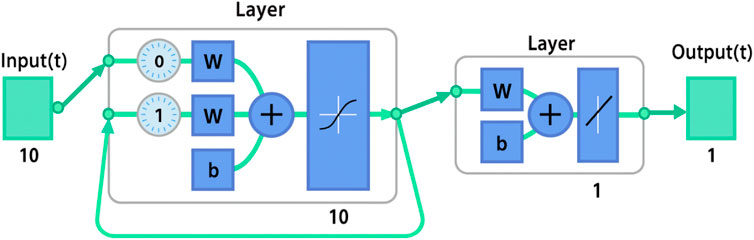
Figure 5. Structure of the Elman ANN network applied for ABE-diesel blends prediction.
3.2.3 Performance accuracy
The prediction accuracy of the models was assessed using six statistical indicators: Correlation Coefficient (R), Coefficient of Determination (R2), Mean Absolute Deviation (MAD), Mean Squared Error (MSE), Root Mean Squared Error (RMSE), and Mean Absolute Percentage Error (MAPE). Each of these indicators provides a different perspective on model performance.
A high value of R and an R2 close to 1 signify a strong agreement between predicted and experimental values, with 1 representing a perfect match. Conversely, lower values of MAD, MSE, RMSE, and MAPE reflect higher predictive accuracy. Although achieving exact zeros in error-based metrics is practically impossible, models that yield values approaching zero, while simultaneously maintaining high R and R2 values, are regarded as more reliable and accurate.
The Correlation Coefficient (R) measures the strength and direction of the linear relationship between predicted values (Mi) and actual values (Pi). The Coefficient of Determination (R2) quantifies the proportion of variance in the actual data explained by the model. The MAD represents the mean of the absolute differences between predictions and observations, while the MSE calculates the average of squared differences. RMSE, being the square root of MSE, expresses the error in the same units as the original data, making it more interpretable. Finally, MAPE provides the error in percentage terms, obtained by dividing the absolute difference between predictions and observations by the actual value and multiplying by 100. Together, these metrics deliver valuable insights into the accuracy, consistency, and robustness of the models, enabling a comprehensive evaluation of their predictive capability. Detailed equation to determine the performance matrix can be found in (Veza et al., 2021b).
4 Results and discussion: diesel engine performance, combustion and emission characteristics
4.1 Experimental results of ABE-diesel blends
4.1.1 Performance characteristics of ABE-diesel blends
4.1.1.1 Brake specific fuel consumption (BSFC): fuel economy performance of ABE-diesel blends
Figure 6 presents the Brake Specific Fuel Consumption or BSFC of diesel, ABE5, and ABE10 across engine loads from 1 to 5 Nm. BSFC quantifies the fuel required to generate a unit of brake power, serving as a direct metric of engine efficiency (Wang et al., 2021). BSFC is defined as the mass of fuel consumed per unit of brake power output, where a lower BSFC value indicates higher thermal efficiency. The results show a clear decreasing trend in BSFC with increasing load for all fuels. At 1 Nm, diesel recorded 1525.37 g/kWh, while ABE5 and ABE10 were lower at 1304.78 g/kWh (−14.5%) and 1498.51 g/kWh (−1.8%) respectively. At 2 Nm, ABE5 and ABE10 maintained lower BSFC values than diesel, with reductions of 4.8% and −1.1% respectively. At 3 Nm, ABE5 again reduced BSFC by 4.1% compared to diesel, while ABE10 was slightly higher (+10.3%). At 4 Nm, ABE5 was nearly identical to diesel (−0.8%), while ABE10 increased BSFC by 5.6%. At the highest load (5 Nm), both ABE5 and ABE10 showed higher BSFC than diesel, with increases of 3.4% and 6.5% respectively. Overall, ABE5 consistently delivered lower or comparable BSFC to diesel at low-to-medium loads, whereas ABE10 showed efficiency penalties at medium-to-high loads.
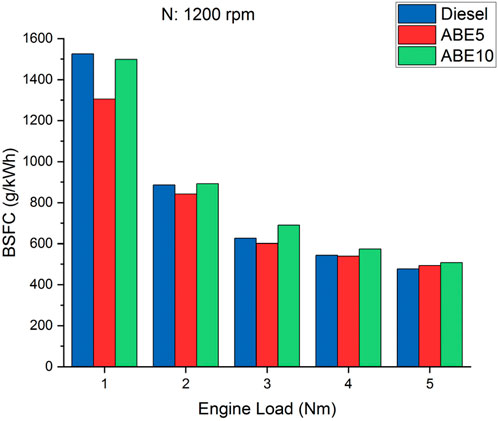
Figure 6. BSFC versus load for diesel, ABE5, and ABE10.
The results suggests that ABE5 is a promising candidate for partial diesel substitution, offering up to 15% BSFC improvement at light load and stable efficiency at medium loads. However, ABE10 presents challenges due to higher BSFC at high loads, implying that its lower heating value outweighs the combustion benefits. For industrial adoption, this means that low-level ABE blends (≤5%) are feasible without compromising efficiency, especially under conditions where engines operate at light-to-medium loads.
4.1.1.2 Brake thermal efficiency (BTE): combustion efficiency of ABE-diesel blends
Figure 7 presents the Brake Thermal Efficiency or BTE of diesel, ABE5, and ABE10 blends at engine loads from 1 to 5 Nm. BTE reflects the proportion of chemical energy in the fuel converted into useful brake power (Sanjeevannavar et al., 2022), where higher values signify superior combustion efficiency and fuel utilization. BTE is defined as the ratio of brake power to the energy input from fuel, strongly influenced by fuel heating value, combustion characteristics, and oxygen content. The results reveal a steady increase in BTE with rising load for all tested fuels. At 1 Nm, diesel achieved 5.16%, while ABE5 and ABE10 recorded 6.06% (+17.5%) and 5.41% (+4.9%), respectively, highlighting efficiency benefits from ABE oxygenation at light load. At 2 Nm, ABE5 and ABE10 both surpassed diesel, showing 9.39% (+5.7%) and 9.09% (+2.3%) improvements. At 3 Nm, ABE5 again outperformed diesel at 13.18% versus 12.58% (+4.8%), whereas ABE10 lagged slightly at 11.76% (−6.5%). At 4 Nm, ABE5 marginally exceeded diesel with 14.67% vs. 14.47% (+1.4%), while ABE10 trailed slightly at 14.13% (−2.3%). At the highest load (5 Nm), diesel led with 16.50%, while ABE5 (16.04%) and ABE10 (15.98%) were marginally lower by −2.8% and −3.2%. Overall, ABE5 consistently enhanced BTE at light-to-medium loads (up to +17.5%), while both ABE blends converged with diesel at higher loads, suggesting a diminishing advantage as the calorific value deficit became more dominant.
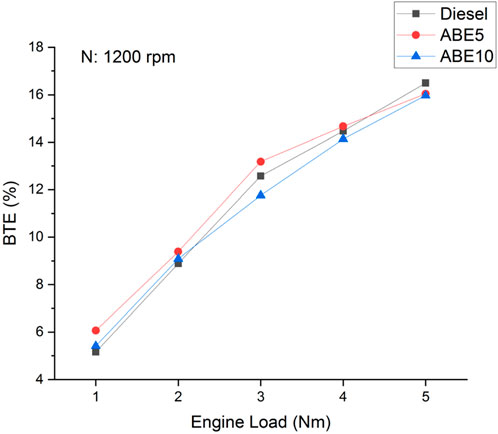
Figure 7. BTE versus load for diesel, ABE5, and ABE10.
These outcomes highlight the potential of ABE as a partial diesel substitute. ABE5, in particular, enhances thermal efficiency at practical engine loads without major efficiency penalties at high loads. This demonstrates its feasibility as a low-level blend biofuel capable of improving engine efficiency under urban driving cycles and light-load operations. Although ABE10 shows slight reductions at higher loads, its near-equivalent efficiency suggests technical viability with minor optimization. For industrial application, these results imply that ABE5 can be integrated into existing diesel infrastructure with measurable efficiency gains. It is important to note that the improvement at low load may come from cleaner combustion and reduced heat losses, not necessarily from higher peak pressure.
4.1.1.3 Brake power and brake mean effective pressure: engine load response (BP and BMEP) of ABE-diesel blends
Figure 8 shows the variation of brake power (BP) and brake mean effective pressure (BMEP) across engine loads from 1 to 5 Nm. Brake power represents the actual output power delivered by the engine shaft, while BMEP is a normalized measure of engine load, independent of displacement, that reflects the mean pressure acting on the piston to generate brake work (Bhatt, 2025). Brake power is proportional to the product of torque and rotational speed, whereas BMEP provides a load-based performance metric that facilitates comparison between fuels and engines of different sizes. As expected, both BP and BMEP increased proportionally with engine load. BP rose from 0.1268 kW at 1 Nm to 0.6284 kW at 5 Nm, marking a fivefold increase (+400%), while BMEP increased from 0.3928 bar to 1.9638 bar (+400%). This linear progression reflects the direct correlation between torque and effective mean pressure within the cylinder. The results validate the reliability of the test engine setup and confirm that load increments translate consistently into higher shaft power and mean pressure, forming the baseline for evaluating BSFC and BTE trends under different fuel conditions. These values show the mechanical responsiveness of the test engine and provide essential reference points for interpreting subsequent combustion and efficiency parameters.
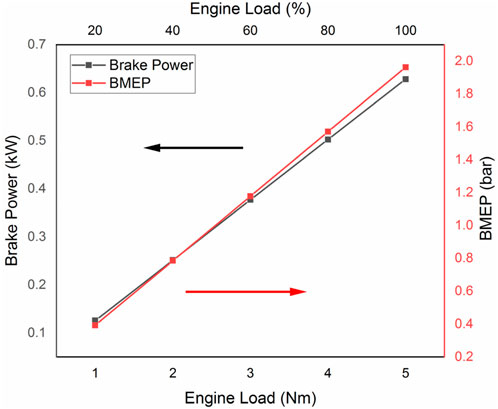
Figure 8. Brake power and BMEP versus load.
4.1.2 Combustion characteristics of ABE-diesel blends
4.1.2.1 Indicated mean effective pressure (IMEP): cylinder pressure-based performance of ABE-diesel blends
Figure 9 illustrates the variation of Indicated Mean Effective Pressure (IMEP) with engine load for diesel, ABE5, and ABE10 fuels. IMEP is a key thermodynamic parameter that quantifies the average pressure acting on the piston during the power stroke, directly reflecting the engine’s capacity to produce work per cycle (Greencorn et al., 2022). As engine load increased from 1 to 5 Nm, IMEP rose steadily across all fuels, highlighting the expected proportional relationship between torque demand and in-cylinder pressure development. Diesel recorded the highest IMEP values, increasing from 1.22 bar at 1 Nm to 2.82 bar at 5 Nm, while ABE5 showed the lowest increase (0.31–1.53 bar), and ABE10 maintained intermediate performance (1.27–2.00 bar). The lower IMEP of ABE5 (73%–80% lower than diesel across loads) and ABE10 (20%–30% lower than diesel) indicates reduced energy release efficiency, attributed to the oxygenated nature of ABE blends which lowers heating value. However, the smoother rise in IMEP for ABE10 compared to ABE5 suggests better combustion stability when a higher fraction of ABE is used. Please note that IMEP differences could arise from varying combustion characteristics and oxygen content of ABE blends rather than simple mechanical work differences. These findings imply that while ABE blends reduce absolute pressure output, they may contribute to more controlled combustion, potentially reducing emissions at partial loads.
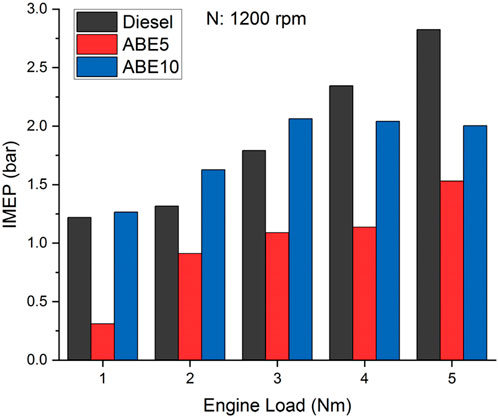
Figure 9. Variation of IMEP with engine load for diesel and ABE blends (ABE5 and ABE10).
4.1.2.2 Coefficient of variation of mean effective pressure (IMEP): combustion stability of ABE-diesel blends
Figure 10 presents the coefficient of variation of indicated mean effective pressure (COVIMEP) as a function of engine load at 1,200 rpm for diesel and ABE blends. The COVIMEP, a key indicator of combustion cyclic stability (Batool et al., 2021), should remain below 10% for smooth engine operation. At low load (1 Nm), ABE5 exhibits a unstable combustion with COVIMEP of 47.3%, nearly 4.5 times higher than diesel (10.6%) and 3.5 times higher than ABE10 (10.5%), indicating severe cycle-to-cycle fluctuations due to poor ignition quality under lean conditions. As load increases, COVIMEP for ABE5 decreases substantially to 15.9% at 5 Nm, a 66% reduction compared to its value at 1 Nm, although still higher than diesel (6.3%). In contrast, ABE10 maintains relatively stable operation between 1 and 4 Nm (6.9%–10.5%) but shows a sharp increase to 64.4% at 5 Nm.
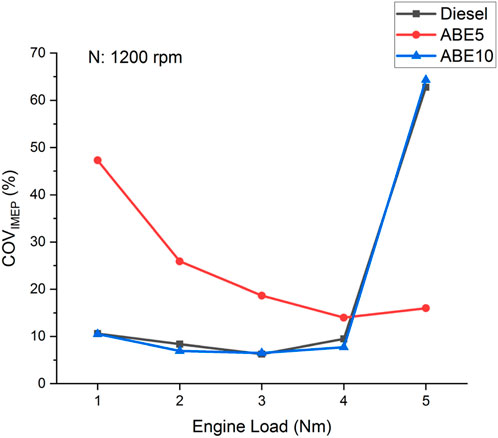
Figure 10. COVIMEP with engine load at 1,200 rpm for diesel and ABE blends.
This abrupt instability at high load can be explained by the combined effects of evaporation of the more volatile acetone and ethanol components, uneven mixture distribution, and the lower cetane index of ABE10, which extends ignition delay and intensifies pressure oscillation once combustion starts. Furthermore, the limitation of the single-cylinder engine and its conventional injection system used in this study may have contributed to this behavior. The test setup lacks advanced control over injection pressure and atomization quality, which are crucial for maintaining consistent fuel–air mixing at elevated loads. As a result, localized over-rich zones and delayed ignition events could have magnified the cyclic variation of in-cylinder pressure. Overall, while diesel maintains superior stability, ABE5 shows improving stability with increasing load but remains less favorable, and ABE10 demonstrates good stability at moderate loads before deteriorating under maximum load due to both fuel property effects and equipment constraints.
4.1.3 Emission characteristics of ABE-diesel blends
4.1.3.1 Carbon monoxide (CO) emissions: combustion incompleteness of ABE-diesel blends
Figure 11 shows the variation of carbon monoxide (CO) emissions for diesel, ABE5, and ABE10 at 1,200 rpm across engine loads from 1 to 5 Nm. CO emissions are an indicator of incomplete combustion and typically decline when oxygenated fuels are introduced, since the inherent oxygen content promotes more complete oxidation of the fuel-air mixture (Thiagarajan et al., 2025). At low loads (1–2 Nm), all fuels produced nearly similar CO levels. Diesel and ABE5 recorded 0.10%, while ABE10 was slightly higher at 0.12%–0.13%. At medium load (3 Nm), CO emissions rose slightly, with diesel at 0.11%, ABE5 at 0.12%, and ABE10 at 0.13%. A clearer distinction emerged at higher loads. At 4 Nm, diesel produced 0.13%, while both ABE5 and ABE10 registered lower values at 0.12%, reflecting about an 8% reduction. At full load (5 Nm), diesel and ABE10 recorded the highest emission at 0.15%, compared to 0.13% for ABE5. Notably, ABE5 consistently maintained lower emissions than diesel across loads, while ABE10 showed mixed performance: slightly higher at light loads but aligning more closely to diesel at full load. Overall, the results show that blending ABE improves combustion efficiency, especially at higher engine loads. The reduction achieved by ABE5 highlights its strong potential as a diesel additive to curb CO emissions. Although ABE10 exhibited marginal increases at light loads, the presence of oxygenated components still contributed to comparable or reduced emissions at higher loads. These findings suggest that moderate ABE blending (5%) is optimal for minimizing CO emissions without compromising engine operation.
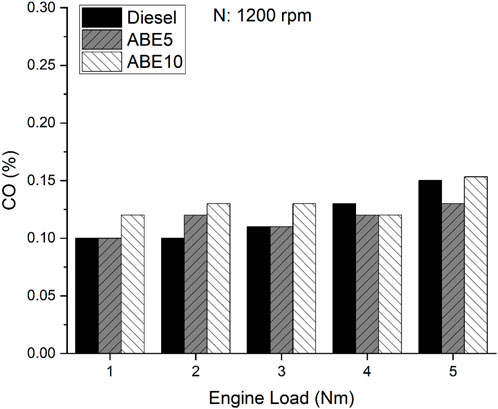
Figure 11. CO emissions versus load for diesel and ABE5.
4.1.3.2 Carbon dioxide (CO2) emissions: greenhouse gas indicator of ABE-diesel blends
Figure 12 shows CO2 emissions versus engine load for diesel, ABE5, and ABE10. CO2 is the final product of complete combustion (Ditl and Šulc, 2024), with higher concentrations generally reflecting more efficient oxidation of carbon in the fuel. CO2 formation is directly proportional to the degree of combustion completeness, influenced by oxygen availability, fuel carbon content, and combustion temperature. CO2 emissions increased with load for all fuels, from 1.9% (diesel), 1.2% (ABE5), and 1.8% (ABE10) at 1 Nm to 3.2%, 2.7%, and 3.07% respectively at 5 Nm. Across all loads, ABE5 consistently showed lower CO2 than diesel, with reductions of 36.8% at 1 Nm, 18.2% at 2 Nm, and 15.6% at 5 Nm. ABE10 closely followed diesel, with small differences: −5.3% at 1 Nm, −4.0% at 2 Nm, and −4.0% at 3 Nm, but converging at high load (only −4.2% at 5 Nm). These results indicate that ABE5 reduces carbon intensity, while ABE10 maintains CO2 values close to diesel due to its higher blend ratio. The findings suggest that low-level ABE blending (5%) can reduce CO2 emissions significantly, supporting climate mitigation targets without penalizing engine efficiency. Meanwhile, ABE10’s near-equivalent CO2 levels highlight its viability as a partial diesel replacement fuel, although its carbon savings are less pronounced.
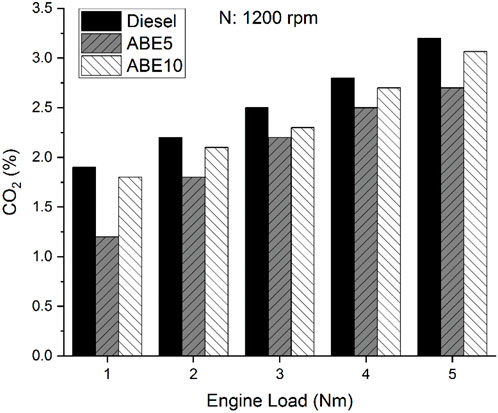
Figure 12. CO2 emissions versus load for diesel, ABE5, and ABE10.
The CO2 results indicate that ABE5 reduces carbon intensity, while ABE10 maintains values close to diesel due to its higher blend ratio. This behavior can be explained by the combined effects of fuel chemistry and combustion characteristics. ABE5 contains sufficient oxygen to promote more complete oxidation of carbon within the combustion chamber, leading to lower CO2 formation per unit of energy released. In addition, its relatively higher cetane index compared to ABE10 ensures shorter ignition delay and more efficient combustion phasing, which minimizes unburned carbon and improves overall efficiency. In contrast, ABE10, despite containing more oxygen, possesses a lower heating value and a significantly lower cetane index. These properties can cause delayed ignition and incomplete oxidation under certain load conditions, offsetting the benefit of its higher oxygen content (Veza et al., 2019). As a result, CO2 emissions from ABE10 become nearly close to diesel. This shows a balance between enhanced oxygenation and reduced combustion efficiency.
4.1.3.3 Nitrogen oxides (NOx) emissions: NOx formation characteristics of ABE-diesel blends
Figure 13 shows NOx emissions versus engine load for diesel, ABE5, and ABE10. NOx formation is strongly influenced by combustion temperature (Meng et al., 2023), oxygen availability, and in-cylinder residence time. According to the Zeldovich mechanism, NOx emissions rise with higher in-cylinder temperature and oxygen concentration, making them sensitive to both load and oxygenated fuel properties. NOx increased with load for all fuels. At 1 Nm, diesel emitted 64 ppm, while ABE5 was slightly lower at 57 ppm (−10.4%) and ABE10 slightly higher at 66 ppm (+2.6%). At 2 Nm, diesel produced 104 ppm, while ABE5 reduced it to 80 ppm (−22.5%) and ABE10 to 94 ppm (−9.3%). At 3 Nm, ABE5 achieved the largest reduction, 126 ppm vs. 154 ppm (−18.3%), while ABE10 was also lower at 132 ppm (−14.5%). At 4 Nm, diesel recorded 201 ppm, ABE5 reduced it to 156 ppm (−22.4%), and ABE10 to 177 ppm (−12%). At full load (5 Nm), diesel peaked at 279 ppm, while ABE5 and ABE10 emitted 189 ppm (−32.3%) and 227 ppm (−18.6%) respectively. These reductions confirm that ABE blends, especially ABE5, mitigate NOx formation by moderating combustion temperature and altering ignition delay. The results show that blending ABE substantially lowers NOx emissions across all loads, with up to 32% reduction at full load for ABE5. This highlights the potential of low-level ABE blends in meeting stringent NOx emission standards without compromising engine performance.
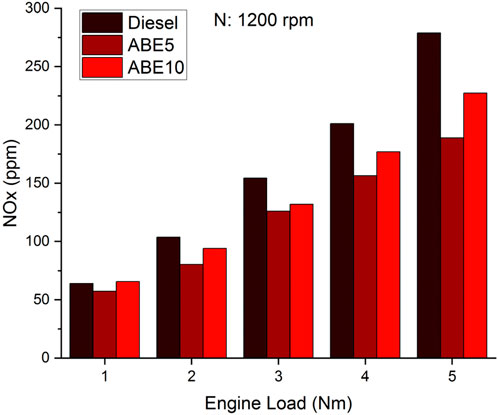
Figure 13. NOx emissions versus load for diesel, ABE5, and ABE10.
The observed reduction in NOx emissions for ABE5 and ABE10 can be explained by the combined thermophysical and combustion characteristics of ABE components. Although ABE blends contain additional oxygen, which could theoretically increase local flame temperature, their high latent heat of vaporization promotes significant charge cooling during the fuel–air mixing stage. This cooling effect, along with the lower heating value and slower combustion rate of ABE fuels, moderates the in-cylinder temperature rise and limits thermal NOx formation. Furthermore, the extended ignition delay associated with the lower cetane index of ABE blends spreads the heat release over a longer crank angle, reducing peak flame temperature while maintaining efficient oxidation. These combined effects result in lower NOx emissions. This demonstrates that oxygen enrichment alone does not always lead to higher NOx formation when accompanied by strong evaporative and thermal-dilution effects.
4.1.3.4 Hydrocarbon (HC) emissions: Unburned hydrocarbon of ABE-diesel blends
Figure 14 presents hydrocarbon (HC) emissions versus load for diesel, ABE5, and ABE10. HC is a product of incomplete combustion, typically arising from poor fuel–air mixing, quenching near chamber walls, or short combustion duration (Iodice and Cardone, 2021). HC emissions decrease with more complete combustion, and oxygenated fuels such as ABE blends can reduce HC formation by promoting oxidation of unburned hydrocarbons. HC emissions rose with engine load for all fuels. At 1 Nm, diesel emitted 26 ppm, while ABE5 was lower at 22 ppm (−16.5%), and ABE10 was higher at 37 ppm (+39%). At 3 Nm, diesel produced 31 ppm, ABE5 reduced this to 28 ppm (−9.4%), whereas ABE10 rose to 44 ppm (+42%). At 5 Nm, diesel reached 48 ppm, ABE5 reduced emissions to 37 ppm (−22.4%), while ABE10 remained close at 46 ppm (−4.2%). Overall, ABE5 consistently reduced HC across loads, with the largest reduction at full load (−22%), whereas ABE10 generally showed higher or comparable values due to incomplete combustion linked to its lower volatility and higher butanol fraction. This shows that ABE5 enhances combustion quality, reducing HC emissions across all load conditions. In contrast, ABE10 exhibited unstable combustion, with higher HC at light-to-medium loads, indicating blending ratio is critical for optimizing emissions. These results suggest that small ABE additions are more beneficial for hydrocarbon reduction than higher blends.
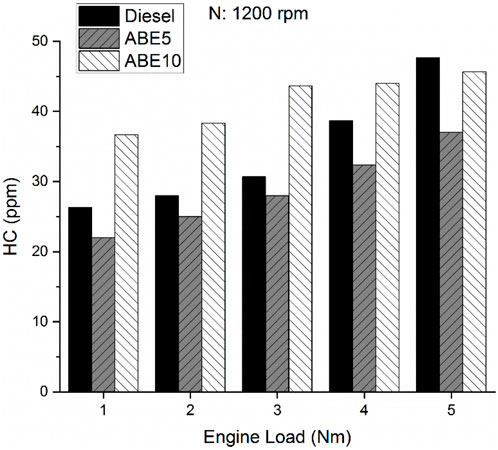
Figure 14. HC emissions versus load for diesel, ABE5, and ABE10.
4.2 ANN prediction results
4.2.1 Elman ANN
The performance metrics of the Elman ANN model for predicting engine performance and emissions are summarized in Table 2. The results demonstrate predictive capability across all parameters, with correlation coefficients (R) exceeding 0.95 for CO, HC, and other variables, and approaching unity for BSFC, BTE, CO2, and NOx. The coefficient of determination (R2) values confirm this high accuracy, particularly for BTE (0.9975), CO2 (0.9969), and NOx (0.9970). The error indicators, including MAD, MSE, RMSE, and MAPE, remain consistently low, with CO (MAD = 0.0029, MAPE = 2.51%) and CO2 (MAD = 0.0163, MAPE = 0.90%) showing especially precise predictions. Although slightly higher errors are observed for NOx and HC compared to other outputs, their performance remains within acceptable predictive limits. These results validate the application of the Elman ANN in capturing the nonlinear behavior of combustion and emissions, thus establishing it as a reliable tool for modeling engine performance with oxygenated fuels.
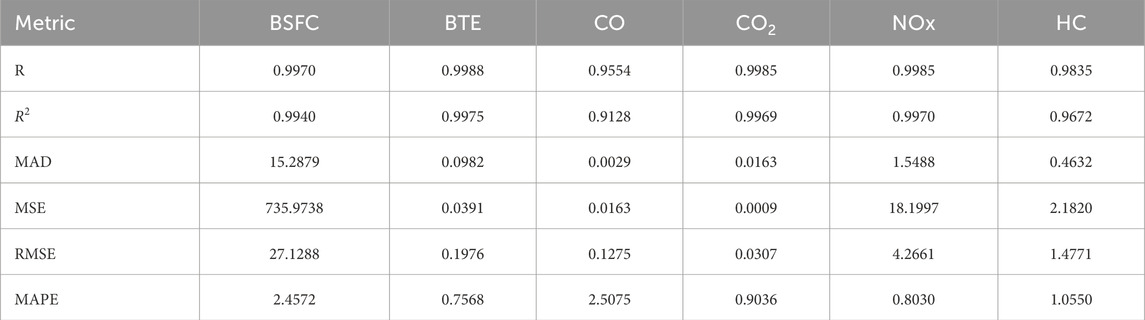
Table 2. Performance evaluation metrics of the Elman neural network for BSFC, BTE, and exhaust emissions (CO, CO2, NOx, HC).
Figure 15a presents the comparison of actual and forecast values of brake specific fuel consumption (BSFC) across 15 test cases for Elman neural networks. The results demonstrate that the forecasting model effectively tracks the overall trend of BSFC, with close agreement to experimental values. At high BSFC levels (test cases 1–3), the forecast aligns well with the actual data, showing only minor deviations (e.g., 1525.37 vs. 1525.42 g/kWh; 1498.51 vs. 1505.33 g/kWh). In the mid-range cases (4–10), the predicted values follow the decreasing pattern of actual BSFC, with negligible errors such as 885.31 vs. 885.34 g/kWh. Although some discrepancies are observed, particularly at test cases 11, 14, and 15 where the forecast slightly under- or overestimates actual values (e.g., 539.39 vs. 617.08 g/kWh), the overall predictive performance remains robust. This consistency across varying operating conditions highlights the model’s capability to capture the nonlinear variations in fuel consumption and confirms its applicability for reliable BSFC prediction in engine performance studies.
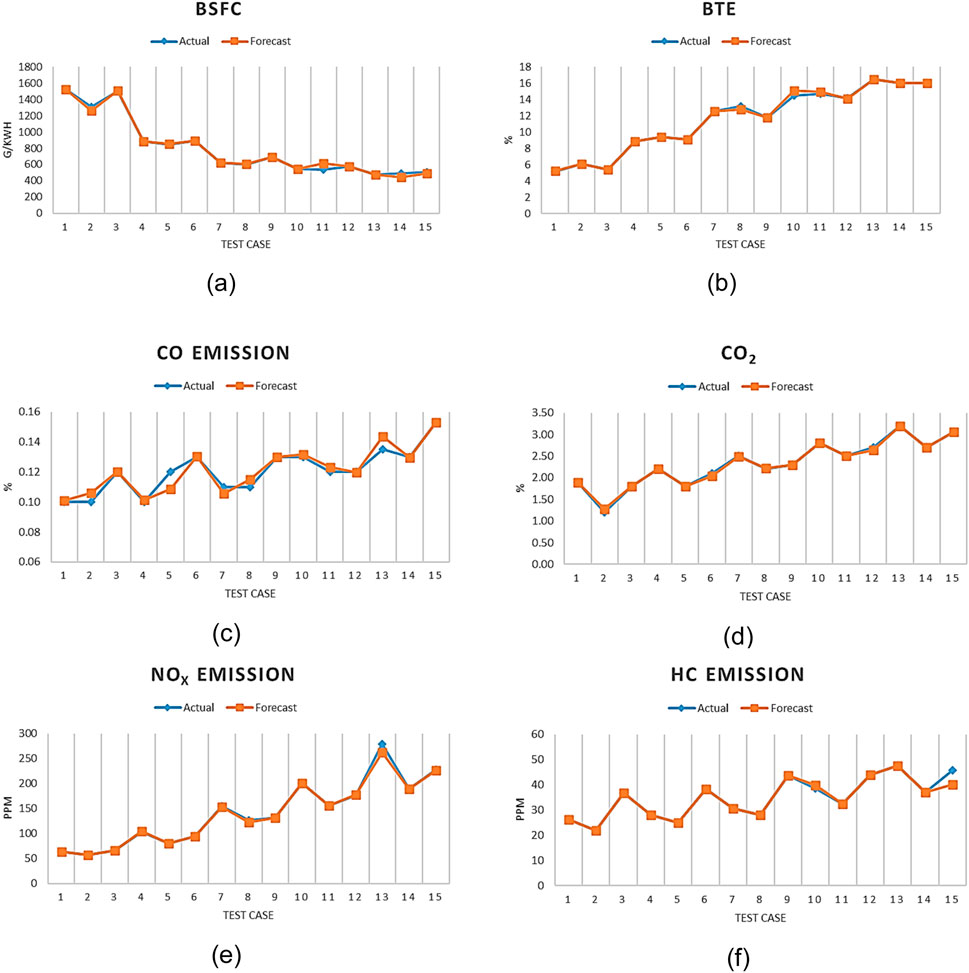
Figure 15. Comparison of actual and forecast (a) BSFC, (b) BTE, (c) CO, (d) CO2, (e) NOx and (f) HC emission across the test cases for Elman neural networks.
Figure 15b illustrates the comparison between actual and forecast brake thermal efficiency. The predicted values closely replicate the experimental data, demonstrating the model’s ability to capture both low- and high-efficiency regimes with minimal deviation. At low efficiency conditions (test cases 1–3), the forecasts (5.20%–6.06%) were nearly identical to actual values (5.16%–6.07%). As the load increased, the model successfully tracked the rising trend in BTE, with values such as 12.58% predicted versus 12.58% measured at test case 7. Minor deviations were observed at higher efficiencies, for example, at test case 10 (forecast 15.05% vs. actual 14.47%) and test case 11 (14.96% vs. 14.67%), yet the overall agreement remained strong. At peak conditions (test cases 13–15), the model aligned almost perfectly, predicting 16.49%, 16.05%, and 15.98% against actual values of 16.50%, 16.05%, and 15.98%, respectively.
Figure 15c displays the comparison of actual and forecast carbon monoxide (CO) emissions. The model successfully reproduces the observed emission trend, with both datasets following a consistent upward pattern as test cases progress. At the lower range (cases 1–3), the forecast values of 0.101%–0.120% were nearly identical to the actual values of 0.100%–0.120%. Mid-range cases also exhibited close correspondence, such as 0.130% actual versus 0.132% forecast at case 10. Minor deviations were noted in specific points, for example, at case 5 (0.120% actual vs. 0.109% forecast) and case 13 (0.135% actual vs. 0.144% forecast), but the differences remained within a small margin. At the peak condition (case 15), the model predicted 0.153% CO, exactly matching the experimental measurement. Overall, the forecast captured both the magnitude and fluctuation of CO emissions with high fidelity.
Figure 15d presents the comparison between actual and forecast carbon dioxide (CO2) emissions. The predictive model demonstrates excellent agreement with the experimental data, with both datasets showing a clear upward trend as the test case number increases. At the lower range, the differences were negligible, such as 1.90% actual versus 1.90% forecast in case 1, while a slightly larger deviation occurred at case 2 (1.20% actual vs. 1.28% forecast). Across mid-range conditions, the forecast values closely tracked the actual ones, for instance, 2.50% actual against 2.49% forecast at case 7% and 2.80% actual versus 2.81% forecast at case 10. At higher levels, the alignment remained robust, as seen at case 15 where both actual and predicted values reached 3.07%. Although small fluctuations exist, the overall predictive accuracy is very strong, confirming the model’s effectiveness in capturing CO2 emission dynamics across varying operating conditions.
Figure 15e illustrates the comparison of actual and forecast nitrogen oxides (NOx) emissions. The results reveal that the forecasting model successfully captured the progressive rise in NOx levels with increasing test cases, maintaining strong alignment with the measured data. At low-emission points, such as case 1 (64.0 ppm actual vs. 63.7 ppm forecast) and case 2 (57.3 ppm actual vs. 57.4 ppm forecast), the deviation was negligible. Mid-range predictions also followed the experimental trend closely, for example, 154.3 ppm actual compared to 153.5 ppm forecast at case 7. The most noticeable discrepancy occurred at case 13, where the forecast slightly underestimated the peak value (262.8 ppm vs. 279.0 ppm actual). Nevertheless, the general fluctuation and magnitude of NOx emissions were consistently reproduced, with cases 14 and 15 again showing excellent agreement (189.0 vs. 189.0 ppm; 227.3 vs. 227.2 ppm).
Figure 15f shows the comparison of actual and forecast hydrocarbon (HC) emissions. The model predictions demonstrated very close agreement with the experimental data, particularly in the low- and mid-range cases where the differences were practically negligible. For instance, at cases 1–5, the predicted values (21.9–36.7 ppm) were almost identical to the actual readings (22.0–36.7 ppm). The model also successfully tracked variations in the higher emission zones, such as case 9, where both actual and forecast values aligned perfectly at 43.7 ppm. Small discrepancies appeared at certain points, most notably at case 10 (39.8 ppm forecast vs. 38.7 ppm actual) and case 15 (40.1 ppm forecast vs. 45.7 ppm actual), but these remained within acceptable error margins.
4.2.2 Cascade ANN
The performance evaluation of the Cascade ANN model for predicting engine performance and emissions is shown in Table 3. The model achieved good predictive accuracy, with correlation coefficients (R) above 0.93 for all parameters, reaching as high as 0.9998 for BTE and 0.9996 for BSFC. Similarly, the coefficient of determination (R2) values confirm the strong fit, with BSFC and BTE exceeding 0.999, while slightly lower but still acceptable accuracy was observed for CO (R2 = 0.8769). Error metrics including MAD, MSE, RMSE, and MAPE further reinforce the robustness of the Cascade model, with particularly low errors for BTE (MAD = 0.0433, MAPE = 0.47%) and CO2 (MAD = 0.0226, MAPE = 0.95%). Although NOx and HC presented relatively higher RMSE values (5.22 and 0.60, respectively), their predictive accuracy remains within practical limits for combustion and emission modeling. Overall, the Cascade network demonstrates a highly reliable performance, making it a suitable approach for capturing the nonlinear dynamics of engine behavior under different fuel blends.
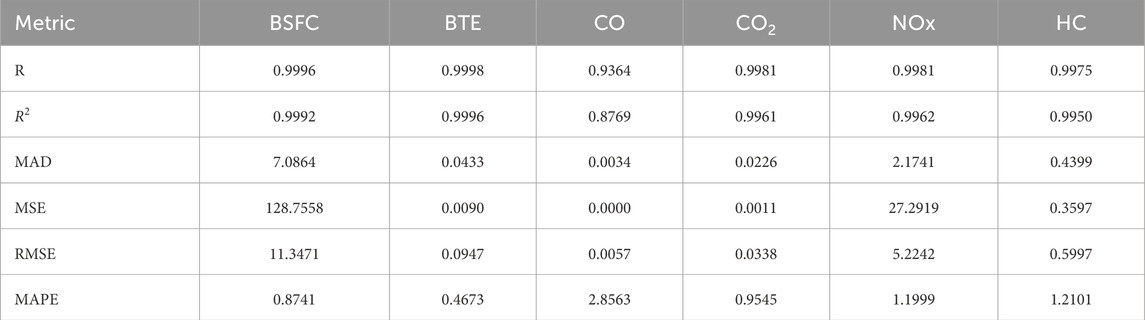
Table 3. Performance evaluation metrics of the Cascade neural network for BSFC, BTE, and exhaust emissions (CO, CO2, NOx, HC).
Figure 16a depicts the comparison of actual and forecast brake specific fuel consumption (BSFC) across 15 test cases for Cascade neural networks. The forecast model reproduced the overall decreasing trend of BSFC as the test case number increased, with values showing very close agreement to the experimental data. For example, at higher BSFC levels in test cases 1–3, the predictions were within a narrow range of the measured values (1562.2 g/kWh forecast vs. 1525.4 g/kWh actual at case 1, and 1495.1 g/kWh forecast vs. 1498.5 g/kWh actual at case 3). At mid-range operating conditions, the model continued to track the actual trend accurately, such as case 7 (628.3 g/kWh forecast vs. 625.7 g/kWh actual) and case 9 (676.8 g/kWh forecast vs. 690.0 g/kWh actual). Toward the lower BSFC region (cases 13–15), the forecast remained highly consistent, with differences of less than 2 g/kWh in some instances. Although minor deviations were observed, such as in case 6 where the forecast slightly overpredicted (902.6 g/kWh vs. 892.4 g/kWh actual), the overall predictive accuracy was strong. These results indicate that the forecasting model reliably captures both magnitude and trend of BSFC under different engine operating conditions.
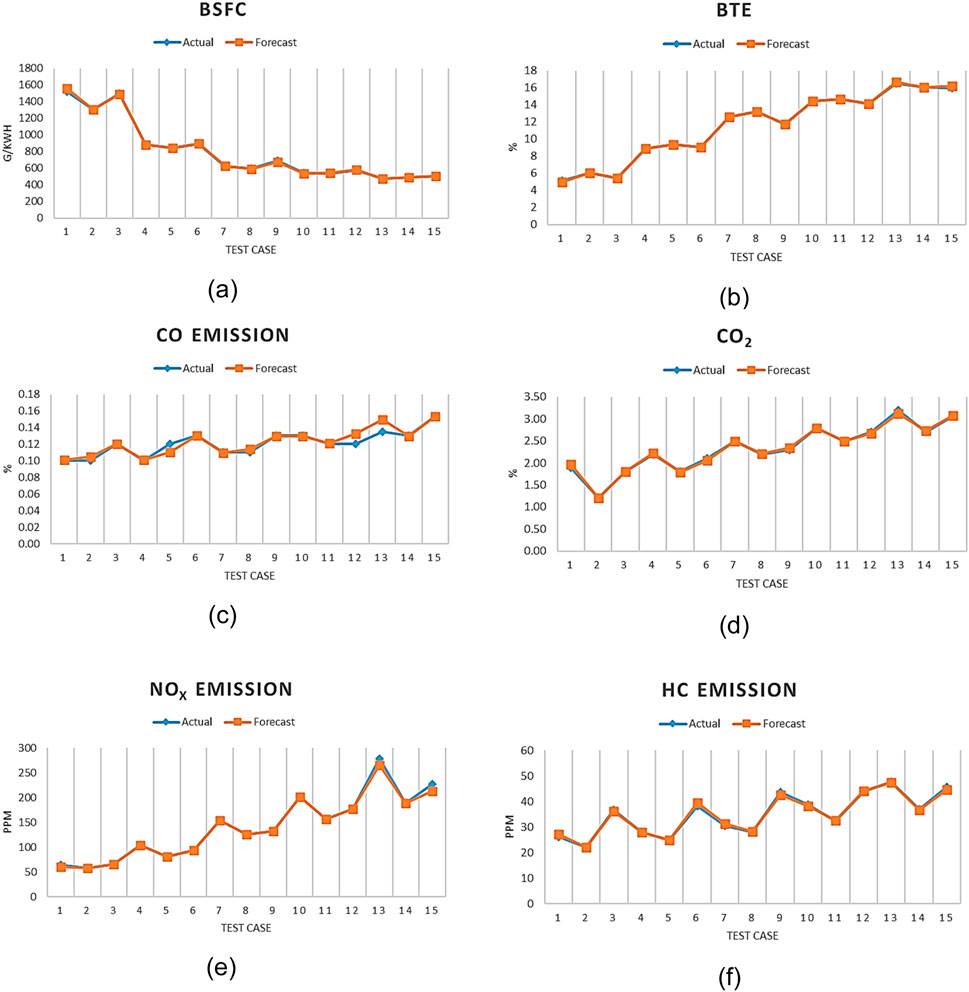
Figure 16. Comparison of actual and forecast (a) BSFC, (b) BTE, (c) CO, (d) CO2, (e) NOx and (f) HC emission across the test cases for Cascade neural networks.
Figure 16b presents the comparison of actual and forecast brake thermal efficiency (BTE). The results indicate that the model reproduced the increasing efficiency trend with high fidelity, with forecast values closely matching the experimental data across low, medium, and high operating conditions. At the lower range, predictions were nearly identical, such as case 2 (6.065% forecast vs. 6.065% actual) and case 3 (5.44% forecast vs. 5.41% actual). In the mid-range cases, the agreement was similarly strong, for example, at case 7, where both actual and predicted values were 12.58%. At higher efficiencies, the model maintained accuracy with minor variations, such as at case 13 (16.66% forecast vs. 16.50% actual) and case 15 (16.24% forecast vs. 15.98% actual). Although small deviations occurred at case 1, where the model slightly underpredicted (4.96% vs. 5.16%), the general performance demonstrated excellent consistency.
Figure 16c compares actual and forecast carbon monoxide (CO) emissions. The predictive model consistently followed the experimental trend, with values aligning closely across the full range of operating conditions. At low emission levels, such as cases 1–3, the forecast values (0.101%–0.120%) nearly overlapped with the actual data (0.100%–0.120%). Mid-range points also exhibited strong agreement, for instance case 6 where both actual and forecasted CO were 0.130%. Slight overestimations appeared in certain cases, notably case 12 (0.132% forecast vs. 0.120% actual) and case 13 (0.149% forecast vs. 0.135% actual), but the deviations remained within a small margin. The peak condition at case 15 showed excellent alignment, with the model exactly replicating the measured value of 0.153%.
Figure 16d illustrates the comparison between actual and forecast carbon dioxide (CO2) emissions. The predictive model demonstrated excellent performance in reproducing the experimental trend, with forecast values consistently following the measured data across all operating points. At the lower end, case 2 showed perfect agreement at 1.20%, while case 1 displayed a slight overestimation (1.97% forecast vs. 1.90% actual). In the mid-range, the alignment was strong, such as case 7 (2.50% forecast vs. 2.50% actual) and case 10 (2.80% forecast vs. 2.80% actual), where the forecast values matched exactly. Toward the higher emission region, the model maintained high accuracy with minimal deviations, for example, at case 13 where the forecast (3.12%) slightly underestimated the actual (3.20%). The peak condition at case 15 was captured almost perfectly, with 3.07% forecast compared to 3.07% actual.
Figure 16e presents the comparison of actual and forecast nitrogen oxides (NOx) emissions. The model showed a strong ability to reproduce the experimental pattern, with very close agreement at both low and mid-range operating points. For instance, cases 2, 5, and 8 showed perfect matches between forecast and actual values (57.33 ppm, 94.00 ppm, and 126.00 ppm, respectively). At higher loads, the forecasts remained accurate, as in case 10 (201 ppm forecast vs. 201 ppm actual) and case 12 (177 ppm forecast vs. 177 ppm actual). Slight underestimations appeared in the peak regions, most notably at case 13 where the forecast predicted 265.7 ppm compared to the actual 279 ppm, and at case 15 with 212.6 ppm forecast versus 227.3 ppm actual. Despite these small deviations, the overall error margin remained narrow, and the general rising and falling trends were well captured.
Figure 16f shows the comparison of actual and forecast hydrocarbon (HC) emissions. The predictive model followed the experimental data with high consistency, capturing both the magnitude and oscillating trend of HC variations. At lower emission levels, the agreement was very close, such as case 2 (21.99 ppm forecast vs. 22.00 ppm actual) and case 4 (28.04 ppm forecast vs. 28.00 ppm actual). In the mid-range, the model tracked the fluctuations effectively, for instance at case 7 where 31.24 ppm was predicted against 30.67 ppm actual. At higher HC levels, small deviations were observed, as in case 9 where the forecast (42.65 ppm) slightly underestimated the actual (43.67 ppm), and case 15 where the forecast (44.61 ppm) was marginally below the actual (45.67 ppm). Nonetheless, these discrepancies remained within acceptable tolerance, and the overall emission pattern was accurately reproduced. The results confirm that the forecasting model is reliable in simulating HC emissions, demonstrating capability in handling the nonlinear variability associated with incomplete combustion.
5 Conclusion of ABE fuel for diesel engine
This study used a single-cylinder direct injection diesel engine at 1,200 rpm to evaluate the impact of ABE–diesel blends (ABE5 and ABE10) compared with baseline diesel across five loads. Performance, combustion and emission parameters were assessed, while machine learning prediction using Cascade ANN and Elman ANN provided deeper insights into nonlinear interactions and predictive reliability.
• Performance
○ ABE5 consistently enhanced brake specific fuel consumption (BSFC) and brake thermal efficiency (BTE) at light-to-medium loads, achieving up to 15% BSFC reduction and 17.5% BTE improvement compared to diesel.
○ At higher loads, ABE5 come together with diesel performance, confirming stable efficiency without major penalties.
○ ABE10 showed mixed outcomes: occasional efficiency improvements at moderate loads but penalties at high loads due to reduced heating value and cetane index.
• Combustion Stability
○ Indicated mean effective pressure (IMEP) was lower for both ABE blends, with ABE10 offering smoother stability than ABE5 at partial loads.
○ Coefficient of variation of IMEP (COVIMEP) highlighted that ABE5 stabilizes with increasing load, while ABE10 remained stable at medium loads but deteriorated at full load.
• Emissions
○ CO emissions. ABE5 consistently reduced CO compared to diesel, especially at higher loads, indicating more complete combustion.
○ CO2 emissions. ABE5 achieved up to 37% reduction at light loads and ∼16% reduction at high load, lowering carbon intensity.
○ NOx emissions. ABE5 reduced NOx by up to 32% at full load, highlighting its effectiveness in moderating combustion temperature.
○ HC emissions. ABE5 reduced HC by up to 22%, while ABE10 tended to increase HC at light-to-medium loads due to incomplete combustion.
• Machine Learning Prediction
○ Both Cascade and Elman neural networks achieved high accuracy (R > 0.93, R2 close to unity).
○ The Elman network captured nonlinear combustion-emission dynamics effectively, while the Cascade model demonstrated slightly higher precision in predicting efficiency metrics.
○ Error metrics (MAD, MSE, RMSE, MAPE) were consistently low.
6 Limitation of the study
This study has several limitations related to both the experimental setup and the ANN modeling. The experiments were performed using a single-cylinder diesel engine with a conventional injection system, which restricts precise control of injection pressure, atomization quality, and in-cylinder mixture formation. These hardware constraints may have contributed to the observed combustion instability, particularly at high loads with ABE10. Furthermore, the high COVIMEP values observed at certain load points indicate unstable combustion behavior that would be operationally unacceptable in real-world engines. While these conditions were included in the experimental discussion to illustrate the limits of stable operation, they are not part of the ANN models. Also, the CO2 values are analyzer concentrations. They do not represent mass-specific emissions. A full carbon balance using exhaust flow, CO, CO2, and HC would be needed to determine CO2 in g per kWh.
On the modeling side, the artificial neural network (ANN) was developed from a relatively small dataset obtained under steady-state conditions at 1,200 rpm. Although the dataset size was limited, it was the result of hundreds of preliminary training and optimization trials. During early trials, the model exhibited very low correlation (R) and determination (R2) values. The predictive accuracy improved substantially only after additional operating parameters and fuel blend variations were introduced as input variables. This iterative process demonstrated that ANN performance can still be enhanced through careful input selection and tuning, even with limited experimental data.
Having said that, future studies should address these limitations by expanding the dataset to include transient, multi-speed, and multi-cylinder operating conditions, improving injection control, and implementing advanced data acquisition systems. These efforts will enhance combustion stability, data consistency, and the generalization capability of the ANN model for practical diesel–biofuel applications.
7 Implications and future research directions on ABE-diesel blends
The findings of this study show several important implications. From a technical standpoint, ABE5 emerges as a viable low-level blend that can be directly used in compression ignition engines without requiring hardware modification, offering tangible efficiency gains and emission reductions under practical duty cycles. On the industrial side, the adoption of low-percentage ABE blending (5%) provides a short-term solution for reducing reliance on fossil diesel in both transport and stationary power applications, particularly in generator sets and urban driving cycles where efficiency and emissions are critical. Environmentally, the significant reductions in NOx, CO, and CO2 emissions observed with ABE5 support national and global efforts toward climate mitigation and improved air quality, aligning with international decarbonization targets. In terms of modeling and optimization, the ANN frameworks highlights their potential as reliable predictive tools that can serve as the foundation for optimization strategies in biofuel blend design and engine performance.
A number of future directions are recommended. Broader validation requires expanding testing to multi-cylinder engines and transient operating conditions to capture real-world applicability. Integrating optimization frameworks with ANN models offers opportunities for real-time engine control and adaptive fuel management strategies. Furthermore, conducting techno-economic assessments and lifecycle analyses will be essential to quantify carbon savings, environmental benefits, and the cost competitiveness of ABE biofuel at larger scales. Finally, comparative studies involving other oxygenated fuels such as butanol, ethanol, and biodiesel are encouraged to develop a broader predictive model database that supports more comprehensive biofuel strategies.
Data availability statement
The raw data supporting the conclusions of this article will be made available by the authors, without undue reservation.
Author contributions
SN: Data curation, Funding acquisition, Investigation, Resources, Writing – original draft. H: Funding acquisition, Investigation, Project administration, Writing – original draft. IV: Conceptualization, Investigation, Methodology, Writing – original draft. I: Conceptualization, Supervision, Validation, Writing – original draft. MM: Conceptualization, Funding acquisition, Writing – original draft. MR: Methodology, Software, Visualization, Writing – original draft.
Funding
The authors declare that financial support was received for the research and/or publication of this article. This research was financially supported by the Higher Institution Centre of Excellence (HiCOE) program, Ministry of Higher Education (MOHE) Malaysia under Grant R.J130000.7809.4J745, and by the Hibah Kemdiktisaintek 2025 Penelitian Fundamental Reguler scheme under Contract No. 124/C3/DT.05.00/PL/2025 with derivative contracts No. 0967/LL3/AL.04/2025 and No. 008/KP/REK-UBK/VI/2025.
Acknowledgments
AcknowledgementsThe authors gratefully acknowledge the institutions and teams involved for their administrative and technical support throughout the conduct of this research.
Conflict of interest
The authors declare that the research was conducted in the absence of any commercial or financial relationships that could be construed as a potential conflict of interest.
Generative AI statement
The authors declare that Generative AI was used in the creation of this manuscript. To help brainstorm and proofread the manuscript.
Any alternative text (alt text) provided alongside figures in this article has been generated by Frontiers with the support of artificial intelligence and reasonable efforts have been made to ensure accuracy, including review by the authors wherever possible. If you identify any issues, please contact us.
Publisher’s note
All claims expressed in this article are solely those of the authors and do not necessarily represent those of their affiliated organizations, or those of the publisher, the editors and the reviewers. Any product that may be evaluated in this article, or claim that may be made by its manufacturer, is not guaranteed or endorsed by the publisher.
References
Abdullah, I. S., Khalid, A., Jaat, N., Saputra Nursal, R., Koten, H., and Karagoz, Y. (2021). A study of ignition delay, combustion process and emissions in a high ambient temperature of diesel combustion. Fuel 297, 120706. doi:10.1016/j.fuel.2021.120706
Aguado-Deblas, L., López-Tenllado, F. J., Luna, D., Bautista, F. M., Romero, A. A., and Estevez, R. (2022). Advanced biofuels from ABE (Acetone/Butanol/Ethanol) and vegetable oils (castor or sunflower oil) for using in triple blends with diesel: evaluation on a diesel engine. Materials 15 (18), 6493. doi:10.3390/ma15186493
Atelge, M., Arslan, E., Kahraman, N., and Ünalan, S. (2023). Evaluation of hybrid nanoparticles to oxygenated fuel with ethanol and n-butanol on combustion behavior. Fuel 344, 128048. doi:10.1016/j.fuel.2023.128048
Batool, S., Naber, J. D., and Shahbakhti, M. (2021). Data-driven modeling and control of cyclic variability of an engine operating in low temperature combustion modes. IFAC-PapersOnLine 54 (20), 834–839. doi:10.1016/j.ifacol.2021.11.275
Bhatt, A. (2025). Experimental study of airpath electrification in an opposed-piston two stroke (OP2S) engine architecture. Int. J. Engine Res., 14680874251334187. doi:10.1177/14680874251334187
Bhattacharya, A., and Majumdar, P. (2024). Artificial intelligence-machine learning algorithms for the simulation of combustion thermal analysis. Heat. Transf. Eng. 45 (2), 176–193. doi:10.1080/01457632.2023.2178282
Ditl, P., and Šulc, R. (2024). Calculations of CO2 emission and combustion efficiency for various fuels. Energy 290, 130044. doi:10.1016/j.energy.2023.130044
Ds, R., Mathew, B. S., and K, S. (2025). Predictive modelling of vehicular tailpipe emissions using supervised machine learning algorithms. Sustain. Transp. Livability 2 (1), 2497278. doi:10.1080/29941849.2025.2497278
Elkelawy, M., Draz, A. M., Seleem, H. E., and Hamouda, M. A. (2025). Performance characteristics of diesel engine power plants: efficiency, emissions, and operational flexibility. Pharos Eng. Sci. J. 2 (1), 1–11. doi:10.21608/pesj.2025.352971.1009
Fayad, M., Tsolakis, A., Martos, F., Bogarra, M., Lefort, I., and Dearn, K. (2022). Investigation the effect of fuel injection strategies on combustion and morphology characteristics of PM in modern diesel engine operated with oxygenate fuel blending. Therm. Sci. Eng. Prog. 35, 101476. doi:10.1016/j.tsep.2022.101476
Fu, J., Yang, R., Li, X., Sun, X., Li, Y., Liu, Z., et al. (2022). Application of artificial neural network to forecast engine performance and emissions of a spark ignition engine. Appl. Therm. Eng. 201, 117749. doi:10.1016/j.applthermaleng.2021.117749
Greencorn, M. J., David Jackson, S., Hargreaves, J. S., Datta, S., and Paul, M. C. (2022). Thermodynamic limitations to direct CO2 utilisation within a small-scale integrated biomass power cycle. Energy Convers. Manag. 269, 116144. doi:10.1016/j.enconman.2022.116144
Gündoğdu, S., and Elbir, T. (2021). Application of feed forward and cascade forward neural network models for prediction of hourly ambient air temperature based on MERRA-2 reanalysis data in a coastal area of Turkey. Meteorology Atmos. Phys. 133 (5), 1481–1493. doi:10.1007/s00703-021-00821-1
Han, K., Liu, Y., Wang, C., Tian, J., Song, Z., Lin, Q., et al. (2021). Experimental study on the evaporation characteristics of biodiesel-ABE blended droplets. Energy 236, 121453. doi:10.1016/j.energy.2021.121453
Hespel, C., Patel, C., Nguyen, T. L., Nilaphai, O., and Mounaïm-Rousselle, C. (2023). Effect of ABE and butanol blends with n-dodecane in different volume ratios on diesel combustion and soot characteristics in ECN spray a conditions. Fuel 345, 128099. doi:10.1016/j.fuel.2023.128099
Ineza Havugimana, L. F., Liu, B., Liu, F., Zhang, J., Li, B., and Wan, P. (2023). Review of artificial intelligent algorithms for engine performance, control, and diagnosis. Energies 16 (3), 1206. doi:10.3390/en16031206
Iodice, P., and Cardone, M. (2021). Ethanol/gasoline blends as alternative fuel in last generation spark-ignition engines: a review on CO and HC engine out emissions. Energies 14 (13), 4034. doi:10.3390/en14134034
Jacob, A., and Ashok, B. (2022). “Effects of fuel reformulation techniques in NOx reduction,” in NOx emission control technologies in stationary and Automotive Internal Combustion Engines (Elsevier), 319–346.
Kumar, M., Karmakar, S., and Chong, C. T. (2023). Investigation on combustion characteristics of acetone-butanol-ethanol/Jet A-1 mixture in a Swirl-stabilized combustor for its potential application in gas turbine engines. Fuel 340, 127610. doi:10.1016/j.fuel.2023.127610
Li, Y., Jia, M., Han, X., and Bai, X. S. (2021). Towards a comprehensive optimization of engine efficiency and emissions by coupling artificial neural network (ANN) with genetic algorithm (GA). Energy 225, 120331. doi:10.1016/j.energy.2021.120331
Mao, G., Shi, T., Mao, C., and Wang, P. (2024). Prediction of NOx emission from two-stage combustion of NH3–H2 mixtures under various conditions using artificial neural networks. Int. J. Hydrogen Energy 49, 1414–1424. doi:10.1016/j.ijhydene.2023.10.129
Masi, M. (2021). Roadmap to 2050: the land-water-energy nexus of biofuels, in roadmap to 2050 the land-water-energy nexus of biofuels. Sustain. Dev. Solutions Netw. Fondazione Eni Enrico Mattei, 1–164.
Meng, Q., Lei, L., Lee, J., and Burke, M. P. (2023). On the role of HNNO in NOx formation. Proc. Combust. Inst. 39 (1), 551–560. doi:10.1016/j.proci.2022.08.044
Oberschelp, C., Pfister, S., and Hellweg, S. (2023). Global site-specific health impacts of fossil energy, steel mills, oil refineries and cement plants. Sci. Rep. 13 (1), 13708. doi:10.1038/s41598-023-38075-z
Pirouzfar, V., Hakami, M., Su, C.-H., and Su, C. H. (2024). Improving the performance of gasoline fuels by adding methanol and methyl tertiary-butyl ether along with metal oxides titanium oxide and magnesium oxide. Energy 294, 130687. doi:10.1016/j.energy.2024.130687
Rahaju, S. M. N., Veza, I., Tamaldin, N., Sule, A., Opia, A. C., Abdulrahman, M. B., et al. (2022). Acetone-butanol-ethanol as the next green biofuel-a review. Automot. Exp. 5 (3), 251–260. doi:10.31603/ae.6335
Rahaju, S. M. N., Hananto, A. L., Paristiawan, P. A., Mohammed, A. T., Opia, A. C., and Idris, M. (2023). Comparison of various prediction model for biodiesel cetane number using cascade-forward neural network. Automot. Exp. 6 (1), 4–13. doi:10.31603/ae.7050
Rahayu, S. M. N., Hananto, A. L., Herawan, S. G., Asy'ari, M. Z., Sule, A., Idris, M., et al. (2022). A review of automotive green technology: potential of butanol as biofuel in gasoline engine. Mech. Eng. Soc. Industry 2 (2), 82–97. doi:10.31603/mesi.7155
Sanjeevannavar, M. B., Banapurmath, N., Soudagar, M. E. M., Atgur, V., Hossain, N., Mujtaba, M., et al. (2022). Performance indicators for the optimal BTE of biodiesels with additives through engine testing by the Taguchi approach. Chemosphere 288, 132450. doi:10.1016/j.chemosphere.2021.132450
Setiawan, I. C., and Setiyo, M. (2022). Renewable and sustainable green diesel (D100) for achieving net zero emission in Indonesia transportation sector. Automot. Exp. 5 (1), 1–2. doi:10.31603/ae.6895
Setiyo, M. (2022). Alternative fuels for transportation sector in Indonesia. Mech. Eng. Soc. Industry 2 (1), 1–6. doi:10.31603/mesi.6850
Shanmugam, S., Hari, A., Pugazhendhi, A., and Kikas, T. (2023). Integrated catalytic upgrading of biomass-derived alcohols for advanced biofuel production. Energies 16 (13), 4998. doi:10.3390/en16134998
Shao, Z., Wu, P., Li, W., Xuan, T., He, Z., Wang, Q., et al. (2024). An experimental study on in-cylinder soot formation and flame oscillation of renewable fuel blends in an optical engine. Fuel 369, 131801. doi:10.1016/j.fuel.2024.131801
Shateri, A., Yang, Z., and Xie, J. (2024). Utilizing artificial intelligence to identify an optimal machine learning model for predicting fuel consumption in diesel engines. Energy AI 16, 100360. doi:10.1016/j.egyai.2024.100360
Thakkar, U., and Chaoui, H. (2022). Remaining useful life prediction of an aircraft turbofan engine using deep layer recurrent neural networks. Actuators 11, 67. doi:10.3390/act11030067
Thiagarajan, S., Seetharaman, S., Lokesh, R., Prasanth, G., Karthick, B., Femilda Josephin, J., et al. (2025). Impact of hydrogen-assisted combustion in a toroidal re-entrant combustion chamber powered by rapeseed oil/waste cooking oil biodiesel. Int. J. Hydrogen Energy 104, 367–377. doi:10.1016/j.ijhydene.2024.07.049
Tripathi, S., and Krishnasamy, A. (2024). Strategies to reduce higher unburned hydrocarbon and carbon monoxide emissions in reactivity controlled compression ignition. SAE Tech. Pap. 1. doi:10.4271/2024-01-2360
Üstün, C. E. (2025). Machine learning applications for predicting fuel ignition and flame properties: current status and future perspectives. Energy and Fuels 39 (28), 13281–13314. doi:10.1021/acs.energyfuels.5c02343
Vellaiyan, S. (2025). Optimization of hydrogen-enriched biodiesel-diesel dual-fuel combustion with EGR for sustainable engine performance. Int. J. Hydrogen Energy 128, 85–94. doi:10.1016/j.ijhydene.2025.04.239
Veza, I., Said, M. F. M., and Latiff, Z. A. (2019). Progress of acetone-butanol-ethanol (ABE) as biofuel in gasoline and diesel engine: a review. Fuel Process. Technol. 196, 106179. doi:10.1016/j.fuproc.2019.106179
Veza, I., Faizullizam Roslan, M., Farid Muhamad Said, M., Abdul Latiff, Z., and Azman Abas, M. (2021a). Physico-chemical properties of acetone-butanol-ethanol (ABE)-diesel blends: blending strategies and mathematical correlations. Fuel 286, 119467. doi:10.1016/j.fuel.2020.119467
Veza, I., Muhamad Said, M. F., Abdul Latiff, Z., and Abas, M. A. (2021b). Application of Elman and Cascade neural network (ENN and CNN) in comparison with adaptive neuro fuzzy inference system (ANFIS) to predict key fuel properties of ABE-diesel blends. Int. J. Green Energy 18 (14), 1510–1522. doi:10.1080/15435075.2021.1911807
Veza, I., Roslan, M. F., Muhamad Said, M. F., Abdul Latiff, Z., and Abas, M. A. (2024). Cetane index prediction of ABE-diesel blends using empirical and artificial neural network models. Energy Sources, Part A Recovery, Util. Environ. Eff. 46 (1), 16025–16042. doi:10.1080/15567036.2020.1814906
Wang, Z., Shuai, S., Li, Z., and Yu, W. (2021). A review of energy loss reduction technologies for internal combustion engines to improve brake thermal efficiency. Energies 14 (20), 6656. doi:10.3390/en14206656
Wilk-Jakubowski, J. L., Pawlik, L., Frej, D., and Wilk-Jakubowski, G. (2025). Data-driven computational methods in fuel combustion: a review of applications. Appl. Sci. 15 (13), 7204. doi:10.3390/app15137204
Xiao, Z., Wang, S., Luo, M., and Cai, J. (2022). Combustion characteristics and synergistic effects during co-combustion of lignite and lignocellulosic components under oxy-fuel condition. Fuel 310, 122399. doi:10.1016/j.fuel.2021.122399
Yuvenda, D., Sudarmanta, B., Jamaludin, J., Muraza, O., Putra, R. P., Lapisa, R., et al. (2022). Combustion and emission characteristics of CNG-diesel dual fuel engine with variation of air fuel ratio. Automot. Exp. 5 (3), 507–527. doi:10.31603/ae.7807
Nomenclature
ABE Acetone–Butanol–Ethanol
ANN Artificial Neural Network
BMEP Brake Mean Effective Pressure (bar)
BP Brake Power (kW)
BSFC Brake Specific Fuel Consumption (g/kWh)
BTE Brake Thermal Efficiency (%)
CI Compression Ignition
CO Carbon Monoxide
CO2 Carbon Dioxide
COVIMEP Coefficient of Variation of Indicated Mean Effective Pressure (%)
HC Hydrocarbon
HRR Heat Release Rate (J/°CA)
IMEP Indicated Mean Effective Pressure (bar)
MAE Mean Absolute Error
MAD Mean Absolute Deviation
MAPE Mean Absolute Percentage Error (%)
MSE Mean Squared Error
NOx Nitrogen Oxides
PM Particulate Matter
R Correlation Coefficient
R2 Coefficient of Determination
RMSE Root Mean Squared Error
rpm Revolutions Per Minute
TDC Top Dead Center
Symbols
W Weight matrix in ANN model
b Bias term in ANN model
(f) Activation function
Nm Newton meter (engine load)
Abbreviations
HiCOE Higher Institution Centre of Excellence
MOHE Ministry of Higher Education
R&D Research and Development
Keywords: acetone–butanol–ethanol biofuel, ABE-diesel blends, performance, combustion, emission, neural network prediction of engine testing, Cascade ANN, Elman ANN
Citation: Ngesti Rahaju SM, Handi , Veza I, Irianto , Muhamad Said MF and Roslan MF (2025) Acetone butanol ethanol (ABE)-diesel blends and ANN: performance, combustion, and emission prediction of ABE–diesel blends using ANN. Front. Energy Res. 13:1707341. doi: 10.3389/fenrg.2025.1707341
Received: 17 September 2025; Accepted: 07 November 2025;
Published: 05 December 2025.
Edited by:
Jinlong Liu, Zhejiang University, ChinaReviewed by:
Noureddine Elboughdiri, École Nationale d'Ingénieurs de Gabès, TunisiaTianfang Xie, Purdue University, United States
Copyright © 2025 Ngesti Rahaju, Handi, Veza, Irianto, Muhamad Said and Roslan. This is an open-access article distributed under the terms of the Creative Commons Attribution License (CC BY). The use, distribution or reproduction in other forums is permitted, provided the original author(s) and the copyright owner(s) are credited and that the original publication in this journal is cited, in accordance with accepted academic practice. No use, distribution or reproduction is permitted which does not comply with these terms.
*Correspondence: Ibham Veza, aWJoYW0udmV6YUB1YmsuYWMuaWQ=; Mohd Farid Muhamad Said, bWRmYXJpZEB1dG0ubXk=