 Arnel Garcesa
 Nathan Johnson
- Arizona State University Polytechnic School, Ira A. Fulton Schools of Engineering, Mesa, AZ, United States
The combination of microgrids and load shifting creates stacked economic benefits and, in some cases, may create synergistic value in which “the whole is greater than the sum of its parts.” These behaviors were explored and contrasted for three building types–apartment complex, hospital, school–using the same retail tariff structure for the case study site of Los Angeles, California. Microgrid assets were sized to minimize annualized project costs under a range of load shifting scenarios that varied duration (up to 3 h) and percentage (up to 25% of total load). Results showed stacked value improvements through annualized cost reductions of 6.2%, 8.1% and 21.6% for an apartment complex, hospital and school, respectively, and synergistic value of 0.3%, 2.1%, and −1.2%, respectively, for the mid-point case with 2 h and 15% of total load shifted. The rank order relationship of synergistic value shows a negative correlation with the load factor, suggesting that load profiles with more “peakiness” may not be able to access synergistic value, though the school did have the greatest stacked value. As load shifting percentage increases, the synergistic value for the school trends negative while the synergistic value for the hospital is flat and the apartment trends positive. This underscores results showing that the stacked value and the synergistic value are primarily affected by the load shifting duration rather than the load shifting percentage. Greater synergistic value is created when microgrid asset sizes can be downsized as more load control is added. When looking at the hospital, results indicate that microgrid focuses on demand charge reductions whereas load shifting emphasizes energy charge reductions, thereby promoting more synergistic value when combined because the two approaches address different parts of the utility bill. This trend does not hold in all scenarios, however, and further identifies that the cost optimal solution may not be achieved by simply shifting load to periods of day with greater solar photovoltaics production, a commonly held general assumption.
1 Introduction
Microgrids and distributed energy resources (DERs) are becoming increasingly common sources of electricity at the grid-edge (Montuori et al., 2014). Assets in a microgrid may include natural gas generators, diesel generators, solar photovoltaics (PV), and battery energy storage (Li et al., 2021) (Albarakati et al., 2022). These assets act a single controllable entity to power local loads during grid-connected normal operation or in island-mode in the event of a grid disturbance (Hosseinnia et al., 2018) (Wodicker et al., 2023). Microgrids are advantageous for providing power for critical services–such as hospitals, data centers, defense–or building types with lower power quality–due to a long radial feeder, disruptions from extreme weather, or other causes (Vahedipour-Dahraie et al., 2022). Global interest in microgrids is growing due to reductions in component costs (Sasidhar et al., 2025) and the increased demand for energy reliability, security, and sovereignty is increasing (Yahaya et al., 2020).
The delivered benefits from microgrids can be improved when load control is combined with microgrid asset dispatch, as suggested by preliminary studies (Nelson et al., 2020) (Nelson et al., 2019) (Pothireddy et al., 2022) (Garcesa et al., 2025). Load shifting is commonly used to move energy consumption from the time of the day when energy pricing is high to a different time of day when time-of-use (TOU) energy pricing is lower (Katz et al., 2016) (O’Reilly et al., 2024). Load shifting is a technique with applications to all major electrical customer categories including residential, commercial, industrial, and public services, and commonly focuses on shifting high power loads such as air conditioning, space heating, water heating, electric vehicles, pumps, and lighting (Pothireddy et al., 2022) (Yousri et al., 2023) (Vázquez-Canteli and Nagy, 2019) (Mohandes et al., 2020) (Silvestri and De Santis, 2024) (Feijoo et al., 2024). Yet when combining microgrid dispatch and load control, further study is needed for optimal sizing and control of the integrated system.
Variability in power generation from renewable resources such as solar PV and wind can be reduced using energy storage (Darabi et al., 2021) (Darabi et al., 2021) (Janko et al., 2016), with a common use case to discharge batteries and avoid changes to loads to reach similar reductions in utility bills (Hargreaves and Jones, 2020) (Sufyan et al., 2019) (Fossati et al., 2015) (Nelson and Johnson, 2020). A complementing, though contrasting, study found that load shifting could reduce the cost-optimal size of energy storage by up to 9% because loads could be shifted to off-peak times of day instead of relying on battery storage to power loads during on-peak times (Javed et al., 2022) (Hou et al., 2024). Another financial saving strategy is to shift energy consumption to times of day with greater solar PV generation (Darabi et al., 2021) (Hou et al., 2024) (Amrollahi and Bathaee, 2017). Such benefits can be extended from a single building to all loads across a distribution network to reduce microgrid capital costs and/or operating costs of utility bills (Pinto et al., 2021). Control strategies that include microgrid assets and loads can better manage grid power use, and hence, such approaches can better manage overall system-wide loading during periods of grid stress (Feijoo et al., 2024) (Javed et al., 2022). However, the literature is limited in how the combination of a microgrid and load control affects the sizing and operation of assets (Bagheri et al., 2022) (Lavrik et al., 2021). The same optimization formulation can be applied to residential, commercial, and industrial rate structures (Talent and Du, 2018) (Huang and Abedinia, 2021).
More scholarly deployment is needed to investigate how load shifting and microgrids could be mutually supportive and even synergistic to reduce costs. In this work, the stacked value expresses the combined benefits of adding both a microgrid and load control, and the synergistic value expresses the additional value obtained if the combined value of a microgrid and load control is greater than the value of each separately. Contributions to literature include:
1. Evaluating how microgrid asset sizing and dispatch is affected by load control strategies to reach a least-cost solution.
2. Evaluating the stacked value produced by combining load shifting and microgrids.
3. Demonstrating the synergistic value produced if combining load shifting and microgrids creates results in which “the whole is greater than the sum of its parts.”
4. Describing optimal approaches to system sizing and controls that maximize stacked value and synergistic value.
2 Methodology
Mixed integer linear programming (MILP) is employed to minimize customer costs (Tan et al., 2010) (Mahmoud et al., 2019). MILP has also been employed in microgrid studies for improving frequency regulation (Kerdphol et al., 2014), power balance (Bagheri et al., 2022), loss of load probability (Eltamaly et al., 2016) (Hosseinnia et al., 2019) (Nojavan et al., 2017), expected energy not supplied (Pinto et al., 2021) (Hosseinnia et al., 2019), carbon emissions (Hosseinnia et al., 2019), and asset reliability and lifetime (Sufyan et al., 2019) (Naidu et al., 2018). Formulations have been developed and applied in use cases such as small-scale residential (Akter et al., 2021), medium-scale commercial (Mathew et al., 2022), large-scale industrial (Arias et al., 2018), and off-grid operation (Morsali and Kowalczyk, 2018). Of these studies, MILP is a common approach as it guarantees finding a global optimum solution while offering flexibility to define the problem space and constraints (Urbanucci, 2018). MILP is used in many free and commercially available optimization solvers.
2.1 Optimization platform
The microgrid design platform Xendee and associated MILP solver are used to identify the cost-optimal conditions for microgrid sizing and dispatch with load control. Xendee is a cloud computing software that can perform techno-economic optimizations. The optimization objective function seeks to minimize total annualized system costs over the duration of the project period (Nelson et al., 2020). The annualized cost is comprised of technology investments, operation and maintenance costs, energy purchases from the utility, energy sales to the utility, and incentives/tax credits as shown in Equation 1 (Xendee, 2025a). A simulation period of 1-year is completed with operating costs reflected within the summation. For capital costs, Xendee amortizes investment costs of microgrid assets over the entire lifetime of the project and accounts for replacement costs for any assets that reach their lifetime limits as expressed in
Where:
Where:
2.2 Scenarios and optimizations
Four scenarios are explored to generate data needed to evaluate the stacked value and synergistic value of a microgrid and load control.
1. Scenario 1: No microgrid and no load shifting (base case) – No microgrid assets are installed, and no load shifting is available. Loads are served only by utility electricity purchases. There are no features available for the customer to control or reduce load.
2. Scenario 2: Load shifting with no microgrid–No microgrid assets are installed. Loads are served only by utility electricity purchases. A site controller manages load shifting.
3. Scenario 3: Microgrid with no load shifting–Microgrid DER assets are installed. Loads are served through a combination of on-site DERs and through utility electricity purchases. There are no features available to the customer to control the timing of load.
4. Scenario 4: Microgrid and load shifting–Microgrid assets are installed, and loads are served through on-site DERs and utility electricity purchases. Power from the grid or microgrid assets could meet energy consumption as scheduled, or load shifting could be used to move energy consumption to a different time of day than originally scheduled.
The base case and microgrid with no load shifting scenarios run only one optimization each. The base case provides a comparison case, and the microgrid with no load shifting optimization considers DER assets and calculates the resulting dispatch routines. The scenarios with load shifting include more optimization runs that explore the effect of load shifting control parameters on output metrics, with each combination of input parameters creating a new optimization with unique annualized system costs and load dispatches. The two scenarios with load shifting each include 15 optimizations that are a result of combinations of the parameters below:
1. Maximum duration of load shifting: 1, 2, or 3 h.
2. Maximum percentage of daily load that can be load shifted: 5%, 10%, 15%, 20%, or 25%.
Three hours was chosen as the longest duration for energy shifting based on heating and cooling loads (Clauß et al., 2024), and 25% is a representation of the percentage of a site's total daily load that could be shifted (Agarwal et al., 2011). These provide data for sensitivity analyses of control parameters.
3 Case study information
Los Angeles, California in the United States is the case study site. The economy of the State of California is the highest among all states in the United States and ranks 4th in the world by GDP (Hiltzik, 2025). California has similarly earned a top ranking among United States states for environmental policies (Vogel, 2018) and progress towards decarbonizing the energy sector (Meckling et al., 2017). Currently, California leads all United States states in electricity generated from solar PV (Climate Central, 2025) and places second in energy generated from renewables (U.S. Energy Information Administration, 2025). Furthermore, its per capita energy use is the 4th lowest in the United States However, the installed capacity of renewables is so high that, in absence of more energy storage and load control, California at times pays neighboring states to off-take the excess electricity generation (Vad et al., 2019). These drivers are motivating the development of new policy models and technology approaches to better utilize renewable energy generation and energy storage within the state (IER, 2025). Los Angeles is the most populous city in California (City of Los Angeles, 2025). California has also been the subject of several - microgrid case studies such as increasing university campus renewables utilization (Sreedharan et al., 2016) and replacing diesel generators with battery energy storage in state-owned building-scale microgrids (Hwang et al., 2023).
3.1 Customer types
Three building types were chosen to examine the stacked value and synergistic value of microgrids and load control. These building types include an apartment complex, hospital, and secondary school to encompass a variety of seasonal load shapes, load magnitudes, and HVAC equipment. Data on these building types were taken from the United States Department of Energy which maintains commercial reference buildings for a range of building types in the United States (U.S. Department of Energy, 2025). Table 1 provides a brief synopsis of the characteristics of these selected building types which differentiate load shapes and magnitudes (Deru, 2025). Other properties which differentiate these building types are plug and process loads, occupancy, environmental conditions, and operating schedules. Additional information is found in (Deru, 2025).
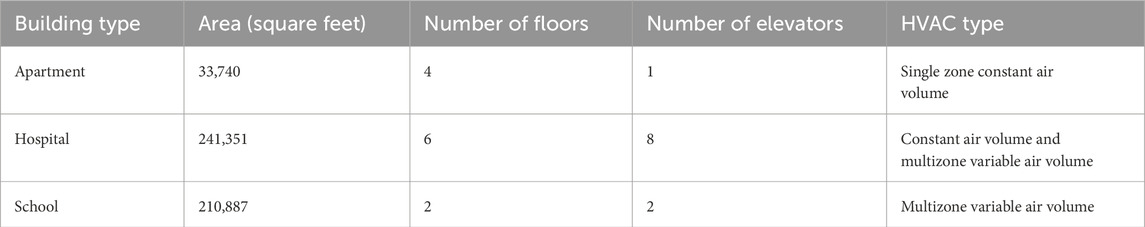
Table 1. Selected characteristics of case study building types.
Load profile generation is completed using EnergyPlus. EnergyPlus is a whole building energy simulation program that models energy consumption—for heating, cooling, ventilation, lighting, and plug and process loads—and water use in buildings (U.S. Department of Energy, 2023). Typical load profiles were taken of buildings adhering to Los Angeles area building codes for construction after 1980 and input into EnergyPlus to generate annual energy consumption profiles with a 1-h time step resolution in the Los Angeles climate. Summary statistics of these load profiles are given in Table 2, showing significant differences in the overall amount of energy use and load factor. These differences can also be visualized in Figure 1 that shows daily maximum demand and average demand over a 1-year period. Figure 2 explores this further by providing an intraday time series graph of average hourly load by season and by day type normalized to the peak annual demand. This helps confirm visually that the hospital has a higher load factor and has a load shape that is fairly consistent throughout the year, whereas the apartment and school show greater variation during a week and across seasons in the year.

Table 2. Summary statistics for load profiles of case study building types generated from EnergyPlus.
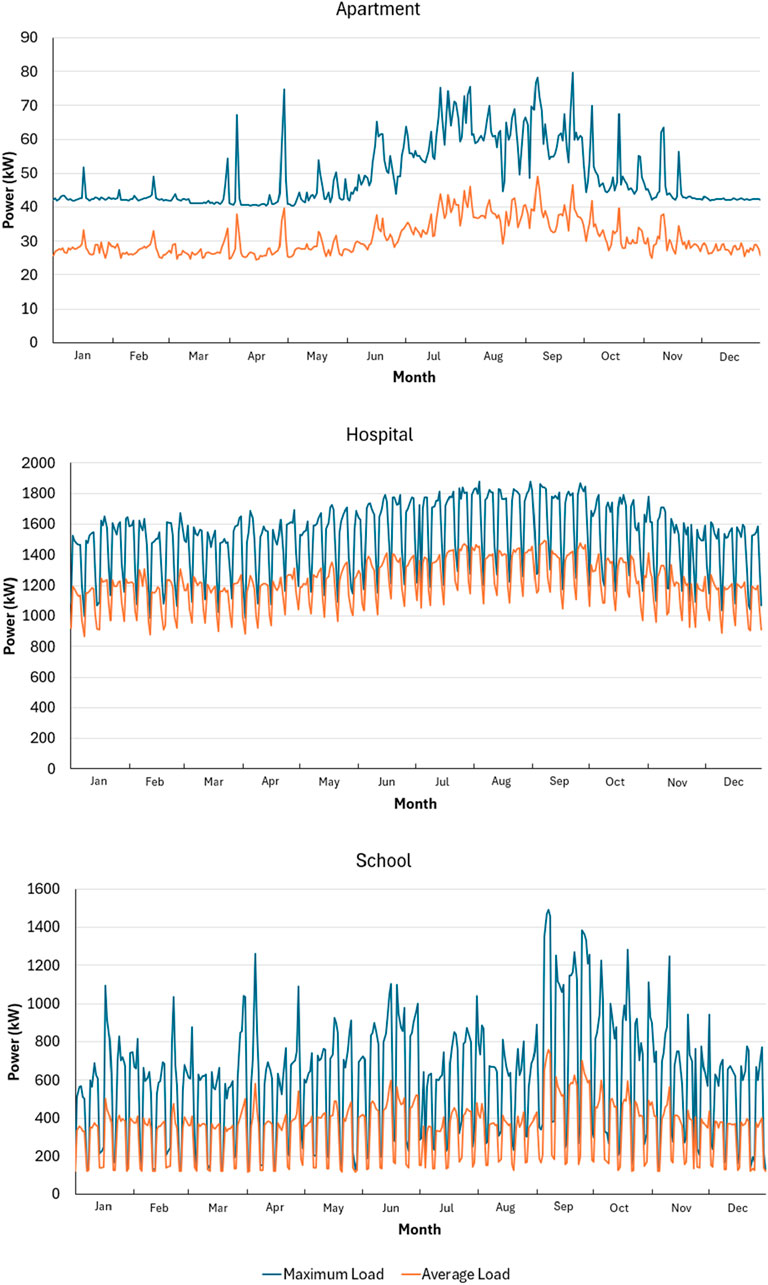
Figure 1. Annual load profiles for case study building types showing maximum and average load with daily resolution.
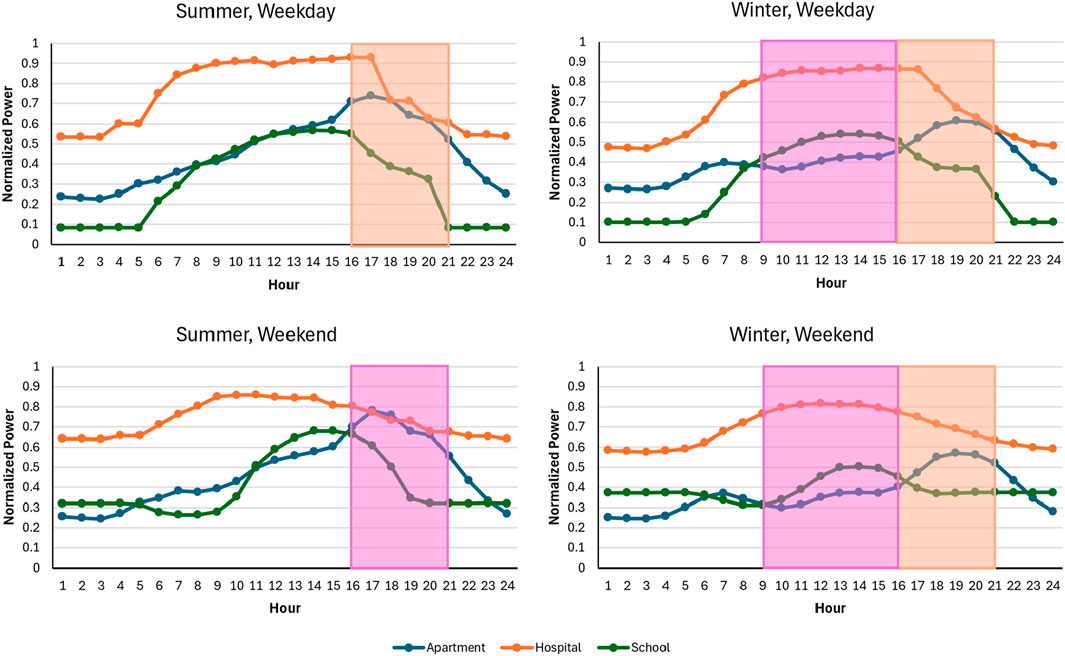
Figure 2. Normalized intraday average load profiles by season and by day type with the season's most expensive period shown by orange (on-peak for summer, mid-peak for winter) and the second-most expensive period shown by purple (mid-peak for summer, super off-peak for winter).
3.2 Utility tariff structure
Southern California Edison (SCE) is the electric utility that serves the Los Angeles area. All three building types match the load requirements for the TOU-8 Option E rate structure for customers who participate in Permanent Load Shifting (PLS), which is defined as moving electrical energy usage from SCE's on-peak period to another time period on an ongoing permanent basis. Table 3 summarizes this tariff structure (SCE, 2023). Although net metering is allowed, it is not modeled in this work because of the recent changes made by the California Public Utilities Commission from NEM 2.0 to NEM 3.0 to decrease the value consumers receive when selling excess energy back to the grid (California Public Utilities Commission, 2025). This type of change or “roll-back” in net metering policies is actively being debated and modified by regulators across the United States (Trela and Dubel, 2021) (Gustafsson, 2017). In 2024 alone, 47 United States states and the District of Columbia implemented changes to net metering policy (Apadula, 2025). Therefore, this work does not model net metering to instead explore the value that microgrid assets and load shifting can offer for consumers in the increasingly common scenario where the utility provides less or no compensation under net metering.
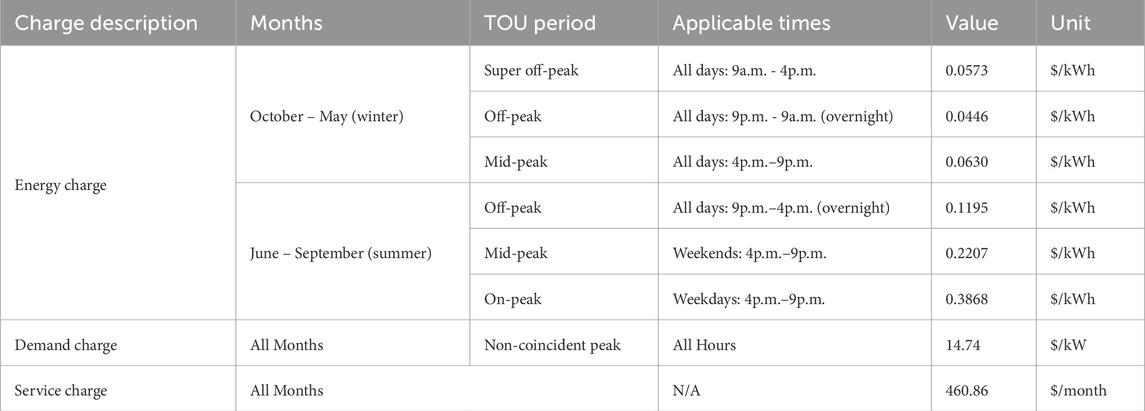
Table 3. Tariff structure for Southern California Edison.
3.3 Microgrid asset costs
Table 4 summarizes inputs for microgrid assets. Asset costs were retrieved from a database of renewable energy technology costs for United States consumers across various classes and sizes (National Renewable Energy Laboratory, 2024). Technical data were taken from asset-specific specifications sheets when not available from (National Renewable Energy Laboratory, 2024). Capital costs and operating and maintenance (O&M) costs for inverters are embedded within the costs of solar PV and battery storage.
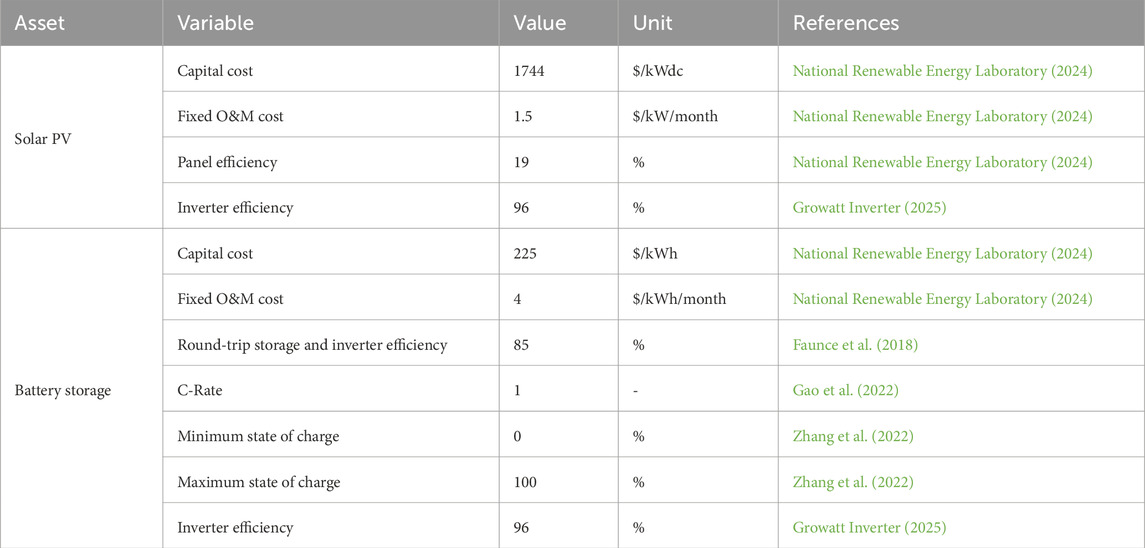
Table 4. Financial and technical parameters of microgrid assets.
3.4 Load control costs
Load control costs are modeled in Xendee on a cost per month basis. This cost is calculated from a reference cost for a supervisory controller and load control at an estimated cost between $0.55 - $1.1 per square, or an average cost of $0.825 per sq ft (Katipamula et al., 2024). Taking an example for illustration, a reference building of 10,000 sq ft would require $8,250 in load control, and translating that value to a time basis requires an assumed project length such as 15 years to calculate the Xendee input of $42 per month. A similar calculation is completed for the building types with results given in Table 5.

Table 5. Load control costs by building type.
3.5 Stacked value and synergistic value
Optimal load shifting and optimal microgrid control are first calculated separately, and then jointly, to evaluate the potential stacked value and synergistic value of these capabilities under one supervisory controller. The stacked value is equated as the difference in results from Scenario 1 and Scenario 4. The synergistic value is equated by evaluating if “the whole is greater than the sum of its parts” using Equation 3. If the A is greater than the sum of B and C, then the combined load control and microgrid provides synergistic value that is additive beyond the individual parts.
Where:
4 Results and discussion
Quantitative results of the financial benefit of co-optimizing microgrid sizing with load control are computed against the base case (no microgrid and no load shifting). Comparisons are also completed of asset sizing and electricity use for microgrids with and without load control to examine underlying details for how stacked value is generated and reflected in financial metrics.
Sections 4.1 and 4.2 focus on the midpoint case of load shifting ability (2-h duration, 15% load shifting). Section 4.3 provides results of sensitivities across all durations (1–3 h) and percentages (5%–25%).
4.1 Costs
Costs for the base case include only the annual utility costs, which are $41,632 for the apartment, $1,199,852 for the hospital, and $453,317 for the school. Results are presented here for each customer type compared to their own base case to focus dialogue on the relative changes, which are more illustrative and generalizable than the absolute changes that differ in magnitude based on the size of the building type and associated loads. Comparisons between annualized costs are complemented by comparisons of capital expenditures and utility expenditures.
Figure 3 displays the change in total annualized costs for all scenarios relative to the base case, with results shown for load shifting, a microgrid, a microgrid and load shifting (stacked value), and the synergistic value. The synergistic value is equated using Equation 3 and described here as an example for the apartment:
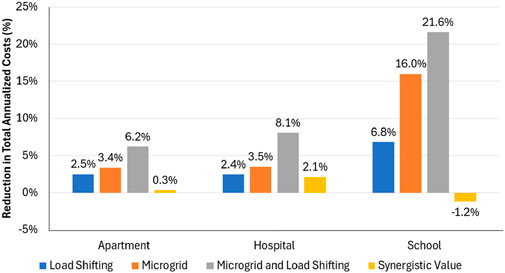
Figure 3. Reduction in total annualized costs relative to the base case for each of the four scenarios and three building types. Cases shown for load shifting duration of 2 h and a maximum of 15% of total load shifted. A negative synergistic value means the joint case saves less than the sum of the parts.
The load shifting with no microgrid scenario yields annualized costs of $40,590, a reduction of $1,042 or 2.5% from the base case. The microgrid with no load shifting scenario yields annualized costs of $40,232, a reduction of $1,400 or 3.4% from the base case. The microgrid and load shifting scenario yields annualized costs of $39,050, a reduction of $2,582 or 6.2% from the case. The reduction from microgrid and load shifting is $140 greater than the sum of the reduction from the load shifting with no microgrid scenario and the microgrid with no load shifting scenario. This yields a synergistic value of ($140/$41,632) = 0.3% of additional value (or 6.2% – (2.5% + 3.4%) = 0.3%).
Results in Figure 3 are shown for load shifting of up to 2 h and 15% of total load shifted. Load shifting provides stacked value in reducing annualized costs for the apartment, hospital, and school of 6.2%, 8.1%, and 21.6%, respectively. The synergistic value is 0.3%, 2.1%, and −1.2%, respectively. Since the tariff structure is the same in all cases, the variation in the amount saved is attributed to the optimal microgrid asset sizing and load control to deliver least cost power for each building type. Results for the apartment and hospital show similar improvements with load shifting and microgrids separately. But it is interesting to note that the stacked value and the synergistic value are greater for the hospital than for the apartment. This is because hospital loads could be shifted out of the peak TOU into a low TOU period or to midday when there is ample solar PV production, thereby permitting significant reductions in energy storage size and the associated capital cost, as indicated in Figures 4, 5. When looking at the school, the increased benefits obtained by load control or microgrids is attributed to (a) the load shape peak tends to coincide with periods of greater solar PV production, and (b) the low load factor that allows a smaller amount of load to be shifted to reduce demand charges in a significant way. Yet combining both load control and microgrids created a negative synergistic value, which occurs because the microgrid and load shifting affect the load shape in the same way for the school, thereby leaving no opportunity for synergistic reductions in energy costs.
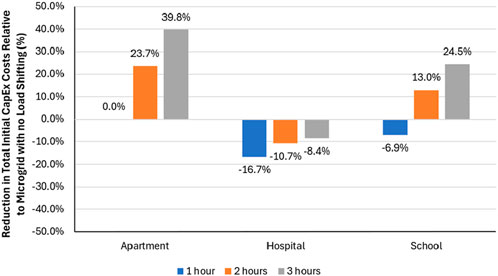
Figure 4. Reduction in initial capital expenditures for cases with a maximum of 15% of total load shifted under various load shifting durations. Reference case is microgrid with no load shifting.
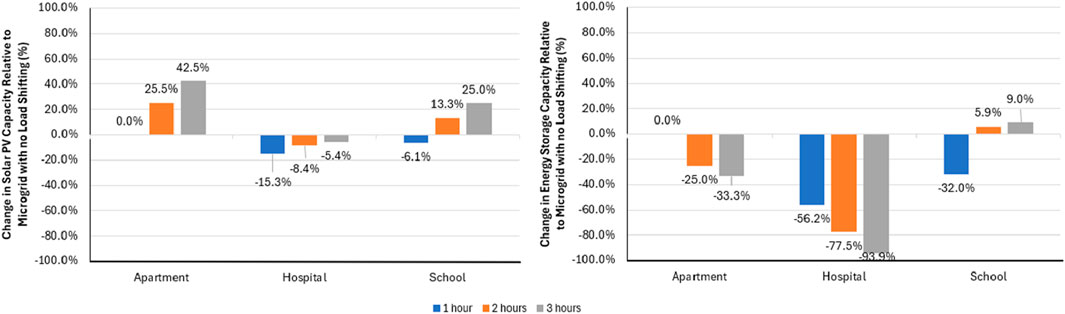
Figure 5. Change in solar PV and energy storage capacities for cases with a maximum of 15% of total load shifted under various load shifting durations. Reference case is microgrid with no load shifting.
More of the underlying details to the behaviors in Figure 3 can be observed when examining how microgrid asset sizing changes when load shifting is not included (Table 6) and contrasting this to how sizing is affected when including increasing amounts of load shifting (Figures 4, 5). Figures 4, 5 show that only the hospital consistently has fewer capital assets installed (both solar PV and energy storage) when load shifting is added, the apartment installs more solar PV but less energy storage, and the school installs more solar PV and more energy storage (except under the 1 h load shift duration). This trend parallels the rank ordering of the synergistic value created, with hospital as the greatest, then the apartment, and lastly the school (which has a negative value). Further, this trend matches the rank order of load factors from Table 2 and suggests that load factor could be used as a proxy with synergistic value in some cases.
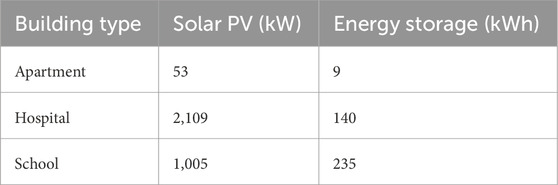
Table 6. Optimal asset capacities by building type for microgrid with no load shifting.
Changes in annualized costs under each scenario are further described by reductions in utility expenditure components as shown in Figure 6. Most of the financial benefits occur from energy charge reductions that result in 50%–300% greater savings than demand charge reductions, with relative differences attributed to the rate structure and load profiles. When compared to the base case, energy charge reductions improve by an additional 57.5%, 1.6%, and 32.5% for the apartment, hospital, and school, respectively, when load shifting is added to the microgrid. This compares to demand charges being reduced by an additional 47.3%, 5.1%, and 17.4%, respectively, when load shifting is added to the microgrid. The results seem to suggest that the apartment and school may have the most synergistic value, but the opposite is the case, which can be seen in Figure 3, and is explained by comparing the results in Figure 6 with the results in Figures 4, 5. For the hospital, utility bill savings are essentially the same for the cases with a microgrid alone and a microgrid with load shifting, but the key difference is that load shifting permits a lower investment in capital expenditures to reach cost optimal results as suggested earlier. The school has the greatest reduction in utility expenditures than in any location, and this is obtained through significant reductions in both energy changes and demand charges relative to the other building types. The greater reduction in demand charges for the school can be attributed to the school's low load factor.
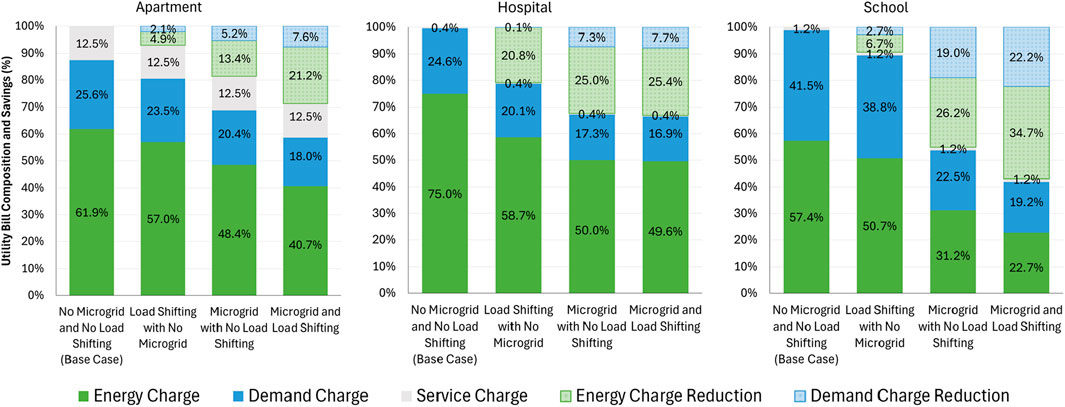
Figure 6. Energy charge and demand charge savings, with savings calculated relative to the base case scenario. Cases shown for load shifting duration of 2 h and a maximum of 15% of total load shifted.
4.2 Electricity use
Figure 7 displays the amount of energy shifted in MW hours (MWh) and proportion of total load shifted over the year (%) with and without a microgrid when the maximum percentage of total load shifted is 15%. Across all building types and scenarios, increasing the load shifting duration increases the amount of energy shifted, as expected. While the hospital shifts more load in total than the other building types, due to the hospital's greater use of energy, the proportion of total load shifted is less than the other building types. When looking across all building types, it is apparent that the proportion of total load shifted (Figure 7) is inversely correlated with the synergistic value (Figure 3).
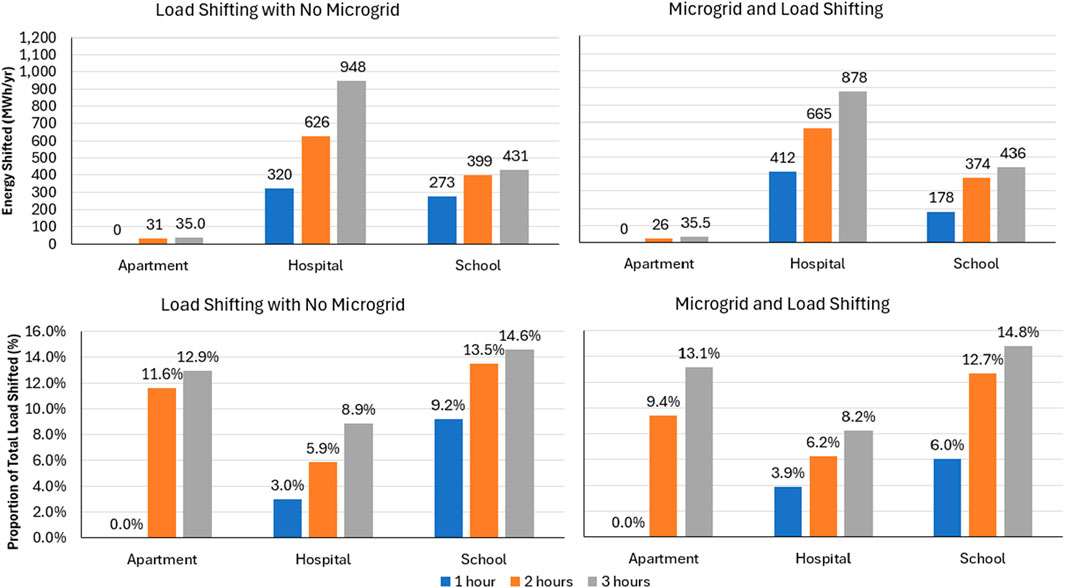
Figure 7. Amount of energy shifted and proportion of total load shifted for various load shift durations. Results shown for the selected case with maximum of 15% of total load shifted.
Comparing findings for the proportion of total load shifted in Figure 7 against the change in energy used from on-site resources and the grid from Figure 8 reveals greater nuances that underpin annualized cost savings. Specifically, the hospital uses less energy from on-site resources and purchases more energy from the grid when load shifting is added to the microgrid. This occurs because the hospital load shape can be adjusted to maintain demand charge and energy charge savings (Figure 6) with a reduced microgrid asset capacity (Figure 5) by shifting even small amounts of load into lower TOU periods that may not coincide with solar PV production (e.g., late evenings after peak TOU). While one may expect that shifting loads into periods with solar PV generation to be the most economical option, as with the apartment and school, the results from the hospital indicate this commonly held viewpoint may not yield the most financially beneficial result in all cases, a finding which further motivates the rationale for this study and the approach generally. Results in Figure 8 also show that, as load shifting duration increases, energy use from the grid and on-site resources tends to converge back to the microgrid only case for the hospital, but diverges for the apartment and the school, showing that load shifting for those two cases prioritizes using power from on-site solar PV and energy storage (Figure 5) for cost-optimal results.
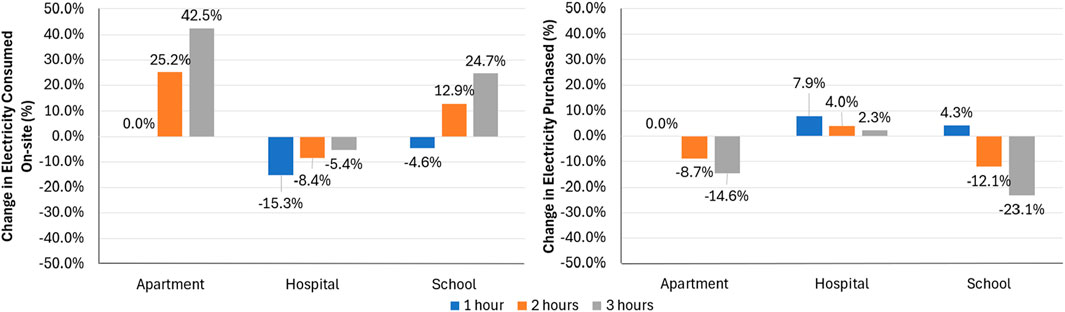
Figure 8. Change in electricity consumed on-site and electricity purchased from the utility for various load shift durations. Results shown for the selected case with maximum of 15% of total load shifted. Reference case is microgrid with no load shifting.
Figure 9 displays the peak demand in each month of the year across all building types and scenarios. Load shifting contributes minimally to demand reductions without the inclusion of a microgrid. Across the year, load shifting results in average peak demand reductions of 8.3%, 0.6% and 6.5% for the apartment, hospital, and school, respectively, whereas the microgrid with no load shifting results in reductions of 19.8%, 29.7%, and 46.2%, respectively, and the microgrid and load shifting provides reductions of 29.4%, 31.3%, and 54.5%, respectively. When looking at the hospital, results from Figures 6, 9 indicate that addition of a microgrid focuses on demand charge reductions whereas load shifting emphasizes energy charge reductions, thereby promoting more synergistic value when combined because the two approaches address different parts of the utility bill for that load profile. The school has the greatest reductions in demand, which is due to the relatively high “peakiness” of that load profile as evidenced by the load factors in Table 2.
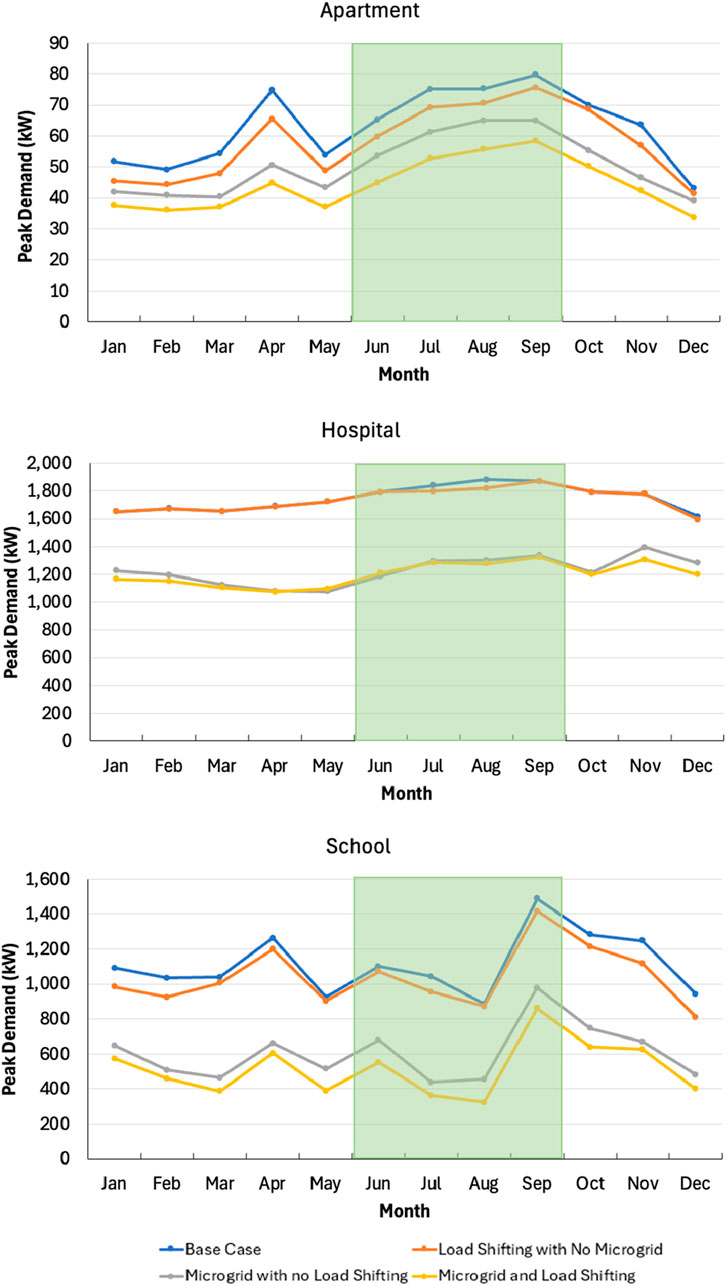
Figure 9. Peak demand in each month across the four scenarios. Months in the summer billing period are in green. Cases shown for load shifting duration of 2 h and a maximum of 15% of total load shifted.
4.3 Sensitivities
Figure 10 displays the stacked value and synergistic value across the building types for sensitivities completed on the maximum percentage of total load shifted and load shifting duration. All three building types show improvements to stacked value as either the percentage of total load shifted or the load shifting duration increases. The benefits of increasing the percentage of total load shifted flattens out, and this plateau occurs faster when load can be shifted around by fewer hours. The school shows this behavior most distinctly. At any load shifting duration and percentage, the school has greater stacked values than the apartment or hospital. This is consistent with earlier findings that the load shifting and microgrid asset sizing combination is well-suited to serve its unique load characteristics–higher loads are coincident with hours of high solar PV production, and the remaining loads can be shifted to reduce demand charges. Although the stacked value for the school is high, the synergistic value is low compared to the other building types which further extends the results from Figure 3. The school consistently shows negative synergistic value for all load shifting percentages and durations, whereas the apartment and hospital consistently show zero or positive synergistic value. As load shifting percentage increases, the synergistic value for the school trends negative. Meanwhile the synergistic value is flat for the hospital and trends positive at lower percentages of load shifting before flattening out at higher percentages for the apartment. Primarily this shows that the stacked value and the synergistic value are affected by the load shifting duration rather than the percentage of load shifting.
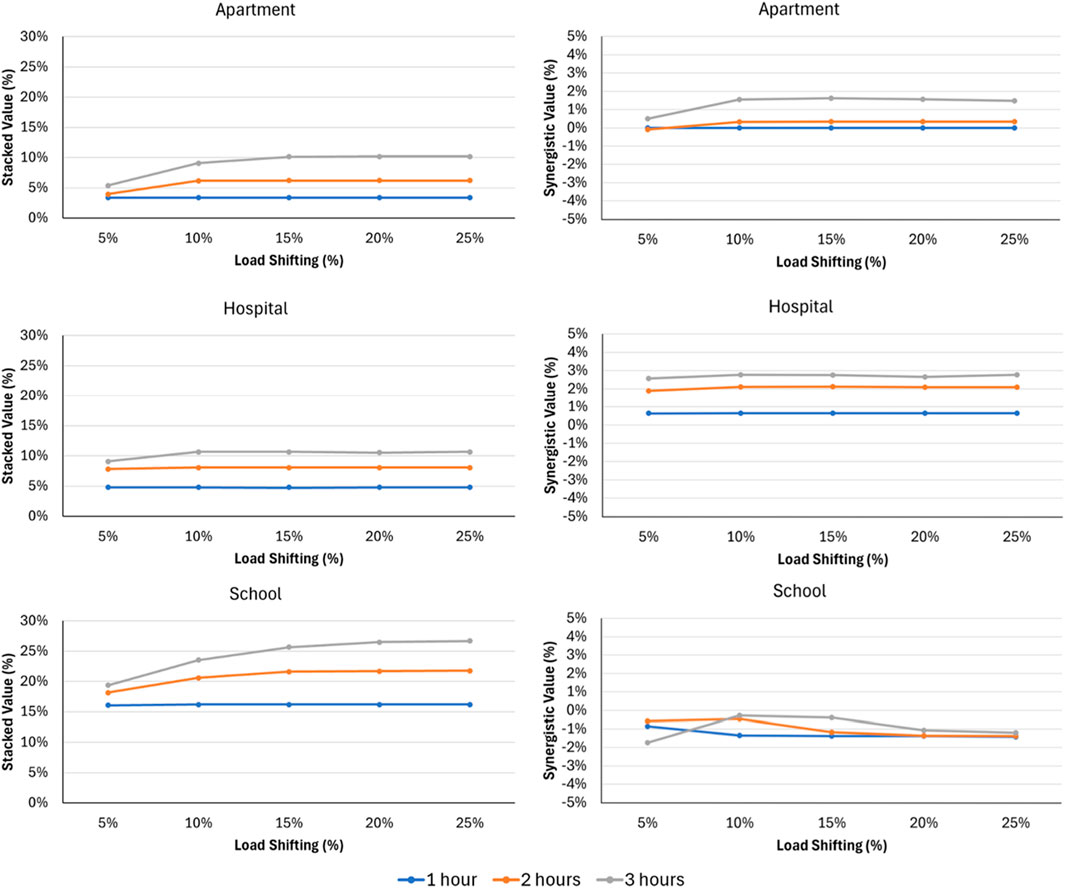
Figure 10. Stacked value and synergistic value across building types for varying load shift duration and amount. A negative synergistic value means the joint case saves less than the sum of the parts.
5 Conclusion
The combination of microgrid asset sizing and load shifting creates stacked economic benefits beyond what each offers individually, and in certain cases, the combination creates synergistic value in which “the whole is greater than the sum of its parts.” These behaviors were explored and contrasted for three building types–apartment complex, hospital, school–using the same retail tariff structure. Microgrid assets were sized to minimize annualized project costs under a range of load shifting scenarios, with load shifting varying by amount (up to 25% of total load) and duration (up to 3 h). Results showed stacked value improvements through annualized cost reductions of 6.2%, 8.1% and 21.6% for an apartment complex, hospital and school, respectively, and synergistic value of 0.3%, 2.1%, and −1.2%, respectively, for the mid-point case with 2 h and 15% of total load shifted. When looking at the hospital, results indicate that addition of a microgrid focuses on demand charge reductions whereas load shifting emphasizes energy charge reductions, thereby promoting more synergistic value when combined because the two approaches address different parts of the utility bill for that load profile. There is minimal to negative synergistic value for the apartment and school because the microgrid and load shifting seek to adjust those load profiles in similar ways. The rank order relationship of synergistic value shows a negative correlation with the load factor, suggesting that load profiles with more “peakiness” may not be able to access synergistic value, though the school did have the greatest stacked value.
Most of the financial benefits occur from energy charge reductions that result in 50%–300% greater savings than demand charge reductions. When compared to the base case, energy charge reductions improve by an additional 57.5%, 1.6%, and 32.5% for the apartment, hospital, and school, respectively, when load shifting is added to the microgrid. This compares to demand charges being reduced by an additional 47.3%, 5.1%, and 17.4%, respectively. Across all building types, the proportion of total load shifted is inversely correlated with the synergistic value. The school receives greater stacked values than the apartment or hospital because of its high loads during times of greatest solar PV production and low load factor. Although the stacked value for the school is high, the synergistic value is low compared to the other building types. As load shifting percentage increases, the synergistic value for the school trends negative while the synergistic value for the hospital is flat and for the apartment trends positive at lower percentages of load shifting before flattening out. This underscores data showing that the stacked value and the synergistic value are primarily affected by the load shifting duration rather than the percentage of load shifting.
Combining load shifting with microgrid asset sizing creates stacked value by serving load that would otherwise be purchased during peak TOU periods. The combination can also create synergistic value by reducing the amount of installed microgrid capacity compared to the microgrid only case and most expensive TOU period charges, but not in call scenarios. The hospital consistently has less solar PV and energy storage installed when load shifting is added, whereas the apartment has more solar PV and less energy storage, and the school has increased solar PV and increased energy storage. These results dispel a common viewpoint that shifting load to periods of day with greater solar PV production will be the preferred approach to reduce costs, but results indicate that achieving the cost optimal solution can be more nuanced, and may include increases or decreases in capital assets.
This work can be expanded by evaluating the business case for microgrids and load shifting to provide firm capacity, which could be procured by utilities in lieu of new power plants. Such models are in various stages of adoption across the United States including demand response, aggregators, virtual power plants, and distributed capacity procurement. Such work would also need to incorporate controls that adapt to real-time changes to load and solar PV, a topic not covered in this study. The quality of forecasting routines would affect the stacked and synergistic values. Future improvements upon this work will focus on examining how variable customer load demand, solar availability, and other customer type load profiles and geographies affect stacked and synergistic values, and intersect those findings with potential business models and the policy realities in different utility jurisdictions.
Data availability statement
The raw data supporting the conclusions of this article will be made available by the authors, without undue reservation.
Author contributions
AG: Data curation, Formal Analysis, Investigation, Methodology, Project administration, Software, Visualization, Writing – original draft, Writing – review and editing. NJ: Conceptualization, Formal Analysis, Funding acquisition, Resources, Supervision, Validation, Writing – review and editing.
Funding
The author(s) declare that financial support was received for the research and/or publication of this article. This research was funded by the US Department of Defense Environmental Security Technology Certification Program (ESTCP) under contract number W912HQ22C0032 and ESTCP Project Number EW21-5195.
Acknowledgements
Thank you to colleague Ryan Sparks for providing feedback during the drafting process.
Conflict of interest
The authors declare that the research was conducted in the absence of any commercial or financial relationships that could be construed as a potential conflict of interest.
Generative AI statement
The author(s) declare that no Generative AI was used in the creation of this manuscript.
Any alternative text (alt text) provided alongside figures in this article has been generated by Frontiers with the support of artificial intelligence and reasonable efforts have been made to ensure accuracy, including review by the authors wherever possible. If you identify any issues, please contact us.
Publisher’s note
All claims expressed in this article are solely those of the authors and do not necessarily represent those of their affiliated organizations, or those of the publisher, the editors and the reviewers. Any product that may be evaluated in this article, or claim that may be made by its manufacturer, is not guaranteed or endorsed by the publisher.
Abbreviations
BAS, building automation system; DER, distributed energy resources; kWh, kW hours; MILP, mixed integer linear programming; MWh, megawatt hours; O&M, operating and maintenance; PV, solar photovoltaic; sq ft, square foot; TOU, time-of-use.
References
Agarwal, Y., Balaji, B., Dutta, S., Gupta, R. K., and Weng, T. (2011). Duty-cycling buildings aggressively: the next frontier in HVAC control. 11.
Akter, H., Howlader, H. O. R., Saber, A. Y., Mandal, P., Takahashi, H., and Senjyu, T. (2021). Optimal sizing of hybrid microgrid in a remote island considering advanced direct load control for demand response and low carbon emission. Energies (Basel) 14 (22), 7599. doi:10.3390/en14227599
Albarakati, A. J., Boujoudar, Y., Azeroual, M., Eliysaouy, L., Kotb, H., Aljarbouh, A., et al. (2022). Microgrid energy management and monitoring systems: a comprehensive review. Front. Energy Res. 10 (Dec), 1097858. doi:10.3389/fenrg.2022.1097858
Amrollahi, M. H., and Bathaee, S. M. T. (2017). Techno-economic optimization of hybrid photovoltaic/wind generation together with energy storage system in a stand-alone micro-grid subjected to demand response. Appl. Energy 202, 66–77. doi:10.1016/j.apenergy.2017.05.116
Apadula, E. (2025). The 50 states of solar: 2024 policy review and Q4 2024 quarterly report. Available online at: https://www.flickr.com/photos/departmentofenergy/7336025204/.
Arias, L. A., Rivas, E., Santamaria, F., and Hernandez, V. (2018). A review and analysis of trends related to demand response. Energies (Basel) 11 (7), 1617. doi:10.3390/en11071617
Bagheri, F., Dagdougui, H., and Gendreau, M. (2022). Stochastic optimization and scenario generation for peak load shaving in smart district microgrid: sizing and operation. Energy Build. 275 (Nov), 112426. doi:10.1016/j.enbuild.2022.112426
City of Los Angeles (2025). The city of Los Angeles. Available online at: https://styleguide.lacity.gov/patterns/pages-homepage/pages-homepage.rendered.html (Accessed August 16, 2025).
Clauß, J., Brozovsky, J., and Georges, L. (2024). Demonstrating the load-shifting potential of a schedule-based control in a real-life educational building. Energy Build. 316 (Aug), 114321. doi:10.1016/j.enbuild.2024.114321
Climate Central. (2025). A decade of growth in solar and wind power: a decade of growth in solar and wind power.
Darabi, M. K., Ganjehlou, H. G., Jafari, A., Nazari-heris, M., Gharehpetian, G. B., and Abedi, M. (2021). Evaluating the effect of demand response programs (drps) on robust optimal sizing of islanded microgrids. Energies (Basel) 14 (18), 5750. doi:10.3390/en14185750
Deru, M. (2025). U.S. department of energy commercial reference building models of the national building stock. Available online at: http://www.osti.gov/bridge.
Eltamaly, A. M., Mohamed, M. A., and Alolah, A. I. (2016). A novel smart grid theory for optimal sizing of hybrid renewable energy systems. Sol. Energy 124, 26–38. doi:10.1016/j.solener.2015.11.016
Faunce, T. A., Prest, J., Su, D., Hearne, S. J., and Iacopi, F. (2018). On-grid batteries for large-scale energy storage: challenges and opportunities for policy and technology. MRS Energy and Sustain. 5 (1), 10. doi:10.1557/mre.2018.11
Feijoo, F., Kundu, A., Flores, F., and Matamala, Y. (2024). Photovoltaic sizing assessment for microgrid communities under load shifting constraints and endogenous electricity prices: a stackelberg approach. Energy 307, 132758. doi:10.1016/j.energy.2024.132758
Fossati, J. P., Galarza, A., Martín-Villate, A., and Fontán, L. (2015). A method for optimal sizing energy storage systems for microgrids. Renew. Energy 77, 539–549. doi:10.1016/j.renene.2014.12.039
Gao, Z., Xie, H., Yang, X., Niu, W., Li, S., and Chen, S. (2022). The dilemma of C-Rate and cycle life for lithium-ion batteries under low temperature fast charging. Batteries 8 (11), 234. doi:10.3390/batteries8110234
Garcesa, A., Johnson, N. G., and Nelson, J. (2025). Evaluating the stacked economic value of load shifting and microgrid control. Buildings 15 (13), 2378. doi:10.3390/buildings15132378
Gustafsson, M. (2017). “Challenges for decision makers when feed-in tariffs or net metering schemes change to incentives dependent on a high share of self-consumed electricity,” in 2017 IEEE 44th photovoltaic specialist conference (PVSC) (IEEE), 2025–2030. doi:10.1109/PVSC.2017.8366092
Hargreaves, J. J., and Jones, R. A. (2020). Long term energy storage in highly renewable systems. Front. Energy Res. 8 (Sep), 219. doi:10.3389/fenrg.2020.00219
Hiltzik, M. (2025). California's economy is now the 4th largest in the world or is it?. Available online at: https://www.latimes.com/business/story/2025-04-30/californias-economy-is-now-the-4th-largest-in-the-world-or-is-it#:∼:text=That%20happened%20because%20the%20state%27s,and%20Germany%20(%244.65%20trillion (Accessed May 03, 2025).
Hosseinnia, H., Nazarpour, D., and Talavat, V. (2018). Utilising reliability-constrained optimisation approach to model microgrid operator and private investor participation in a planning horizon. IET Generation, Transm. Distribution 12 (21), 5798–5810. doi:10.1049/iet-gtd.2018.5930
Hosseinnia, H., Nazarpour, D., and Talavat, V. (2019). Multi-objective optimization framework for optimal planning of the microgrid (MG) under employing demand response program (DRP). J. Ambient. Intell. Humaniz Comput. 10 (7), 2709–2730. doi:10.1007/s12652-018-0977-y
Hou, L., Tong, X., Chen, H., Fan, L., Liu, T., Liu, W., et al. (2024). Optimized scheduling of smart community energy systems considering demand response and shared energy storage. Energy 295, 131066. doi:10.1016/j.energy.2024.131066
Huang, S., and Abedinia, O. (2021). Investigation in economic analysis of microgrids based on renewable energy uncertainty and demand response in the electricity market. Energy 225 (Jun), 120247. doi:10.1016/j.energy.2021.120247
Hwang, S., Tongsopit, S., and Kittner, N. (2023). Transitioning from diesel backup generators to PV-plus-storage microgrids in California public buildings. Sustain Prod. Consum. 38, 252–265. doi:10.1016/j.spc.2023.04.001
IER (2025). California is throwing away excess solar power. Raising Electricity Prices. Available online at: https://www.instituteforenergyresearch.org/renewable/solar/california-is-throwing-away-excess-solar-power-raising-electricity-prices/ (Accessed November 7, 2025).
Janko, S. A., Arnold, M. R., and Johnson, N. G. (2016). Implications of high-penetration renewables for ratepayers and utilities in the residential solar photovoltaic (PV) market. Appl. Energy 180, 37–51. doi:10.1016/j.apenergy.2016.07.041
Javed, M. S., Jurasz, J., McPherson, M., Dai, Y., and Ma, T. (2022). Quantitative evaluation of renewable-energy-based remote microgrids: curtailment, load shifting, and reliability. Renew. Sustain. Energy Rev. 164 (Aug), 112516. doi:10.1016/j.rser.2022.112516
Katipamula, S., Lutes, R., Goodman, C., Kim, W., and Yu, M. G. (2024). Development and validation of a low-cost building automation system for small-and medium-size commercial buildings.
Katz, J., Andersen, F. M., and Morthorst, P. E. (2016). Load-shift incentives for household demand response: evaluation of hourly dynamic pricing and rebate schemes in a wind-based electricity system. Energy 115, 1602–1616. doi:10.1016/j.energy.2016.07.084
Kerdphol, T., Qudaih, Y., Mitani, Y., and Garasi, P. (2014). Optimal sizing of battery energy storage system in microgrid system considering load shedding scheme. Int. J. Smart Grid Clean Energy. doi:10.12720/sgce.4.1.22-29
Lavrik, A., Zhukovskiy, Y., and Tcvetkov, P. (2021). Optimizing the size of autonomous hybrid microgrids with regard to load shifting. Energies (Basel) 14 (16), 5059. doi:10.3390/en14165059
Li, B., Deng, H., and Wang, J. (2021). Optimal scheduling of microgrid considering the interruptible load shifting based on improved biogeography-based optimization algorithm. Symmetry (Basel) 13 (9), 1707. doi:10.3390/sym13091707
Mahmoud, T. S., Ahmed, B. S., and Hassan, M. Y. (2019). The role of intelligent generation control algorithms in optimizing battery energy storage systems size in microgrids: a case study from Western Australia. Energy Convers. Manag. 196, 1335–1352. doi:10.1016/j.enconman.2019.06.045
Mathew, M., Hossain, M. S., Saha, S., Mondal, S., and Haque, M. E. (2022). Sizing approaches for solar photovoltaic-based microgrids: a comprehensive review. John Wiley and Sons Inc. doi:10.1049/esi2.12048
Meckling, J., Sterner, T., and Wagner, G. (2017). Policy sequencing toward decarbonization. Nat. Energy 2 (12), 918–922. doi:10.1038/s41560-017-0025-8
Mohandes, B., Acharya, S., El Moursi, M. S., Al-Sumaiti, A. S., Doukas, H., and Sgouridis, S. (2020). Optimal design of an islanded microgrid with load shifting mechanism between electrical and thermal energy storage systems. IEEE Trans. Power Syst. 35 (4), 2642–2657. doi:10.1109/TPWRS.2020.2969575
Montuori, L., Alcázar-Ortega, M., Álvarez-Bel, C., and Domijan, A. (2014). Integration of renewable energy in microgrids coordinated with demand response resources: economic evaluation of a biomass gasification plant by homer simulator. Appl. Energy 132, 15–22. doi:10.1016/j.apenergy.2014.06.075
Morsali, R., and Kowalczyk, R. (2018). Demand response based day-ahead scheduling and battery sizing in microgrid management in rural areas. IET Renew. Power Gener. 12 (14), 1651–1658. doi:10.1049/iet-rpg.2018.5429
Nahmmacher, P., Schmid, E., Hirth, L., and Knopf, B. (2016). Carpe diem: a novel approach to select representative days for long-term power system modeling. Energy 112, 430–442. doi:10.1016/j.energy.2016.06.081
Naidu, B. R., Panda, G., and Siano, P. (2018). A self-reliant dc microgrid: sizing, control, adaptive dynamic power management, and experimental analysis. IEEE Trans. Ind. Inf. 14 (8), 3300–3313. doi:10.1109/TII.2017.2780193
Nelson, J. R., and Johnson, N. G. (2020). Model predictive control of microgrids for real-time ancillary service market participation. Appl. Energy 269, 114963. doi:10.1016/j.apenergy.2020.114963
Nelson, J., Johnson, N. G., Chinimilli, P. T., and Zhang, W. (2019). Residential cooling using separated and coupled precooling and thermal energy storage strategies. Appl. Energy 252, 113414. doi:10.1016/j.apenergy.2019.113414
Nelson, J., Johnson, N. G., Fahy, K., and Hansen, T. A. (2020). Statistical development of microgrid resilience during islanding operations. Appl. Energy 279, 115724. doi:10.1016/j.apenergy.2020.115724
Nojavan, S., Majidi, M., and Esfetanaj, N. N. (2017). An efficient cost-reliability optimization model for optimal siting and sizing of energy storage system in a microgrid in the presence of responsible load management. Energy 139, 89–97. doi:10.1016/j.energy.2017.07.148
O'Reilly, R., Cohen, J., and Reichl, J. (2024). Achievable load shifting potentials for the European residential sector from 2022–2050. Renew. Sustain. Energy Rev. 189 (Jan), 113959. doi:10.1016/j.rser.2023.113959
Pinto, R. S., Unsihuay-Vila, C., and Tabarro, F. H. (2021). Coordinated operation and expansion planning for multiple microgrids and active distribution networks under uncertainties. Appl. Energy 297 (Sep), 117108. doi:10.1016/j.apenergy.2021.117108
Pothireddy, K. M. R., Vuddanti, S., and Salkuti, S. R. (2022). Impact of demand response on optimal sizing of distributed generation and customer tariff. Energies (Basel) 15 (1), 190. doi:10.3390/en15010190
Sasidhar, P. R. S., Gebremedhin, A., and Norheim, I. (2025). Multi-energy microgrid design and the role of coupling components—A review. Elsevier Ltd. doi:10.1016/j.rser.2025.115540
Silvestri, L., and De Santis, M. (2024). Renewable-based load shifting system for demand response to enhance energy-economic-environmental performance of industrial enterprises. Appl. Energy 358 (Mar), 122562. doi:10.1016/j.apenergy.2023.122562
Sreedharan, P., Farbes, J., Cutter, E., Woo, C. K., and Wang, J. (2016). Microgrid and renewable generation integration: University of California, San Diego. Appl. Energy 169, 709–720. doi:10.1016/j.apenergy.2016.02.053
Sufyan, M., Rahim, N. A., Tan, C. K., Muhammad, M. A., and Raihan, S. R. S. (2019). Optimal sizing and energy scheduling of isolated microgrid considering the battery lifetime degradation. PLoS One 14 (2), e0211642. doi:10.1371/journal.pone.0211642
Talent, O., and Du, H. (2018). Optimal sizing and energy scheduling of photovoltaic-battery systems under different tariff structures. Renew. Energy 129, 513–526. doi:10.1016/j.renene.2018.06.016
Tan, C. W., Green, T. C., and Hernandez-Aramburo, C. A. (2010). A stochastic method for battery sizing with uninterruptible-power and demand shift capabilities in PV (photovoltaic) systems. Energy 35 (12), 5082–5092. doi:10.1016/j.energy.2010.08.007
Trela, M., and Dubel, A. (2021). Net-metering vs. net-billing from the investors perspective—impacts of changes in RES financing in Poland on the profitability of a joint photovoltaic panels and heat pump system. Energies (Basel) 15 (1), 227. doi:10.3390/en15010227
Urbanucci, L. (2018). Limits and potentials of mixed integer linear programming methods for optimization of polygeneration energy systems. in Energy procedia (Elsevier Ltd), 1199–1205. doi:10.1016/j.egypro.2018.08.021
U.S. Department of Energy (2025). New construction — commercial reference buildings. Available online at: https://www.energy.gov/eere/buildings/commercial-reference-buildings (Accessed March 30, 2025).
Vad, C. S., Honsberg, C. B., King, R. R., and Kurtz, S. (2019). Analysing the impact of renewable generation on the locational marginal price (LMP) forecast for California ISO.
Vahedipour-Dahraie, M., Rashidizadeh-Kermani, H., Anvari-Moghaddam, A., Siano, P., and Catalão, J. P. S. (2022). Short-term reliability and economic evaluation of resilient microgrids under incentive-based demand response programs. Int. J. Electr. Power Energy Syst. 138 (Jun), 107918. doi:10.1016/j.ijepes.2021.107918
Vázquez-Canteli, J. R., and Nagy, Z. (2019). Reinforcement learning for demand response: a review of algorithms and modeling techniques. Elsevier Ltd. doi:10.1016/j.apenergy.2018.11.002
Wodicker, M. R., Nelson, J., and Johnson, N. G. (2023). Unified dispatch of grid-connected and islanded microgrids. Front. Energy Res. 11, 1257050. doi:10.3389/fenrg.2023.1257050
Xendee. (2025a). Objective function. Available online at: https://asu.xendee.com/Home/Documentation/objectivefunction (Accessed April 26, 2025).
Xendee (2025b). Payback constraint and reference cases. Available online at: https://asu.xendee.com/Home/Documentation/paybackconstraint (Accessed April 26, 2025).
Yahaya, A. A., AlMuhaini, M., and Heydt, G. T. (2020). Optimal design of hybrid DG systems for microgrid reliability enhancement. IET Generation, Transm. Distribution 14 (5), 816–823. doi:10.1049/iet-gtd.2019.0277
Yousri, D., Farag, H. E. Z., Zeineldin, H., and El-Saadany, E. F. (2023). Integrated model for optimal energy management and demand response of microgrids considering hybrid hydrogen-battery storage systems. Energy Convers. Manag. 280 (Mar), 116809. doi:10.1016/j.enconman.2023.116809
Keywords: microgrid, DER - distributed energy resources, building automation system (BAS), load shifting demand response management, stacked value, synergistic value, asset selection, optimization
Citation: Garcesa A and Johnson N (2025) Co-optimizing microgrid asset sizing and dispatch with building automation and load control. Front. Energy Res. 13:1712690. doi: 10.3389/fenrg.2025.1712690
Received: 25 September 2025; Accepted: 27 October 2025;
Published: 20 November 2025.
Edited by:
Anderson Rodrigo De Queiroz, North Carolina Central University, United StatesReviewed by:
Victor Duraes De Faria, North Carolina State University, United StatesMatteo Nicoli, Polytechnic University of Turin, Italy
Copyright © 2025 Garcesa and Johnson. This is an open-access article distributed under the terms of the Creative Commons Attribution License (CC BY). The use, distribution or reproduction in other forums is permitted, provided the original author(s) and the copyright owner(s) are credited and that the original publication in this journal is cited, in accordance with accepted academic practice. No use, distribution or reproduction is permitted which does not comply with these terms.
*Correspondence: Arnel Garcesa, YWdhcmNlc2FAYXN1LmVkdQ==