 Guobin Wang1
 Shengwen Shu
- 1Electric Power Research Institute, State Grid Fujian Electric Power Co., Ltd., Fuzhou, China
- 2College of Electrical Engineering and Automation, Fuzhou University, Fuzhou, China
To address the issues of strong subjectivity and difficulty in feature extraction that are inherent to traditional frequency response analysis methods used for diagnosing transformer winding deformation, an intelligent diagnostic method is proposed based on Dynamic Time Warping (DTW) and a Multilayer Perceptron (MLP). First, the frequency response curve is normalized and segmented into multiple frequency bands to extract physically meaningful features. Subsequently, the Dynamic Time Warping algorithm is employed to perform nonlinear curve alignment and difference quantification processes, thereby enhancing robustness against frequency-axis misalignment and measurement noise. Finally, the extracted features are fed into a Multilayer Perceptron (MLP) model, which utilizes multilayer nonlinear mappings to automatically identify the deformation levels of the windings. Validation based on field measurement data indicates that the proposed method achieves significant improvements in diagnostic accuracy, balance, and robustness when compared with traditional correlation coefficient methods and other machine learning models. This approach enables high-precision automated diagnosis of transformer winding deformation, offering a physically interpretable reference for condition monitoring as well as intelligent operation and maintenance of power equipment.
1 Introduction
As power systems continue to evolve toward higher voltages, larger capacities, and increased intelligence, power transformers, as the core equipment responsible for energy conversion and transmission, play a critical role in grid safety, stability, and supply reliability (Qi et al., 2020). Under short-circuit faults and external impacts, transformer windings are prone to mechanical and thermal stresses under short-circuit and uneven loss conditions (Xiaoling et al., 2023). Under extreme operating conditions, transient electromagnetic forces may even cause a direct breakdown of the insulation medium, leading to severe short-circuit incidents within the winding (Ahn et al., 2016). In addition, winding deformation can alter the system’s resonant frequency characteristics, causing shifts in the frequency response curves and distortions in local electric fields (Yi et al., 2021), thereby accelerating insulation aging and overall system degradation. Therefore, high-precision and interpretable state recognition and fault diagnosis of transformer winding deformation are of great engineering and economic significance.
Common methods for detecting winding deformation include low-voltage short-circuit impedance measurement, DC resistance measurement, and frequency response analysis (FRA) (Beheshti Asl et al., 2025). Among them, FRA has been recognized by the International Electrotechnical Commission (IEC 60076-18:2012) as the preferred technique for winding deformation detection due to its high sensitivity to structural changes, wide measurement range, and operational convenience. The method compares the frequency response curves between the healthy and measured states to assess the structural integrity of the windings. However, traditional FRA analysis largely relies on expert experience for qualitative interpretation, such as observing peak shifts or curve trends, which is subjective and difficult to quantify under complex curve patterns. In recent years, machine-learning and deep-learning methods have been increasingly applied to FRA data (Liu et al., 2025; Tahir and Tenbohlen, 2023; Wang J. et al., 2023). Studies have shown that the selection of feature values determines the sensitivity and robustness of winding deformation diagnosis, with correlation coefficients, Euclidean distance, mean square error, and area difference commonly used as indicators (Ebrahim et al., 2010; Gonzales Arispe and Mombello, 2014). Moreover, different frequency bands exhibit varying sensitivity to structural changes: the low-frequency band mainly reflects inductive characteristics, the medium-frequency band is influenced by both inductive and capacitive components, and the high-frequency band is dominated by capacitive elements (Ni et al., 2020). Therefore, frequency-band-specific division and targeted feature mapping can enhance the accuracy and interpretability of FRA for multiple types of winding deformation.
To overcome limitations of traditional FRA methods, such as low efficiency, high error, and insufficient feature extraction capability, data-driven intelligent diagnostic methods have been introduced. On one hand, researchers have mapped signals into two-dimensional feature representations, enhancing structural sensitivity through statistical and temporal feature fusion. For example, Pengfei et al. constructed temporal feature mappings of transformer vibration signals based on Markov transition fields, effectively visualizing and amplifying differences in the feature space, providing strong support for subsequent deep learning modeling (Pengfei et al., 2021). On the other hand, machine learning and deep learning-based feature learning models have demonstrated great potential in analyzing complex electromagnetic time-series signals (Wang S. et al., 2023). Among them, dynamic time warping (DTW) is widely used for nonlinear sequence alignment and shape difference quantification. In areas such as speech recognition, gesture recognition, and data mining, DTW has demonstrated higher matching accuracy, superior classification performance, and stronger noise robustness compared with Euclidean distance (Salvador and Chan, 2007; Keogh and Ratanamahatana, 2005; Langfu et al., 2023). Therefore, DTW has been applied to FRA curve shape difference analysis to address frequency-axis misalignment, measurement noise, and instrument errors, thereby improving the precision and stability of deformation detection (Gao et al., 2023; Thango, 2025). Previous studies have demonstrated that DTW-based alignment and temporal-feature processing substantially improve the robustness and discrimination of condition-monitoring methods for transformer-related mechanical systems; for example, Yang et al. applied DTW to vibration-based transformer fault diagnosis and reported significant gains in fault discrimination and severity assessment (Yang et al., 2019).
Meanwhile, the multilayer perceptron (MLP), as a representative deep learning model, exhibits strong nonlinear fitting capability and high-dimensional feature integration capacity. It has been successfully applied in complex engineering problems, including multi-objective optimization (Dong et al., 2023), particle identification (Tolkachev et al., 2023), and software defect prediction (Sapna et al., 2023). These studies demonstrate the universality and robustness of MLP in modeling complex nonlinear relationships and high-dimensional feature spaces. In transformer equipment condition monitoring and vibration signal analysis, MLP models have also been shown to effectively capture sequence features and pattern differences, achieving high-precision fault type recognition (Hernandez et al., 2023; Minghui et al., 2023). Therefore, integrating the temporal difference quantification capability of DTW with the feature fusion strength of MLP holds promise for achieving both accuracy and interpretability in intelligent diagnosis of transformer winding deformation.
Building on this foundation, the present study proposes a transformer winding deformation diagnosis method integrating DTW and MLP. Beginning with frequency response curves, the method extracts physically meaningful features across multiple frequency bands through segmentation and normalization. Morphological differences between curves are quantified using the DTW algorithm, and the resulting differential features are input into the MLP model to enable automated multi-level identification and classification of winding deformations. The major innovations and contributions of this study are summarized as follows:
1. Frequency-specific segmentation and feature mapping: To address the electromagnetic response characteristics of windings in different frequency ranges, the spectrum is divided into low-, medium-, and high-frequency bands, enabling targeted sensitivity analysis for various deformation types.
2. DTW-based morphological feature extraction: The DTW algorithm is employed for nonlinear alignment and difference measurement of frequency response curves, effectively mitigating feature drift caused by frequency-axis misalignment, measurement noise, and instrument errors.
3. MLP-based intelligent classification model: The MLP learns the distribution of DTW-derived features through multilayer nonlinear mapping, enabling automated and precise classification of winding conditions.
4. Multi-indicator comprehensive evaluation framework: Multidimensional performance metrics, including accuracy, macro-average F1-score, and weighted-average F1-score, are employed to systematically validate and assess the overall performance and class balance of the model.
The remainder of this paper is organized as follows: Section 2 introduces the dataset, preprocessing workflow, DTW feature extraction procedure, and MLP architecture. Section 3 presents the experimental setup, comparative results, and performance analysis. Finally, Section 4 summarizes the conclusions and discusses directions for future improvement.
2 Methodology
This study proposes a transformer winding deformation diagnosis method based on DTW and MLP. The core framework, shown in Figure 1, consists of three main steps: data preprocessing with frequency band segmentation, DTW feature extraction, and MLP design and training.

Figure 1. Overall framework flowchart of the proposed method.
2.1 Data preprocessing
To ensure comparability across samples and analytical stability, the raw data were preprocessed using standardized procedures:
1. Amplitude normalization: Each curve was normalized to the [0, 1] range to eliminate variations caused by measurement amplitude differences and instrument inconsistencies.
2. Frequency alignment and band segmentation: Due to variations in frequency sampling points across samples, each frequency response curve was first mapped onto a unified frequency grid using linear interpolation, ensuring comparability across all sample data. Based on the electrical characteristics of transformer windings and prior experimental analysis, the overall frequency range (1 kHz–1,000 kHz) was divided into three key bands. The electrical characteristics of each band, their sensitivity to different deformation types, and the interpolation parameters applied within each band are summarized in Table 1. Classification features were derived from DTW distances between curves, which quantify morphological differences that correspond physically to changes in the winding’s inductance–capacitance distribution. Specifically, low-frequency DTW differences indicate overall winding displacement, mid-frequency differences reflect inter-winding capacitance changes, and high-frequency differences capture local short-circuits or lead displacements. By measuring the nonlinear alignment cost between frequency response morphologies, DTW provides a compact, physically meaningful representation of structural distortions such as displacement, bulging, or looseness.
3. Unified representation: Within each frequency band, all curves are mapped onto a fixed frequency grid via linear interpolation, generating amplitude vectors of uniform length. This process ensures direct morphological comparability and consistent feature extraction across curves obtained from different transformers and operating conditions, thereby establishing a reliable foundation for subsequent classifier training

Table 1. Frequency band division for winding deformation diagnosis.
2.2 Dynamic time warping (DTW) algorithm
The core methodological workflow comprises three stages: (1) extraction of physically meaningful subsignals via frequency band segmentation; (2) quantification of curve morphological differences using the DTW algorithm; and (3) state recognition through an MLP. The technical relationships among these stages are illustrated in Figure 1.
To quantify morphological differences in frequency response curves, DTW is employed. The algorithm measures similarity between sequences of varying lengths by dynamically determining the optimal nonlinear alignment path that minimizes the cumulative distance. DTW exhibits strong robustness to scaling and phase shifts along the frequency axis, making it particularly well suited for handling curve displacements and distortions caused by measurement errors or instrument response.
Given two amplitude sequences X = (x1, x2, xn) and Y = (y1, y2, ym), the core computation involves the following steps:
1. Construct the distance matrix D. Calculate the base distance between all pairs of points in the two sequences to form an n × m distance matrix D. Each element d(i,j) represents the distance between xi and yj, typically computed using the Euclidean distance:
2. Calculate the cumulative distance matrix C. C (i,j) denotes the minimum cumulative distance among all possible paths from the starting point to the current point (i,j):
Boundary conditions are:
3. Backtracking to find the optimal path. Starting from the endpoint C (m,n), trace backward to find the path with the smallest cumulative cost until reaching the starting point. This path represents the optimal alignment between the two sequences.
The optimal path must satisfy the following constraints:
1. Boundary conditions. The path begins at (1,1) and end at (m,n), ensuring alignment of sequence endpoints.
2. Monotonicity and Continuity. The row index i and column index j along the path must increase monotonically over time. That is, each step on the path can only move right (i, j+1), down (i+1, j), or diagonally down (i+1, j+1), preserving the chronological order of events.
3. Step Size Constraints. In practice, windowing constraints limit the maximum deviation from the diagonal, improving computational efficiency and preventing excessive warping.
Figure 2A shows two one-dimensional sequences of differing lengths and phases. Figure 2B depicts the computational process: the Euclidean distances between point pairs form a base distance matrix (visualized as shades of color blocks), and dynamic programming is applied to compute the cumulative distance matrix, yielding the optimal curved alignment path. The path’s shape reflects sequence similarity: a path closer to the diagonal indicates higher similarity, whereas a more convoluted path indicates greater differences.

Figure 2. Core workflow of the DTW algorithm. (A) Input time series of different lengths and phases. (B) Distance matrix and optimal alignment path computed by dynamic time warping.
The DTW distance serves as a discriminative feature for each curve and is subsequently input into the MLP model. This approach also provides physical interpretability, facilitating analysis of the sensitivity of different frequency bands to various winding deformations.
2.3 Multilayer perceptron (MLP) classifier
To achieve accurate diagnosis of transformer winding conditions, the MLP is employed as the core classification model. As a typical feedforward neural network, the MLP exhibits strong nonlinear mapping and function approximation capabilities, allowing it to learn complex decision boundaries from input features. The input features in our work are 1-D vectors derived from DTW distances, rather than images or temporal sequences, making Convolutional Neural Networks or Transformers less suitable for this task. In contrast, the MLP is lightweight and interpretable, and it is particularly well-suited for industrial deployment on edge devices. Combined with DTW-derived features, which already provide compact and discriminative morphology-difference information, the MLP effectively distinguishes among different winding states while maintaining a good balance between interpretability and model complexity.
The core structure of the MLP comprises an input layer, one or more hidden layers, and an output layer, with fully connected links between consecutive layers. The overall network architecture is illustrated in Figure 3.

Figure 3. Basic model of multilayer perceptron.
The input layer is fed with curve-morphology-difference feature vectors computed by DTW, where each neuron corresponds to a specific feature component. The hidden layer performs a weighted summation of the input information and applies a nonlinear activation function for transformation, as expressed by:
where Wih denotes the connection-weight matrix between the input and hidden layers, bh is the bias vector, f (·) is the nonlinear activation function (e.g., ReLU or Sigmoid), and h is the hidden layer output vector.
The output layer applies a linear transformation to the hidden-layer output and converts the results into a probability distribution over class labels through the Softmax function:
where Who and bo represent the weight matrix and bias vector between the hidden and output layers, respectively, while y denotes the predicted probability vector corresponding to different winding states. The Softmax normalization ensures that the sum of all output probabilities equals one, with each component indicating the likelihood that the sample belongs to the corresponding category.
Through this network architecture, the MLP maps the DTW-derived distance features to corresponding winding-condition categories, thereby achieving high-accuracy classification performance. This approach not only leverages the morphological differences extracted by DTW but also improves diagnostic accuracy and robustness through the nonlinear mapping capability of the neural network.
2.4 Algorithm workflow and evaluation metrics
To systematically and objectively evaluate the performance of the proposed DTW-MLP-based transformer winding fault diagnosis method, this section presents the overall experimental setup and the employed evaluation metrics.
2.4.1 Experimental process design
The experiments were conducted in strict accordance with standard machine-learning procedures to ensure the reproducibility and comparability of the results. The main steps are summarized as follows:
1. Data Partitioning: The preprocessed frequency-response dataset (comprising DTW features and corresponding labels) was divided into training and independent test sets. The training set was utilized for model-parameter learning and optimization, whereas the test set was reserved for final performance evaluation. The two datasets were mutually exclusive to prevent any potential information leakage.
2. Model Training and Optimization: Model training and optimization were carried out on the training set using the MLP classifier. Key hyperparameters (e.g., learning rate, number of hidden-layer neurons, batch size) were optimized through grid search. To enhance experimental stability, each training procedure was repeated multiple times, and the averaged performance metrics were adopted as the final evaluation criterion.
3. Model Testing and Performance Evaluation: The trained and parameter-optimized model was applied to the independent test set to predict unseen samples. The predictions were compared with the true labels, and multiple evaluation metrics were computed to quantify model performance.
4. Result Analysis and Visualization: Confusion matrices and classification reports were generated based on the test results to assess the model’s diagnostic capability across different fault-severity levels, considering both overall performance and class-wise discrimination.
2.4.2 Evaluation metrics
This study employs a set of widely used classification performance metrics to comprehensively evaluate the diagnostic capability of the model from multiple perspectives. Six commonly used evaluation metrics are considered in this study, as detailed below:
1. Recall
2. Precision
3. Accuracy
4. F1-score
5. Macro-average F1
6. Weighted-average F1-score
where Supporti is the number of true samples of category i in the test set.
3 Case analysis
3.1 Dataset and experimental workflow
3.1.1 Dataset description
The dataset used in this study originates from real-world field test data collected by the Fujian Provincial Power Grid Company in China. It encompasses normal winding conditions and three distinct deformation levels (mild, significant, and severe). The dataset already covers transformers of various voltage levels (110 kV, 220 kV and 500 kV) and was collected using multiple mainstream testing instrument, ensuring data diversity and engineering representativeness. To mitigate class imbalance caused by sample quantity differences across deformation levels, data augmentation was applied to minority-class samples using Generative Adversarial Networks, thereby enhancing model-training stability. To eliminate any risk of data leakage or synthetic overfitting, Generative Adversarial Networks based augmentation was strictly applied to the training set only; the independent test set remained entirely original, ensuring an engineering-realistic evaluation scenario.
3.1.2 Experimental workflow and evaluation benchmarks
To fairly evaluate model performance, a stratified random sampling strategy was employed to divide the dataset into a training set and an independent test set at a 7:3 ratio. The test set included 40 normal-state samples, 15 mildly deformed samples, 13 significantly deformed samples, and 7 severely deformed samples, reflecting the actual occurrence frequency of different fault levels in the field. Although the number of severe-deformation samples is limited, this distribution preserves engineering realism while maintaining sufficient statistical significance. To mitigate potential bias from class imbalance, weighted F1 was adopted as a key evaluation metric.
On the training set, grid search was employed to optimize key hyperparameters of the MLP (e.g., learning rate, number of hidden layer nodes). Model performance was evaluated by comparing it with multiple benchmark methods, including:
1. Traditional method: Correlation coefficient approach.
2. Classical machine learning methods: K-Nearest Neighbors (KNN), Support Vector Machine (SVM), Bootstrap Aggregating (Bagging), and Random Forest (RF).
Evaluation metrics include accuracy, precision, recall, F1-score, as well as macro-average F1-score and weighted-average F1 for assessing model balance from a global perspective.
3.2 Results and analysis
To comprehensively assess the performance advantages of the proposed DTW–MLP method, a systematic quantitative comparison was performed against several mainstream diagnostic approaches.
3.2.1 Quantitative Results Analysis
Table 2 presents the overall performance comparison of different methods on the independent test set, while Figure 4 illustrates the accuracy comparison among various models.

Table 2. Overall performance comparison of different methods.

Figure 4. Comparison of accuracy across different methods.
The comparison of accuracies across different methods reveals that:
1. The proposed method demonstrates overall superior performance. The DTW-MLP model achieves the highest values across key performance metrics, including accuracy, macro-average F1 score, and weighted-average F1 score, indicating its strong and comprehensive diagnostic capability for winding deformation identification.
2. Traditional methods show limited effectiveness. The correlation coefficient method significantly underperforms data-driven approaches across all metrics, highlighting its reliance on manual expertise and threshold judgments, which struggle to effectively handle complex, nonlinear frequency response curve characteristics.
3. The superiority of data-driven models is validated. All machine learning-based models significantly outperform traditional methods, demonstrating the high application potential of intelligent diagnostic approaches in transformer winding deformation recognition.
4. The proposed features demonstrate remarkable synergy with the models. Under identical DTW feature inputs, the MLP model outperforms other machine learning algorithms, highlighting its strong nonlinear fitting and feature-learning capabilities in extracting discriminative information embedded within the frequency response curves.
3.2.2 Visual analysis of classification results
To provide a more intuitive illustration of the classification performance of different methods, this study constructed a confusion matrix (Figure 5). This visualization analyzes classification results from a sample-distribution perspective, providing an intuitive complement to the quantitative evaluation.

Figure 5. Comparison of confusion matrices for different methods Label description: 1 = Normal, 2 = Mild deformation, 3 = Moderate deformation, 4 = Severe deformation. (A) DTW-MLP. (B) DTW-KNN. (C) DTW-SVM. (D) DTW-Bagging. (E) DTW-RF. (F) Corr-MLP.
Based on the confusion matrix comparison shown in Figure 5, the following observations can be drawn:
1. Proposed Method (DTW-MLP): Its confusion matrix most closely resembles an ideal identity matrix, with the main diagonal—representing correct classifications—exhibiting the highest concentration and intensity. This indicates superior classification accuracy across all categories.
2. Benchmark Models: Their confusion matrices display more pronounced off-diagonal elements corresponding to misclassifications. For instance, the DTW–SVM model tends to misclassify some evidently deformed samples as severely deformed, whereas the DTW–RF model frequently confuses mildly deformed and normal windings. This visualization highlights the limited capability of these models in handling complex and overlapping decision boundaries.
3. Traditional Methods: Their confusion matrices show the most dispersed patterns, with misclassifications distributed across all categories. This finding reflects their relatively low baseline performance, further underscoring the necessity of adopting data-driven diagnostic approaches.
3.2.3 Category-specific performance analysis
To further examine the specific diagnostic performance of the proposed method across different fault categories, Table 3 presents the detailed classification report of the DTW-MLP model.
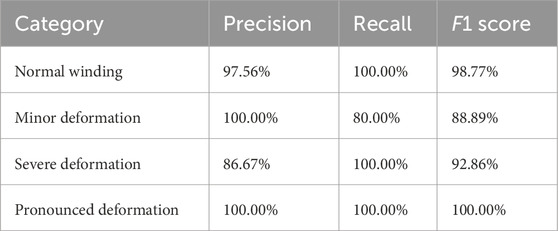
Table 3. Detailed performance of DTW-MLP.
As shown in Table 3:
1. Accurate identification of severe faults with zero false negatives: The model achieves a recall of 100% for severe deformation, indicating that all severe faults are correctly detected. This demonstrates the model’s high reliability, making it suitable as the core component of an intelligent safety-warning system.
2. High-confidence diagnosis of early-stage faults: The model attains 100% precision for minor deformation, completely eliminating false positives. This high-confidence decision mechanism is particularly valuable in industrial scenarios requiring exceptional diagnostic reliability.
3. Excellent model balance and generalization capability: The macro-average F1-score (95.13%) and weighted-average F1-score (95.88%) exhibit high consistency, confirming that the model maintains balanced and precise recognition across all fault categories.
3.3 Analysis and interpretation of experimental results
Based on the experimental findings, the proposed DTW–MLP method demonstrates excellent classification performance and balanced accuracy across all levels of winding deformation. However, considering the characteristics of the dataset and real-world application conditions, several aspects warrant further discussion.
3.3.1 Recognition capability across deformation levels
The model achieves 100% recognition accuracy for both obvious and severe deformation categories. This superior performance can be attributed to the substantial geometric and electromagnetic parameter changes induced by medium-to-high-level deformations, which cause evident morphological variations in the frequency response curve—such as resonance frequency shifts and abrupt amplitude fluctuations. The DTW algorithm effectively captures these nonlinear morphological differences, providing the MLP with highly discriminative feature representations.
In contrast, for mild deformation samples, although the model maintains 100% precision (i.e., no false positives), its recall is relatively lower, at 80%, with a few missed detections. This is primarily due to the extremely subtle variations in frequency response curves at early fault stages, where morphological differences may approach the noise threshold of measurement equipment. Consequently, the discriminative power of DTW-extracted features diminishes in such cases. We note that this observation reflects engineering reality, as detecting early-stage winding deformation remains a known challenge in the power industry. Nevertheless, the model’s ability to ensure zero false alarms highlights its strong reliability in preventive maintenance scenarios, where diagnostic credibility is prioritized over early sensitivity.
3.3.2 Balanced performance and robustness
The near-consistent macro-average (95.13%) and weighted-average F1-scores (95.88%) indicate that the model maintains stable and balanced recognition performance despite dataset imbalance. Unlike many conventional algorithms prone to majority-class bias, the DTW-MLP model provides equitable diagnostic attention to all fault states. This capability stems from the MLP’s nonlinear fitting power, which allows efficient extraction of discriminative information from minority-class samples within high-dimensional DTW feature spaces.
3.3.3 Visualization and interpretability of classification behavior
The confusion matrix comparison in Figure 5 further supports these findings. The DTW-MLP model exhibits the sparsest and most uniformly distributed misclassifications, with no evident bias across fault categories. In contrast, models such as DTW-SVM and DTW-RF display notable confusion patterns—for instance, misclassifying obvious deformation as severe deformation. This suggests that the MLP establishes more refined and robust decision boundaries, enabling it to distinguish between fault states that exhibit overlapping morphological features.
3.3.4 Influence of dataset diversity and future work
The dataset used in this study originates from real-world transformer test data across various voltage levels, measurement devices, and operating conditions, ensuring high engineering relevance. However, the limited sample size in certain categories may still constrain generalization under rare operating scenarios. To partially mitigate this, Generative Adversarial Networks were employed for minority-class augmentation.
Future work should proceed in two directions:
1. Dataset expansion and augmentation: Continuously collecting high-quality field data and leveraging advanced augmentation strategies to improve class balance, particularly for rare fault conditions.
2. Advanced learning paradigms: Incorporating emerging methods such as few-shot learning and meta-learning to enhance model robustness and adaptability under data-scarce conditions.
In summary, the DTW-MLP framework achieves high diagnostic accuracy, strong robustness, and excellent category balance in transformer winding condition assessment. Moreover, its morphology-based feature extraction strategy offers strong physical interpretability, bridging the gap between data-driven intelligence and engineering insights.
4 Conclusion
This study addresses the limitations of traditional frequency response analysis in transformer winding deformation diagnosis, particularly its strong subjectivity and the difficulty of effective feature extraction. To overcome these challenges, this work proposes an intelligent diagnostic framework that integrates Dynamic Time Warping (DTW) with a Multilayer Perceptron (MLP). Through frequency-band-specific segmentation and data-driven feature extraction, the method achieves high-precision recognition of winding deformations across transformers of various voltage levels.
The experimental results demonstrate the following key findings:
1. Significantly enhanced diagnostic performance. The proposed DTW-MLP framework achieves 96.00% classification accuracy, 95.13% macro-average F1 score, and 95.88% weighted-average F1 score on an independent test set, markedly outperforming both traditional correlation-coefficient-based methods and other mainstream machine learning models.
2. Balanced recognition across fault categories. The model maintains high classification accuracy for all deformation levels, achieving 100% recognition for both obvious and severe deformation states. The small gap between macro-average F1-score and weighted-average F1 scores confirms strong robustness and balanced diagnostic capability under imbalanced data conditions.
3. Physically interpretable feature extraction. The DTW-derived features effectively capture morphological differences between frequency response curves, reflecting the underlying electromagnetic response mechanisms across frequency bands and providing clear physical interpretability for the model’s decision process.
In summary, the proposed DTW–MLP diagnostic approach demonstrates high accuracy, strong robustness, and clear physical interpretability, demonstrating both theoretical significance and practical feasibility for transformer condition monitoring. This framework establishes a promising foundation for future research on intelligent fault diagnosis and predictive maintenance in power-system applications.
Data availability statement
The original contributions presented in the study are included in the article/Supplementary Material, further inquiries can be directed to the corresponding author.
Author contributions
GW: Conceptualization, Funding acquisition, Methodology, Supervision, Writing – original draft. KW: Data curation, Formal Analysis, Investigation, Writing – review and editing. XX: Resources, Software, Validation, Writing – review and editing. GS: Investigation, Visualization, Writing – review and editing. YL: Data curation, Investigation, Validation, Writing – original draft. SS: Funding acquisition, Methodology, Project administration, Supervision, Writing – review and editing.
Funding
The authors declare that financial support was received for the research and/or publication of this article. This work was supported by the Science and Technology Projects of State Grid Fujian Electric Power Co., Ltd. (No. 521304220108).
Conflict of interest
Authors GW, KW, XX, and GS were employed by Electric Power Research Institute, State Grid Fujian Electric Power Co., Ltd.
The remaining authors declare that the research was conducted in the absence of any commercial or financial relationships that could be construed as a potential conflict of interest.
The authors declare that this study received funding from State Grid Fujian Electric Power Co., Ltd.. The funder had the following involvement in the study: collection, analysis, interpretation of data and the writing of this article.
Generative AI statement
The authors declare that no Generative AI was used in the creation of this manuscript.
Any alternative text (alt text) provided alongside figures in this article has been generated by Frontiers with the support of artificial intelligence and reasonable efforts have been made to ensure accuracy, including review by the authors wherever possible. If you identify any issues, please contact us.
Publisher’s note
All claims expressed in this article are solely those of the authors and do not necessarily represent those of their affiliated organizations, or those of the publisher, the editors and the reviewers. Any product that may be evaluated in this article, or claim that may be made by its manufacturer, is not guaranteed or endorsed by the publisher.
References
Ahn, H.-M., Kim, S.-Y., Kim, J.-K., Oh, Y.-H., and Hahn, S.-C. (2016). Numerical investigation for transient electromagnetic force computation of power transformer during short-circuit condition. Int. J. Appl. Electromagn. Mech. 52 (3-4), 1141–1149. doi:10.3233/jae-162093
Beheshti Asl, M., Fofana, I., Meghnefi, F., Brahami, Y., and Souza, JPDC (2025). A comprehensive review of transformer winding diagnostics: integrating frequency response analysis with machine learning approaches. Energies 18 (5), 1209. doi:10.3390/en18051209
Dong, L., Wang, G., and Qi, X. (2023). Power transformer winding deformation diagnosis based on the sum of two-way shortest distance. IEEJ Trans. Electr. Electron. Eng. 18 (12), 1869–1875. doi:10.1002/tee.23925
Ebrahim, R., Mehdi, J., and Stefan, T. (2010). Mathematical comparison methods to assess transfer functions of transformers to detect different types of mechanical faults. IEEE Trans. Power Deliv. 25 (4), 2544–2555. doi:10.1109/tpwrd.2010.2054840
Gao, H., Huo, X., Hu, R., and He, C. (2023). Optimized DTW-resnet for fault diagnosis by data augmentation toward unequal length time series. IEEE Trans. Instrum. Meas. 72, 1–11. doi:10.1109/tim.2023.3318690
Gonzales Arispe, J. C., and Mombello, E. E. (2014). Detection of failures within transformers by FRA using multiresolution decomposition. IEEE Trans. Power Deliv. 29 (3), 1127–1137. doi:10.1109/tpwrd.2014.2306674
Hernandez, J. L. C., Ojeda, D. L. A., Manzano, M. A. I., Sanchez, J. P. A., Rodriguez, M. V., and Martinez, D. C. (2023). Short-circuit damage diagnosis in transformer windings using quaternions: severity assessment through current and vibration signals. Appl. Sci. 13 (23), 12622. doi:10.3390/app132312622
Keogh, E., and Ratanamahatana, C. A. (2005). Exact indexing of dynamic time warping. Knowl. Inf. Syst. 7 (3), 358–386. doi:10.1007/s10115-004-0154-9
Langfu, C., Qingzhen, Z., Yan, S., Liman, Y., Yixuan, W., Junle, W., et al. (2023). A method for satellite time series anomaly detection based on fast-DTW and improved-KNN. Chin. J. Aeronautics 36 (2), 149–159. doi:10.1016/j.Cja.2022.05.001
Liu, H., Yang, K., Qian, G., Hu, J., Dai, W., Zhu, L., et al. (2025). Gramian angular field–gramian adversial Network–ResNet34: high-accuracy fault diagnosis for transformer windings with limited samples. Energies 18 (16), 4329. doi:10.3390/en18164329
Minghui, D., Hao, M., Jufang, W., Liqing, L., Xiaoguang, M., Chuang, Y., et al. (2023). Study on vibration characteristics of transformer winding. J. Phys. Conf. Ser. 2477 (1), 012007. doi:10.1088/1742-6596/2477/1/012007
Ni, J., Zhao, Z., Tan, S., Chen, Y., Yao, C., and Tang, C. (2020). The actual measurement and analysis of transformer winding deformation fault degrees by FRA using mathematical indicators. Electr. Power Syst. Res. 184, 106324. doi:10.1016/j.epsr.2020.106324
Pengfei, W., Gang, Y., Huafeng, W., Zhanlong, Z., and Rui, X. (2021). Research on feature extraction method of converter transformer vibration signal based on markov transition field. IOP Conf. Ser. Earth Environ. Sci. 647 (1), 012018. doi:10.1088/1755-1315/647/1/012018
Qi, B., Zhang, P., Rong, Z., and Li, C. (2020). Differentiated warning rule of power transformer health status based on big data mining. Int. J. Electr. Power Energy Syst. 121, 106150. doi:10.1016/j.ijepes.2020.106150
Salvador, S., and Chan, P. (2007). Toward accurate dynamic time warping in linear time and space. Intell. Data Anal. 11 (5), 561–580. doi:10.3233/ida-2007-11508
Sapna, J., Ali, N., Mudita, U., Deepali, G., Roobaea, A., Bahodir, M., et al. (2023). Machine learning-based defect prediction model using multilayer perceptron algorithm for escalating the reliability of the software. J. Supercomput. 80 (7), 10122–10147. doi:10.1007/s11227-023-05836-6
Tahir, M., and Tenbohlen, S. (2023). Transformer winding fault classification and condition assessment based on random forest using FRA. Energies 16 (9), 3714. doi:10.3390/en16093714
Thango, B. A. (2025). Six sigma-based frequency response analysis for power transformer winding deformation. Appl. Sci. 15 (7), 3951. doi:10.3390/app15073951
Tolkachev, G., Korobitsin, A., and Aparin, A. (2023). Multilayer perceptron neural model for particle identification in MPD. Phys. Atomic Nucl. 86 (5), 845–849. doi:10.1134/s1063778823050381
Wang J., J., Xing, Y., Ma, X., Zhao, Z., and Yang, L. (2023). Numerical investigations for vibration and deformation of power transformer windings under short-circuit condition. Energies 16 (14), 5318. doi:10.3390/en16145318
Wang, S., Xie, F., Yang, F., Qiu, S., Liu, C., and Li, T. (2023). Diagnosis of disc space variation fault degree of transformer winding based on K-Nearest neighbor algorithm. Energy Eng. 120 (10), 2273–2285. doi:10.32604/ee.2023.030107
Xiaoling, Y., Youbo, T., Haotian, W., Xiaolin, W., Ying, Z., and Penghong, G. (2023). Thermal analysis and optimization on a transformer winding based on non-uniform loss distribution. Appl. Therm. Eng. 226, 120296. doi:10.1016/j.Applthermaleng.2023.120296
Yang, R., Zhang, D., Li, Z., Yang, K., Mo, S., and Li, L. (2019). Mechanical fault diagnostics of power transformer On-Load tap changers using dynamic time warping. IEEE Trans Instrum. Meas. 68 (9), 3119–3127. doi:10.1109/tim.2018.2872385
Keywords: transformer winding deformation, frequency response analysis, dynamic time warping, multilayer perceptron, intelligent diagnosis
Citation: Wang G, Wang K, Xu X, Shi G, Lu Y and Shu S (2025) Transformer winding deformation diagnosis method based on dynamic time warping and multilayer perceptron. Front. Energy Res. 13:1731410. doi: 10.3389/fenrg.2025.1731410
Received: 28 October 2025; Accepted: 18 November 2025;
Published: 04 December 2025.
Edited by:
Yalin Wang, Shanghai Jiao Tong University, ChinaCopyright © 2025 Wang, Wang, Xu, Shi, Lu and Shu. This is an open-access article distributed under the terms of the Creative Commons Attribution License (CC BY). The use, distribution or reproduction in other forums is permitted, provided the original author(s) and the copyright owner(s) are credited and that the original publication in this journal is cited, in accordance with accepted academic practice. No use, distribution or reproduction is permitted which does not comply with these terms.
*Correspondence: Shengwen Shu, c2h1c2hlbmd3ZW5AZnp1LmVkdS5jbg==