 Vijay Kumar
 John H. Stewart IV
- 1Department of Interdisciplinary Oncology, Stanley S. Scott Cancer Center, School of Medicine, Louisiana State University Health Science Center (LSUHSC), New Orleans, LA, United States
- 2Louisiana State University- Louisiana Children’s Medical Center, Stanley S. Scott, School of Medicine, Louisiana State University Health Science Center (LSUHSC), New Orleans, LA, United States
Molecular carcinogenesis is a multistep process that involves acquired abnormalities in key biological processes. The complexity of cancer pathogenesis is best illustrated in the six hallmarks of the cancer: (1) the development of self-sufficient growth signals, (2) the emergence of clones that are resistant to apoptosis, (3) resistance to the antigrowth signals, (4) neo-angiogenesis, (5) the invasion of normal tissue or spread to the distant organs, and (6) limitless replicative potential. It also appears that non-resolving inflammation leads to the dysregulation of immune cell metabolism and subsequent cancer progression. The present article delineates immunometabolic reprogramming as a critical hallmark of cancer by linking chronic inflammation and immunosuppression to cancer growth and metastasis. We propose that targeting tumor immunometabolic reprogramming will lead to the design of novel immunotherapeutic approaches to cancer.
1 Introduction
Cancer is the second leading cause of death worldwide as 10 million deaths resulted from cancer in 2020 and 70% of cancer deaths occurred in developing or low-middle-income countries (LMICs). Furthermore, it is projected that the incidence of cancer will increase to 28.4 million cases in 2040 (1). Sub-Saharan countries will witness a 92% cancer increase between 2020 and 2040. Several factors contribute to the rising incidence of cancer in these countries, including environmental pollution, the adoption of western diets, increased alcohol uptake, lack of exercise, and increased tobacco use.
Advances in medicine have now established that cancer cells differ from normal cells in many ways. For example, cancer cells exhibit uncontrolled cell division and proliferation, never mature, ignore signals required for the orderly progression of the cell cycle, cell death (apoptosis), specialization, and shedding. In addition, cancer cells express neoantigens and evade the host’s immune recognition (2, 3). Hence, cancer cells develop intratumoral heterogeneity, including altered cellular architecture/morphology, physiology (including their metabolism), subtypes, and evade cell death and their immune recognition (4–7). Additionally, nuclear compartmentalization (chromatin re-organization) in the tumor microenvironment (TME) regulates the gene expression that controls many processes, including immune cell development and programing, discussed in detail elsewhere (8–10). Furthermore, extrachromosomal DNAs (ecDNAs) are emerging as crucial mediators of cancer pathogenesis, gene regulation and epxression, and emerging treatment resistance (11–14). For example, ecDNAs promote increased oncogene expression and subsequent poor prognosis in many cancers (15–18).
Further development in the field led to the recognition of the six hallmarks of cancers almost 20 years ago (19, 20). Metabolic reprogramming among cancer cells and immune escape were also included later as additional hallmarks (21). Many reviews have further emphasized cancer and immune cell metabolism as a foundation mechanism for tumor immunology (22–27). For example, DePeaux and Delgoffe have discussed in detail the importance of decreasing TME metabolic barriers to increase the efficacy of tumor immunotherapy, including oncolytic viral therapy (OVT) (22). Whereas, Leone and Powell have discussed the metabolism of immune cells, specifically T cells, in the TME and exploiting differential metabolic plasticity for increasing the efficacy of immune checkpoint inhibitors (ICIs) (23). Hence, immunometabolism in the TME is critical in tumor immunopathogenesis, metastasis, and efficacy of existing immunotherapies. Hanahan recently upgraded the list of cancer hallmarks to include canonical and prospective characteristics (28). Different metabolic determinants of tumor initiation have been identified and discussed in detail (29). Therefore, we propose to add tumor-supportive immunometabolic reprogramming to the list of cancer hallmarks. The work herein discusses immunometabolic reprogramming of tumor-infiltrating immune cells as a critical hallmark of cancer progression.
2 Immune surveillance failure in cancer
Immune surveillance protects the host from endogenous and exogenous threats, including cancer development, infections, and premature aging (Figure 1) (30–34). However, aging and certain medications (antibiotics and antivirals) dysregulate immune surveillance to induce a tumor supportive environment (35–38). The immune system-mediated patrolling and monitoring to prevent cancer is called cancer or tumor immunosurveillance (39, 40). Tumor immune surveillance (immunosurveillance) requires tumor cell-derived molecules, including heat-shock proteins (HSPs) and double-stranded DNA (ds-DNA), which are recognized by pattern recognition receptors (PRRs) (41, 42). For example, CD91 (a receptor for HSP gp96)is crucial in cancer immune surveillance and cancer arising in the absence of CD91 are highly immunogenic (42, 43). However, the tumor microenvironment (TME) supports immunosurveillance escape and therefore supports cancer growth, differentiation, and metastasis (Figure 1) (44, 45). For example, TME T cells induce galectin-9 secretion from tumor cells derived from various malignant tumors. The released galectin-9 suppresses the antitumor cytotoxic activity of CD8+ T and natural killer (NK) cells (46). Galectin-9 in cancer cells combines with V-domain Ig-containing suppressor of T cell activation (VISTA, an immune checkpoint protein) to support the protumorigenic immunosuppressive TME (46, 47). The transforming growth factor-β (TGF-β) via TGF-β receptors (TGF-βRs) and suppressor of mothers against decapentaplegic-3 (smad-3) protein induce the VISTA expression on cancer and T cells in the TME to promote immunosuppression. TGF-β and VISTA mediate immunosuppression by polarizing naïve T cells to regulatory T cells (Tregs) and pro-inflammatory M1 macrophages to M2 macrophages by increasing the SNAIL or snail family transcriptional repressor 1 (SNAI1) expression and increasing the myeloid-derived suppressor cells (MDSCs) activity (48–52). Thus, cancer cells and immune cells in the TME coordinate to create a tumor suppressive tumor immune microenvironment (TIME) for the growth, division, and metastasis of cancer cells. Cancer cell metabolism also plays a significant role in escaping from tumor immune surveillance via different mechanisms, including altering immunometabolic reprogramming.
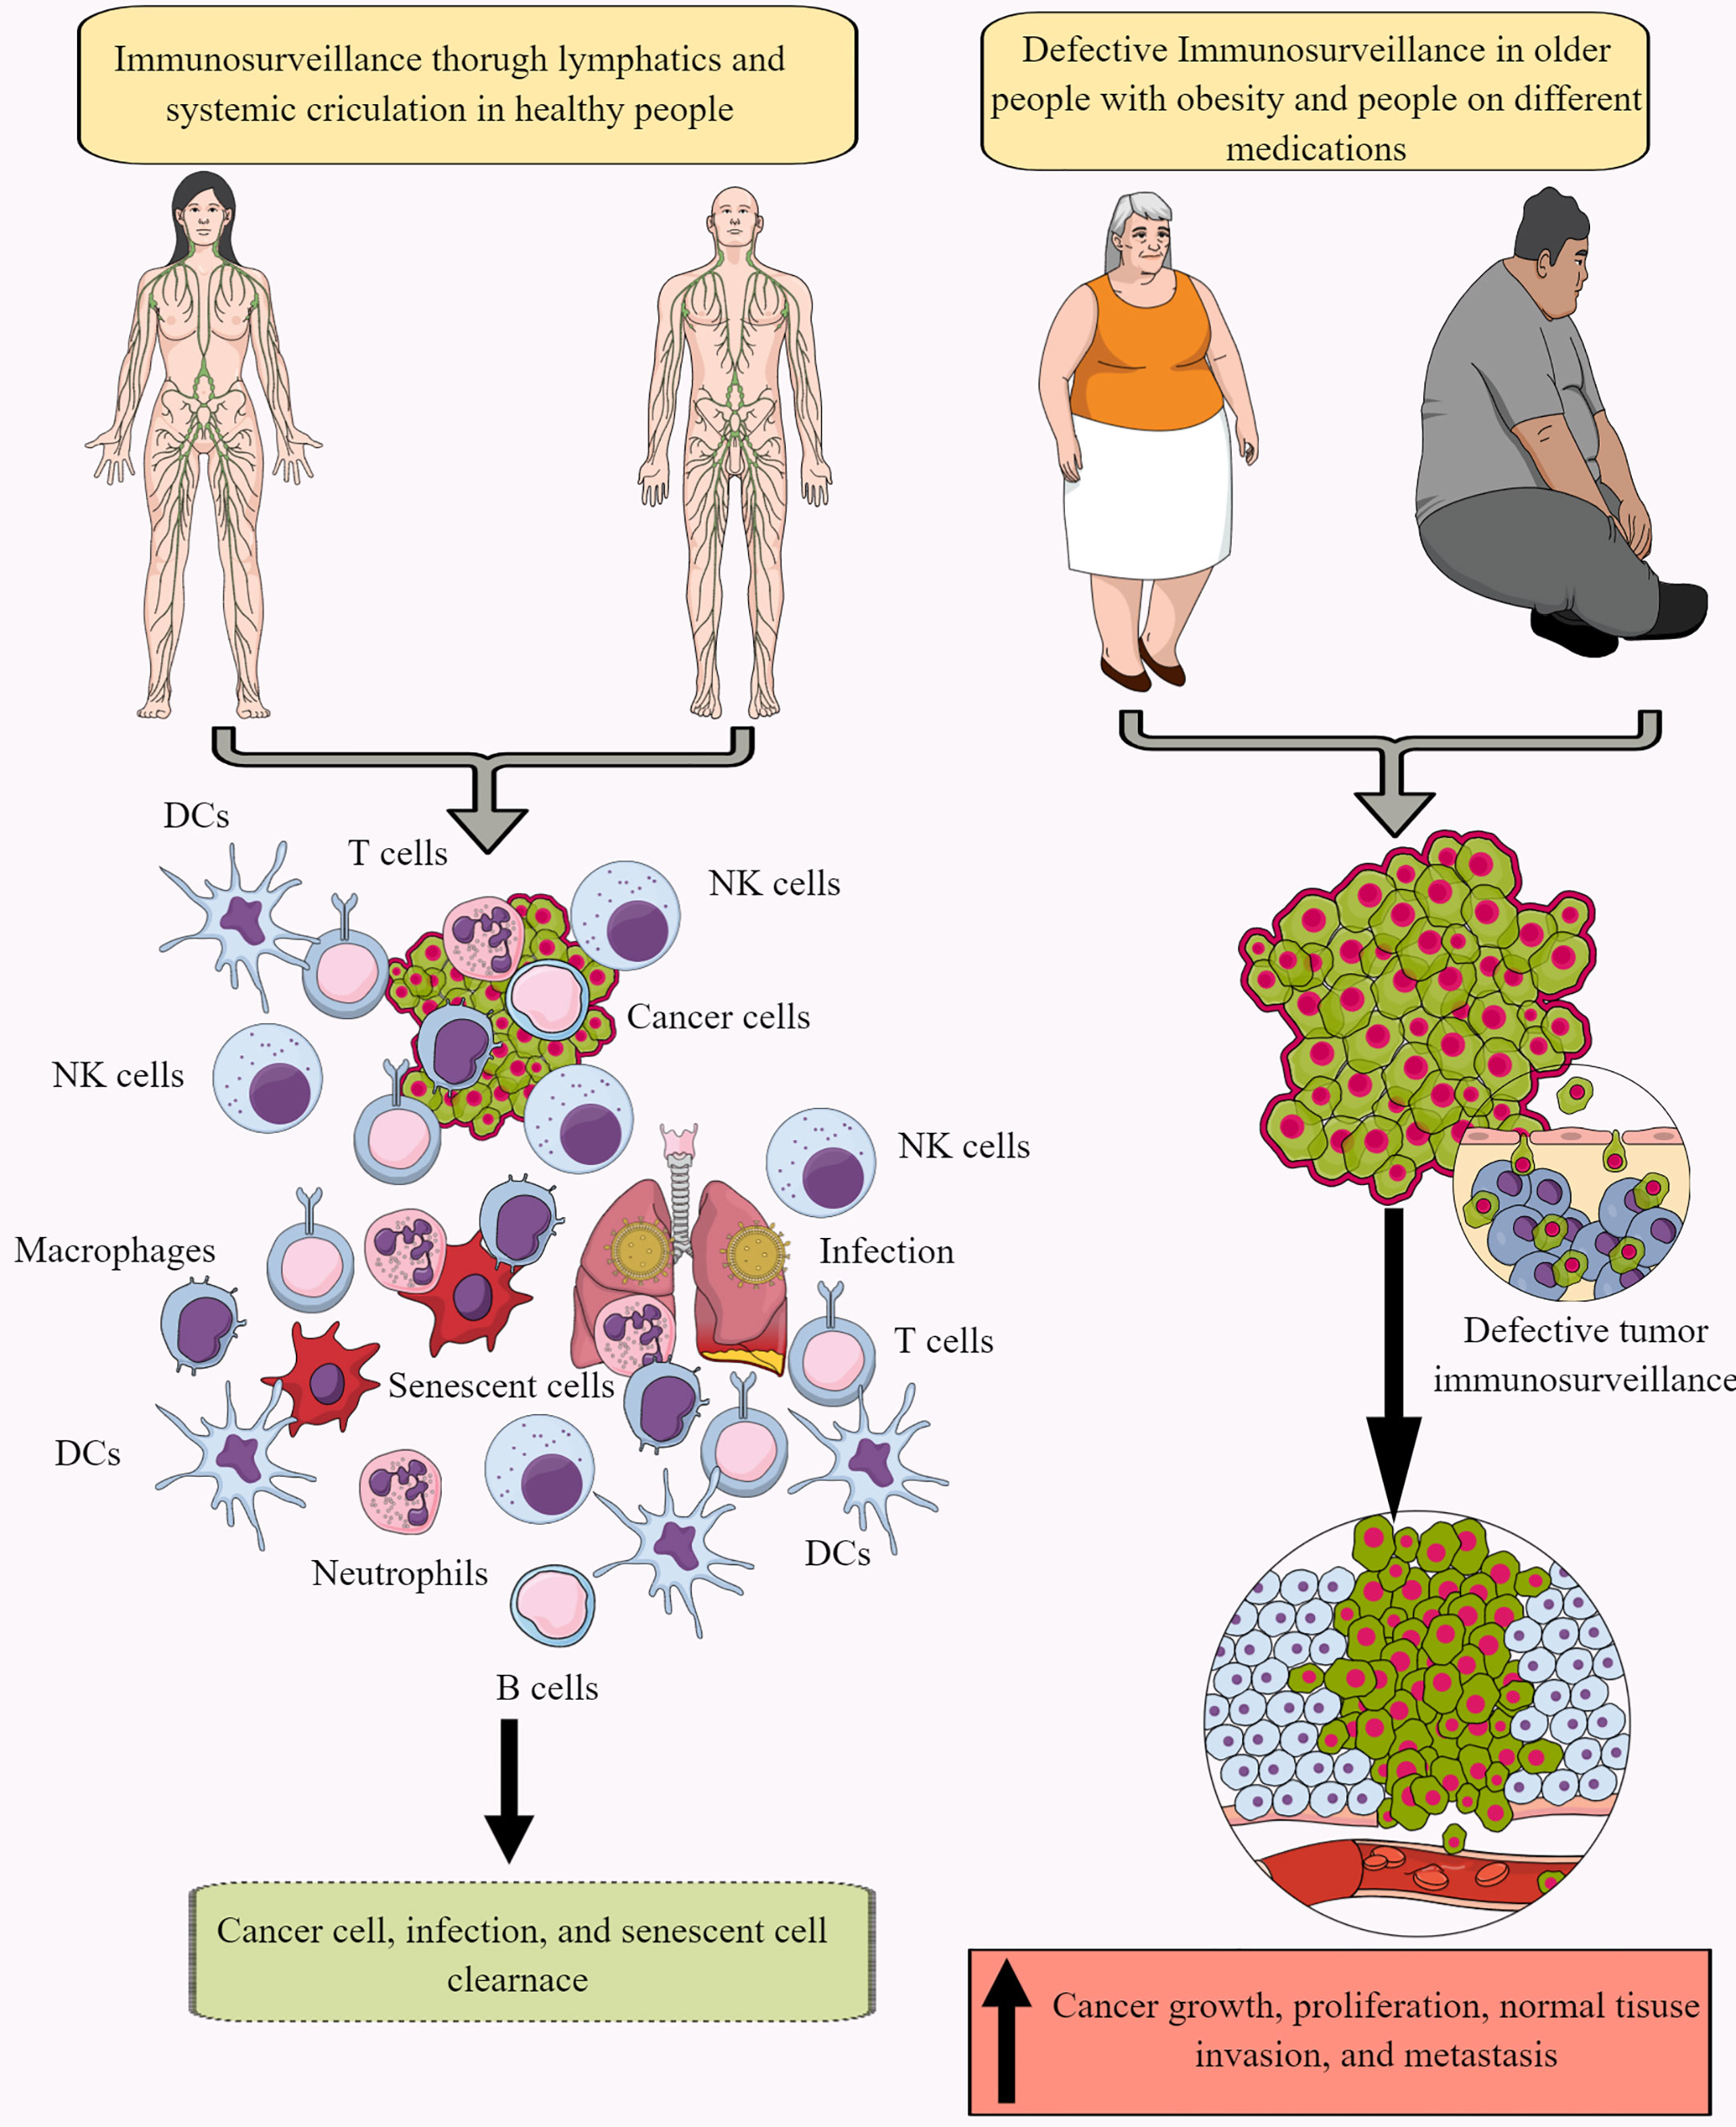
Figure 1 Immunosurveillance and cancer. The continuous immune surveillance of target organs by immune cells (innate and adaptive immunity) through lymphatics and systemic circulation keeps a check on altered or cancer cells in healthy individuals. This helps to maintain homeostasis by removing altered or cancer cells. However, several factors, including aging, obesity, repeated or chronic infections, and different medications, dysregulate or suppress regular immune surveillance leading to a tumor or cancer development. See text for details.
3 Metabolic reprogramming among cancer cells in TME
Cancer cells differ from normal cells in maintaining homeostasis regarding their energy demand. Cancer cells undergo metabolic reprogramming to maintain their fastidious growth and proliferation status. For example, they reprogram themselves for rapid adenosine triphosphate (ATP) synthesis to meet increased energy demand, macromolecule synthesis, and tight maintenance of their redox status (53). The cancer cell metabolic reprogramming is crucial for their survival in the stressful TME with its spatially and temporally heterogenous concentrations of glucose, glutamine, and oxygen favoring hypoxia (54). For example, TGF-β in the TME increases aerobic glycolysis via glucose transporters and glycolysis enzymes to meet their high energy demand (55). Additionally, TGF-β also increases TME lactate level, which directly correlates with cancer cell metastasis. Furthermore, the acidic TME supports tumor cell survival, proliferation, and resistance to apoptosis (56–58).
The Warburg effect is an excellent example of cancer cell metabolic reprogramming, shifting from oxidative phosphorylation (OXPHOS) to aerobic glycolysis (Figure 2) (59–61). However, the observed Warburg effect in the TME does not depend on oxygen availability and the carcinogenic origin of cancer (54, 62). Hypoxia induces the hypoxia-inducible factor-1α (HIF-1α) that regulates the transcription of at least 60 genes regulating tumor cell survival, growth, proliferation, tumor angiogenesis, invasion/metastasis, glucose metabolism, immune cell function (63–66). High pyruvate dehydrogenase kinase (PDK) activity in tumor cells increases glycolysis. It also suppresses reactive oxygen species (ROS) production and accumulation, enhancing their stem cell and tumorigenic potential (Figure 2) (67). The aerobic glycolysis in TME can even occur in the non-dividing cells, indicating that the Warburg effect controls the tumor biomass and enhances their stem cell-like phenotype and oncogenic potential (67). Thus, the increased glucose uptake in tumor cells decreases its concentration in the tumor interstitial fluid (TIF) and increases extracellular lactate levels with increased lactate dehydrogenase (LDH) activity Figure 2 (68). Tumors expressing nucleus accumbens-associated protein-1 (NAC1) also upregulate LDH-A activity that further supports lactate accumulation in TME (69). The increased lactate level in the TME inhibits antitumor immune responses by T cells, macrophages, and DCs, through different mechanisms, including immunometabolic reprogramming (70–75).
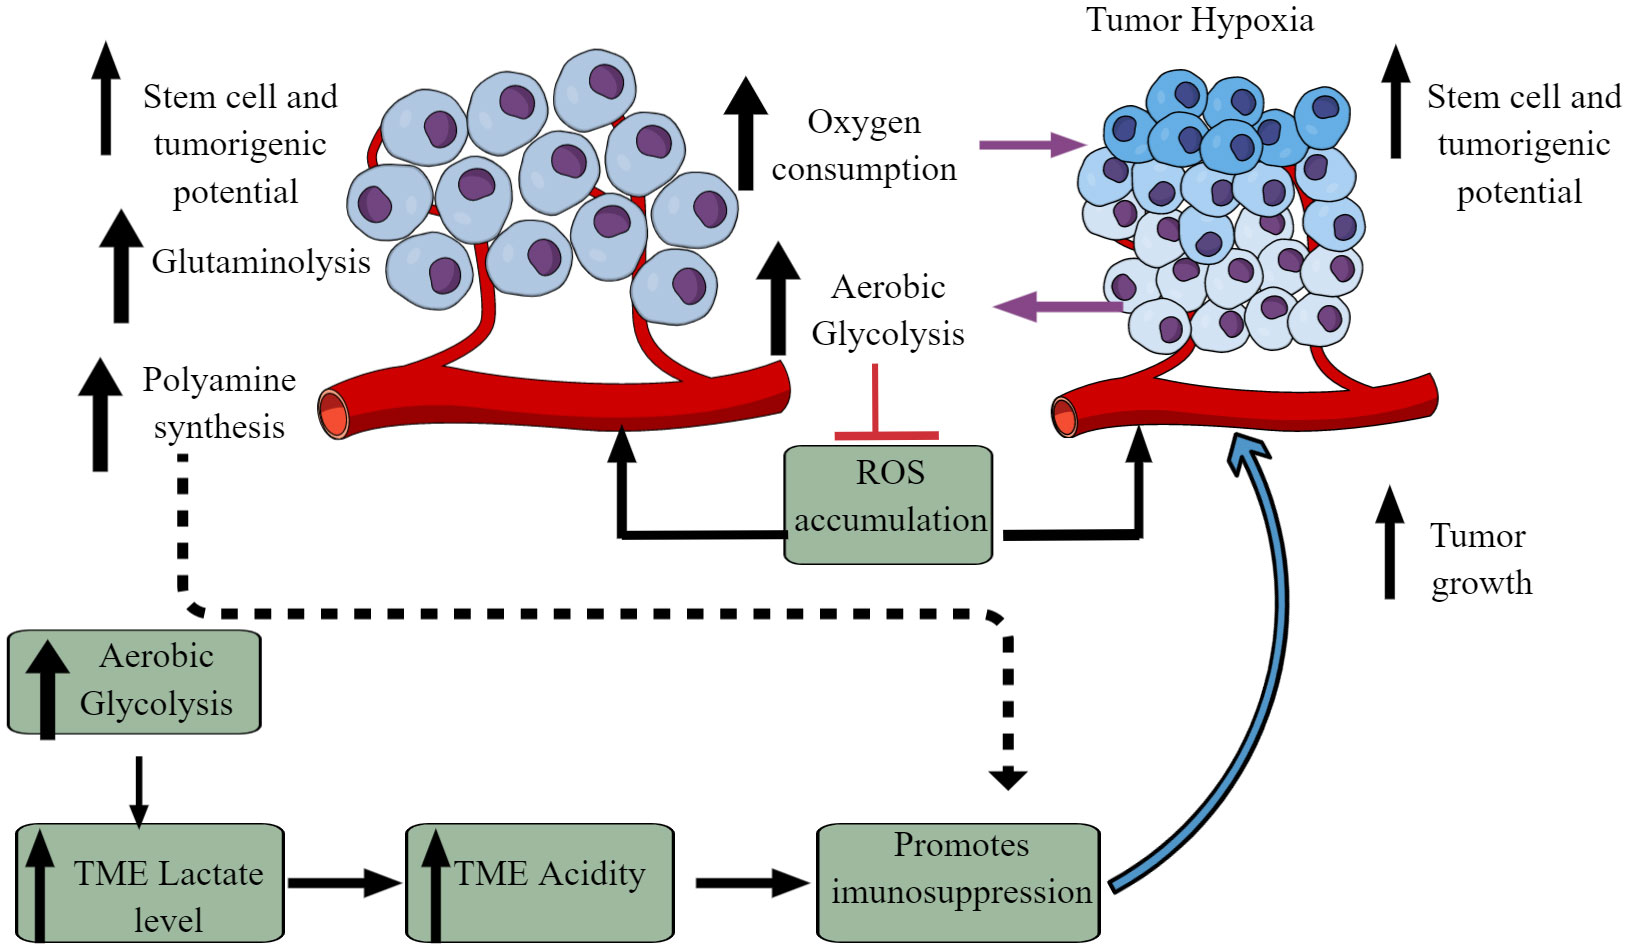
Figure 2 Altered cellular metabolism among cancer cells. Due to the altered physiological and metabolic demands, cancer cells undergo metabolic reprogramming. For example, due to their high energy demand as a response to their fastidious growth and proliferation, cancer cells depend on aerobic glycolysis, causing lactate accumulation and an increased acidic environment. Furthermore, increased aerobic glycolysis elevates oxygen consumption inducing hypoxia. The increased hypoxia and acidity (lactate accumulation) cause immunosuppression to escape from the host immune response. Immunosuppression promotes tumor growth. Additionally, other metabolic mechanisms (polyamine synthesis, glutamine metabolism) also increase in tumor cells, limiting nutrient availability to residential and infiltrated immune cells, causing their immunosuppression. Details are mentioned in the text.
A recent study has provided some of the first experimental evidence of the Warburg effect in patients with cancer (76). For example, clear cell renal carcinoma (ccRC) exhibits increased aerobic glycolysis compared to the adjacent normal kidney, and ccRC has suppressed glucose oxidation compared to tumors of other anatomical sites, including the brain and lungs (76, 77). Hence, ccRC is the first human tumor to demonstrate a convincing shift toward glycolysis, as indicated by the intraoperative 13C infusions. It is important to note that the altered metabolic environment in the TME induces a metabolic competition between tumor and immune cells that helps in cancer progression (78, 79). Like glucose metabolism, the increased glutaminolysis in cancer cells also creates a glutamine-deficient tumor immune microenvironment (TIME) for immune cells (Figure 2). Tumor cells exhibit the highest glutamine uptake in TME compared to infiltrated immune cells (80). Notably, the increased glutamine uptake suppresses the glucose uptake across tumor-resident cell types, emphasizing that glutamine metabolism suppresses glucose uptake without glucose being a limiting factor in the TME (80). Cancer cells over express the methionine transporter SLC43A2. Therefore, they outcompete CD8+ T cells for methionine uptake and utilization (81). The decreased methionine availability to CD8+ T cells decreases the methyl donor S-adenosylmethionine (SAM), inhibiting dimethylation at lysine 79 of histone H3 (H3K79me2). The loss of H3K79me2 in CD8+ T cells decreases signal transducer and activator of transcription 5 (STAT5) expression and alters their cytotoxic action against tumor cells. Furthermore, the methionine utilization by tumor cells in the TME of hepatic cell carcinoma increases T cell exhaustion (82). Thus, strategies to deprive methionine uptake by cancers cells or providing methionine to TME T cells has a potential cell-specific immunometabolic targeting in different solid cancers.
Additionally, increased polyamine biosynthesis and transport occur in tumor cells as indicated by the induction of ornithine decarboxylase (ODC), a hallmark for tumorigenesis (Figure 2) (83–86). Polyamines suppress the immune response to promote tumor growth and directly influence it through numerous tumor-supportive mechanisms (Figure 2) (87–90). Along with tumor cells, myeloid cells (tumor-associated macrophages (TAMs), dendritic cells (DCs), and MDSCs compete with T cells to utilize polyamines to exert their immunosuppressive action (91). Hence, cancer and immunosuppressive myeloid cells compete with T cells in the TIME for polyamine uptake and utilization. In addition, polyamine metabolism is a central determinant of CD4+T cells to differentiate into different functional Th subtypes (Th1, Th2, Th17, and Tregs). Therefore, polyamine deficiency in CD4+T cells results in the failure to adopt a correct subset specification by affecting the tricarboxylic acid (TCA) cycle and histone deacetylation (92). Also, the decreased availability of polyamines to T cells supports their differentiation to immunosuppressive Tregs and its targeting reverses the TME immunosuppression (93–96). Thus, cancer cell metabolism alters the TIME via affecting immunometabolic reprogramming.
4 Immunometabolism in TIME
Immunometabolism combines classical metabolism and immunology to understand the immune cell phenotype and function by combining immunology and metabolism experimental approaches and paradigms (97). Immunometabolism has two subdisciplines: (1) cellular immunometabolism and (2) tissue immunometabolism. Cellular immunometabolism governs the fate of immune cells. At the same time, tissue immunometabolism includes the governing of tissue and systemic metabolism by immune cells to support the adaptations of the host to the surrounding environment (97, 98). Six major metabolic pathways, including glycolysis, the Krebs’s cycle, fatty acid synthesis (FAS), fatty acid oxidation (FAO), amino-acid (AA) metabolism, and the pentose-phosphate pathway (PPP) regulate immune cell function (99). The details of immunometabolism during inflammation or inflammatory immune cell function have been discussed elsewhere (100–102).
Despite having the maximum capacity to uptake intratumoral glucose, myeloid cells in the TIME shift their immunometabolic reprogramming to tumor-promoting anti-inflammatory, immunosuppressive phenotype such as M2 macrophages, N2 neutrophils, MDSCs, and tolerogenic DCs (80). Hence, nutrient partitioning in the TIME is programmed in a cell-intrinsic manner through mammalian target of rapamycin complex 1 (mTORC1) signaling and the expression of genes related to glucose and glutamine metabolism. For example, glucose deprivation to immune cells prevents their pro-inflammatory tumor suppressive action in the TIME, indicating that tumor cells are still the biggest glucose consumer. Therefore, we will primarily focus on immunometabolic reprogramming among different immune cells that support tumor growth via immunosuppression.
4.1 Immunometabolic reprogramming among tumor-resident or infiltrated macrophages to support tumor growth, proliferation, and metastasis
Most immune cells are present within the invasive margins and central zone of tumors (103). However, macrophages often comprise the dominant immune cell population in TIME as they include the first pro-inflammatory innate immune cell responders in the chronic inflammatory environment, which later polarize to tumor-supportive immunosuppressive M2 or TAMs (104–106). M1 to M2 macrophages polarization occurs in response to low glucose, glutamine, and FAs availability in a nutrient competitive TME. M2 polarization is further supported by increased TGF-β, IL-4, IL-5, IL-6, and IL-10 availability in the TME (Figure 3). TAMs support tumor growth, survival, proliferation, and metastasis by supporting tumor angiogenesis, chemoresistance, and immunosuppression (107–110). Hence, understanding their immunometabolic reprogramming in TME or TIME is warranted.
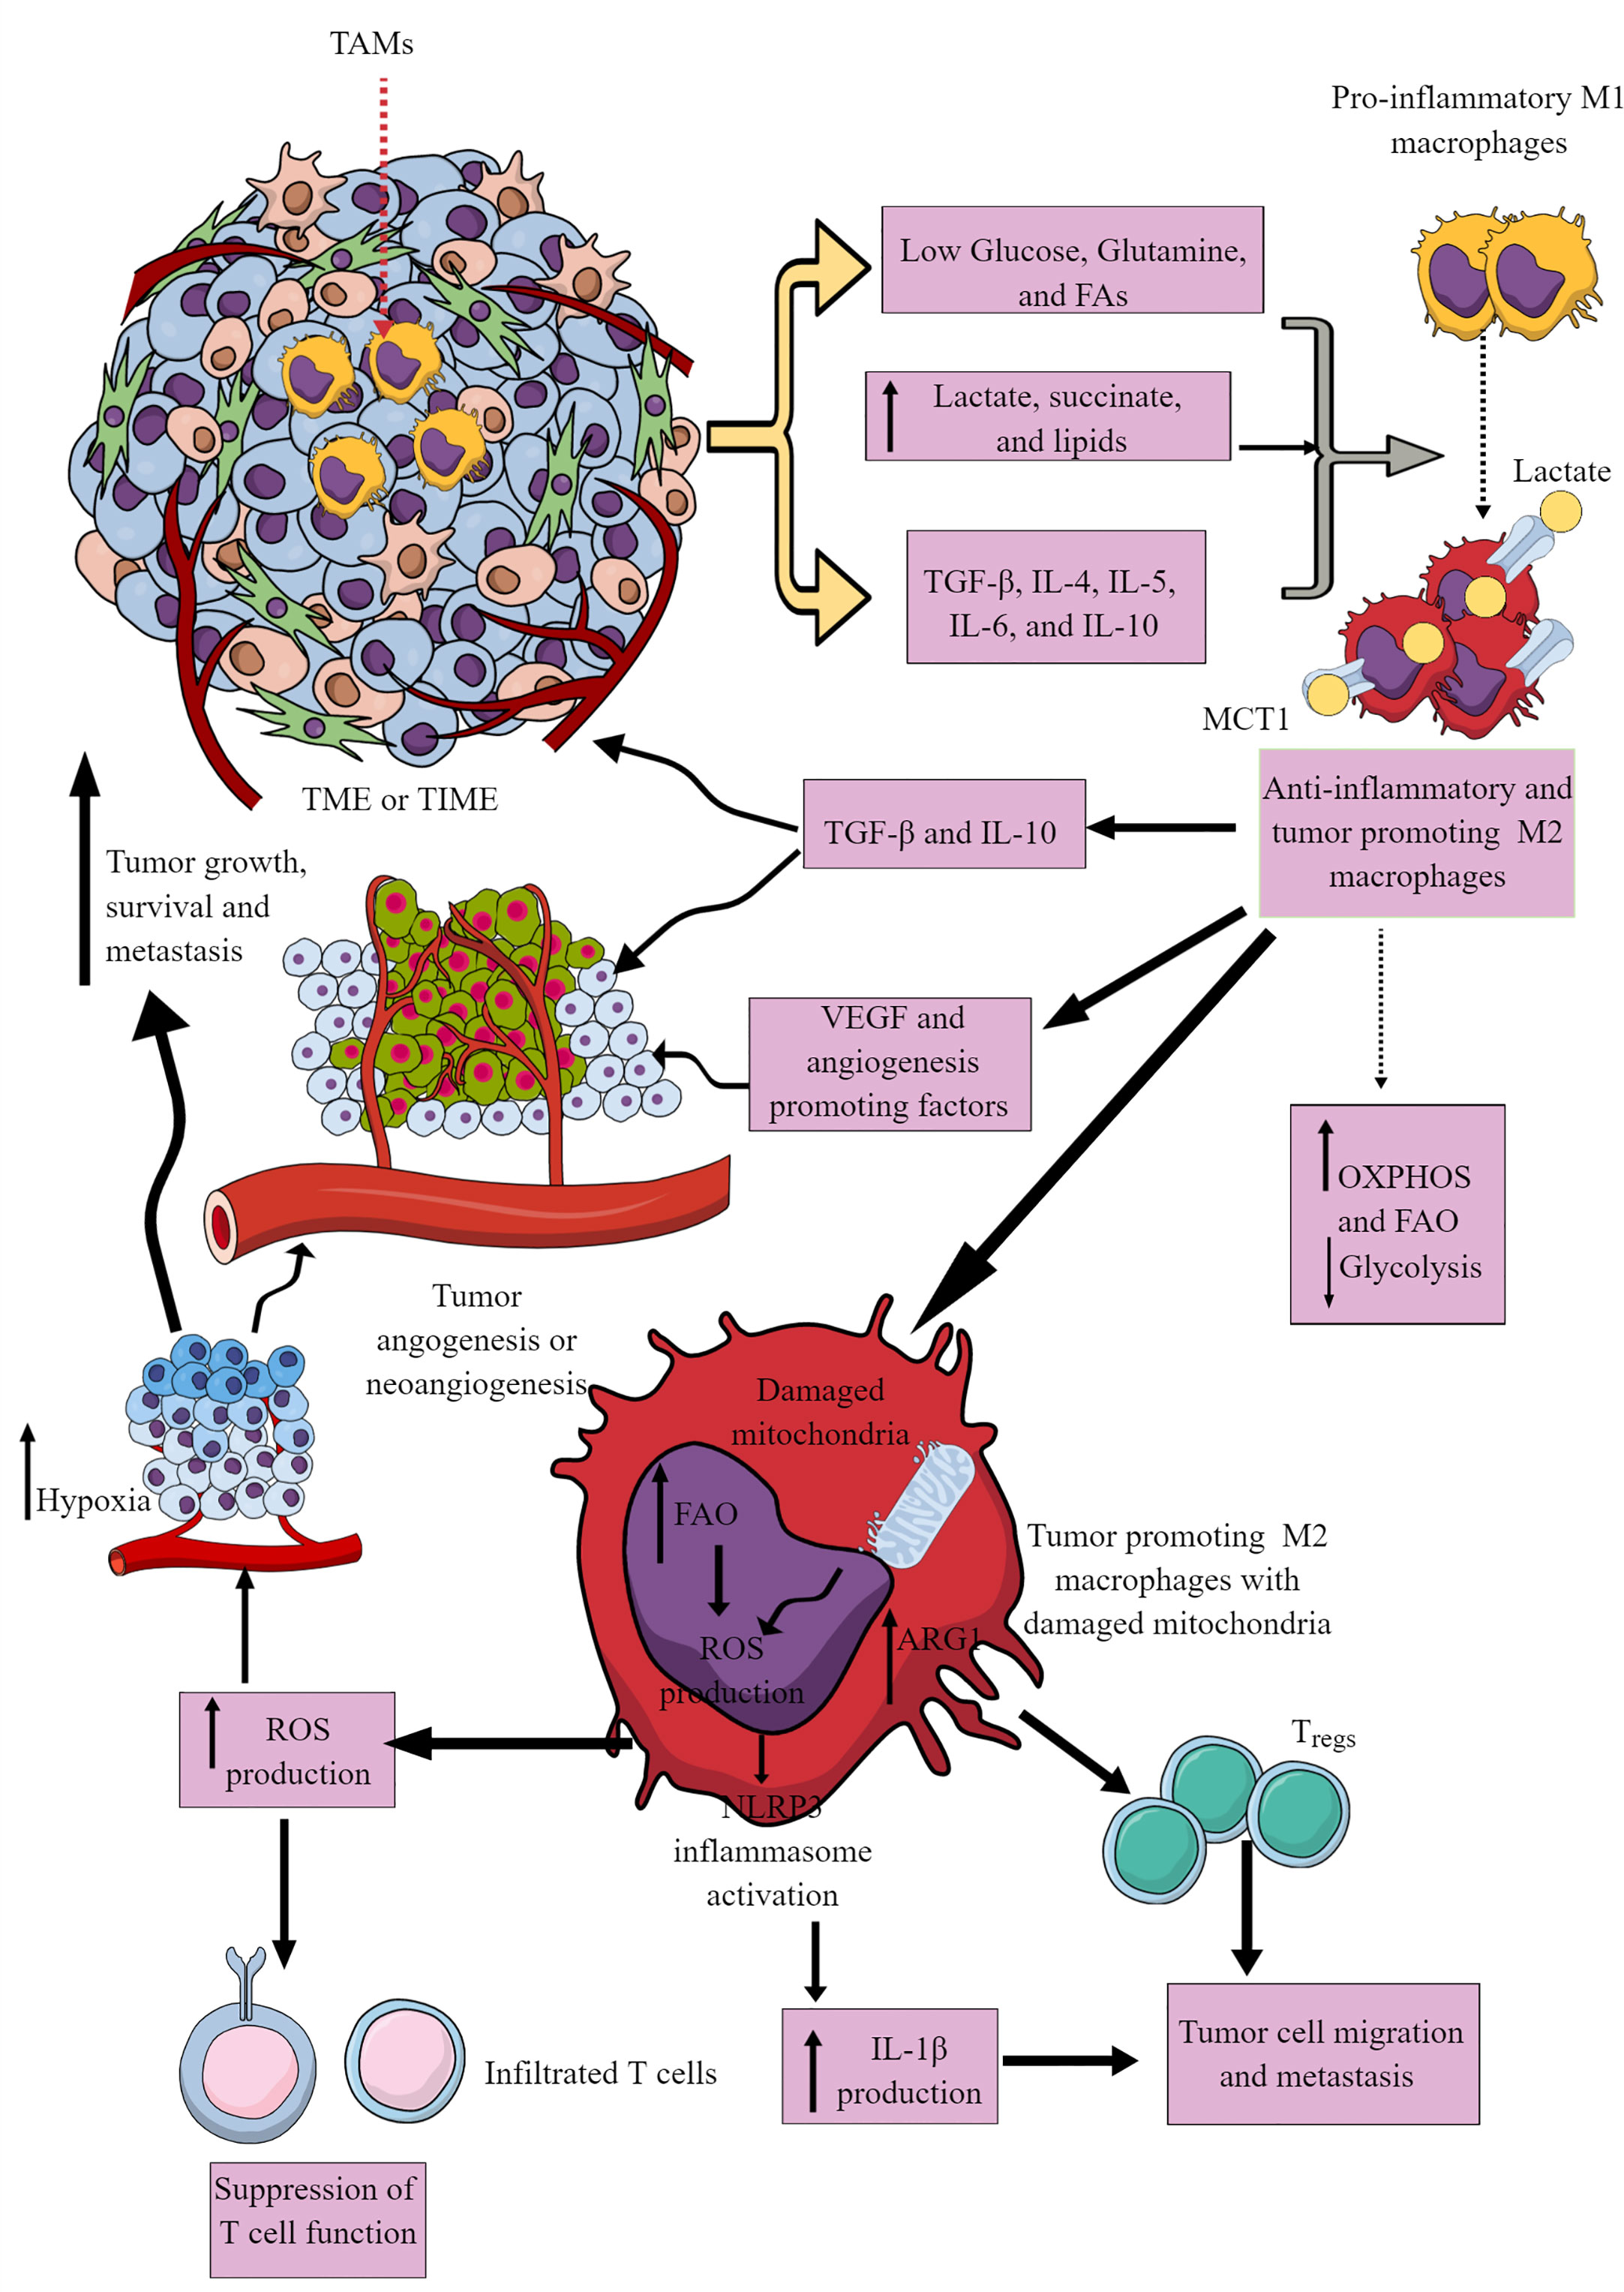
Figure 3 Tumor-associated macrophages (TAMs) in immunosuppressive TME or TIME and their immunometabolic reprogramming. Several factors, including low nutrient availability, increased lactate, succinate, and lipid levels, and different Th2 cytokines (TGF-β, IL-4, IL-5, IL-6, and IL-10) polarize antitumor and pro-inflammatory M1 TAMs to tumor-promoting and immunosuppressive M2 TAMs. These M2 TAMs release immunosuppressive cytokines (IL-10 and TGF-β) to support an immunosuppressive TIME by supporting Tregs. M1 TAMs undergo immunometabolic reprogramming to polarize to M2 TAMs. For example, M2 TAMs show increased OXPHOS and FAO to survive in the nutrient-deprived TIME or TME. The increased ROS production due to the damaged mitochondria in M2 TAMs suppresses the antitumor T cell immune response. Intracellular ROS in M2 TAMs activates NLRP3 inflammasome to produce IL-1β supporting tumor cell migration and metastasis. The increased ROS production supports TME or TIME hypoxia, supporting tumor angiogenesis, growth, survival, and metastasis. For details, see the text.
For example, M1 macrophages depend on aerobic glycolysis to infiltrate the hypoxic TME and exert their pro-inflammatory and anti-tumor actions (98, 111). The IL-4-dependent M1 to M2 macrophage polarization supports OXPHOS through interferon regulatory factor 4 (IRF4) and mTORC2 activation (112). However, IL-4-mediated M2 macrophage polarization does not require immunometabolic reprogramming to FAO (113). Also, the IL-4-mediated M1 macrophage polarization to M2 phenotype only occurs only when NO· generation is blocked due to the dysregulated mitochondrial function (114, 115). TME/TIME and IL-4 synergistically increase protein kinase RNA-like ER kinase (PERK)-signaling cascade in macrophages to promote immunosuppressive M2 transition, activation, and proliferation (116). PERK activation induces phosphoserine aminotransferase 1 (PSAT1) and serine biosynthesis via activation transcription factor-4 (ATF-4). The increased serine biosynthesis supports an enhanced mitochondrial function and α-ketoglutarate (α-KG) synthesis required for Jumonji domain-containing protein-3 (JMJD3)-dependent epigenetic modification (116). On the other hand, PERK activity loss impedes mitochondrial respiration and FAO crucial for M2 macrophages. Hence, the immunometabolic reprogramming among macrophages depends on stimulus, tissue environment, and mitochondria health. TME and associated TIME are complex due to severely altered tumor cell phenotype, function, and different oncometabolites.
The hypoxic and glucose-deprived TME induces regulated in development and DNA damage response 1 (REDD1) on TAMs that suppresses mTORC1 signaling and associated glycolysis (Figure 3) (117, 118). The increased levels of other oncometabolites, including lactate and succinate in TME, further support the M1 to M2 macrophages or TAMs polarization (Figure 3) through different mechanisms, including yes-1 associated protein (YAP) and NF-κB inhibition via G protein-coupled receptor 81 (GPR-81)-mediated signaling (119, 120). Macrophages in TIME or TME uptake lactate via increased expression of monocarboxylate transporter 1 (MCT1) that increases OXPHOS and FAO to generate M2 macrophages or TAMs (Figure 3) (121, 122). There are three types of M2 macrophages (M2a, M2b, and M2c), which secrete common immunosuppressive cytokines (TGF-β and IL-10) and chemokines to support tumor growth (Figure 3) (123). Also, TAMs promote angiogenesis via secreting VEGF and other angiogenesis-promoting factors to support tumor growth, proliferation, and metastasis (Figure 3) (117–119).
Cancer cells secrete M-CSF that promotes fatty acid synthase (FASN) activity in myeloid cells, including TAMs (124). FASN in TAMs via peroxisome proliferator-activated receptor (PPAR)β/δ activation promotes increased IL-10 synthesis and release. IL-10 promotes immunosuppression, angiogenesis, tumor growth, and metastasis (Figure 3). Also, tumor-cell-produced lipids simultaneously orchestrate M1 to M2 macrophage polarization and survival in TME or TIME via inducing ER stress response by reshuffling lipid composition and saturation on the ER membrane (Figure 3) (125). Furthermore, ER stress induces inositol-requiring enzyme 1 (IRE1, an endoplasmic reticulum stress sensor)-mediated spliced X-box-binding protein 1 (XBP1) production and STAT3 activation. The IRE1 production and STAT3 activation support M2 macrophage polarization and immunosuppressive TIME development (125–127). Hence, conditions favoring M2 macrophage transition exert a strong push towards OXPHOS in TAMs, which damages their mitochondria, producing increased ROS (Figure 3) (128). The increased ROS production further supports hypoxia and angiogenesis in TME, adding to tumor growth and metastasis. ROS further suppresses the antitumor action of infiltrated T cells (Figure 3). FAO-dependent ROS generation activates NLRP3 inflammasome to release IL-1β from TIME M2 macrophages, supporting tumor cell migration and metastasis (Figure 3) (129). Also, exosomes released from tumor cells in TME support the M1 to M2 macrophage transition via activating NLRP6/NF-κB pathway to support immunosuppressive TIME and cancer cell metastasis (130). Arginase 1 (Arg1) expression in TAMs lowers the L-arginine availability to T cells in TME or TIME. It recruits immunosuppressive Tregs to support tumor growth and development (Figure 3) (131). The simultaneous Arg1 and inducible nitric oxide synthesis (iNOS) expression in TAMs (M1/M2 phenotype) at low arginine concentration may favor ROS and RNS production that may inhibit antitumor T cell function in TIME (132–134).
Also, TAMs show a decreased receptor-interacting protein kinase 3 (RIPK3, a central factor in necroptosis) that inhibits caspase 1 (CASP1)-mediated cleavage of PPAR-γ to support FAO (135). The M2 macrophage polarization also involves increased glutamine catabolism (glutaminolysis) and UDP-GlcNAc-associated modules (136). The increased glutaminolysis replenishes the TCA cycle in immunosuppressive TAMs (137). Thus, the glutamine deprivation or N-glycosylation inhibition decreases M2 polarization and CCL22 production and promotes their polarization to M1-like macrophages (136, 138). The indoleamine 2,3-dioxygenase (IDO) expression in M2 macrophages also increases, which depletes local tryptophan via generating immunosuppressive kynurenine metabolites (139, 140). Hence, immunometabolic reprogramming among TAMs (highest in number among TIME immune cells) gives them an immunosuppressive phenotype. These immunosuppressive macrophages suppress other immune cells, including T cells through direct interaction or secreting immunosuppressive metabolites, switching their immunometabolism to immunosuppressive or exhausted phenotype (141–145).
4.2 Neutrophils and Myeloid-derived suppressor cells immunometabolism in TIME
Tumor cells and immune cells release several factors, including TNF-α, IL-8, IL-1α, CXCL1, CXCL2, and CXCL5 to stimulate neutrophil chemotaxis to the TME (146, 147). Although only mature neutrophils leave bone marrow (BM) for the circulation and target organs, TIME also harbors immature neutrophils (Figure 4) (146, 148). At initial stages, neutrophils exert antitumor action but become tumor and metastasis supportive later. They can be classified as antitumor N1 neutrophils that are supported by IFN-β and hepatocyte growth factor (HGF) and protumor N2 neutrophils that are supported by TGF-β and G-CSF (147). The complex immunological functions of neutrophils and their targeting in cancer are discussed elsewhere (147, 149–151).
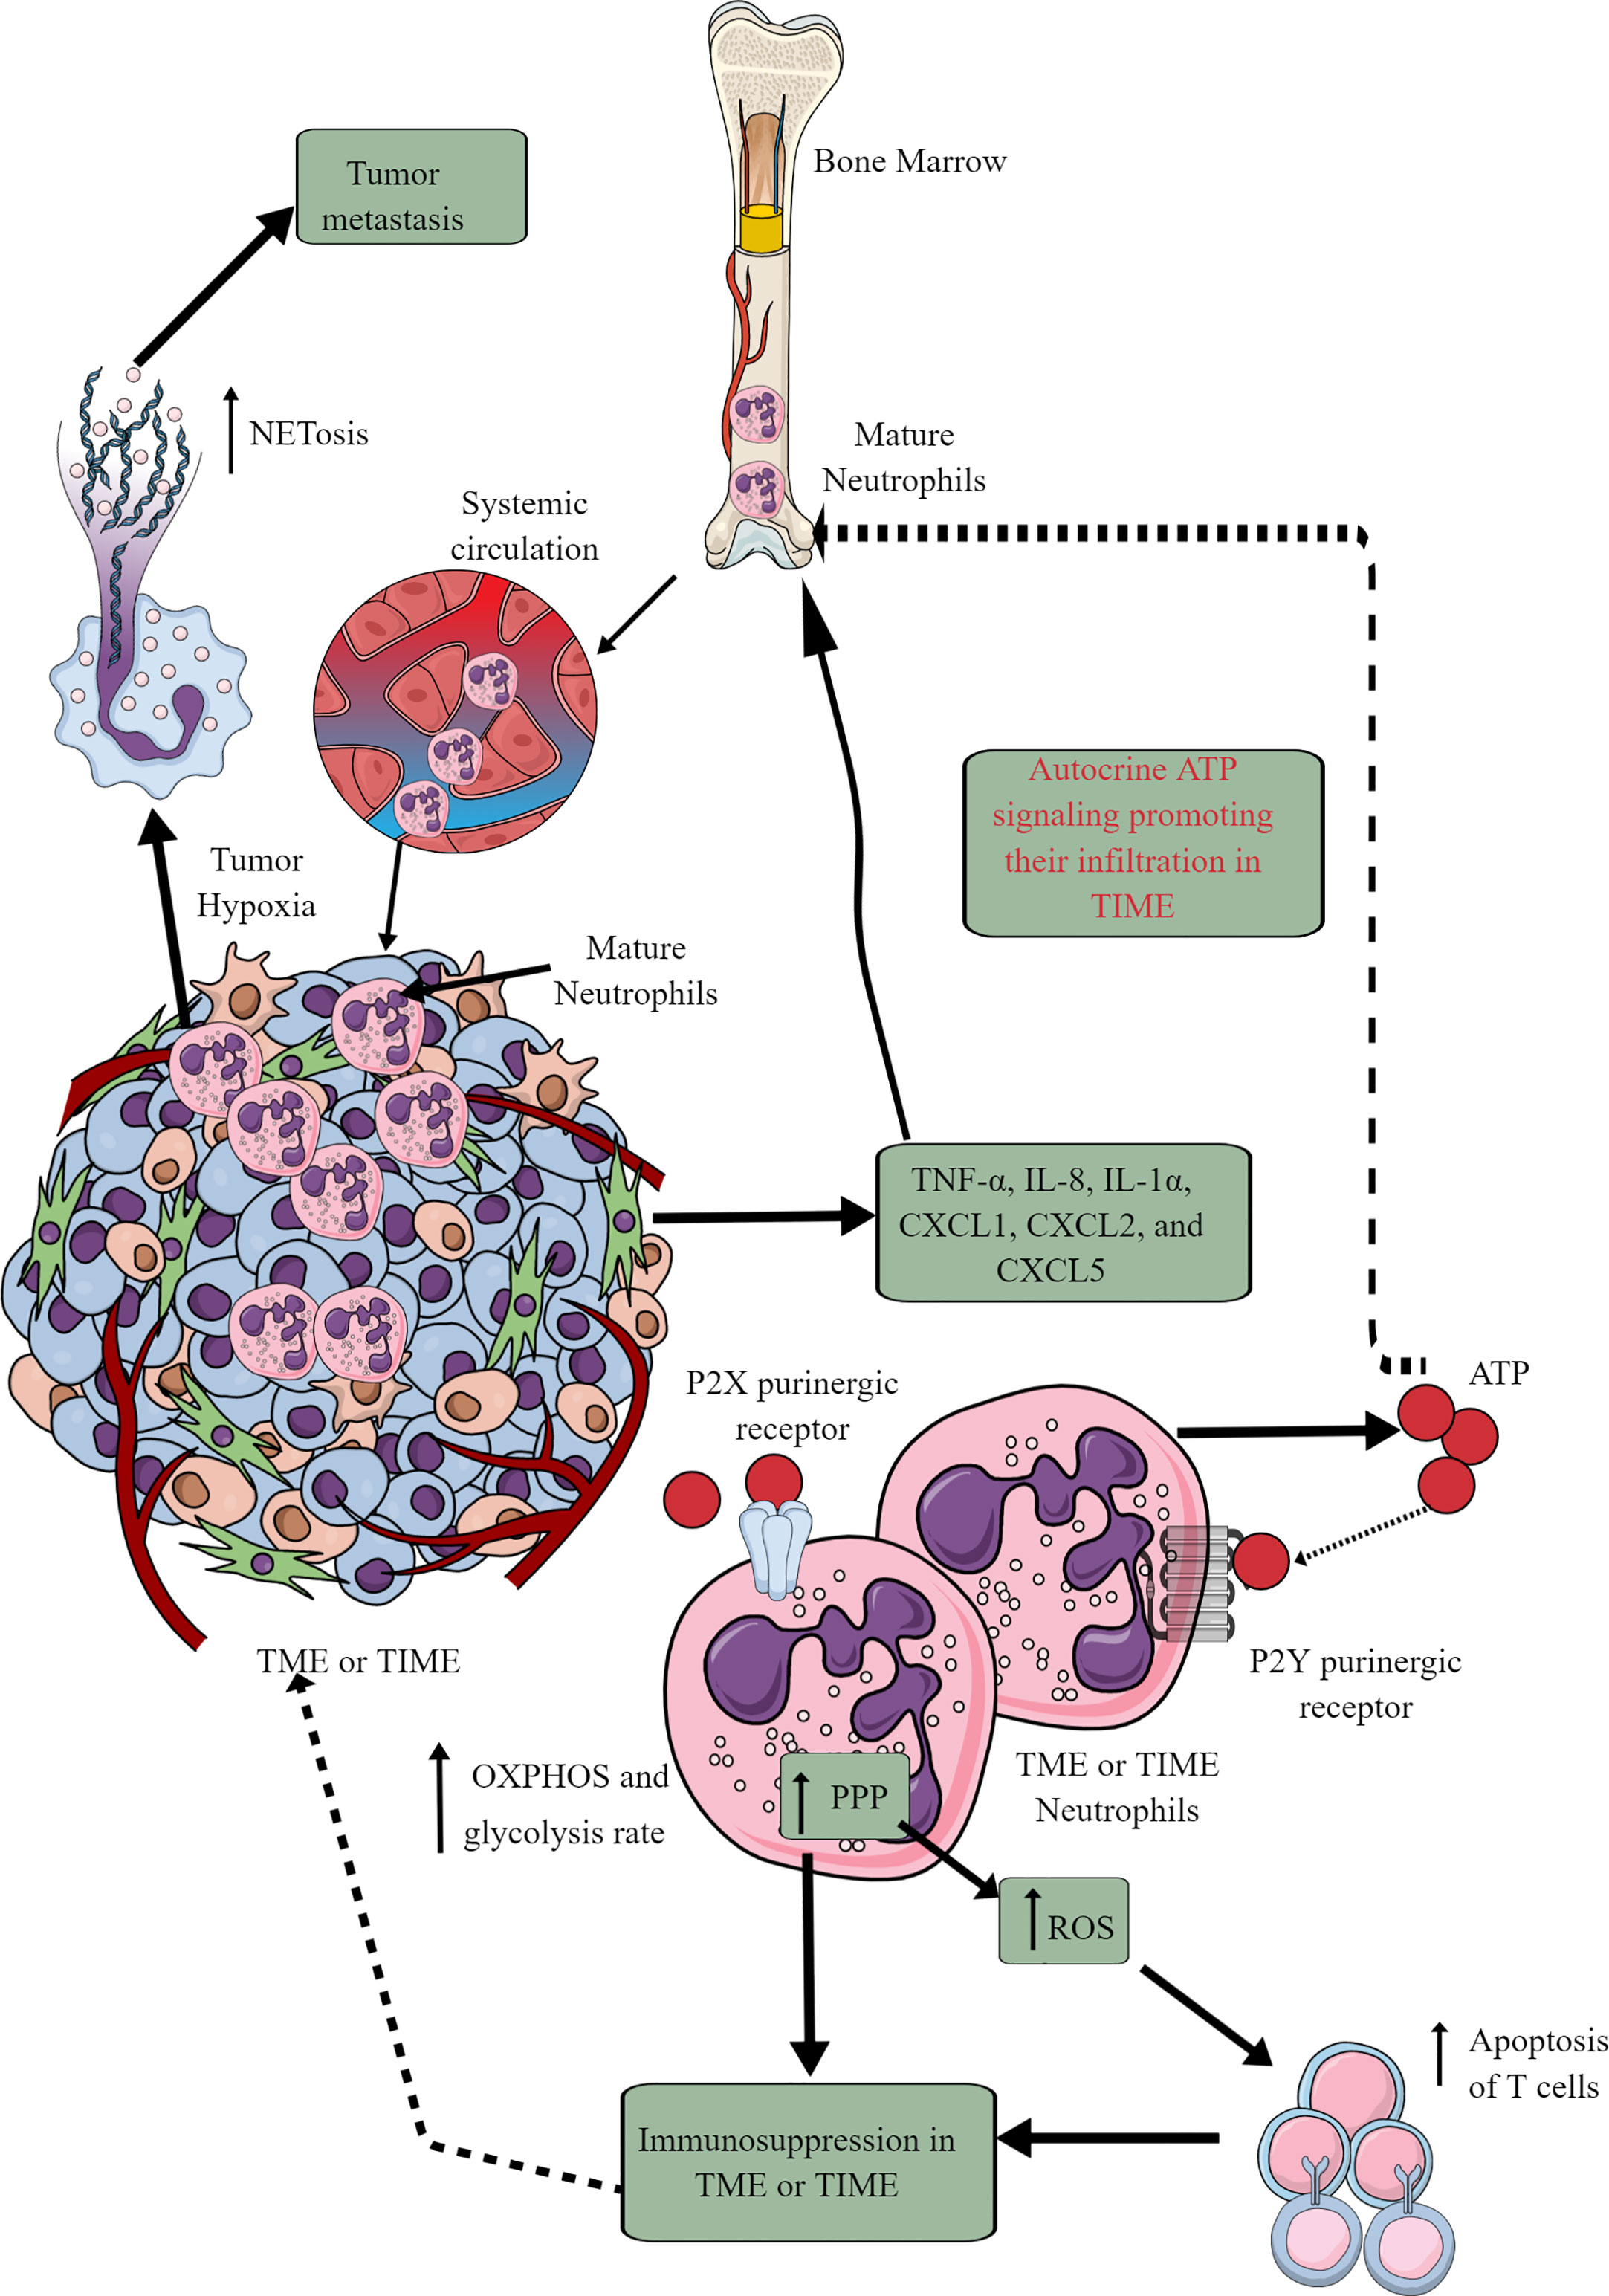
Figure 4 Neutrophils in TME or TIME and their immunometabolic reprogramming. The systemic neutrophil number increases in tumor patients. This increase is due to the increased neutrophil generation in the bone marrow (BM), causing increased infiltration in the TME or TIME. Although only mature neutrophils leave the BM, TIME contains both immature and mature neutrophils. Therefore, different chemokines and cytokines released from TME or TIME cells send the signals to BM for neutrophil chemotaxis. Additionally, ATP released from tumor-associated neutrophils (TANs) acts in an autocrine manner via P2Y purinergic receptors to further support their chemotaxis in TME or TIME. TANs show an increased rate of OXPHOS and glycolysis along with an elevated PPP. The ROS released from TANs induced apoptotic cell death among infiltrated antitumor T cells, causing immunosuppression. Hypoxia in TME or TIME causes NETosis that further supports tumor metastasis. See the text for details.
In cancer-bearing mice, neutrophils leaving the BM show more spontaneous migration than in typical tumor-free mice (152). For example, these neutrophils lack immunosuppressive action, having increased OXPHOS and glycolysis rate than neutrophils of typical tumor-free individuals (Figure 4). The aggravated autocrine ATP signaling supports the increased neutrophil infiltration to TIME via purinergic receptors (Figure 4) (152). The hypoxic environment in the TME or TIME increases HIF-1α and HIF-2α levels (65). HIF-1α increases neutrophil survival via supporting glycolysis (OXPHOS is not crucial for neutrophils) at initial stages, creating a chronic pro-inflammatory environment to support tumor progression (153). At the same time, HIF-2α increases the lifespan of pro-inflammatory neutrophils called tumor-associated neutrophils (TANs) (154). Also, the PPP in neutrophils supports increased ROS generation that induces apoptotic cell death among infiltrated T cells to support further a tumor suppressive TIME (Figure 4) (155, 156). PPP is also involved in the neutrophil extracellular trap (NETs) formation or NETosis by fueling NADPH oxidase with NADPH to produce superoxide that supports cancer metastasis (157). However, immunosuppressive mediators, including TGF-β released at later stages of the tumor, polarize antitumor N1 TANs to pro-tumor N2 TANs (158–160). Also, the glutamine and proline uptake in immature low-density neutrophils (iLDNs) supports their pro-metastasis action inducing NETosis under hypoxic and glucose-deprived conditions (Figure 4) (161, 162). NETs promote cancer growth, progression, and metastasis and provide a protective shield to them through different mechanisms discussed somewhere else (163).
MDSCs are well-known immunosuppressive innate immune cells found only in pathological conditions, including cancer (164–166). They are of two types (1) monocytic-MDSCs or M-MDSCs, and (2) polymorphonuclear-MDSCs or PMN-MDSCs (167). Hence, MDSCs are the pathological phenotypes of neutrophils and monocytes accumulating in pathological lesions, including TME or TIME (164, 165). PMN-MDSCs of patients with cancer also show an increased spontaneous migration characteristic and are present at very early cancer stages (152, 168). Different chemokines, including IL-8 (CXCL8) and CXCR4 chemoattract (in response to miR-494) MDSCs to TME or TIME (Figure 5) (169–171). They secrete different immunosuppressive cytokines, including IL-10 and TGF-β, responsible for their immunosuppressive function to support tumor growth, proliferation, neoangiogenesis, and metastasis (170, 172). MDSCs also secrete vascular endothelial growth factor (VEGF)-A, fibroblast growth factor (FGF), and Bv8 (prokineticin or PK), and different MMPs to promote tumor growth and metastases (Figure 5) (173, 174).
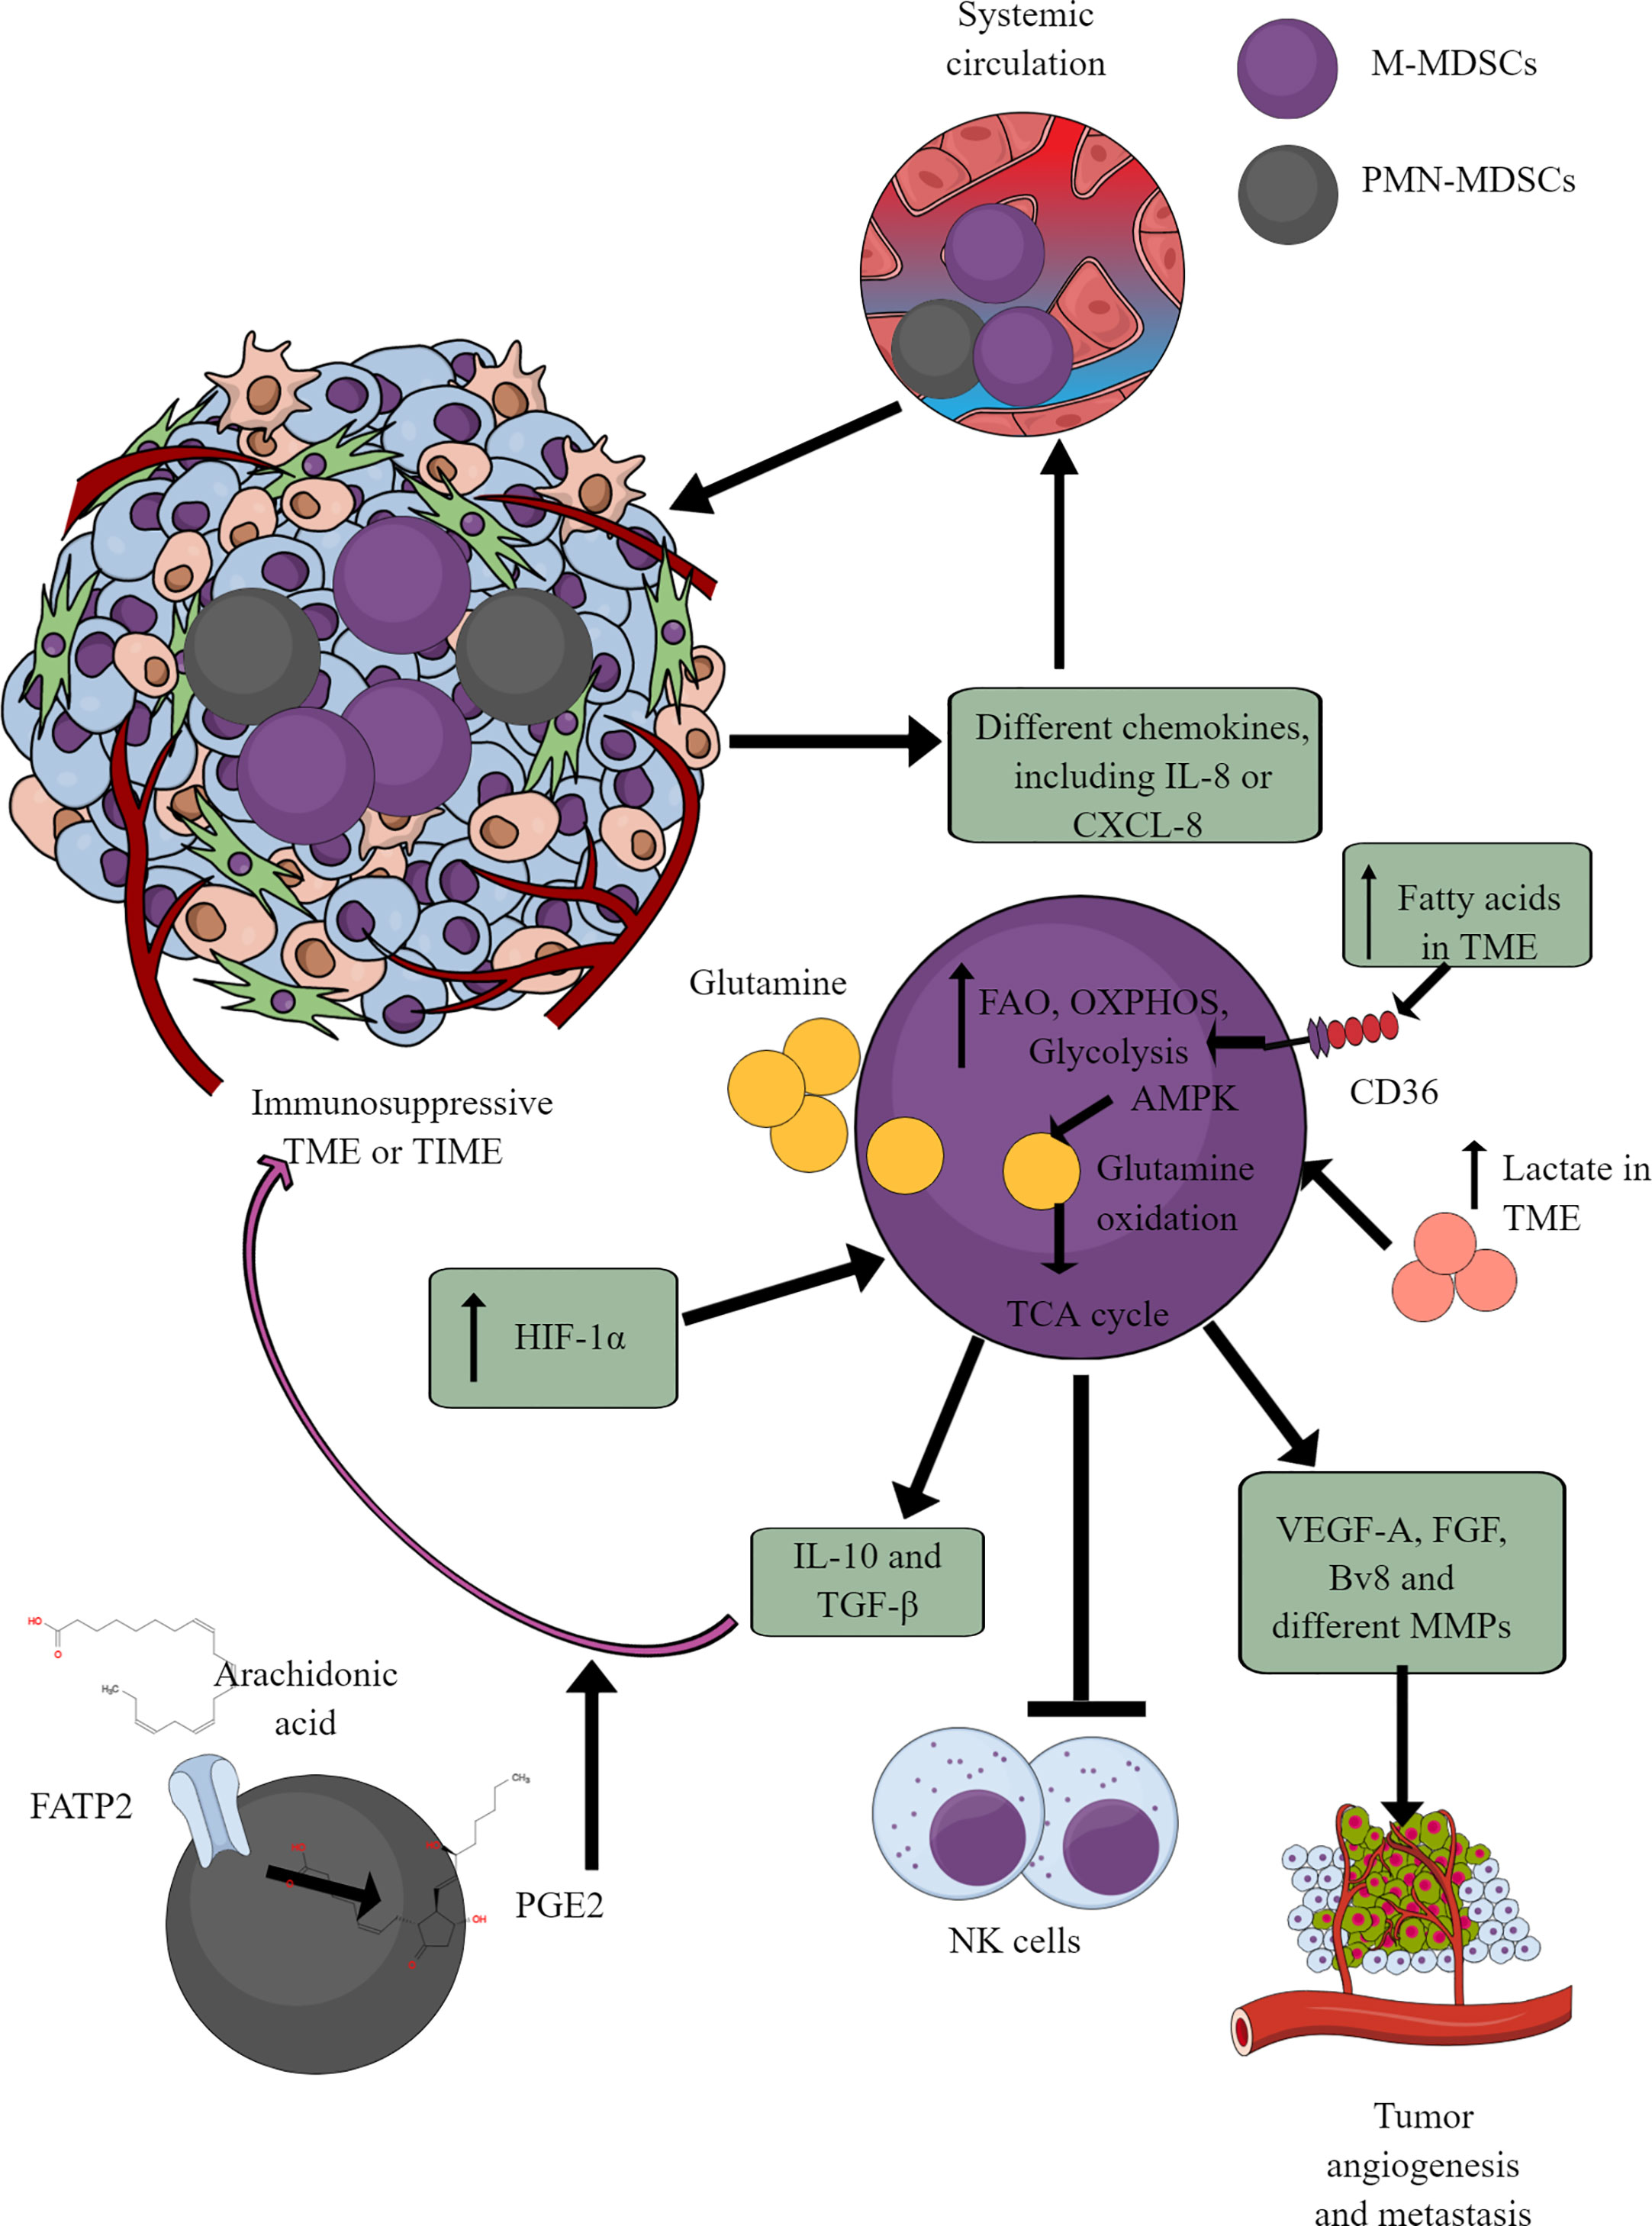
Figure 5 MDSCs in TME or TIME and their immunometabolism. MDSCs infiltration in TME or TIME supports the immunosuppressive microenvironment. IL-8 and many other TME or TIME-released chemokines support their infiltration. To exert their immunosuppressive function, MDSCs show an increased FAO, OXPHOS, and glycolysis. AMPK increase induces glutamine oxidation to support the TCA cycle. The increased lactate level in TME or TIME favors the immunosuppressive function of MDSCs. For example, MDSCs release immunosuppressive cytokines (TGF-β and IL-10), suppress cytotoxic NK cell activity and promote tumor angiogenesis, growth, proliferation, and metastasis. Additionally, arachidonic acid (AA) metabolism to PGE2 in PMN-MDSCs further supports immunosuppressive TIME.
MDSCs depend on AMPK and FAO for their immunosuppressive function (175, 176). Glutamate or L-glutamine (L-Gln) taken by MDSCs in TME or TIME is oxidized in an AMPK-dependent manner to support their immunosuppressive function by regulating the TCA cycle (Figure 5) (177). Even tumor-infiltrated/associated MDSCs (T-MDSCs) synthesize their L-Gln and with increased transglutaminase (TGM) expression that supports their immunosuppressive function and tumor metastases (178, 179). T-MDSCs show an increased FAO, OXPHOS, and glycolysis due to an increased lipid/FAs content in TME or TIME (Figure 5) (176). However, the increased FAs in TME or TIME promote FAO in MDSCs via CD36-mediated FA uptake, and FAO inhibition suppresses their immunosuppressive function in TME (176, 180, 181).
The fatty acid transport protein 2 (FATP2) on PMN-MDSCs through arachidonic acid (AA) uptake and prostaglandin E2 (PGE2) synthesis also support the immunosuppressive function of MDSCs (Figure 5) (182, 183). Furthermore, the PGE2-mediated negative feedback loop FATP2 and receptor-interacting protein kinase 3 (RIPK3, A negative regulator of FATP2) promotes PMN-MDSCs’ immunosuppressive function (184, 185). GM-CSF controls the FATP2 overexpression on PMN-MDSCs in TIME via STAT5 activation. TME or TIME hypoxia increases the immunosuppressive function of T-MDSCs by increasing the HIF-1α level (Figure 5) (186, 187). Furthermore, HIF-1α, along with promoting their immunometabolic reprogramming to immunosuppressive phenotype, also increases the PD-L1 expression that suppresses the cytotoxic and immune-promoting functions of CD8+ and CD4+T cells in TIME (188). A high lactate level in TME increases the survival and proliferation of immunosuppressive MDSCs through G protein-coupled receptor 81 (GPR81)/mTOR/HIF-1α/STAT3 pathway (189–191). Also, the increased TME lactate level increases the number and proliferation of MDSCs, which inhibit NK cell cytotoxicity (NKCC) (Figure 5) (190). Hence, hypoxic TME or TIME supports MDSCs’ immunometabolic reprogramming to FAO to favor their tumor and metastasis-supportive function.
4.3 DCs and their immunometabolic reprogramming in TME/TIME
DCs are potent antigen-presenting cells (APCs), which play a crucial role in generating and regulating immune response via recognizing different pathogens and inflammogens and presenting antigens to adaptive immune cells (T and B cells) (192). They also serve a part of first responding innate immune cells against cancer via antigen presentation despite constituting a rare immune cell population (CD103+DCs) within TME or TIME capable of activating CD8+T cells (Figure 6) (193, 194). Conventional DCs (cDCs) at early malignancy recognize dying tumor cells and migrate to draining lymph nodes (DLNs) to present tumor antigens to CD4+ and CD8+ T cells (195, 196). For example, type 1 cDCs (cDC1s) prime cytotoxic CD8+T cells, and type 2 cDCs (cDC2s) activate antitumor helper CD4+T cells (197–199). The antitumor action of cDC1s in TIME depends on NK cells as they release cDC1 chemo-attractants CCL5 and XCL1 to bring them in (Figure 6) (200, 201). However, the prostaglandin E2 (PGE2) release by tumor cells in TME or TIME suppresses NKCC and the production of cDC1 chemo-attractive chemokines (Figure 6). Thus, cDC1s lose their antitumor function due to the evasion of the NK cell-cDC1 axis and other immune cells with tumor growth. Furthermore, cDC2s (CD11b+DCs) in tumor DLNs also express PDL-1 and suppress T cell-mediated antitumor immunity (Figure 6) (202, 203). Additionally, monocyte-derived DCs (mo-DCs) with pro-inflammatory properties comprise another type of DCs populating tumors (198). Also, the plasmacytoid DCs (pDCs) in tumor DLNs release IDO that directly activates mature Tregs to create an immunosuppressive TIME (Figure 6) (204). The details of immunologic and immunoregulatory functions of DCs in TME or TIME are mentioned elsewhere (205–208). We will focus their immunometabolic reprogramming in TME or TIME.
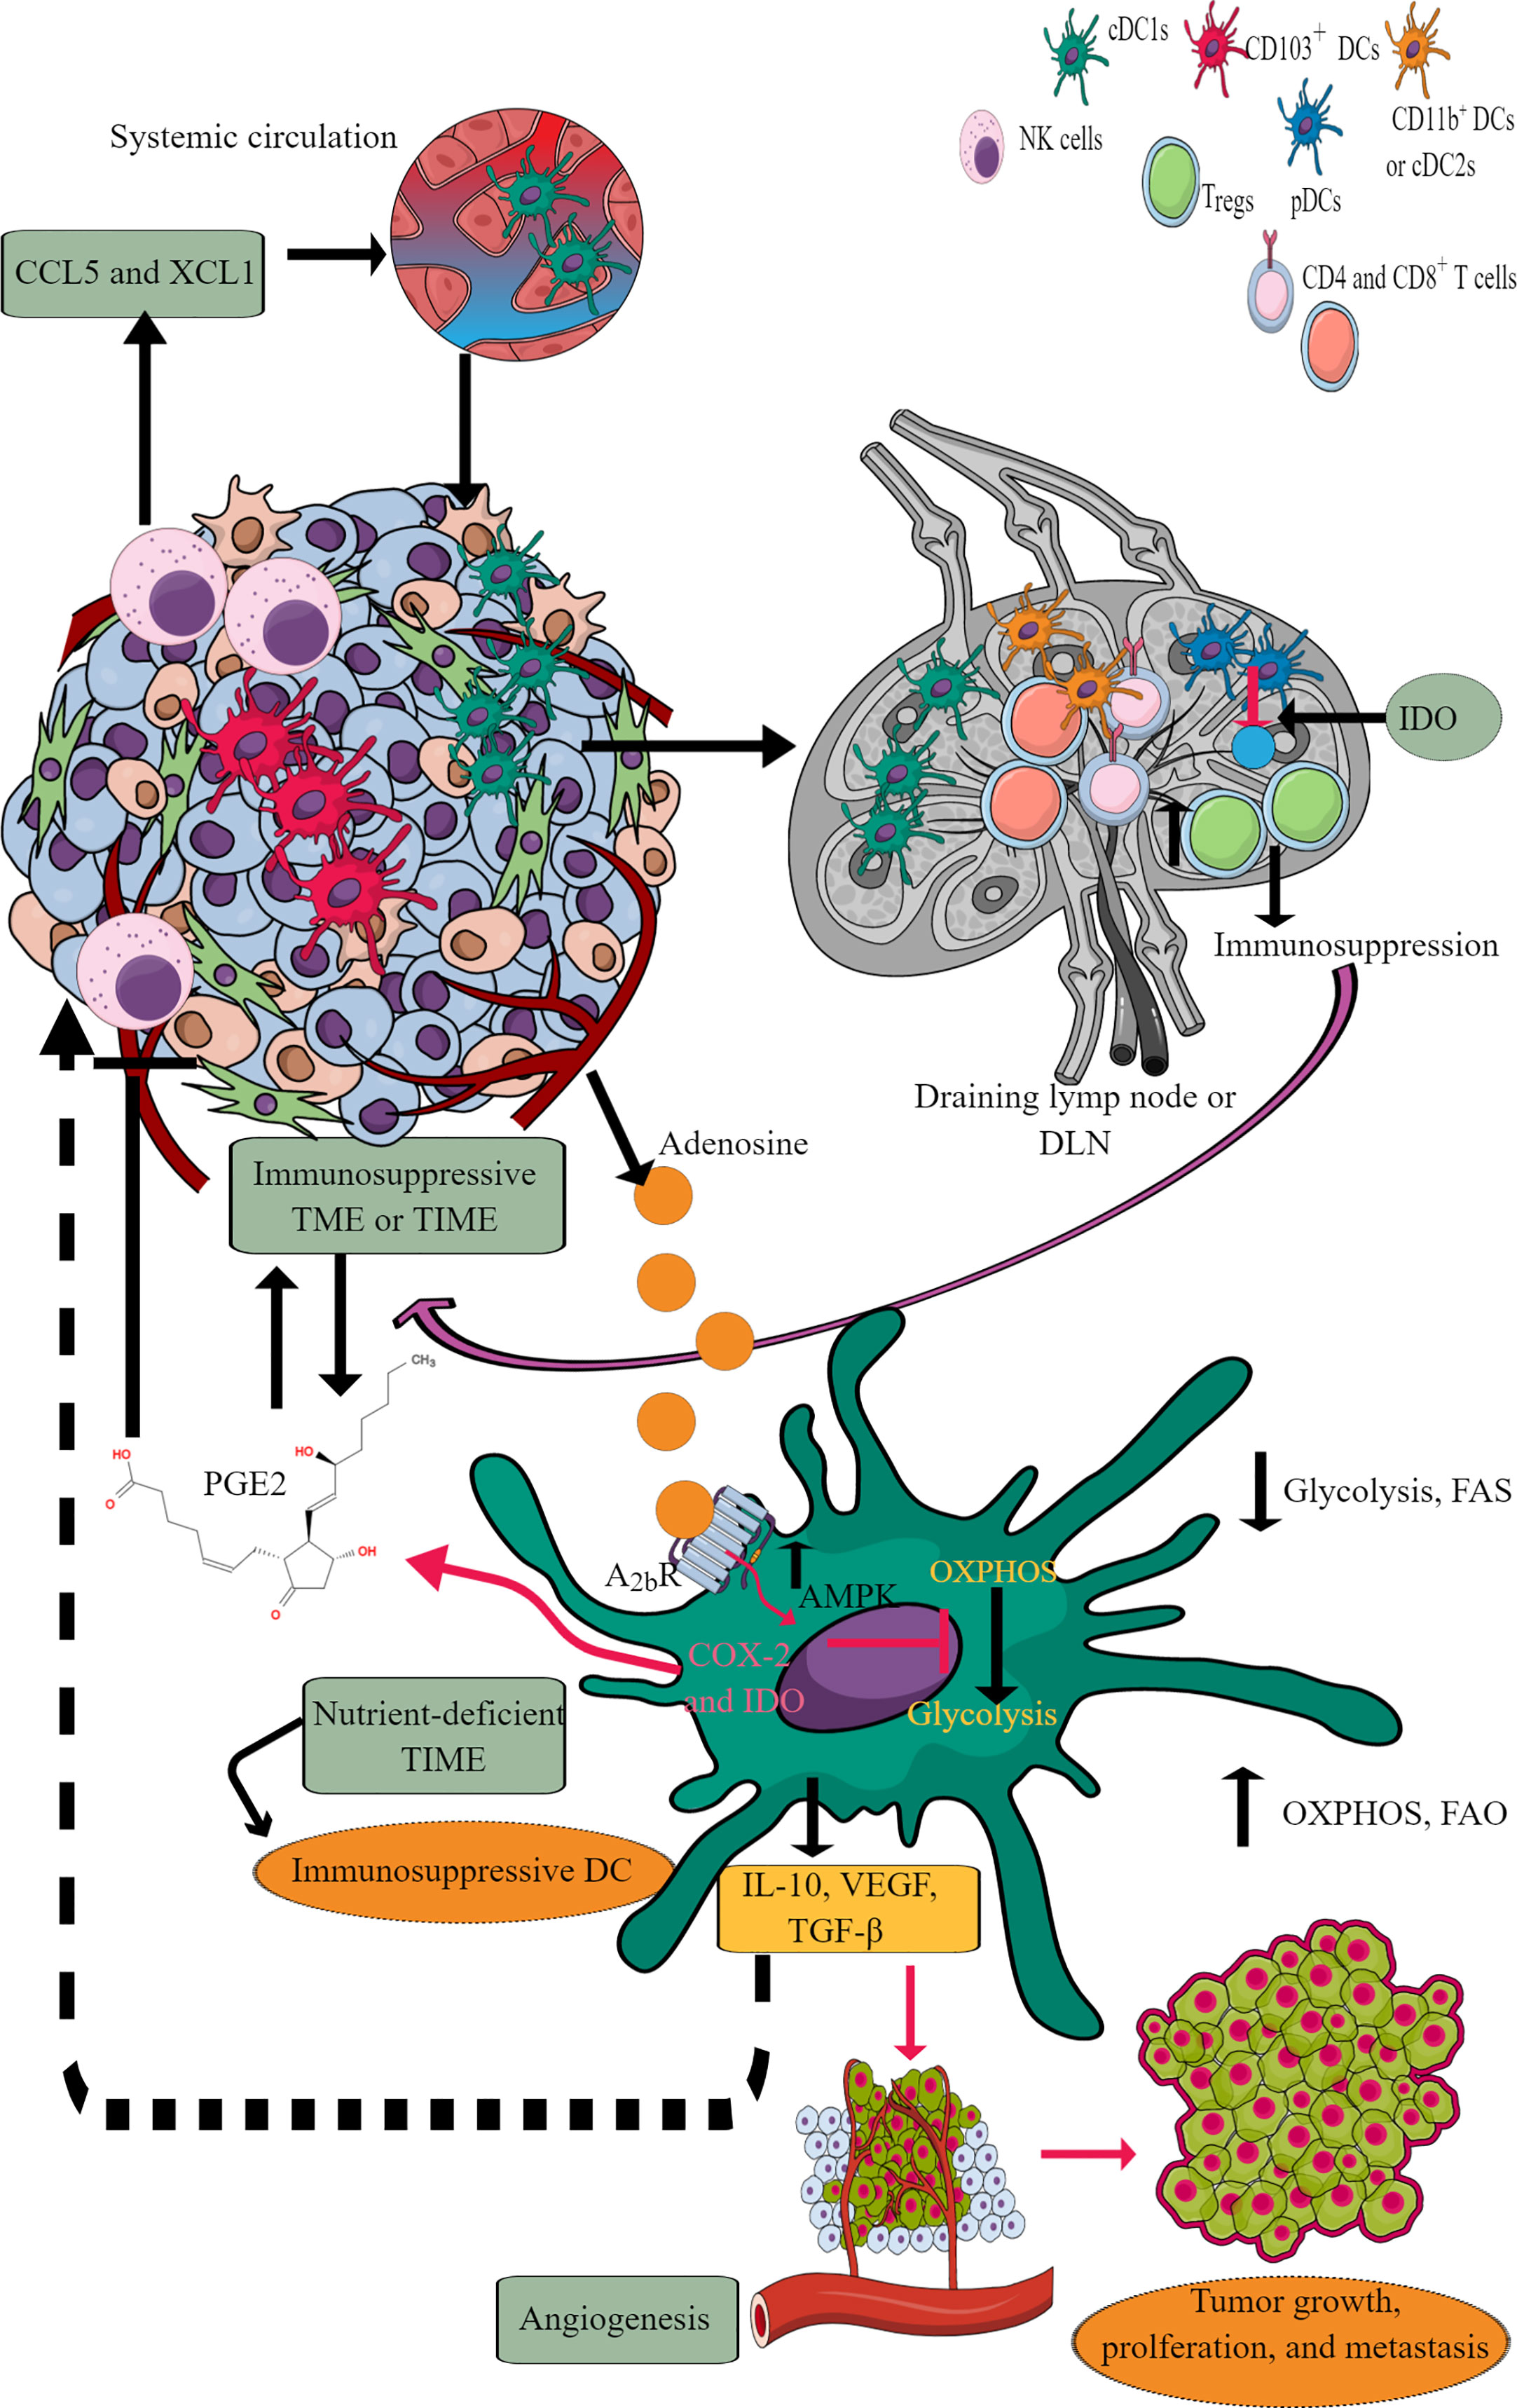
Figure 6 DCs in TIME and their immunometabolic reprogramming. TME or TIME-released chemokines induce DC chemotaxis. cDCs migrate to tumor DLNs for antigen presentation for adaptive immune cells (T and B cells) to induce antitumor immunity. However, IDO release from pDCs induces immunosuppression. Furthermore, adenosine in TME or TIME via A2bR blocks immunometabolic shift to glycolysis from OXPHOS and increases AMPK levels. Thus, tumor-associated DCs (TADCs) show an increased OXPHOS and FAO giving them an immunosuppressive phenotype to survive in the nutrient-deficient TME or TIME. These immunosuppressive TADCs release different factors and molecules to support immunosuppressive TIME, angiogenesis, and tumor growth and metastasis. Details are mentioned in the text.
Under a steady state, DCs depend on OXPHOS for their energy demand to maintain immune homeostasis (209). For example, bone marrow-derived DCs (BMDCs) depend on FAO for OXPHOS to meet the energy demand, but the involvement of FAO for OXPHOS in cDCs and pDCs is not yet clear (192, 209). FAO and OXPHOS do not provide the maximum threshold for DCs to secrete cytokines and activate T cells to create a pro-inflammatory environment. The pro-inflammatory PRRs, like toll-like receptor-4 (TLR-4) stimulation, reprograms DC immunometabolic state from OXPHOS to glycolysis within minutes, like other myeloid immune cells (209–211). The shift from OXPHOS to glycolysis induces their antigen presentation potential through increased major histocompatibility complex (MHC)-I and -II expression, co-stimulatory molecules (CD80 and CD86), and cytokine synthesis and release. Although increased glucose uptake by DCs during the early stages of activation is accompanied by lactate production, this does not reflect a commitment to Warburg metabolism as a mechanism for ATP production because, during this time, ATP is provided by OXPHOS (211). Instead, glycolysis fulfills the citrate needs of DCs is filled by glycolysis (211). The export of citrate from the mitochondria into the cytoplasm through the citrate transporter SLC25A is significant for fueling FAS required for activated DCs to increase the size of critical organelles (Golgi bodies and endoplasmic reticulum or ER) involved in protein synthesis and secretion. Intriguingly, the enlargement of these compartments co-occurs with increased gene expression downstream of TLRs but is regulated post-transcriptionally by increased glycolytic flux. This is controlled by the Akt-dependent phosphorylation and subsequent activation of hexokinase II (essential to catalyze the first step of glycolysis) (211).
The Akt activation involves TANK-binding kinase 1 (TBK1)/I-kappa-B kinase epsilon (IKKϵ), activation downstream of RIG-I–like receptor (RLR), indicating that the rapid glycolysis is a typical response to any innate immune recognition by DCs. This Akt activation occurs regardless of PI3K or mTOR (two canonical Akt upstream activators) inhibition (210, 211). Different PRRs, including TLR2, TLR6, TLR9, Dectin-1, and -2 activation, induce immunometabolic reprogramming to glycolysis in DCs that governs their inflammatory status and motility (212, 213). Notably, early glycolysis induction in DCs occurs independently of their pro-inflammatory phenotype. This allows DCs to rapidly respond metabolically to these danger signals originating in the TME (211).
DCs fail to mature in the absence of OXPHOS to glycolysis transition. Also, DCs showing weak inflammatory response lack long-term glycolytic reprogramming requiring increased glycolytic gene expression (212). Thus, a prolonged and increased glycolysis enzymatic gene expression is crucial for maintaining pro-inflammatory DCs and their migration. Also, DCs utilize pre-existing glycogen stores to support shifting from OXPHOS to glycolysis during their inflammatory stimuli to drive their TLR-dependent activation (214). The glycogenolysis inhibition attenuates TLR-mediated DC maturation and impairs their ability to act as APCs. Therefore, it is likely that even weak inflammatory signals can induce early glycolytic reprogramming through glycogenolysis without a significant and prolonged gene transcription crucial for glycolysis reprogramming. However, this is not true for other myeloid cells, including macrophages, which depend on external glucose supply through glucose transporter 1 (Glut1) upon inflammatory stimuli. Thus, only strong pro-inflammatory signals can induce prolonged inflammatory phenotype and DC motility in LNs.
IL-10 and AMP-activated protein kinase (AMPK, the central regulator of catabolic pathways and OXPHOS) inhibit glycolysis (215). The FAS inhibition enhances DCs’ capacity to activate allogeneic and Ag-restricted CD4+ and CD8+ T cells and induce CTL responses (216). Further, FAS blockade increases DC expression of Notch ligands and enhances their ability to activate NK cell immune phenotype and IFN-γ production. ER stress enhances DC’s immunogenic function upon FAS inhibition, accounting for its higher immunogenicity (216). Conversely, the ER stress lowering by 4-phenylbutyrate (4-PBA) suppresses their increased immunogenic action due to FAS inhibition. TLR7/8 stimulation with promoter-associated RNA (pRNA) increases FAO and OXPHOS in human mo-DCs due to branched-chain alpha-keto acid dehydrogenase complex E1-alpha subunit (BCKDE1α) phosphorylation in a phosphatase and tensin homolog (PTEN)-induced putative kinase 1(PINK1)-dependent manner. Interestingly, inducing PINK1 activity in tolerogenic DCs stimulates FAO and renders them immunostimulatory (217).
Tumor-associated DCs (TADCs), like tumor-associated T cells, also face the harsh nutrient-deficient environment that activates AMPK, inhibiting the immunometabolic reprogramming from OXPHOS to glycolysis. For example, AMPK supports OXPHOS by upregulating proliferator-activated receptor γ co-activator (PGC-1α) that binds to PPAR-γ to promote mitochondrial biogenesis, oxidative metabolism and antagonize anabolic metabolism (218, 219). Thus, TADCs lose their APC properties and migration capacity to DLNs to prime and induce a robust adaptive immune response against tumor antigens. The recognition of exogenous adenosine monophosphate (AMP) by adenosine A2b receptor expressed on DCs, including TADCs, upregulates their pro-tumorigenic functions, including angiogenesis via releasing VEGF, TGF-β, and creating an immunosuppressive environment through releasing IL-10 and expressing cyclooxygenase-2 (COX-2) and IDO (220–223). IDO (IDO1 and IDO2) activity metabolizes tryptophan (an essential amino acid) into kynurenine (224). Thus, the tryptophan depletion activates a stress response kinase called general control non-derepressing 2 (GCN2) in T cells that inhibits their proliferation and biases naïve CD4+T cells to develop into FoxP3+Tregs (225–227). Also, the kynurenine and other metabolites bind to the aryl hydrocarbon receptor (AhR) on T cells, promoting their differentiation to Tregs along with supporting the immunosuppressive macrophage and DC phenotype (226, 228–230).
Catabolism of pre-existing glycogen in DCs is crucial to initiate glycolysis independent of external glucose supply in response to the TLR activation (214). However, in TME or TIME, the continuous TLR signaling, including the TLR9 activation in response to the host cell-derived DNA creates an immunosuppressive TIME due to the increased IDO expression (231–233). Furthermore, TLR9 ligand CpG ODN 2006 is a poor adjuvant to induce CD8+T cells responsible for clearing tumor cells (234). This may be due to the poor DCs activation or their suppression through IDO generation. Further studies are required in this direction. The increased AMPK expression in TADCs also transforms them into tolerogenic DCs due to increased FAO and OXPHOS (210, 235). Furthermore, the aberrant lipid accumulation in TADCs due to the transport of extracellular lipids via macrophages scavenger receptor 1 (MSR1) diminishes their antigen-presenting capacity that suppresses their adaptive immune activation property to fight against tumors (236, 237). Also, the tumor-released Wnt5 molecule triggers PPAR-γ activation through β-catenin, which activates FAO by upregulating carnitine palmitoyltransferase-1A (CPT1A, a fatty acid transporter) in TADCs and induces a tolerogenic phenotype and secrete IDO to create an immunosuppressive TIME by upregulating Tregs (238, 239). Furthermore, the Wnt5 also blocks the immunometabolic shift to glycolysis in TADCs and induces an increased FAO. In addition, β-catenin induces vitamin-A metabolism in TADCs and FAO to produce retinoic acid (RA), further promoting Tregs generation to create an immunosuppressive TIME (240) Thus, TME or TIME DCs also become potent immunosuppressive immune cells and lose their antigen presentation characteristics to further support adaptive immunity against tumors due to their immunometabolic reprogramming supporting their survival but not potent immune function.
4.4 Immunometabolic reprogramming among innate lymphoid cells, including NK cells in TIME
ILCs are a relatively new class of immune cells, which phenotypically appear as adaptive lymphoid cells. However, they are lineage negative and do not express antigen-specific receptors encoded by rearranged genes, including T cell or B cell receptors (TCRs or BCRs). ILCs also do not show V(D)J recombination required for somatic hypermutation (SHM)/recombination, like T and B cells (241). However, they respond to various immunogenic stimuli, including pathogens, to mounting a pro-inflammatory immune response. Additionally, they are highly localized to mucosal surfaces (gastrointestinal, reproductive, and respiratory tracts). The details about different types of ILCs, including ILC1s or group 1 ILCs (NK cells and helper ILC1s), ILC2s (group 2 ILCs, produce Th2 cytokines), and ILC3s (group 3 ILCs, include RORγt+ ILCs and lymphoid tissue inducer or LTi cells) inflammation and their interaction with adaptive immune cells have been discussed elsewhere (242–246).
ILCs increase in the circulation of patients with cancer compared to healthy controls, indicating that they also infiltrate TME or TIME of different cancers (Figure 7) (247–251). Patients with a high number of circulating ILCs, including NK cells with great cytotoxic action, are less prone to develop cancer and metastasis (252–254). The ILC (NK cells, ILC1s, ILC2s, and ILC3s) infiltration into the TME at the early (premalignant) stage induces anti-tumor TIME to kill tumor cells through different mechanisms, including direct cytotoxic action and recruitment of different immune cells, including cytotoxic T cells, and eosinophils (255–259). The details of ILCs, including NK cells in early TME, have been discussed elsewhere (260, 261).
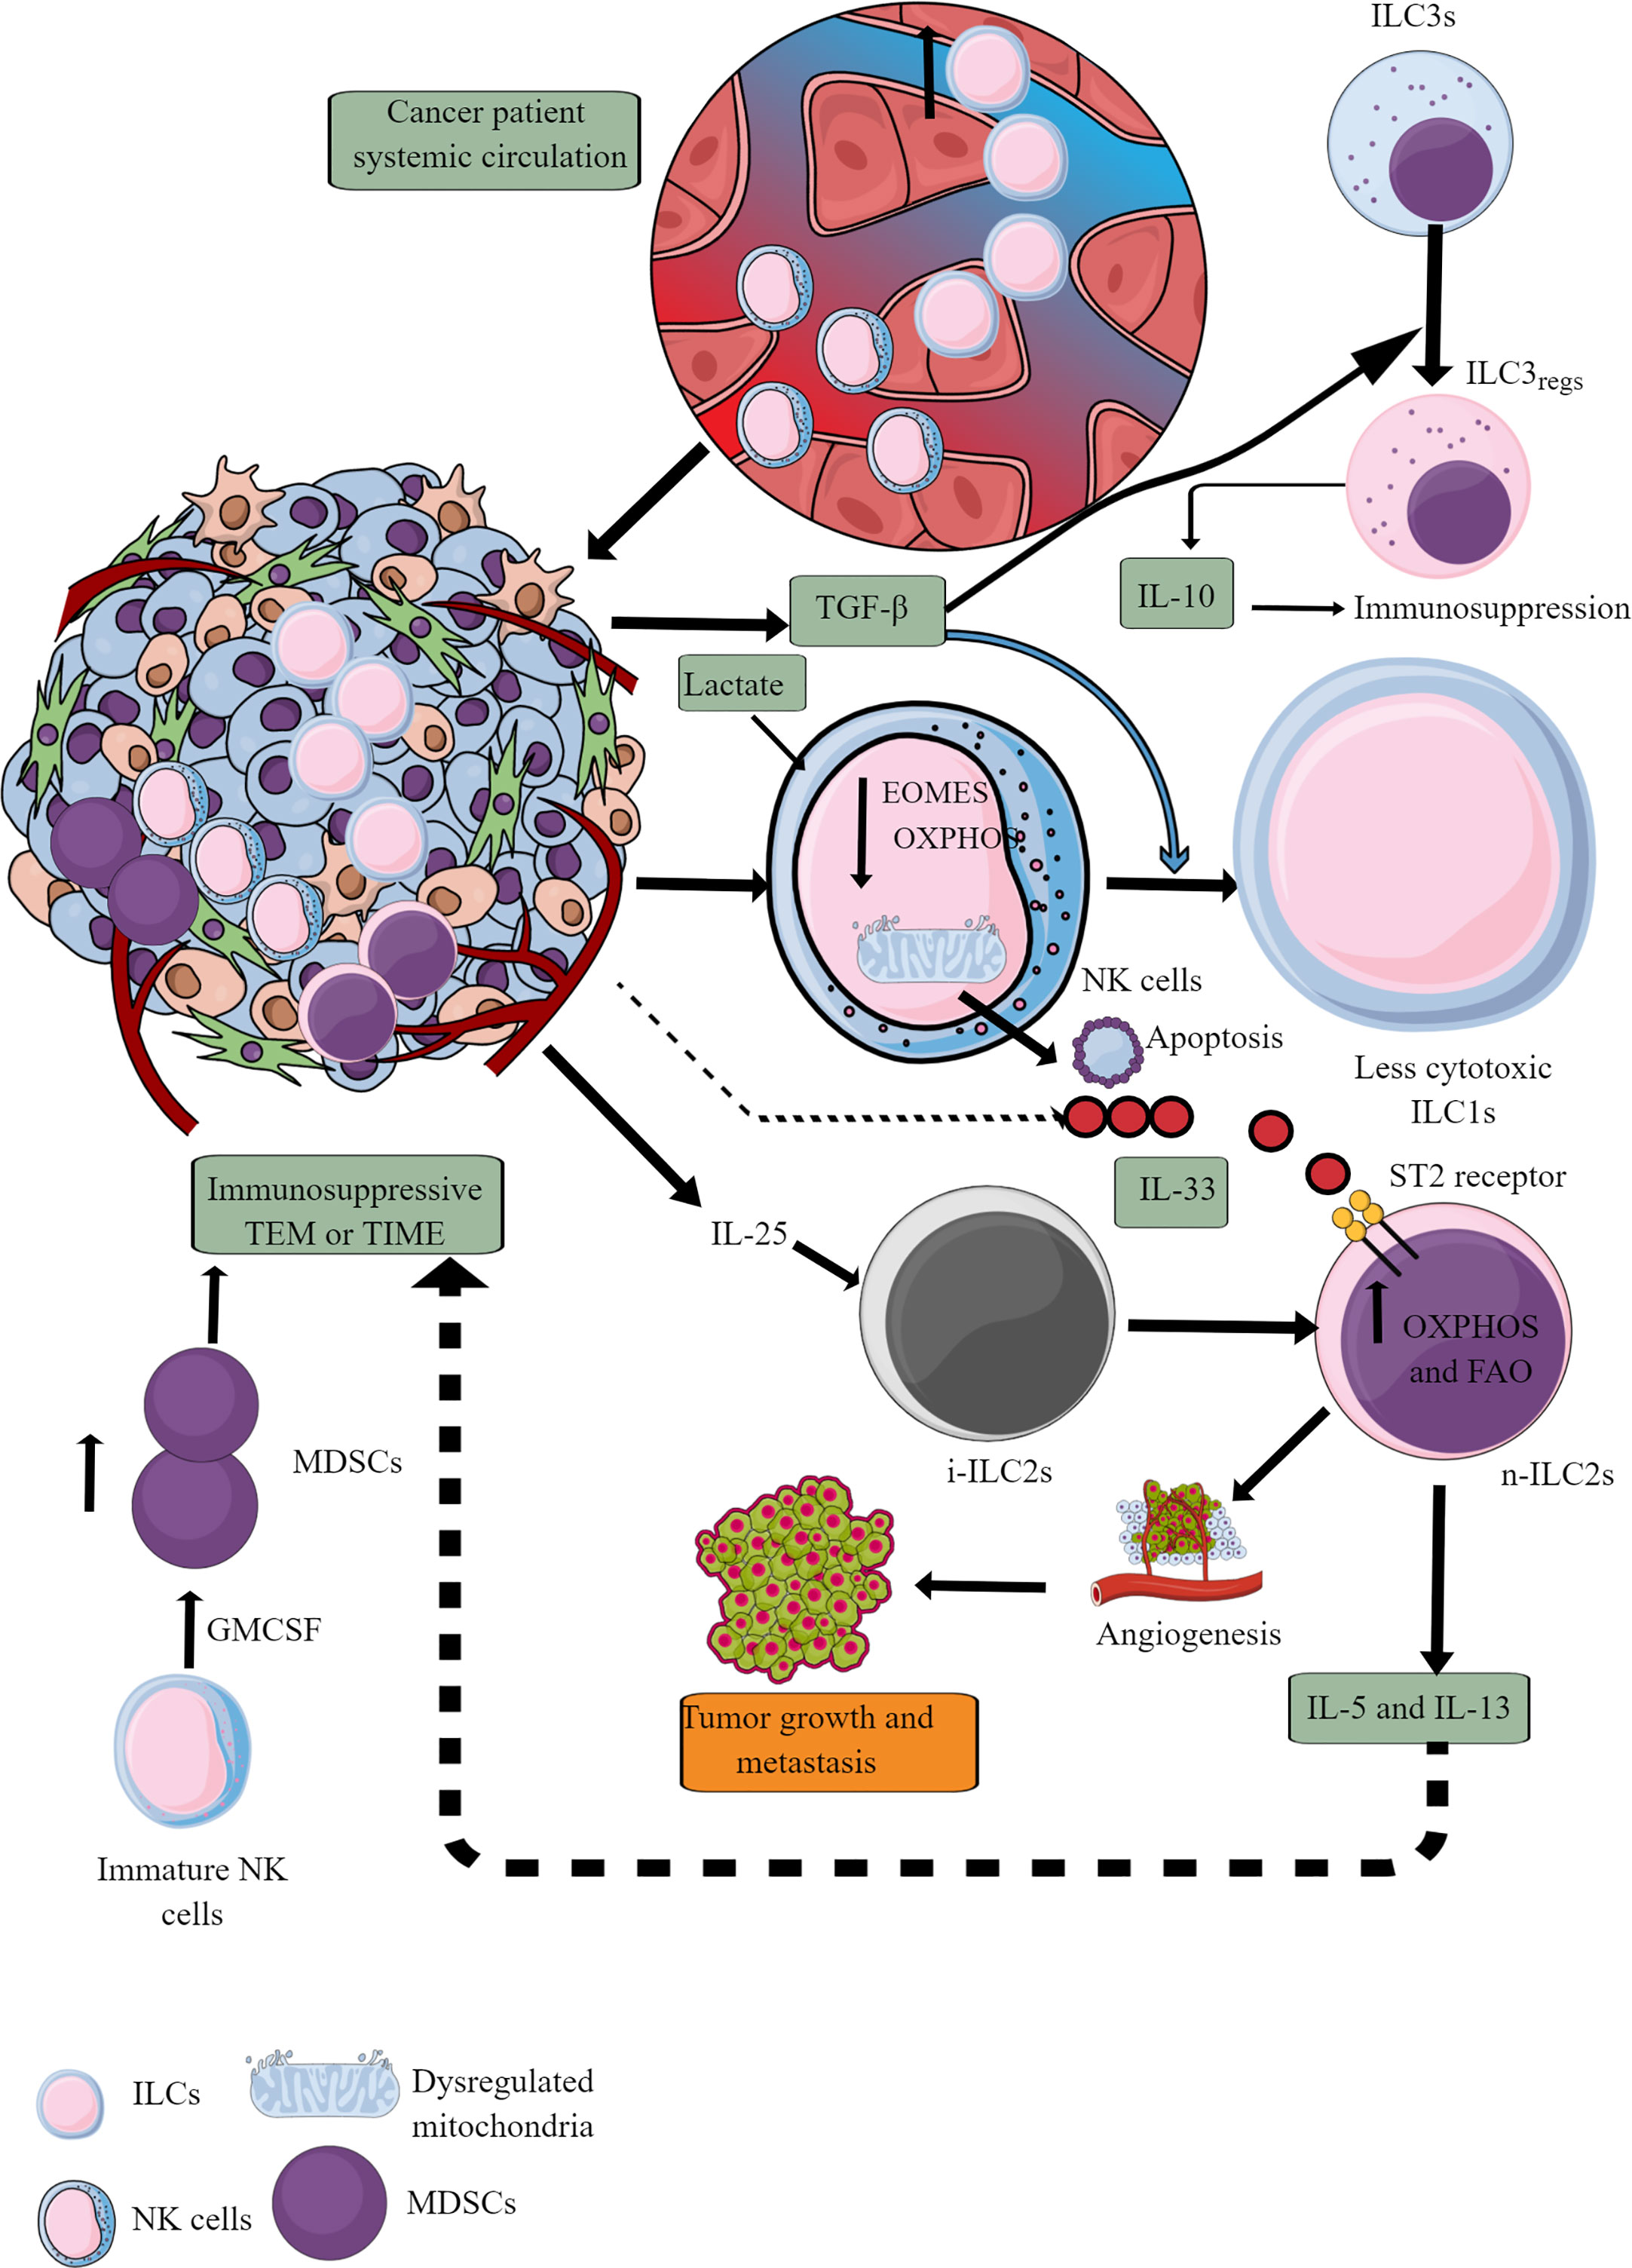
Figure 7 ILCs and NK cells in TIME and their immunometabolism. Different ILCs, including cytotoxic NK cells, are present in TME or TIME. The increased TGF-β levels in TIME transform high cytotoxic NK cells to less cytotoxic ILC1s and ILC3s to ILC3regs, which release IL-10 to support immunosuppressive TIME. Also, the high lactate levels in TIME or TME decrease NK cell OXPHOS, induce mitochondrial damage, and their apoptosis. Hence, the NK cell cytotoxicity (NKCC) is blocked in the immunosuppressive TIME that supports tumor growth. Furthermore, i-ILC2s polarize to n-ILC2s in the presence of TIME IL-25, further supporting angiogenesis, tumor growth, and metastasis by releasing immunosuppressive cytokines (IL-5 and IL-13). IL-5 and IL-13 are released from n-ILC2s in response to IL-33, increasing their OXPHOS and FAO. GM-CSF release from immature NK cells increases MDSCs proliferation, supporting immunosuppression. See text for details.
At later stages, NK cells infiltrating TME become less cytotoxic ILC1s (inefficient in controlling the growth and metastasis of tumor cells) in the presence of TGF-β secreted by tumor cells and other immunosuppressive immune cells (262–264). TGF-β also downregulates eomesodermin (EOMES) or T-box brain protein 2 (Tbr2) expression (Figure 7) (262). EOMES and T-box protein in T cells (T-bet) are crucial for NK cell development, maturation, and cytotoxic function (265–267). Also, EOMES is crucial for invariant NK (iNK)T cell development and differentiation in the thymus and their differentiation to memory-like KLRG1+iNKT cells in the periphery (268). iNKT cells facilitate the potent anticancer cytotoxic action of CD8+T cells by presenting different lipid and glycolipid antigens to expressed MHC class I-like molecule CD1d, in addition to direct killing (269, 270). iNKT cells also release IFN-γ that further supports tumor cell killing by NK cells (270). Hence, it will be novel to study the impact of TGF-β on iNKT cell development and function in TME or TIME, which depends on EOMES expression. Furthermore, TGF-β in TME also reprograms otherwise antitumor ILC3s to tumor-promoting regulatory ILC3s (ILCregs) and secrete IL-10 (271).
IL-25, an IL-17 cytokine subfamily member in TME or TIME, transforms inflammatory ILC2s (iILC2s) to natural ILC2s (nILC2s) or ILC3-like cells to create an innate tumor-permissive microenvironment through activating ILC2s via inducing IL-17 expression (272, 273). iILC2s have a low RORγt expression, but nILC2s do not (274). Also, these tumor infiltrating ILC2s are highly IL-25R+ (273). These nILC2s secrete large amounts of IL-5 and IL-13 (Th2 cytokines), creating an anti-inflammatory or immunosuppressive TIME (272). However, IL-25 exerts a tumor regulatory role through different mechanisms, including eosinophil and B cell infiltration, apoptosis, and Th2 cytokines secretion in TME to create an immunosuppressive TIME (275). The therapeutic blockade of IL-25R in colorectal cancer (CRC) lowers the tumor burden and activates an anti-tumor immune response in mice (273). These ILC2s join IL-25R+ MDSCs to create an immunosuppressive TIME in different cancers (276–278). Another study has shown that blocking IL-25 (released from gastrointestinal tuft cells) suppresses gastric cancer in mice, and the ILC2 axis, which is responsible for immunosuppressive IL-13 release (279). IL-33 (a member of IL-1 cytokine family) also promotes tumor survival and progression through different mechanisms, including Tregs functional stabilization (280, 281). Also, IL-33 exerts tumor supportive action via regulating PPAR-γ-mediated IL-4, IL-13, and IL-15 (Th2 cytokines) release from ILC2s (Figure 7) (282). Thus, antitumor functions of ILCs, including NK cells, ILC2s, and ILC3s, reprogram to tumor-promoting immune activity governed by their immunometabolic reprogramming.
ILCs, including NK cells recruited to the nutrient-competitive TME with tumor cells, adjust their immunometabolic requirement affecting their antitumor immune function. For example, NK cells depend on glycolysis and OXPHOS for their energy requirement under immune homeostasis due to their limited energy or biosynthetic demand (283, 284). Under inflammatory conditions due to increased energy demand to perform a cytotoxic function and cytokine release, immunometabolic reprogramming shifts more towards aerobic glycolysis than OXPHOS, although an increase in OXPHOS also occurs like effector CD8+T cells that depends on mTORC1 activation (285–287). However, TME does not support their increased glucose demand to exert their antitumor action. For example, increased TGF-β in TME induces NK cell suppression through decreasing mitochondrial metabolism, including OXPHOS, which is crucial to maintain its high metabolic demand to maintain its antitumor activity (288). This process occurs independently of mTORC1 inhibition. However, TGF-β blocks IL-15-dependent NK cell proliferation and maturation via inhibiting mTOR signaling (289). Thus, it will be interesting to delineate factors responsible for a differential effect of TGF-β on mTOR signaling and dependent metabolic reprogramming, as mTORC1 signaling is crucial for NK cell maturation and proliferation in patients with metastatic cancers (290).
It is important to note that blocking TGF-β restores the anti-tumor function (including metastasis prevention) of NK cells via restoring their immunometabolic reprogramming crucial for cytotoxicity and IFN-γ release (288, 289). Additionally, lactate accumulation in TME also blocks NK cells’ OXPHOS via inducing mitochondrial dysfunction due to increased ROS release, making them energy deficient and causing their apoptosis (Figure 7) (291). Thus, it will be interesting to delineate that to escape from apoptosis of TIME NK cells in the presence of TGF-β to polarize to less cytotoxic ILC1s having less energy demand to survive. Also, GM-CSF in TME converts immature NK cells to MDSCs, helping in cancer progression and metastasis (292).
The immunometabolic reprogramming of ILC2s is complex compared to other immune cells. For example, they use OXPHOS and branched-chain amino acids (valine, leucine, and isoleucine) to fuel their polarized mitochondria at their steady state during homeostasis (293). However, their developmental maturation depends on the HIF-1α-glycolysis axis (294). Hence, OXPHOS, branched amino acids, and glycolysis are crucial to maintaining ILC2s’ immune homeostatic function by regulating development and maturation. The release of IL-4, IL-6, and IL-13 (Th2 cytokines) from ILC2s is maintained by increased glutaminolysis, glycolysis, mTOR activation, and FAO (295, 296). However, they continue to OXPHOS through amino acid uptake to maintain their cellular fitness and proliferation (296). The increased FAO takes place in ILC2s of nutrient (glucose and glutamine)-deficient TME or TIME, which reprograms their antitumor function to tumor-promoting via releasing Th2 cytokines causing immunosuppression and angiogenesis (Figure 7) (297).
Furthermore, the increased IL-33 level in TME or TIME promotes ILC2’s pro-tumor function via binding to its cognate receptor ST2, promoting temporary storage of externally acquired FA in lipid droplets to make cell membranes (298). These accumulating lipid droplets transform into phospholipids to promote ILC2s proliferation. An enzyme called diacylglycerol o-acyltransferase 1 (DGAT1) regulates this process. PPAR-γ, a key transcription factor, governs this immunometabolic reprogramming crucial for lipid uptake, metabolism, and ILC2 function (297, 298). For example, genetic deletion or pharmacological inhibition of PPAR-γ and DGAT1 in ILC2s blocks the IL-33-mediated cancer growth and metastasis (282). The IL-33-mediated optimal immunometabolic reprogramming in ILC2s also requires ROS, and its inhibition can prevent its tumor-promoting role by suppressing IL-5 and IL-13 release (299). Thus, TME supports immunometabolic reprogramming among ILC2s to create an immunosuppressive TIME that supports tumor growth and metastasis.
4.5 Immunometabolic reprogramming among T cells in the TIME
T cells are crucial adaptive immune cells, which have the potential to regulate the immune system through helper T (Th) cell phenotype and direct killing of tumor cells through their cytotoxic action (CD8+T cells) (102). The pro-inflammatory T cells (Th1, Th2, and Th17 phenotypes collectively called T effector (Teff) phenotype) depend more on increased glycolysis than OXPHOSS (300, 301). The aerobic glycolysis controls Teff function, including the IFN-γ release through binding the glycolysis enzyme glyceraldehyde 3-phosphate dehydrogenase (GAPDH) to AU-rich elements within the 3’ untranslated region (3’ UTR) of IFN-γ mRNA (302). Also, the lactate dehydrogenase A (LDHA) induction in T cells supports aerobic glycolysis but supports IFN-γ release or Th1 differentiation independent of 3’UTR through epigenetic mechanisms (303). In addition, in acidic TME (due to lactate accumulation), LDH converts lactate to pyruvate and lowers nicotinamide adenine dinucleotide (NAD+) levels. The decreased NAD+:NADH further blocks glycolysis in T cells (Figure 8) (304). The increased lactate level in TME inhibits NAD+-dependent GAPDH and 3-phosphoglycerate dehydrogenase (PGDH) activity crucial for NADH reduction and serine production, important for T cell proliferation (Figure 8) (304). Serine supplementation rescues T cell proliferation in high lactate TME.

Figure 8 T cell subtypes and their immunometabolic reprogramming in the immunosuppressive TME or TIME. Different Th1 and cytotoxic T cells infiltrate initially to care for growing or premalignant tumors. However, the nutrient-deprived TME or TIME and the presence of immunosuppressive myeloid cells alter their function, including immunometabolic reprogramming. For example, CD8+ cytotoxic T cells undergo cell death, including ferroptosis. Additionally, Th1 and Th17 cells in the high lactate and nutrient-deprived (glucose and glutamine) TIME polarize to immunosuppressive Tregs. All these events support T cell immunometabolic reprogramming to their tumor-supportive phenotype and function, including CD8+T cell death. Details are mentioned in the text.
LDHA maintains a high acetyl-coenzyme A (acetyl-CoA) level that promotes histone acetylation and IFN-γ transcription. LDHA deletion in T cells suppresses their IFN-γ-mediated pro-inflammatory action and induces their differentiation to FoxP3+ Tregs. FoxP3 expression in Tregs reprograms their immunometabolism to OXPHOS via suppressing Myc activity and glycolysis and increasing NAD+ oxidation (Figure 8) (305). Due to this, Tregs resist highly acidic (lactate) TME and grow and proliferate (306). Tregs also take more lactate than Teffs to utilize it as a fuel for the TCA cycle or gluconeogenesis, which decreases their glucose need in the highly nutrient-competitive TME (305, 307). Tregs highly express lactate transporter, monocarboxylate transporter 1 (MCT-1), for lactate uptake in TME (307). Furthermore, TME lactate induces programmed cell death protein 1 (PD-1 or CD279) expression in Tregs, and PD-1 inhibition strengthens Tregs in TIME, causing treatment failure with PD-1-based checkpoint inhibitors (308, 309). However, a co-treatment with anti-PD-1 and a LDH inhibitor serves as a better anticancer treatment as this approach inhibits lactylation of Lys72 in MOESIN (a member of the ERM (ezrin, radixin, and moesin) proteins). The MOESIN lactylation inhibition improves MOESIN interaction with TGF-β receptor I and downstream SMAD (suppressor of mothers against decapentaplegic) family member 3 (SMAD3) signaling activating FoxP3 in Tregs (310).
Treg differentiation in TME or TIME depends on the Basic leucine zipper transcription factor, ATF-like or BATF transcription factor (311). Tregs are highly dependent on FAO or β lipid oxidation and OXPHOS for their immunoregulatory function due to the lower Glut1 and higher AMPK expression (300, 301). The fatty acid binding protein 5 (FABP5, a cellular chaperone long-chain FAs) in Tregs regulates OXPHOS and immunosuppressive function by inducing the IL-10 release in response to the type 1 IFN (released in response to cGAS-STING signaling) in low lipid availability TME for immune cells (Figure 8) (312). Hence, FABP5 is a gatekeeper for mitochondrial integrity modulating Tregs. Furthermore, FABP5 expression in pDCs in TME or TIME supports their tolerogenic role via supporting the generation of Tregs (Figure 8) (313).
Tregs generation do not need mTOR kinase (314). Also, the CD36 expression increases in Tregs, supporting their survival and proliferation in TME or TIME via increased FA uptake (Figure 8) (315). Furthermore, CD36 fine-tunes mitochondrial fitness via PPAR-β signaling to increase Tregs survival in a lactate-rich acidic TME by increasing OXPHOS (Figure 8) (315, 316). On the other hand, CD36 expressed on CD8+ cytotoxic T cells increases oxidized lipids/low-density lipoproteins (oxLDLs) uptake that increases lipid peroxidation (LPO) (Figure 8) (317). LPO activates p38 mitogen-activated protein kinase (p38MAPK) that induces CD8+T cell dysfunction through defective mitochondrial biogenesis in mTOR-independent signaling pathway governing their autophagy and glycolysis (Figure 8) (317, 318). CD36-mediated lipid uptake by CD8+T cells in TME also causes their ferroptosis and LPO to cause their death and immunosuppression (Figure 8) (319). Thus, CD36-mediated FA uptake determines T cell-dependent immunosuppressive TIME. Also, death/damage-associated molecular proteins (DAMPs) in TME promoting chronic inflammation can activate Tregs TLRs that, with FoxP3, balance mTORC1 signaling and glucose metabolism to control their proliferation and immunosuppressive function (320, 321). Hence, TME and TIME support Tregs for tumor growth and metastasis and induce resistance to chemotherapies and checkpoint inhibitors through immunometabolic reprogramming.
Th17 cells selectively express HIF-1α governed by mTOR signaling, a central regulator of cellular metabolism (301). HIF-1α is crucial for glycolysis induction and maintenance. The lack of HIF-1α in T cells at their differentiation stage reprograms them to develop into Tregs (Figure 8) (301). The tumor-associated Th17 cells with low glycolysis capacity reprogram to FoxP3+Tregs (Figure 8) (322). Thus, the local tissue environment, including metabolic status, is crucial determines T cell differentiation to their different phenotypes and function.
Low extracellular lactate promotes immune cell infiltration and proliferation at the premalignant stage, including T cells at the site to create a pro-inflammatory TIME to clear tumor cells. For example, CD8+T cells under physiologic normoxia utilize glycolysis to exert antitumor action, including IFN-γ release and cytotoxicity (323). The prolyl-hydroxylase (PHD) proteins are intrinsic oxygen-sensing molecules that promote Tregs growth and proliferation during hypoxia that develops at later stages of cancer (323). The T cell-specific internal deletion or pharmacological inhibition of PHD increases the antitumor action of tumor-infiltrating T cells. The increased energy demand among tumor cells reprograms their metabolism to increased glycolysis and creates a hypoxic TME. The increased glycolysis among tumor cells in TME increases extracellular lactate accumulation, which impairs the nuclear factor of activated T-cells (NFAT) activation and IFN-γ production by T and NK cells (324–326). This impairs the anticancer/tumor action of tumor infiltrating CD4+ and CD8+ T cells in the pro-inflammatory environment. For example, tumor infiltrating T cells in the glucose-deprived TME could not reprogram their immunometabolism to glycolysis, forcing them to rely on OXPHOS without exhibiting the Teff phenotype that causes their mitochondrial depolarization and exhaustion (327–329). IL-12 treatment rescues T cell exhaustion by increasing their mitochondrial potential and reducing their dependence of glycolysis (330). Hence, IL-12 treatment prevents forced OXPHOS while maintaining the balanced glycolysis and OXPHOS to maintain their full effector function.
The increased PD-1-PD-L1 signaling (TAMs, cancer cells, and tolerogenic DCs express PD-1 and PD-L1), altered epigenetic reprogramming, and nutrient-deprived stressful TME through coordinating with the TCR signaling prove lethal to tumor-infiltrating CD8+T cells by altering their immunometabolic reprogramming (131, 327, 331, 332). Thus, low access to appropriate nutrients (glucose, glutamine, and lipids) imposes a significant barrier to Teffs via metabolic stress (333–336). For example, T cells under hypoxic conditions with limited glucose conditions exhibit mTORC1 signaling pathway inhibition, decreased antigen-induced expression of genes (including cell adhesion molecules, cell cycle progression), and CD8+T cell proliferation and effector function (335, 337).
The insufficient glucose level in TME or TIME induces apoptosis among Teffsviaactivating pro-apoptosis genes/proteins, including phorbol-12-myristate-12 acetate-induced protein 1(MAIP1/Noxa, a Bcl2 family protein) and Bcl-2-associated X protein (Bax), destabilizing myeloid cell leukemia 1 (Mcl1), an antiapoptotic Bcl-2 family protein (338). However, memory Teffs are not programmed to upregulate FAS, OXPHOS, and reductive glutaminolysis in limited glucose conditions, including TIME, which allows them to maintain their function in the nutrient-limited/depleted microenvironment (339). Thus, naïve T cells survive the nutrient-depleted TME or TIME but lose their effector function, but only memory Teffs survive and function in the environment. In addition, increasing FAO activity in CD8+T cells in TME or TIME can enhance their cytotoxic action as they show an increased PPAR-α signaling and FA catabolism, which preserves their cytotoxic action (340, 341). However, it should be noted that tumor progression also increases co-inhibitor expression on CD8+T cells, and PD-1 blockers delay tumor progression by affecting tumor-infiltrating lymphocyte (TIL) metabolism and function.
The cell motility is controlled by subtype-specific transporters called MCT1 (Slc5a12 and Slc16a1), specifically expressed on CD4+ and CD8+ T cells. The lactate accumulation suppresses the cytotoxic action of CD8+T cells and promotes the CD4+T cells switching to Th17 cells (Figure 8) (324). Also, IL-2 (a cytokine critical for antitumor T cell function) signaling-mediated STAT5 activation becomes limited in a highly acidic TME (342). This further suppresses antitumor CD8+T cell function. The tumor-associated Th17 cells reprogram to FoxP3+Tregs in TME. The genetic targeting of LDHA in tumors decreases the pyruvate to lactate conversion restoring T and NK cell infiltration and their antitumor cytotoxic function (325). Pyruvate dehydrogenase kinase 1 (PDHK1) via inhibiting PDH determines the cytosolic lactate levels in T cells that varies with T cell subtype (343). For example, Th17 cells show a robust PDHK1 expression, whereas Tregs have it at an intermediate level and Th1 cells have very little PDHK1. Hence, TME promotes Th1 cells reprogramming to Th17 cells, then to Tregs under intratumoral high lactate level that also suppresses IL-2 signaling (342). The increase in the glutaminolysis in tumor cells also deprives infiltrated T cells of glutamine, further compromising their growth and proliferation (Figure 8) (344). The glutamine-deficient TME reduces cytosolic α-KG in Th1 cells supporting their differentiation to Tregs (345). The glutaminase (a key enzyme involved in glutaminolysis) genetic deletion or glutamine uptake blockade in tumor cells increases TME glutamine and upregulates T cell infiltration (128, 346). The glutaminolysis is linked to polyamine biosynthesis via a Myc-dependent metabolic pathway in T cells (347). Hence, immunometabolic reprogramming among tumor-infiltrated T cells is governed by TME, including the hypoxia and lactate level.
HIF-1α during hypoxia induces the PDL-1 (CD274) expression in tumor cells, DCs, TAMs, and MDSCs to support immunosuppressive TIME (188). For example, PD-1+ CD8+T cells in TIME are most immunodysfunctional due to the mitochondria loss (348). The mitochondria loss affects their oxidative (TCA cycle, FAO, and OXPHOS) and membrane potential (ROS and ATP production) due to PPAR-γ coactivator 1α (PGC1α) loss, which programs mitochondrial biosynthesis by Akt signaling (348). B-lymphocyte-induced maturation protein 1 (BLIMP1) activation causes PGC1α loss. The PGC1α loss increases ROS production that, through phosphatase inhibition and the consequent activity of NFAT, promotes T cell exhaustion through mitochondrial dysfunction and loss (349–351). The mitochondrial mass loss in CD8+T cells of TIME correlates well with PD-1 expression. Thus, the PD-1/PDL-1 interaction in TIME suppresses T cell immune response governed by their metabolic stage or alters T cell immunometabolism responsible for immunosuppression (142). The increased lipolysis of endogenous lipids and FAO among PD-1+CD8+T cells continuously exposed to PDL-1-expressing cells survive longer to support the immunosuppressive TIME. These immunosuppressive CD8+T cells highly express CPT1A and the adipose triglyceride lipase (ATGL), the lipolysis marker glycerol, and the release of FAs (142). On the other hand, the Tregs PD-1 engagement with PDL-1 promotes FAO and mitochondrial OXPHOS to fuel their energy requirement in the presence of TGF-β (142, 352).
TGF-β suppresses PI3K-mediated mTOR signaling and inhibits glucose transporter and hexokinase 2 (Hk2) expression that favors OXPHOS in induced-Tregs (iTregs). PD-1 reduces the TGF-β threshold for its immunosuppressive action, including the Treg development and function in the TIME (353). Reduced TGF-β signaling via TGF-β type 1 receptor (TβR1) is crucial for T cell activation and associated immune response (354). Hence, the increased TGF-β in TME and TIME suppresses antitumor T cell immune response through metabolic reprogramming. The details of PD-1 signaling mediated T cell immunometabolic reprogramming responsible for T cell immunosuppression are discussed elsewhere (141). Blocking PD-1/PDL-1 signaling restores glucose in TME, which permits T cell glycolysis and IFN-γ production as an antitumor immune response (78). However, blocking PD-L1 directly in tumors inhibits their glycolysis via suppressing mTOR signaling and glycolysis enzymes (78). Tumor and immune cell-secreted and expressed molecules create a T cell-mediated immunosuppressive TIME in the TME to support tumor growth, proliferation, and metastasis via immunometabolic reprogramming.
4.6 B cells in TIME and their immunometabolic reprogramming
Murine cancer models have indicated the role of B cells in tumor pathogenesis and immunity, including their regulatory role in innate immune cell infiltration in the premalignant tissue to promote chronic inflammation, which promotes epithelial carcinogenesis (Figure 9) (355, 356). For example, antibodies released from activated B cells in premalignant tissues fuel chronic inflammation through Fcγ receptor (FcγR)-dependent innate immune cell infiltration into the preneoplastic and neoplastic TME (Figure 9). Hence, B cells have been shown to promote cancer through promoting early malignancy via supporting chronic inflammation. However, in established tumors, B cells act as antitumor immune cells by promoting IFN-γ secreting Th1 immune cells, which are crucial for generating an adequate antitumor immunity in response to checkpoint inhibitors (357, 358). Even, intratumoral immunotherapy success depends on B and T cell collaboration (359, 360). In humans, intratumoral B cells are good prognosis markers for different cancers (361). However, the clonal diversity among infiltrated B cells affects survival of patients with cancer depending on type (362–364). For example, in TME or TIME, intratumoral B cell number highly depends on tertiary lymphoid structures (TLSs), as tumors without TLS have low B cell numbers (365, 366). Furthermore, B cell maturation, selection, and expansion occur in the mature TLS of tumor tissue that determines their antitumor (367, 368).
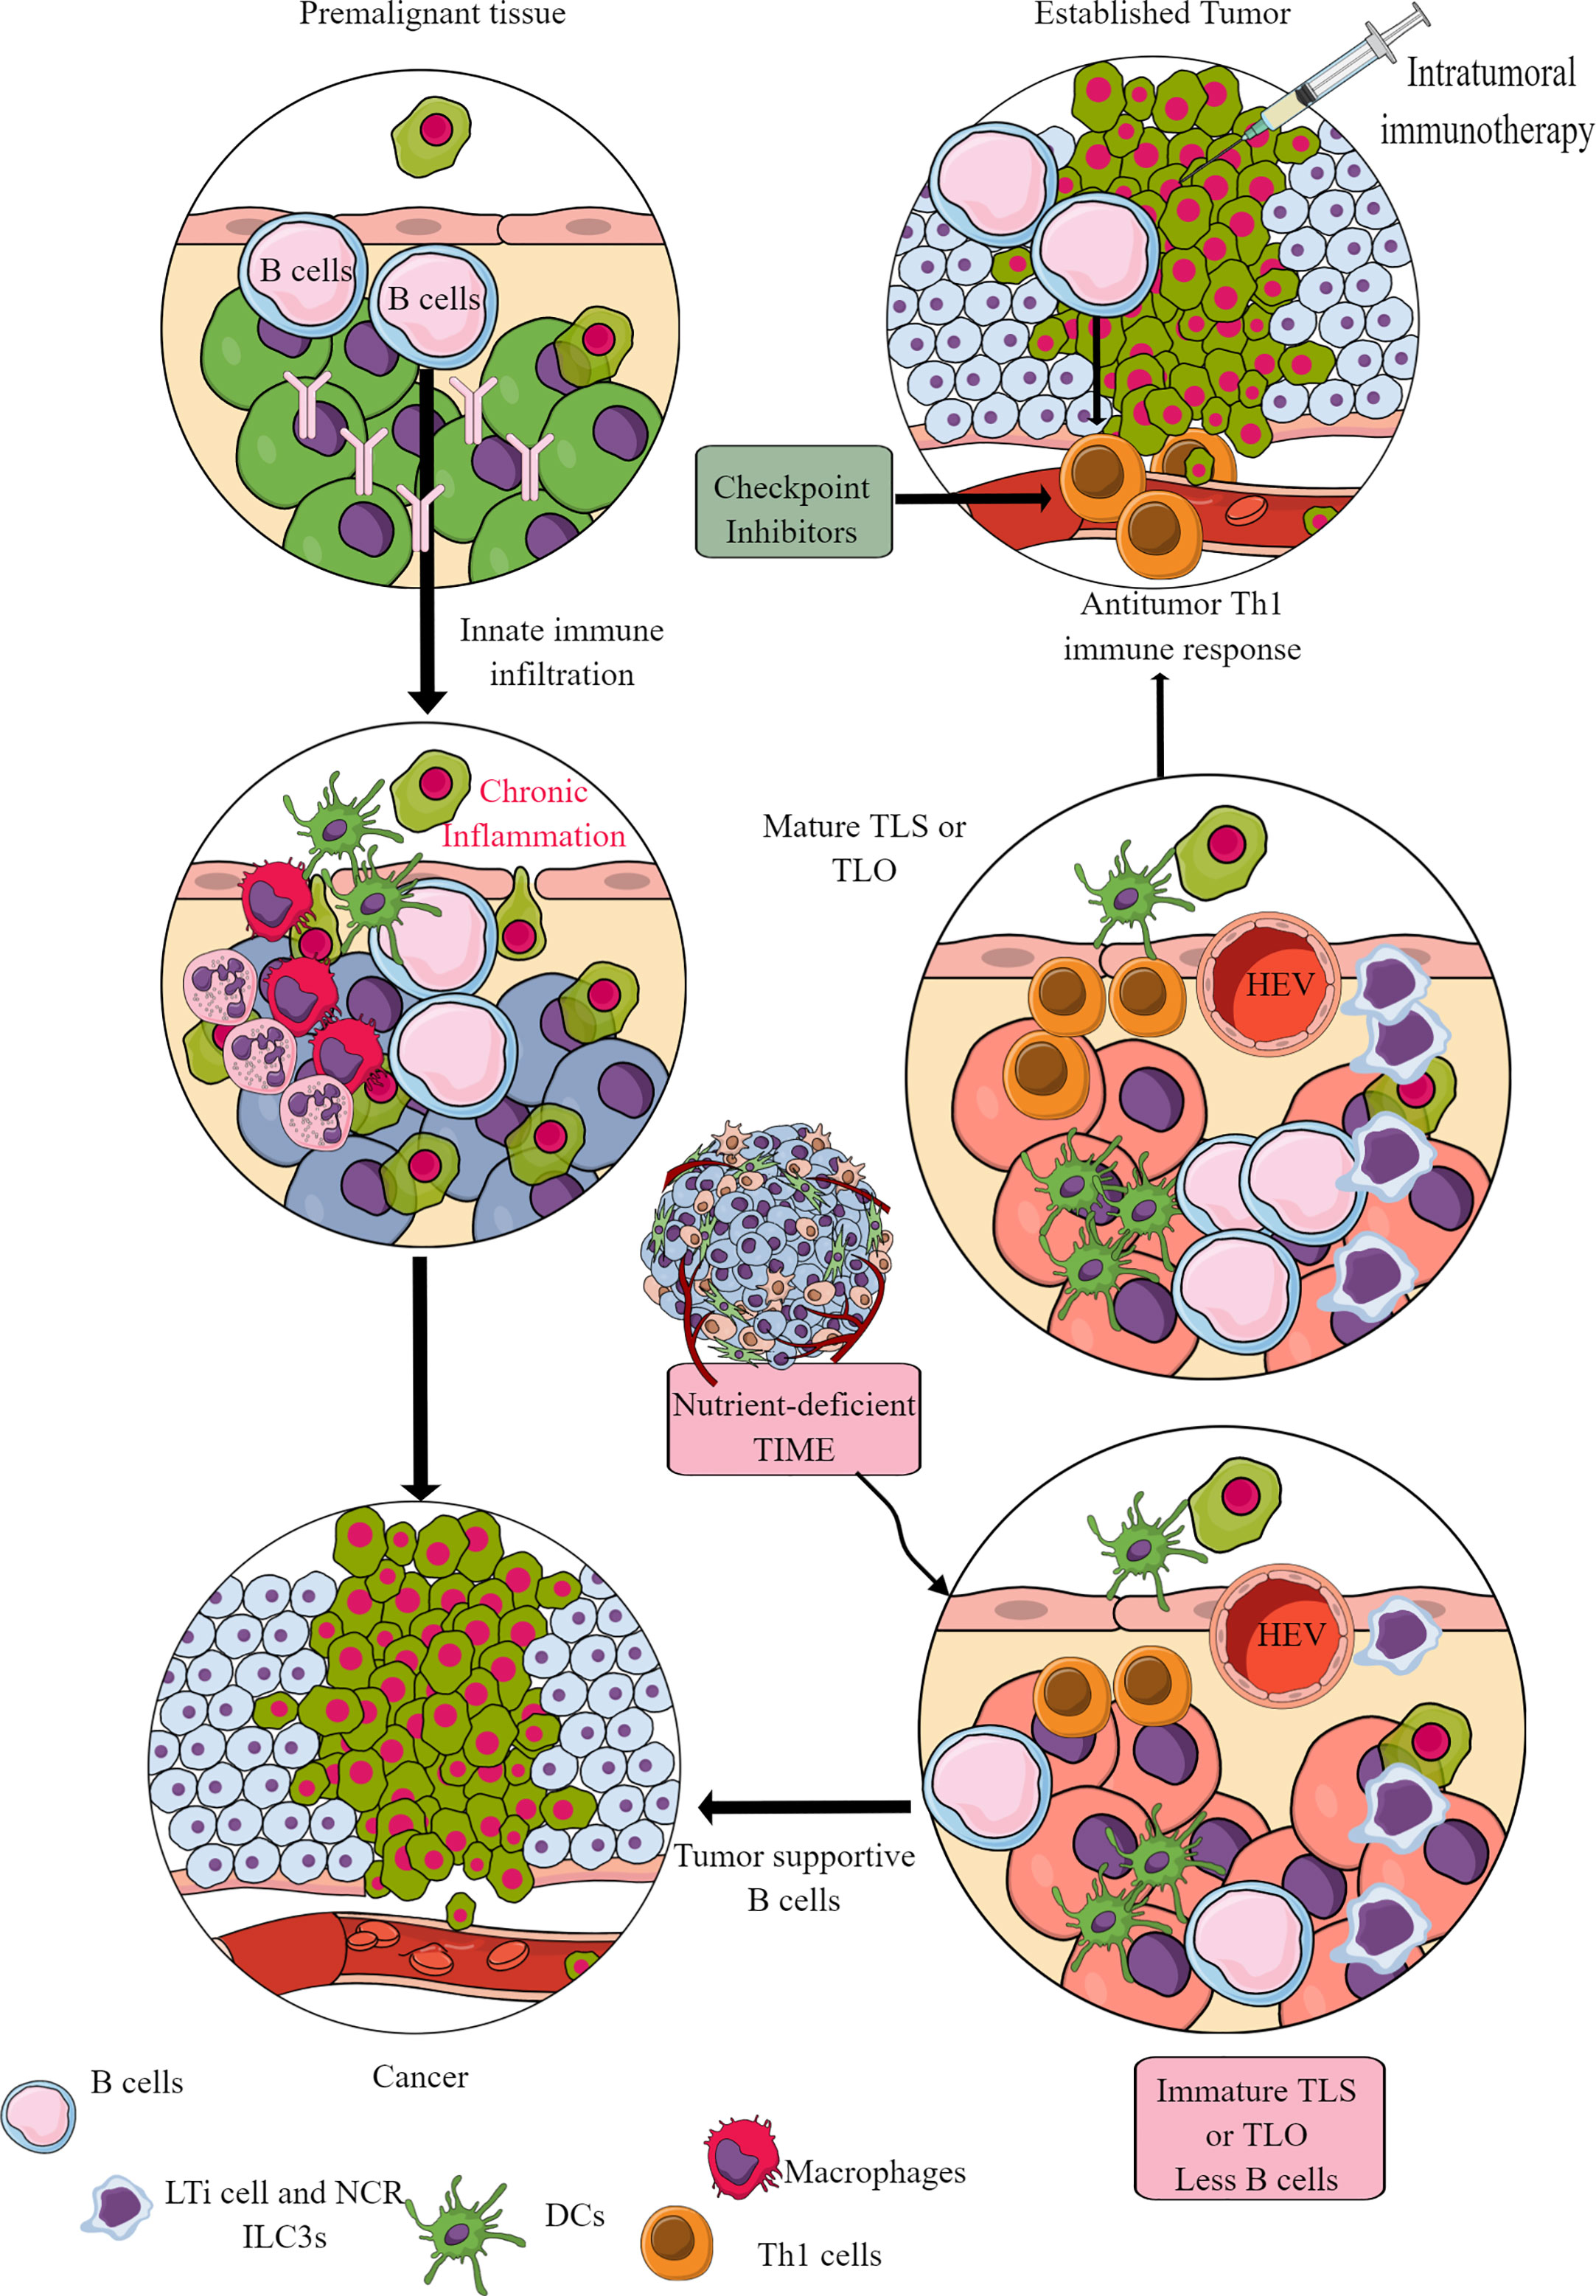
Figure 9 B cells in TIME. B cells in the premalignant tissue are the first immune cells to send signals to innate immune cells. This causes chronic inflammation. Unresolved chronic inflammation is linked to several cancers, including lung, breast, and colorectal cancers. However, in established tumors, B cells serve as antitumor immune cells and support intratumoral immunotherapies and Th1 immune response. However, only mature B cells perform antitumor functions, and their maturation occurs in the TLS or TLOs. The nutrient-deprived TME or TIME does not support TLS maturation, and immature B cells and Bregs increase immunosuppressive TIME. See text for details.
The mature TLS B cells increase antitumor T-cell activity in TIME and the responsiveness of tumors to immunotherapies (Figure 9) (368). On the other hand, B cells in immature TLSs do not have potent antitumor action. Instead, they become tumor-supportive (Figure 9). The B cell numbers, including the presence of switched memory B cells in tumor TLSs, guide the success of potential tumor immunotherapy and the associated patient survival (365). The details of B cells in TME and TIME are discussed elsewhere (361, 369–371). However, TLS maturation depends on the availability of extracellular ATP molecules (including the microbe-derived ones), which use ILC3-driven (IL-22, TNF-α, IL-8 and IL-2) and colony-stimulating factor 2 (CSF2)-dependent axis to induce the monocyte to macrophage transition in TIME (372, 373). These NCR+ILC3s are in higher numbers in the early stages (stage 1 or 2) than in later tumor stages, and their presence directly correlates with the density of TLSs in TIME (373). For example, gut microbiota may influence the efficacy of tumor immunotherapy via many immunomodulatory mechanisms, including the secretion of metabolites supporting the development and maturation of TLSs in TIME (374). Hence, a nutrient-competitive TME does not support the maturation of TLSs in TIME to escape from B cells and other immune cell-based antitumor immunity (Figure 9).
B cells are divided into B1 B cells, conventional B2 cells, and marginal zone B (MZB) cells. MZB cells have an innate-like function and are present mainly in the spleen along with LNs and blood to take care of blood-borne pathogens and circulating antigens or foreign particles (375, 376). Out of B1 (form in fetal life and then depend on self-renewal in adult life) and B2 B cells (constantly keep developing in BM), B1 B cells are more dependent on OXPHOS and glycolysis and are more active at the resting stage than B2 B cells (377–379). In addition, B1 B cells acquire external lipids as lipid droplets. Furthermore, B1 B cells have a unique immunometabolic programming that depends on their location and specific functional properties as autophagy-deficient B1-a B cells down-regulate critical metabolic genes and accumulate dysfunctional mitochondria (379). Hence, the autophagy gene Atg7 is crucial to maintain their immunometabolic status to support their high proliferative and secretary functions.
Non-proliferative naïve B cells depend on OXPHOS due to the glycogen synthase kinase 3 (GSK3) activity required to maintain their metabolic quiescence and prevent proliferation (380). However, tumors have insufficient naive non-proliferating B cells (371). The germinal center (GC) B cells have different immunometabolic requirements depending on their location in the light zone (LZ) and dark zone (DZ). For example, in mature GCs (the microanatomical sites of antibody diversification (B cell clonal expansion) and affinity maturation), the DZ has large and mitotically active proliferating B cells (centroblasts) undergoing somatic hypermutation (SHM). These DZ B cells depend on glycolysis for the energy demand and differentiate into LZ B cells (381). Whereas the LZ of the GC contains a large portion of infiltrating and non-proliferative quiescent naïve B cells, which are also called centrocytes and compete for antigen presentation to follicular helper T (Tfh) cells mainly depend on OXPHOS (382, 383). However, LZ B cells expressing BCR and CD40 are rewired to highly express c-Myc, stimulating mitochondrial biosynthesis and genes required for glycolysis, promoting their re-entry to the DZ of the GC (384–386). These c-Myc-expressing centrocytes also express HIF-1α to support anaerobic glycolysis (387).
Memory B cells depend on OXPHOS for their metabolic demand. In contrast, plasma cells (PCs) or antibody-secreting B cells depend on OXPHOS and other carbon-utilizing metabolic pathways, including the TCA cycle, and nucleotide biosynthesis (PPS or PPP) that supports ribosome synthesis or ribogenesis, but not glycolysis (388–390). This glucose deprivation of PCs does not affect their humoral functions, but OXPHOS and glutaminolysis inhibition impairs their growth and differentiation. Hence, B cell activation requires considerable mitochondrial remodeling due to extensive OXPHOS. In addition, long-lived plasma cells (LLPCs) also depend on amino acid metabolism (glutaminolysis) and autophagosome formation (391, 392). Notably, PC metabolic reprogramming may also be affected by other factors, including the type of antibody production, location, and other metabolites (vitamins). For example, vitamin B1 supports the TCA cycle in Peyer’s patches in IgM-producing PCs without affecting IgA production (393). The tumor-infiltrating IgM memory B cells and switched memory B cells (IgG- and IgA-producing PCs) are present in different cancers, including breast cancer (BC), renal cell carcinoma (RCC), and head and neck squamous cell carcinoma (HNSCC) (394–396). The GC B cells, plasmablasts, and plasma cells are present in non-small cell lung cancers (NSCLCs), RCCs, HNSCC, and ovarian and prostate cancers (367, 395–397).
In TME or TIME infiltrated B cells under the influence of IL-6, IL-1β, IL-12p35, and low oxygen (tumor-promoting molecules), which polarize to regulatory B cells (Bregs), producing TGF-β, granzyme B (GZMB), IL-10, and IL-35, which promote tumor growth and metastasis (398–402). The metabolic reprogramming among Bregs in TIME is unclear, but IL-10 secretion depends on glucose influx-dependent OXPHOS, PPP, amino acid metabolism, and oxygen level in the TME. Also, a balance between Bregs and PCs derives potential antitumor immunity during pancreatic cancer (403). However, IL-35 in TME breaks this balance and stimulates the STAT3-paried box 5 protein (PAX5, a transcription factor crucial for B cell differentiation) complex, upregulating B cell lymphoma 6 (BCL6, a transcriptional regulator) in naive B cells. BCL6 inhibition in tumor-educated B cells reverses dysregulated B cell differentiation and stimulates the intra-tumoral accumulation of PCs and Teffs. This renders pancreatic tumors sensitive to anti-PD-1 blockade (403). Hence, B cell metabolic reprogramming in the TME or TIME alters their antitumor action and promotes their polarization to tumor-supportive Bregs.
5 Targeting immunometabolic reprogramming in cancer
The dendrimer-mediated nanomedicine-based therapeutic targeting of TAM-specific mitochondria in glioblastoma has stimulated their anticancer function (404, 405). Also, targeting TAMs of pancreatic ductal adenocarcinoma (PDA) to block the pyrimidine metabolites’ release, including deoxycytidine, sensitizes tumors to the anticancer drug gemcitabine (a pyrimidine anti-nucleoside) (406). The pyrimidine synthesis in M2 macrophages occurs in response to the increased FAO and TCA cycle (406). Also, serine metabolism is crucial for M1 to M2 macrophage polarization to support immunosuppressive TIME. Serine depletion, either by inhibiting phosphoglycerate dehydrogenase (PHGDH, crucial in the serine biosynthesis pathway) or by exogenous serine and glycine restriction, robustly enhances the polarization of M1 macrophages with antitumor potential along with suppressing M2 macrophages (407). Serine metabolism inhibition in macrophages increases the insulin-like growth factor-1 (IGF1) expression via decreasing the S-adenosyl methionine (SAM)-dependent histone H3 lysine 27 trimethylation. IGF1 then stimulates p38-dependent Janus kinase or JAK–STAT1 axis, promoting M(IFN-γ) or M1 polarization and suppressing M(IL-4)) or M2 macrophages (407). Hence, targeting macrophage metabolism in different cancers can increase the efficacy of available chemotherapies.
Also, targeting glutamine metabolism in TME blocks the immunosuppressive effects of MDSCs, induces their activation-induced cell death (AICD), and the MDSC transition to antitumor M1 macrophages (138). Glutamine metabolism inhibition, specifically to tumor and myeloid cells with a prodrug called 6-diazo-5-oxo-L-norleucine (DON), decreases CSF3 level in TME that blocks MDSCs recruitment and induces immunogenic cell death, promoting the recruitment of M1 macrophages. Targeting glutamine metabolism also inhibits the tryptophan metabolism generating immunosuppressive kynurenine metabolites (138). However, glutamine deprivation in CD8+T cells of hepatocellular carcinoma (HCC) induces their apoptosis due to mitochondrial dysfunction (408). Hence, cell-specific glutamine metabolism targeting specifically in the TME/TIME may serve as a potential immunometabolism regulatory approach. However, lactate treatment increases the stemness of CD8+T cells to augment their antitumor action by inhibiting histone deacetylase (HDAC) activity that acetylates H3K27 of the transcription factor 7 (Tcf7) super-enhancer locus causing its increased gene expression (409). Furthermore, the adoptive transfer of CD8+T cells treated in vitro with lactate show an increased antitumor action. Hence, adoptive transfer of oncometabolites’ treated T cells may serve as immune cell-based therapeutics for cancer due to their epigenetic modification and resistance development to harsh TME. However, further studies are needed in this direction.
The CD28-mediated co-stimulation among tumor (ccRCC) infiltrated CD8+T cells has restored their defective glycolysis and mitochondrial oxidative metabolism by upregulating Glut3 (410, 411). However, an early study indicated that glycolysis does not support long-term memory CD8+T cell formation and their antitumor action (412). Hence, it becomes crucial to explore these effects related to glycolysis in naïve CD8+T cells or tumor-infiltrated CD8+T cells to better design immunometabolic reprogramming approaches specific to different cancers. CD47 regulates CD8+ T cell activation, proliferation, and fitness in a context-dependent manner, including cancer (413). So, it will be novel to understand the impact of CD47 engagement on glycolysis in CD8+T cells in TIME or homeostasis. For example, CD47 blockage on CD8+T cells mediates immunogenic tumor destruction (414, 415). Furthermore, the decreased CD47 expression on cancer cells increases macrophage infiltration in tumors with an enhanced potential to phagocytose cancer cells (416). CD47 expression increases in TME in response to IL-18 released from macrophages during chemotherapy (doxorubicin). IL-18 upregulates L-amino acid transporter 2 (LAT2) expression in tumor cells, enhancing leucine and glutamine uptake. Glutamine and leucine are two potent mTORC1 signaling stimulators. Thus, increased cellular leucine levels and glutaminolysis activate mTORC1 signaling, which by c-Myc activation, induces CD47 transcription and expression (416). Hence, CD47 blocking in CD8+T cells and tumor cells may increase tumor clearance and patient survival through metabolic alteration of tumor and immune cells.
Additionally, glutarate administration reduces the tumor burden by increasing CD8+T cells in the TME and systemic circulation and their antitumor function by immunometabolic reprogramming (417). The glutarate reprograms CD8+T cell immunometabolism responsible for their cytotoxic function, involving a post-translational modification of the pyruvate dehydrogenase E2 (PDHE2) subunit of the PDH complex (PDHc). The PDHc glutarylation induces a rapid pyruvate conversion to lactate and increased glycolysis in CD8+T cells to reprogram their antitumor function (417). Furthermore, the magnesium (Mg2+) treatment increases the co-stimulatory function of leukocyte function-associated antigen-1 (LFA-1) on CD8+T cells to exert their cytotoxic action against tumor cells via different mechanisms, including immunometabolic reprogramming (418, 419). CAR-T cells also exert an improved and more extended antitumor function upon Mg2+ supplementation. Notably, TME has less available Mg2+ for immune cells, including CD8+T cells, due to its high usage by tumor cells. Hence, intratumoral Mg2+ supplementation improves antitumor TIME to fight against tumors and improves CAR-T cell-based immunotherapy.
L-arginine availability to T cells increases their survival by immunometabolic reprogramming (transition of glycolysis to OXPHOS). It promotes their differentiation to central memory-like T cells with anti-tumor activity without inducing mTOR signaling (420). L-arginine increases T cell survival in TME through targeting transcriptional regulators bromodomain adjacent to the zinc finger domain 1B (BAZ1B) or Williams syndrome transcription factor (WSTF), PC4 and SFRS1 interacting protein 1 (PSIP1), and translin (TSN) (420). The mitochondrial arginase 2 (Arg2) depletion in CD8+T cells increases their survival and antitumor action (421). The CD8+T cell-specific Arg2 inhibition synergizes the antitumor action of PD-1 blocking checkpoint inhibitors. Thus, l-arginine depletion in the TME or TIME by tumor cells and myeloid suppressor cells due to the activation enzymes (Arg1 and iNOS2) compromises an efficient antitumor action of T cells, including CD8+T cells to clear tumor cells (422). The use of genetically modified bacteria (Escherichia coli Nissle 1917 strain) or ECN that utilizes ammonia to synthesize L-arginine in tumors has increased antitumor T cell infiltration in TME or TIME to clear the tumor (423, 424). This genetically modified bacteria used as bacterial anticancer therapy (BAT) works synergistically with PD-1 blockers to clear tumors. Hence, emerging immunometabolic reprogramming targeting different cancers has a better future as a specific-immune cell-based tumor targeting and synergizing the available checkpoint inhibitors.
6 Future perspective and conclusion
The immune system is key to checking the induction, development, growth, and metastasis of cancer. Immunometabolic reprogramming among immune cells governs their stimulatory and inhibitory immune functions depending on the stimuli and tissue environment. Thus, it has become crucial to understanding immunometabolic reprogramming and its governing factors in TIME. The development of a robust immunosuppressive TIME has become a landscape for tumor growth, proliferation, and metastasis. For example, increased lactate levels in TME or TIME induce immunosuppressive immunometabolic reprogramming and block the antitumor function of immune cell-based immunotherapies (adoptive T cell therapies) and checkpoint inhibitors (425, 426). LDHA inhibitor (GSK2837808A) has improved the antitumor activity of CD8+T cells via altering their immunometabolic reprogramming responsible for their exhaustion and apoptosis (426). Furthermore, TME or TIME lactate levels can be lowered using MCT1 and MCT4 lactate transporter inhibitors (AZD3965) to improve the existing immune cell-based therapies (427–429).
The increased lactate accumulation in TME or TIME occurs due to overwhelming glycolysis in tumor cells (426). Thus, tumor cell-specific glycolysis can also be a therapeutic approach that directly targets tumor cells, and will also increase the efficacy of immune cell-based immunotherapies and checkpoint inhibitors via decreasing the TME lactate levels (430–433). Fumarate accumulation in TME also inhibits B cell function via covalent inhibition of a tyrosine kinase LYNN of the B cell receptor (BCR) signaling pathway (434). The fumarate deposition blocks BCR signaling-mediated antitumor action, including antibody production and cytokine release. Additionally, fumarate has other tumor-supportive effects by altering different immune cells, but its impact on their immunometabolic reprogramming remains to study (435). Hence, targeting tumor cell-specific glycolysis and lactate and fumarate accumulation in TME indirectly enhances the antitumor action of immune cells by immunometabolic reprogramming. Many metabolic inhibitors with potential to clinical translation are at different clinical trial stages (II and III), which can be used to reprogram TME immunometabolism (23, 25).
Calcium carbonate (CaCO3) nanoparticles coated with 4-phenylimidazole (4PI) inhibit IDO1 to increase the radiotherapy efficacy (436). These nanoparticles are called acidity-IDO1-modulation nanoparticles (AIM NPs), which instantly neutralize protons (H+) and release 4PI to inhibit the immunosuppressive IDO1 activity in the TME. Thus, AIM NPs reinforce the radiotherapy via modulating the immunosuppressive metabolic reprograming in the TME. Another nanoparticle-based approach during low dose radiotherapy has increased ICIs (PD-1/PD-L1 blockers) efficacy via reprograming immunosuppressive TME immunometabolism in triple negative breast cancer (TNBC) patients (437). This approach involves scavenging the reduced nicotinamide adenine dinucleotide phosphate (NADPH) inside tumor cells by developing the nanomolecule (BMS202@HZP) targeting hypoxia and PD-1/PD-L1 interaction during low dose radiotherapy against TNBC (437). Along with conventional nanomedicine, thermal-immuno nanomedicine is emerging as potential antitumor therapy (438–440). Hence understanding and developing nanomedicine-based approaches specifically targeting TME immunometabolism have a bright future for tumor immunotherapy. For instance, understanding metabolic reprograming, including immunometabolism can rewire radio- oncology for better therapeutic ratio or outcome (441). We need further studies in this direction.
Aging is one of several predisposing factors for cancer as it alters immune cell functions via inducing altered immunometabolism (442, 443). For example, the B cells of older people show a significant reduction in their OXPHOS compared to glycolysis (444). Also, T cells isolated from older adults exhibit decreased glycolysis and OXPHOS but increased mitochondrial ROS generation, indicating an impaired mitochondrial function (442). Aging-associated immunometabolic reprogramming among older adults induces a stage of chronic inflammation that may serve as cancer predisposing factor. Thus, the immunometabolic profile of aged people may indicate their future risk for cancer. Spermidine, a polyamine considered an antiaging molecule enhances the antitumor action of CD8+T or nanobody-based CAR-T cells (Nb CAR-T) cells via immunometabolic reprogramming that increases IFN-γ and IL-2 production (445).
OVT is an emerging area to convert cold tumors to hot tumors or TME through reprogramming immunosuppressive TIME to pro-inflammatory antitumor immunity when used alone or with available checkpoint inhibitors (446–449). However, how OVT modulates the immunometabolic reprogramming among specific immune cells of TIME is an exciting research area to delineate. Also, immunometabolism has emerged as a novel way to target specific immune cell populations in diverse diseases, including sepsis, autoimmunity, and other infectious diseases. The information discussed in the present article specifies that the immunometabolic reprogramming among infiltrated immune cells alters in TME or TIME and needs great attention as it diverts immune cells’ normal antitumor function to support tumor growth and metastasis. Hence, immunometabolic reprogramming is another cancer hallmark with significant therapeutic potential based on cancer stages and immune cell population. Thus, studying cancer-associated immunometabolic reprogramming will help to design better immune cell-based therapies, BATs, and OVTs in the future.
Author contributions
VK has developed the idea, wrote the article and conceptualized and developed the figures. JS has done the proofreading and final edits.
Conflict of interest
The authors declare that the research was conducted in the absence of any commercial or financial relationships that could be construed as a potential conflict of interest.
Publisher’s note
All claims expressed in this article are solely those of the authors and do not necessarily represent those of their affiliated organizations, or those of the publisher, the editors and the reviewers. Any product that may be evaluated in this article, or claim that may be made by its manufacturer, is not guaranteed or endorsed by the publisher.
References
1. Sung H, Ferlay J, Siegel RL, Laversanne M, Soerjomataram I, Jemal A, et al. Global cancer statistics 2020: GLOBOCAN estimates of incidence and mortality worldwide for 36 cancers in 185 countries. CA: A Cancer J Clin (2021) 71:209–49. doi: 10.3322/caac.21660
2. Aquino A, Formica V, Prete SP, Correale PP, Massara MC, Turriziani M, et al. Drug-induced increase of carcinoembryonic antigen expression in cancer cells. Pharmacol Res (2004) 49:383–96. doi: 10.1016/j.phrs.2003.12.007
3. Ebrahimi N, Akbari M, Ghanaatian M, Roozbahani Moghaddam P, Adelian S, Borjian Boroujeni M, et al. Development of neoantigens: from identification in cancer cells to application in cancer vaccines. Expert Rev Vaccines (2022) 21:941–55. doi: 10.1080/14760584.2021.1951246
4. Pardal R, Clarke MF, Morrison SJ. Applying the principles of stem-cell biology to cancer. Nat Rev Cancer (2003) 3:895–902. doi: 10.1038/nrc1232
5. Sell S, Pierce GB. Maturation arrest of stem cell differentiation is a common pathway for the cellular origin of teratocarcinomas and epithelial cancers. Lab Invest (1994) 70:6–22.
6. Fearon ER, Burke PJ, Schiffer CA, Zehnbauer BA, Vogelstein B. Differentiation of leukemia cells to polymorphonuclear leukocytes in patients with acute nonlymphocytic leukemia. N Engl J Med (1986) 315:15–24. doi: 10.1056/NEJM198607033150103
7. Li Z, Seehawer M, Polyak K. Untangling the web of intratumour heterogeneity. Nat Cell Biol (2022) 24:1192–201. doi: 10.1038/s41556-022-00969-x
8. Meldi L, Brickner JH. Compartmentalization of the nucleus. Trends Cell Biol (2011) 21:701–8. doi: 10.1016/j.tcb.2011.08.001
9. Spilianakis CG, Flavell RA. Long-range intrachromosomal interactions in the T helper type 2 cytokine locus. Nat Immunol (2004) 5:1017–27. doi: 10.1038/ni1115
10. Spilianakis CG, Lalioti MD, Town T, Lee GR, Flavell RA. Interchromosomal associations between alternatively expressed loci. Nature (2005) 435:637–45. doi: 10.1038/nature03574
11. Yi E, Chamorro González R, Henssen AG, Verhaak RGW. Extrachromosomal DNA amplifications in cancer. Nat Rev Genet (2022) 23:760–71. doi: 10.1038/s41576-022-00521-5
12. Hung KL, Mischel PS, Chang HY. Gene regulation on extrachromosomal DNA. Nat Struct Mol Biol (2022) 29:736–44. doi: 10.1038/s41594-022-00806-7
13. Hung KL, Yost KE, Xie L, Shi Q, Helmsauer K, Luebeck J, et al. ecDNA hubs drive cooperative intermolecular oncogene expression. Nature (2021) 600:731–6. doi: 10.1038/s41586-021-04116-8
14. van Leen E, Brückner L, Henssen AG. The genomic and spatial mobility of extrachromosomal DNA and its implications for cancer therapy. Nat Genet (2022) 54:107–14. doi: 10.1038/s41588-021-01000-z
15. Wu S, Turner KM, Nguyen N, Raviram R, Erb M, Santini J, et al. Circular ecDNA promotes accessible chromatin and high oncogene expression. Nature (2019) 575:699–703. doi: 10.1038/s41586-019-1763-5
16. Kim H, Nguyen NP, Turner K, Wu S, Gujar AD, Luebeck J, et al. Extrachromosomal DNA is associated with oncogene amplification and poor outcome across multiple cancers. Nat Genet (2020) 52:891–7. doi: 10.1038/s41588-020-0678-2
17. Wu S, Bafna V, Chang HY, Mischel PS. Extrachromosomal DNA: an emerging hallmark in human cancer. Annu Rev Pathol (2022) 17:367–86. doi: 10.1146/annurev-pathmechdis-051821-114223
18. Bafna V, Mischel PS. Extrachromosomal DNA in cancer. Annu Rev Genomics Hum Genet (2022) 23:29–52. doi: 10.1146/annurev-genom-120821-100535
19. Hanahan D, Weinberg RA. The hallmarks of cancer. Cell (2000) 100:57–70. doi: 10.1016/S0092-8674(00)81683-9
20. Hanahan D, Robert A. Hallmarks of cancer: the next generation. Cell (2011) 144:646–74. doi: 10.1016/j.cell.2011.02.013
21. Floor SL, Dumont JE, Maenhaut C, Raspe E. Hallmarks of cancer: of all cancer cells, all the time? Trends Mol Med (2012) 18:509–15. doi: 10.1016/j.molmed.2012.06.005
22. DePeaux K, Delgoffe GM. Metabolic barriers to cancer immunotherapy. Nat Rev Immunol (2021) 21:785–97. doi: 10.1038/s41577-021-00541-y
23. Leone RD, Powell JD. Metabolism of immune cells in cancer. Nat Rev Cancer (2020) 20:516–31. doi: 10.1038/s41568-020-0273-y
24. O’Sullivan D, Sanin DE, Pearce EJ, Pearce EL. Metabolic interventions in the immune response to cancer. Nat Rev Immunol (2019) 19:324–35. doi: 10.1038/s41577-019-0140-9
25. Li X, Wenes M, Romero P, Huang SC-C, Fendt S-M, Ho P-C. Navigating metabolic pathways to enhance antitumour immunity and immunotherapy. Nat Rev Clin Oncol (2019) 16:425–41. doi: 10.1038/s41571-019-0203-7
26. Martínez-Reyes I, Chandel NS. Cancer metabolism: looking forward. Nat Rev Cancer (2021) 21:669–80. doi: 10.1038/s41568-021-00378-6
27. Elia I, Haigis MC. Metabolites and the tumour microenvironment: from cellular mechanisms to systemic metabolism. Nat Metab (2021) 3:21–32. doi: 10.1038/s42255-020-00317-z
28. Hanahan D. Hallmarks of cancer: new dimensions. Cancer Discov (2022) 12:31–46. doi: 10.1158/2159-8290.CD-21-1059
29. Brunner JS, Finley LWS. Metabolic determinants of tumour initiation. Nat Rev Endocrinol (2023) 19:134–50. doi: 10.1038/s41574-022-00773-5
30. Perez-Lanzon M, Zitvogel L, Kroemer G. Failure of immunosurveillance accelerates aging. Oncoimmunology (2019) 8:e1575117. doi: 10.1080/2162402X.2019.1575117
31. Vesely MD, Kershaw MH, Schreiber RD, Smyth MJ. Natural innate and adaptive immunity to cancer. Annu Rev Immunol (2011) 29:235–71. doi: 10.1146/annurev-immunol-031210-101324
32. Ribatti D. The concept of immune surveillance against tumors. first theories. Oncotarget (2017) 8:7175–80. doi: 10.18632/oncotarget.12739
33. Swann JB, Smyth MJ. Immune surveillance of tumors. J Clin Invest (2007) 117:1137–46. doi: 10.1172/JCI31405
34. Gajewski TF, Schreiber H, Fu Y-X. Innate and adaptive immune cells in the tumor microenvironment. Nat Immunol (2013) 14:1014–22. doi: 10.1038/ni.2703
35. Martins Lopes MS, Machado LM, Ismael Amaral Silva PA, Tome Uchiyama AA, Yen CT, Ricardo ED, et al. Antibiotics, cancer risk and oncologic treatment efficacy: a practical review of the literature. Ecancermedicalscience (2020) 14:1106. doi: 10.3332/ecancer.2020.1106
36. Simin J, Fornes R, Liu Q, Olsen RS, Callens S, Engstrand L, et al. Antibiotic use and risk of colorectal cancer: a systematic review and dose-response meta-analysis. Br J Cancer (2020) 123:1825–32. doi: 10.1038/s41416-020-01082-2
37. Li CH, Haider S, Boutros PC. Age influences on the molecular presentation of tumours. Nat Commun (2022) 13:208. doi: 10.1038/s41467-021-27889-y
38. Henry CJ, Marusyk A, DeGregori J. Aging-associated changes in hematopoiesis and leukemogenesis: what's the connection? Aging (Albany NY) (2011) 3:643–56. doi: 10.18632/aging.100351
39. Burnet FM. The concept of immunological surveillance. Prog Exp Tumor Res (1970) 13:1–27. doi: 10.1159/000386035
40. Burnet FM. Immunological surveillance in neoplasia. Transplant Rev (1971) 7:3–25. doi: 10.1111/j.1600-065X.1971.tb00461.x
41. Nayak DA, Binder RJ. Agents of cancer immunosurveillance: HSPs and dsDNA. Trends Immunol (2022) 43:404–13. doi: 10.1016/j.it.2022.03.004
42. Sedlacek AL, Younker TP, Zhou YJ, Borghesi L, Shcheglova T, Mandoiu II, et al. CD91 on dendritic cells governs immunosurveillance of nascent, emerging tumors. JCI Insight (2019) 4(7):e127239. doi: 10.1172/jci.insight.127239
43. Binder RJ, Han DK, Srivastava PK. CD91: a receptor for heat shock protein gp96. Nat Immunol (2000) 1:151–5. doi: 10.1038/77835
44. Hiam-Galvez KJ, Allen BM, Spitzer MH. Systemic immunity in cancer. Nat Rev Cancer (2021) 21:345–59. doi: 10.1038/s41568-021-00347-z
45. Xu L, Zou C, Zhang S, Chu TSM, Zhang Y, Chen W, et al. Reshaping the systemic tumor immune environment (STIE) and tumor immune microenvironment (TIME) to enhance immunotherapy efficacy in solid tumors. J Hematol Oncol (2022) 15:87. doi: 10.1186/s13045-022-01307-2
46. Schlichtner S, Yasinska IM, Lall GS, Berger SM, Ruggiero S, Cholewa D, et al. T Lymphocytes induce human cancer cells derived from solid malignant tumors to secrete galectin-9 which facilitates immunosuppression in cooperation with other immune checkpoint proteins. J Immunother Cancer (2023) 11:e005714. doi: 10.1136/jitc-2022-005714
47. Yuan L, Tatineni J, Mahoney KM, Freeman GJ. VISTA: a mediator of quiescence and a promising target in cancer immunotherapy. Trends Immunol (2021) 42:209–27. doi: 10.1016/j.it.2020.12.008
48. Schlichtner S, Yasinska IM, Ruggiero S, Berger SM, Aliu N, Prunk M, et al. Expression of the immune checkpoint protein VISTA is differentially regulated by the TGF-β1 - Smad3 signaling pathway in rapidly proliferating human cells and T lymphocytes. Front Med (Lausanne) (2022) 9:790995. doi: 10.3389/fmed.2022.790995
49. Wang YA, Li XL, Mo YZ, Fan CM, Tang L, Xiong F, et al. Effects of tumor metabolic microenvironment on regulatory T cells. Mol Cancer (2018) 17:168. doi: 10.1186/s12943-018-0913-y
50. Shi X, Yang J, Deng S, Xu H, Wu D, Zeng Q, et al. TGF-β signaling in the tumor metabolic microenvironment and targeted therapies. J Hematol Oncol (2022) 15:135. doi: 10.1186/s13045-022-01349-6
51. Rabadi D, Sajani AA, Noelle RJ, Lines JL. The role of VISTA in the tumor microenvironment. J Cancer Metastasis Treat (2022) 8:24. doi: 10.20517/2394-4722.2022.06
52. Zhang F, Wang H, Wang X, Jiang G, Liu H, Zhang G, et al. TGF-β induces M2-like macrophage polarization via SNAIL-mediated suppression of a pro-inflammatory phenotype. Oncotarget (2016) 7:52294–306. doi: 10.18632/oncotarget.10561
53. Cairns RA, Harris IS, Mak TW. Regulation of cancer cell metabolism. Nat Rev Cancer (2011) 11:85–95. doi: 10.1038/nrc2981
54. Soga T. Cancer metabolism: key players in metabolic reprogramming. Cancer Sci (2013) 104:275–81. doi: 10.1111/cas.12085
55. Hua W, ten Dijke P, Kostidis S, Giera M, Hornsveld M. TGFβ-induced metabolic reprogramming during epithelial-to-mesenchymal transition in cancer. Cell Mol Life Sci (2020) 77:2103–23. doi: 10.1007/s00018-019-03398-6
56. Vander Heiden MG, Cantley LC, Thompson CB. Understanding the warburg effect: the metabolic requirements of cell proliferation. Science (2009) 324:1029–33. doi: 10.1126/science.1160809
57. Gatenby RA, Gawlinski ET, Gmitro AF, Kaylor B, Gillies RJ. Acid-mediated tumor invasion: a multidisciplinary study. Cancer Res (2006) 66:5216–23. doi: 10.1158/0008-5472.CAN-05-4193
58. Hirschhaeuser F, Sattler UGA, Mueller-Klieser W. Lactate: a metabolic key player in cancer. Cancer Res (2011) 71:6921–5. doi: 10.1158/0008-5472.CAN-11-1457
59. Warburg O. On the origin of cancer cells. Science (1956) 123:309–14. doi: 10.1126/science.123.3191.309
60. Semenza GL, Artemov D, Bedi A, Bhujwalla Z, Chiles K, Feldser D, et al. 'The metabolism of tumours': 70 years later. Novartis Found Symp (2001) 240:251–60. doi: 10.1002/0470868716.ch17
61. Liberti MV, Locasale JW. The warburg effect: how does it benefit cancer cells? Trends Biochem Sci (2016) 41:211–8. doi: 10.1016/j.tibs.2015.12.001
62. Bustamante E, Morris HP, Pedersen PL. Energy metabolism of tumor cells. requirement for a form of hexokinase with a propensity for mitochondrial binding. J Biol Chem (1981) 256:8699–704. doi: 10.1016/S0021-9258(19)68900-3
63. Quintero M, Mackenzie N, Brennan PA. Hypoxia-inducible factor 1 (HIF-1) in cancer. Eur J Surg Oncol (2004) 30:465–8. doi: 10.1016/j.ejso.2004.03.008
64. Semenza GL. Targeting HIF-1 for cancer therapy. Nat Rev Cancer (2003) 3:721–32. doi: 10.1038/nrc1187
65. Wu Q, You L, Nepovimova E, Heger Z, Wu W, Kuca K, et al. Hypoxia-inducible factors: master regulators of hypoxic tumor immune escape. J Hematol Oncol (2022) 15:77. doi: 10.1186/s13045-022-01292-6
66. Icard P, Shulman S, Farhat D, Steyaert J-M, Alifano M, Lincet H. How the warburg effect supports aggressiveness and drug resistance of cancer cells? Drug Resistance Updates (2018) 38:1–11. doi: 10.1016/j.drup.2018.03.001
67. Sebastian C, Ferrer C, Serra M, Choi J-E, Ducano N, Mira A, et al. A non-dividing cell population with high pyruvate dehydrogenase kinase activity regulates metabolic heterogeneity and tumorigenesis in the intestine. Nat Commun (2022) 13:1503. doi: 10.1038/s41467-022-29085-y
68. Sullivan MR, Danai LV, Lewis CA, Chan SH, Gui DY, Kunchok T, et al. Quantification of microenvironmental metabolites in murine cancers reveals determinants of tumor nutrient availability. eLife (2019) 8:e44235. doi: 10.7554/eLife.44235
69. Ren Y, Kumar A, Das JK, Peng HY, Wang L, Balllard D, et al. Tumorous expression of NAC1 restrains antitumor immunity through the LDHA-mediated immune evasion. J Immunother Cancer (2022) 10(9):e004856. doi: 10.1136/jitc-2022-004856
70. Fischer K, Hoffmann P, Voelkl S, Meidenbauer N, Ammer J, Edinger M, et al. Inhibitory effect of tumor cell–derived lactic acid on human T cells. Blood (2007) 109:3812–9. doi: 10.1182/blood-2006-07-035972
71. Mu X, Shi W, Xu Y, Xu C, Zhao T, Geng B, et al. Tumor-derived lactate induces M2 macrophage polarization via the activation of the ERK/STAT3 signaling pathway in breast cancer. Cell Cycle (2018) 17:428–38. doi: 10.1080/15384101.2018.1444305
72. Noe JT, Rendon BE, Geller AE, Conroy LR, Morrissey SM, Young LEA, et al. Lactate supports a metabolic-epigenetic link in macrophage polarization. Sci Adv (2021) 7:eabi8602. doi: 10.1126/sciadv.abi8602
73. Raychaudhuri D, Bhattacharya R, Sinha BP, Liu CSC, Ghosh AR, Rahaman O, et al. Lactate induces pro-tumor reprogramming in intratumoral plasmacytoid dendritic cells. Front Immunol (2019) 10. doi: 10.3389/fimmu.2019.01878
74. Marin E, Bouchet-Delbos L, Renoult O, Louvet C, Nerriere-Daguin V, Managh AJ, et al. Human tolerogenic dendritic cells regulate immune responses through lactate synthesis. Cell Metab (2019) 30:1075–1090.e8. doi: 10.1016/j.cmet.2019.11.011
75. Ratter JM, Rooijackers HMM, Hooiveld GJ, Hijmans AGM, de Galan BE, Tack CJ, et al. In vitro and in vivo effects of lactate on metabolism and cytokine production of human primary PBMCs and monocytes. Front Immunol (2018) 9:2564. doi: 10.3389/fimmu.2018.02564
76. Courtney KD, Bezwada D, Mashimo T, Pichumani K, Vemireddy V, Funk AM, et al. Isotope tracing of human clear cell renal cell carcinomas demonstrates suppressed glucose oxidation In vivo. Cell Metab (2018) 28:793–800.e2. doi: 10.1016/j.cmet.2018.07.020
77. Sanderson SM, Locasale JW. Revisiting the warburg effect: some tumors hold their breath. Cell Metab (2018) 28:669–70. doi: 10.1016/j.cmet.2018.10.011
78. Chang CH, Qiu J, O'Sullivan D, Buck MD, Noguchi T, Curtis JD, et al. Metabolic competition in the tumor microenvironment is a driver of cancer progression. Cell (2015) 162:1229–41. doi: 10.1016/j.cell.2015.08.016
79. Buck MD, Sowell RT, Kaech SM, Pearce EL. Metabolic instruction of immunity. Cell (2017) 169:570–86. doi: 10.1016/j.cell.2017.04.004
80. Reinfeld BI, Madden MZ, Wolf MM, Chytil A, Bader JE, Patterson AR, et al. Cell-programmed nutrient partitioning in the tumour microenvironment. Nature (2021) 593:282–8. doi: 10.1038/s41586-021-03442-1
81. Bian Y, Li W, Kremer DM, Sajjakulnukit P, Li S, Crespo J, et al. Cancer SLC43A2 alters T cell methionine metabolism and histone methylation. Nature (2020) 585:277–82. doi: 10.1038/s41586-020-2682-1
82. Hung MH, Lee JS, Ma C, Diggs LP, Heinrich S, Chang CW, et al. Tumor methionine metabolism drives T-cell exhaustion in hepatocellular carcinoma. Nat Commun (2021) 12:1455. doi: 10.1038/s41467-021-21804-1
83. Weiss TS, Bernhardt G, Buschauer A, Thasler WE, Dolgner D, Zirngibl H, et al. Polyamine levels of human colorectal adenocarcinomas are correlated with tumor stage and grade. Int J Colorectal Dis (2002) 17:381–7. doi: 10.1007/s00384-002-0394-7
84. Akinyele O, Wallace HM. Understanding the polyamine and mTOR pathway interaction in breast cancer cell growth. Med Sci (Basel) (2022) 10(3):51. doi: 10.3390/medsci10030051
85. O'Brien TG, Megosh LC, Gilliard G, Soler AP. Ornithine decarboxylase overexpression is a sufficient condition for tumor promotion in mouse skin. Cancer Res (1997) 57:2630–7.
86. Linsalata M, Caruso MG, Leo S, Guerra V, D'Attoma B, Di Leo A. Prognostic value of tissue polyamine levels in human colorectal carcinoma. Anticancer Res (2002) 22:2465–9.
87. Lan L, Trempus C, Gilmour SK. Inhibition of ornithine decarboxylase (ODC) decreases tumor vascularization and reverses spontaneous tumors in ODC/Ras transgenic mice. Cancer Res (2000) 60:5696–703.
88. McNamara KM, Gobert AP, Wilson KT. The role of polyamines in gastric cancer. Oncogene (2021) 40:4399–412. doi: 10.1038/s41388-021-01862-x
89. Holbert CE, Cullen MT, Casero RA Jr., Stewart TM. Polyamines in cancer: integrating organismal metabolism and antitumour immunity. Nat Rev Cancer (2022) 22:467–80. doi: 10.1038/s41568-022-00473-2
90. Soda K. The mechanisms by which polyamines accelerate tumor spread. J Exp Clin Cancer Res (2011) 30:95. doi: 10.1186/1756-9966-30-95
91. Latour YL, Gobert AP, Wilson KT. The role of polyamines in the regulation of macrophage polarization and function. Amino Acids (2020) 52:151–60. doi: 10.1007/s00726-019-02719-0
92. Puleston DJ, Baixauli F, Sanin DE, Edwards-Hicks J, Villa M, Kabat AM, et al. Polyamine metabolism is a central determinant of helper T cell lineage fidelity. Cell (2021) 184:4186–4202.e20. doi: 10.1016/j.cell.2021.06.007
93. Wagner A, Wang C, Fessler J, DeTomaso D, Avila-Pacheco J, Kaminski J, et al. Metabolic modeling of single Th17 cells reveals regulators of autoimmunity. Cell (2021) 184:4168–4185.e21. doi: 10.1016/j.cell.2021.05.045
94. Shi H, Chi H. Polyamine: a metabolic compass for T helper cell fate direction. Cell (2021) 184:4109–12. doi: 10.1016/j.cell.2021.07.012
95. Harbison RA, Pandey R, Considine M, Leone RD, Murray-Stewart T, Erbe R, et al. Interrogation of T cell-enriched tumors reveals prognostic and immunotherapeutic implications of polyamine metabolism. Cancer Res Commun (2022) 2:639–52. doi: 10.1158/2767-9764.CRC-22-0061
96. Hayes CS, Shicora AC, Keough MP, Snook AE, Burns MR, Gilmour SK. Polyamine-blocking therapy reverses immunosuppression in the tumor microenvironment. Cancer Immunol Res (2014) 2:274–85. doi: 10.1158/2326-6066.CIR-13-0120-T
97. Man K, Kutyavin VI, Chawla A. Tissue immunometabolism: development, physiology, and pathobiology. Cell Metab (2017) 25:11–26. doi: 10.1016/j.cmet.2016.08.016
98. Kumar V. Targeting macrophage immunometabolism: dawn in the darkness of sepsis. Int Immunopharmacol (2018) 58:173–85. doi: 10.1016/j.intimp.2018.03.005
99. O'Neill LAJ, Kishton RJ, Rathmell J. A guide to immunometabolism for immunologists. Nat Rev Immunol (2016) 16:553–65. doi: 10.1038/nri.2016.70
100. Kumar V. Inflammation research sails through the sea of immunology to reach immunometabolism. Int Immunopharmacol (2019) 73:128–45. doi: 10.1016/j.intimp.2019.05.002
101. Kumar V. Immunometabolism: another road to sepsis and its therapeutic targeting. Inflammation (2019) 42:765–88. doi: 10.1007/s10753-018-0939-8
102. Kumar V. T Cells and their immunometabolism: a novel way to understanding sepsis immunopathogenesis and future therapeutics. Eur J Cell Biol (2018) 97:379–92. doi: 10.1016/j.ejcb.2018.05.001
103. Becht E, Giraldo NA, Germain C, de Reyniès A, Laurent-Puig P, Zucman-Rossi J, et al. Immune contexture, immunoscore, and malignant cell molecular subgroups for prognostic and theranostic classifications of cancers. Adv Immunol (2016) 130:95–190. doi: 10.1016/bs.ai.2015.12.002
104. Cassetta L, Fragkogianni S, Sims AH, Swierczak A, Forrester LM, Zhang H, et al. Human tumor-associated macrophage and monocyte transcriptional landscapes reveal cancer-specific reprogramming, biomarkers, and therapeutic targets. Cancer Cell (2019) 35:588–602.e10. doi: 10.1016/j.ccell.2019.02.009
105. Mantovani A, Marchesi F, Jaillon S, Garlanda C, Allavena P. Tumor-associated myeloid cells: diversity and therapeutic targeting. Cell Mol Immunol (2021) 18:566–78. doi: 10.1038/s41423-020-00613-4
106. Christofides A, Strauss L, Yeo A, Cao C, Charest A, Boussiotis VA. The complex role of tumor-infiltrating macrophages. Nat Immunol (2022) 23:1148–56. doi: 10.1038/s41590-022-01267-2
107. Dallavalasa S, Beeraka NM, Basavaraju CG, Tulimilli SV, Sadhu SP, Rajesh K, et al. The role of tumor associated macrophages (TAMs) in cancer progression, chemoresistance, angiogenesis and metastasis - current status. Curr Med Chem (2021) 28:8203–36. doi: 10.2174/0929867328666210720143721
108. Szulc-Kielbik I, Kielbik M. Tumor-associated macrophages: reasons to be cheerful, reasons to be fearful. Exp (2022) Suppl 113:107–40. doi: 10.1007/978-3-030-91311-3_4
109. Fu LQ, Du WL, Cai MH, Yao JY, Zhao YY, Mou XZ. The roles of tumor-associated macrophages in tumor angiogenesis and metastasis. Cell Immunol (2020) 353:104119. doi: 10.1016/j.cellimm.2020.104119
110. Bindea G, Mlecnik B, Tosolini M, Kirilovsky A, Waldner M, Anna C, et al. Spatiotemporal dynamics of intratumoral immune cells reveal the immune landscape in human cancer. Immunity (2013) 39:782–95. doi: 10.1016/j.immuni.2013.10.003
111. Zheng X, Mansouri S, Krager A, Grimminger F, Seeger W, Pullamsetti SS, et al. Metabolism in tumour-associated macrophages: a quid pro quo with the tumour microenvironment. Eur Respir Rev (2020) 29(157):200134. doi: 10.1183/16000617.0134-2020
112. Huang SC-C, Smith AM, Everts B, Colonna M, Pearce EL, Schilling JD, et al. Metabolic reprogramming mediated by the mTORC2-IRF4 signaling axis is essential for macrophage alternative activation. Immunity (2016) 45:817–30. doi: 10.1016/j.immuni.2016.09.016
113. Namgaladze D, Brüne B. Fatty acid oxidation is dispensable for human macrophage IL-4-induced polarization. Biochim Biophys Acta (BBA) - Mol Cell Biol Lipids (2014) 1841:1329–35. doi: 10.1016/j.bbalip.2014.06.007
114. O’Neill LAJ. A metabolic roadblock in inflammatory macrophages. Cell Rep (2016) 17:625–6. doi: 10.1016/j.celrep.2016.09.085
115. Van den Bossche J, Baardman J, Otto NA, van der Velden S, Neele AE, Van Den Berg SM, et al. Mitochondrial dysfunction prevents repolarization of inflammatory macrophages. Cell Rep (2016) 17:684–96. doi: 10.1016/j.celrep.2016.09.008
116. Raines LN, Zhao H, Wang Y, Chen H-Y, Gallart-Ayala H, Hsueh P-C, et al. PERK is a critical metabolic hub for immunosuppressive function in macrophages. Nat Immunol (2022) 23:431–45. doi: 10.1038/s41590-022-01145-x
117. Wenes M, Shang M, Di Matteo M, Goveia J, Martín-Pérez R, Serneels J, et al. Macrophage metabolism controls tumor blood vessel morphogenesis and metastasis. Cell Metab (2016) 24:701–15. doi: 10.1016/j.cmet.2016.09.008
118. Mantovani A, Locati M. Macrophage metabolism shapes angiogenesis in tumors. Cell Metab (2016) 24:653–4. doi: 10.1016/j.cmet.2016.10.016
119. Kes MMG, Van den Bossche J, Griffioen AW, Huijbers EJM. Oncometabolites lactate and succinate drive pro-angiogenic macrophage response in tumors. Biochim Biophys Acta Rev Cancer (2020) 1874:188427. doi: 10.1016/j.bbcan.2020.188427
120. Yang K, Xu J, Fan M, Tu F, Wang X, Ha T, et al. Lactate suppresses macrophage pro-inflammatory response to LPS stimulation by inhibition of YAP and NF-κB activation via GPR81-mediated signaling. Front Immunol (2020) 11:587913. doi: 10.3389/fimmu.2020.587913
121. Sun X, Wang M, Wang M, Yao L, Li X, Dong H, et al. Role of proton-coupled monocarboxylate transporters in cancer: from metabolic crosstalk to therapeutic potential. Front Cell Dev Biol (2020) 8:651. doi: 10.3389/fcell.2020.00651
122. Li B, Yang Q, Li Z, Xu Z, Sun S, Wu Q, et al. Expression of monocarboxylate transporter 1 in immunosuppressive macrophages is associated with the poor prognosis in breast cancer. Front Oncol (2020) 10. doi: 10.3389/fonc.2020.574787
123. Kumar V. Macrophages: the potent immunoregulatory innate immune cells. In: Hussain BK, editor. Macrophage activation. Rijeka Ch: IntechOpen (2019).
124. Park J, Lee SE, Hur J, Hong EB, Choi J-I, Yang J-M, et al. M-CSF from cancer cells induces fatty acid synthase and PPARβ/δ activation in tumor myeloid cells, leading to tumor progression. Cell Rep (2015) 10:1614–25. doi: 10.1016/j.celrep.2015.02.024
125. Di Conza G, Tsai C-H, Gallart-Ayala H, Yu Y-R, Franco F, Zaffalon L, et al. Tumor-induced reshuffling of lipid composition on the endoplasmic reticulum membrane sustains macrophage survival and pro-tumorigenic activity. Nat Immunol (2021) 22:1403–15. doi: 10.1038/s41590-021-01047-4
126. Chen Y, Brandizzi F. IRE1: ER stress sensor and cell fate executor. Trends Cell Biol (2013) 23:547–55. doi: 10.1016/j.tcb.2013.06.005
127. Sriburi R, Jackowski S, Mori K, Brewer JW. XBP1 : a link between the unfolded protein response, lipid biosynthesis, and biogenesis of the endoplasmic reticulum. J Cell Biol (2004) 167:35–41. doi: 10.1083/jcb.200406136
128. Kao KC, Vilbois S, Tsai CH, Ho PC. Metabolic communication in the tumour-immune microenvironment. Nat Cell Biol (2022) 24(11):1574–83. doi: 10.1038/s41556-022-01002-x
129. Zhang Q, Wang H, Mao C, Sun M, Dominah G, Chen L, et al. Fatty acid oxidation contributes to IL-1β secretion in M2 macrophages and promotes macrophage-mediated tumor cell migration. Mol Immunol (2018) 94:27–35. doi: 10.1016/j.molimm.2017.12.011
130. Rao X, Zhou X, Wang G, Jie X, Xing B, Xu Y, et al. NLRP6 is required for cancer-derived exosome-modified macrophage M2 polarization and promotes metastasis in small cell lung cancer. Cell Death Dis (2022) 13:891. doi: 10.1038/s41419-022-05336-0
131. DeNardo DG, Ruffell B. Macrophages as regulators of tumour immunity and immunotherapy. Nat Rev Immunol (2019) 19:369–82. doi: 10.1038/s41577-019-0127-6
132. Viola A, Bronte V. Metabolic mechanisms of cancer-induced inhibition of immune responses. Semin Cancer Biol (2007) 17:309–16. doi: 10.1016/j.semcancer.2007.06.005
133. Viola A, Munari F, Sánchez-Rodríguez R, Scolaro T, Castegna A. The metabolic signature of macrophage responses. Front Immunol (2019) 10:1462. doi: 10.3389/fimmu.2019.01462
134. Mojsilovic SS, Mojsilovic S, Villar VH, Santibanez JF. The metabolic features of tumor-associated macrophages: opportunities for immunotherapy? Anal Cell Pathol (Amst) (2021) 2021:5523055. doi: 10.1155/2021/5523055
135. Wu L, Zhang X, Zheng L, Zhao H, Yan G, Zhang Q, et al. RIPK3 orchestrates fatty acid metabolism in tumor-associated macrophages and hepatocarcinogenesis. Cancer Immunol Res (2020) 8:710–21. doi: 10.1158/2326-6066.CIR-19-0261
136. Jha AK, Huang SC-C, Sergushichev A, Lampropoulou V, Ivanova Y, Loginicheva E, et al. Network integration of parallel metabolic and transcriptional data reveals metabolic modules that regulate macrophage polarization. Immunity (2015) 42:419–30. doi: 10.1016/j.immuni.2015.02.005
137. Van den Bossche J, Lamers WH, Koehler ES, Geuns JM, Alhonen L, Uimari A, et al. Pivotal advance: arginase-1-independent polyamine production stimulates the expression of IL-4-induced alternatively activated macrophage markers while inhibiting LPS-induced expression of inflammatory genes. J Leukoc Biol (2012) 91:685–99. doi: 10.1189/jlb.0911453
138. Oh MH, Sun IH, Zhao L, Leone RD, Sun IM, Xu W, et al. Targeting glutamine metabolism enhances tumor-specific immunity by modulating suppressive myeloid cells. J Clin Invest (2020) 130:3865–84. doi: 10.1172/JCI131859
139. Meireson A, Devos M, Brochez L. IDO expression in cancer: different compartment, different functionality? Front Immunol (2020) 11. doi: 10.3389/fimmu.2020.531491
140. Zhao Q, Kuang DM, Wu Y, Xiao X, Li XF, Li TJ, et al. Activated CD69+ T cells foster immune privilege by regulating IDO expression in tumor-associated macrophages. J Immunol (2012) 188:1117–24. doi: 10.4049/jimmunol.1100164
141. Boussiotis VA, Patsoukis N. Effects of PD-1 signaling on immunometabolic reprogramming. Immunometabolism (2022) 4:e220007. doi: 10.20900/immunometab20220007
142. Patsoukis N, Bardhan K, Chatterjee P, Sari D, Liu B, Bell LN, et al. PD-1 alters T-cell metabolic reprogramming by inhibiting glycolysis and promoting lipolysis and fatty acid oxidation. Nat Commun (2015) 6:6692. doi: 10.1038/ncomms7692
143. Petty AJ, Yang Y. Tumor-associated macrophages: implications in cancer immunotherapy. Immunotherapy (2017) 9:289–302. doi: 10.2217/imt-2016-0135
144. Cassetta L, Kitamura T. Targeting tumor-associated macrophages as a potential strategy to enhance the response to immune checkpoint inhibitors. Front Cell Dev Biol (2018) 6:38. doi: 10.3389/fcell.2018.00038
145. Mantovani A, Marchesi F, Malesci A, Laghi L, Allavena P. Tumour-associated macrophages as treatment targets in oncology. Nat Rev Clin Oncol (2017) 14:399–416. doi: 10.1038/nrclinonc.2016.217
146. SenGupta S, Hein LE, Parent CA. The recruitment of neutrophils to the tumor microenvironment is regulated by multiple mediators. Front Immunol (2021) 12. doi: 10.3389/fimmu.2021.734188
147. Coffelt SB, Wellenstein MD, de Visser KE. Neutrophils in cancer: neutral no more. Nat Rev Cancer (2016) 16:431–46. doi: 10.1038/nrc.2016.52
148. Kolaczkowska E, Kubes P. Neutrophil recruitment and function in health and inflammation. Nat Rev Immunol (2013) 13:159–75. doi: 10.1038/nri3399
149. Powell DR, Huttenlocher A. Neutrophils in the tumor microenvironment. Trends Immunol (2016) 37:41–52. doi: 10.1016/j.it.2015.11.008
150. Nicolás-Ávila JÁ., Adrover JM, Hidalgo A. Neutrophils in homeostasis, immunity, and cancer. Immunity (2017) 46:15–28. doi: 10.1016/j.immuni.2016.12.012
151. Geh D, Leslie J, Rumney R, Reeves HL, Bird TG, Mann DA. Neutrophils as potential therapeutic targets in hepatocellular carcinoma. Nat Rev Gastroenterol Hepatol (2022) 19:257–73. doi: 10.1038/s41575-021-00568-5
152. Patel S, Fu S, Mastio J, Dominguez GA, Purohit A, Kossenkov A, et al. Unique pattern of neutrophil migration and function during tumor progression. Nat Immunol (2018) 19:1236–47. doi: 10.1038/s41590-018-0229-5
153. Walmsley SR, Print C, Farahi N, Peyssonnaux C, Johnson RS, Cramer T, et al. Hypoxia-induced neutrophil survival is mediated by HIF-1alpha-dependent NF-kappaB activity. J Exp Med (2005) 201:105–15. doi: 10.1084/jem.20040624
154. Thompson AA, Elks PM, Marriott HM, Eamsamarng S, Higgins KR, Lewis A, et al. Hypoxia-inducible factor 2α regulates key neutrophil functions in humans, mice, and zebrafish. Blood (2014) 123:366–76. doi: 10.1182/blood-2013-05-500207
155. Kumar S, Dikshit M. Metabolic insight of neutrophils in health and disease. Front Immunol (2019) 10. doi: 10.3389/fimmu.2019.02099
156. Britt EC, Lika J, Giese MA, Schoen TJ, Seim GL, Huang Z, et al. Switching to the cyclic pentose phosphate pathway powers the oxidative burst in activated neutrophils. Nat Metab (2022) 4:389–403. doi: 10.1038/s42255-022-00550-8
157. Azevedo EP, Rochael NC, Guimarães-Costa AB, de Souza-Vieira TS, Ganilho J, Saraiva EM, et al. A metabolic shift toward pentose phosphate pathway is necessary for amyloid fibril- and phorbol 12-myristate 13-acetate-induced neutrophil extracellular trap (NET) formation. J Biol Chem (2015) 290:22174–83. doi: 10.1074/jbc.M115.640094
158. Fridlender ZG, Sun J, Kim S, Kapoor V, Cheng G, Ling L, et al. Polarization of tumor-associated neutrophil phenotype by TGF-beta: "N1" versus "N2" TAN. Cancer Cell (2009) 16:183–94. doi: 10.1016/j.ccr.2009.06.017
159. Flavell RA, Sanjabi S, Wrzesinski SH, Licona-Limón P. The polarization of immune cells in the tumour environment by TGFβ. Nat Rev Immunol (2010) 10:554–67. doi: 10.1038/nri2808
160. Shaul ME, Levy L, Sun J, Mishalian I, Singhal S, Kapoor V, et al. Tumor-associated neutrophils display a distinct N1 profile following TGFβ modulation: a transcriptomics analysis of pro- vs. antitumor TANs. Oncoimmunology (2016) 5:e1232221. doi: 10.1080/2162402X.2016.1232221
161. Hsu BE, Tabariès S, Johnson RM, Andrzejewski S, Senecal J, Lehuédé C, et al. Immature low-density neutrophils exhibit metabolic flexibility that facilitates breast cancer liver metastasis. Cell Rep (2019) 27:3902–3915.e6. doi: 10.1016/j.celrep.2019.05.091
162. Rayes RF, Mouhanna JG, Nicolau I, Bourdeau F, Giannias B, Rousseau S, et al. Primary tumors induce neutrophil extracellular traps with targetable metastasis-promoting effects. JCI Insight (2019) 4:e128008. doi: 10.1172/jci.insight.128008
163. Cristinziano L, Modestino L, Antonelli A, Marone G, Simon H-U, Varricchi G, et al. Neutrophil extracellular traps in cancer. Semin Cancer Biol (2022) 79:91–104. doi: 10.1016/j.semcancer.2021.07.011
164. Veglia F, Perego M, Gabrilovich D. Myeloid-derived suppressor cells coming of age. Nat Immunol (2018) 19:108–19. doi: 10.1038/s41590-017-0022-x
165. Gabrilovich DI, Nagaraj S. Myeloid-derived suppressor cells as regulators of the immune system. Nat Rev Immunol (2009) 9:162–74. doi: 10.1038/nri2506
166. Veglia F, Sanseviero E, Gabrilovich DI. Myeloid-derived suppressor cells in the era of increasing myeloid cell diversity. Nat Rev Immunol (2021) 21:485–98. doi: 10.1038/s41577-020-00490-y
167. Tcyganov E, Mastio J, Chen E, Gabrilovich DI. Plasticity of myeloid-derived suppressor cells in cancer. Curr Opin Immunol (2018) 51:76–82. doi: 10.1016/j.coi.2018.03.009
168. Veglia F, Hashimoto A, Dweep H, Sanseviero E, De Leo A, Tcyganov E, et al. Analysis of classical neutrophils and polymorphonuclear myeloid-derived suppressor cells in cancer patients and tumor-bearing mice. J Exp Med (2021) 218:e20201803. doi: 10.1084/jem.20201803
169. Li B-H, Garstka MA, Li Z-F. Chemokines and their receptors promoting the recruitment of myeloid-derived suppressor cells into the tumor. Mol Immunol (2020) 117:201–15. doi: 10.1016/j.molimm.2019.11.014
170. Kumar V, Patel S, Tcyganov E, Gabrilovich DI. The nature of myeloid-derived suppressor cells in the tumor microenvironment. Trends Immunol (2016) 37:208–20. doi: 10.1016/j.it.2016.01.004
171. Liu Y, Lai L, Chen Q, Song Y, Xu S, Ma F, et al. MicroRNA-494 is required for the accumulation and functions of tumor-expanded myeloid-derived suppressor cells via targeting of PTEN. J Immunol (2012) 188:5500–10. doi: 10.4049/jimmunol.1103505
172. Ya G, Ren W, Qin R, He J, Zhao S. Role of myeloid-derived suppressor cells in the formation of pre-metastatic niche. Front Oncol (2022) 12:975261. doi: 10.3389/fonc.2022.975261
173. Shojaei F, Singh M, Thompson JD, Ferrara N. Role of Bv8 in neutrophil-dependent angiogenesis in a transgenic model of cancer progression. Proc Natl Acad Sci (2008) 105:2640–5. doi: 10.1073/pnas.0712185105
174. Trovato R, Canè S, Petrova V, Sartoris S, Ugel S, De Sanctis F. The engagement between MDSCs and metastases: partners in crime. Front Oncol (2020) 10. doi: 10.3389/fonc.2020.00165
175. Al-Khami AA, Rodriguez PC, Ochoa AC. Metabolic reprogramming of myeloid-derived suppressor cells (MDSC) in cancer. Oncoimmunology (2016) 5:e1200771. doi: 10.1080/2162402X.2016.1200771
176. Hossain F, Al-Khami AA, Wyczechowska D, Hernandez C, Zheng L, Reiss K, et al. Inhibition of fatty acid oxidation modulates immunosuppressive functions of myeloid-derived suppressor cells and enhances cancer therapies. Cancer Immunol Res (2015) 3:1236–47. doi: 10.1158/2326-6066.CIR-15-0036
177. Hammami I, Chen J, Murschel F, Bronte V, De Crescenzo G, Jolicoeur M. Immunosuppressive activity enhances central carbon metabolism and bioenergetics in myeloid-derived suppressor cells in vitro models. BMC Cell Biol (2012) 13:18. doi: 10.1186/1471-2121-13-18
178. Mehta K, Fok J, Miller FR, Koul D, Sahin AA. Prognostic significance of tissue transglutaminase in drug resistant and metastatic breast cancer. Clin Cancer Res (2004) 10:8068–76. doi: 10.1158/1078-0432.CCR-04-1107
179. Hammami I, Chen J, Bronte V, DeCrescenzo G, Jolicoeur M. L-glutamine is a key parameter in the immunosuppression phenomenon. Biochem Biophys Res Commun (2012) 425:724–9. doi: 10.1016/j.bbrc.2012.07.139
180. Al-Khami AA, Zheng L, Del Valle L, Hossain F, Wyczechowska D, Zabaleta J, et al. Exogenous lipid uptake induces metabolic and functional reprogramming of tumor-associated myeloid-derived suppressor cells. Oncoimmunology (2017) 6:e1344804. doi: 10.1080/2162402X.2017.1344804
181. Yan D, Adeshakin AO, Xu M, Afolabi LO, Zhang G, Chen YH, et al. Lipid metabolic pathways confer the immunosuppressive function of myeloid-derived suppressor cells in tumor. Front Immunol (2019) 10:1399. doi: 10.3389/fimmu.2019.01399
182. Veglia F, Tyurin VA, Blasi M, De Leo A, Kossenkov AV, Donthireddy L, et al. Fatty acid transport protein 2 reprograms neutrophils in cancer. Nature (2019) 569:73–8. doi: 10.1038/s41586-019-1118-2
183. Wellenstein MD, de Visser KE. Fatty acids corrupt neutrophils in cancer. Cancer Cell (2019) 35:827–9. doi: 10.1016/j.ccell.2019.05.007
184. Shi X, Pang S, Zhou J, Yan G, Sun J, Tan W. Feedback loop between fatty acid transport protein 2 and receptor interacting protein 3 pathways promotes polymorphonuclear neutrophil myeloid-derived suppressor cells-potentiated suppressive immunity in bladder cancer. Mol Biol Rep (2022) 49(12):11643–52. doi: 10.1007/s11033-022-07924-x
185. Yan G, Zhao H, Zhang Q, Zhou Y, Wu L, Lei J, et al. A RIPK3-PGE(2) circuit mediates myeloid-derived suppressor cell-potentiated colorectal carcinogenesis. Cancer Res (2018) 78:5586–99. doi: 10.1158/0008-5472.CAN-17-3962
186. Corzo CA, Condamine T, Lu L, Cotter MJ, Youn JI, Cheng P, et al. HIF-1α regulates function and differentiation of myeloid-derived suppressor cells in the tumor microenvironment. J Exp Med (2010) 207:2439–53. doi: 10.1084/jem.20100587
187. Chang WH, Lai AG. The hypoxic tumour microenvironment: a safe haven for immunosuppressive cells and a therapeutic barrier to overcome. Cancer Lett (2020) 487:34–44. doi: 10.1016/j.canlet.2020.05.011
188. Noman MZ, Desantis G, Janji B, Hasmim M, Karray S, Dessen P, et al. PD-L1 is a novel direct target of HIF-1α, and its blockade under hypoxia enhanced MDSC-mediated T cell activation. J Exp Med (2014) 211:781–90. doi: 10.1084/jem.20131916
189. Husain Z, Seth P, Sukhatme VP. Tumor-derived lactate and myeloid-derived suppressor cells: linking metabolism to cancer immunology. Oncoimmunology (2013) 2:e26383. doi: 10.4161/onci.26383
190. Husain Z, Huang Y, Seth P, Sukhatme VP. Tumor-derived lactate modifies antitumor immune response: effect on myeloid-derived suppressor cells and NK cells. J Immunol (2013) 191:1486–95. doi: 10.4049/jimmunol.1202702
191. Yang X, Lu Y, Hang J, Zhang J, Zhang T, Huo Y, et al. Lactate-modulated immunosuppression of myeloid-derived suppressor cells contributes to the radioresistance of pancreatic cancer. Cancer Immunol Res (2020) 8:1440–51. doi: 10.1158/2326-6066.CIR-20-0111
192. Kumar V. Dendritic cells in sepsis: potential immunoregulatory cells with therapeutic potential. Mol Immunol (2018) 101:615–26. doi: 10.1016/j.molimm.2018.07.007
193. Steinman RM. Decisions about dendritic cells: past, present, and future. Annu Rev Immunol (2012) 30:1–22. doi: 10.1146/annurev-immunol-100311-102839
194. Broz ML, Binnewies M, Boldajipour B, Nelson AE, Pollack JL, Erle DJ, et al. Dissecting the tumor myeloid compartment reveals rare activating antigen-presenting cells critical for T cell immunity. Cancer Cell (2014) 26:638–52. doi: 10.1016/j.ccell.2014.09.007
195. Gardner A, Ruffell B. Dendritic cells and cancer immunity. Trends Immunol (2016) 37:855–65. doi: 10.1016/j.it.2016.09.006
196. Bonaccorsi I, Campana S, Morandi B, Ferlazzo G. Acquisition and presentation of tumor antigens by dendritic cells. Crit Rev Immunol (2015) 35:349–64. doi: 10.1615/CritRevImmunol.v35.i5.10
197. Murphy TL, Grajales-Reyes GE, Wu X, Tussiwand R, Briseño CG, Iwata A, et al. Transcriptional control of dendritic cell development. Annu Rev Immunol (2016) 34:93–119. doi: 10.1146/annurev-immunol-032713-120204
198. Böttcher JP, Reis e Sousa C. The role of type 1 conventional dendritic cells in cancer immunity. Trends Cancer (2018) 4:784–92. doi: 10.1016/j.trecan.2018.09.001
199. Balan S, Radford KJ, Bhardwaj N. Chapter two - unexplored horizons of cDC1 in immunity and tolerance. In: Alt FW, editor. Advances in immunology, vol. 148 . Academic Press (2020). p. 49–91. doi: 10.1016/bs.ai.2020.10.002
200. Böttcher JP, Bonavita E, Chakravarty P, Blees H, Cabeza-Cabrerizo M, Sammicheli S, et al. NK cells stimulate recruitment of cDC1 into the tumor microenvironment promoting cancer immune control. Cell (2018) 172:1022–1037.e14. doi: 10.1016/j.cell.2018.01.004
201. Bordon Y. Tumour immunology: NK cells bring in the troops. Nat Rev Immunol (2018) 18:151. doi: 10.1038/nri.2018.14
202. Brown CC, Wolchok JD. PD-L1 blockade therapy: location, location, location. Cancer Cell (2020) 38:615–7. doi: 10.1016/j.ccell.2020.10.017
203. Dammeijer F, van Gulijk M, Mulder EE, Lukkes M, Klaase L, van den Bosch T, et al. The PD-1/PD-L1-Checkpoint restrains T cell immunity in tumor-draining lymph nodes. Cancer Cell (2020) 38:685–700.e8. doi: 10.1016/j.ccell.2020.09.001
204. Sharma MD, Baban B, Chandler P, Hou DY, Singh N, Yagita H, et al. Plasmacytoid dendritic cells from mouse tumor-draining lymph nodes directly activate mature tregs via indoleamine 2,3-dioxygenase. J Clin Invest (2007) 117:2570–82. doi: 10.1172/JCI31911
205. Wculek SK, Cueto FJ, Mujal AM, Melero I, Krummel MF, Sancho D. Dendritic cells in cancer immunology and immunotherapy. Nat Rev Immunol (2020) 20:7–24. doi: 10.1038/s41577-019-0210-z
206. Kvedaraite E, Ginhoux F. Human dendritic cells in cancer. Sci Immunol (2022) 7:eabm9409. doi: 10.1126/sciimmunol.abm9409
207. Gerhard GM, Bill R, Messemaker M, Klein AM, Pittet MJ. Tumor-infiltrating dendritic cell states are conserved across solid human cancers. J Exp Med (2020) 218:e2020026. doi: 10.1084/jem.20200264
208. Tel J, Anguille S, Waterborg CEJ, Smits EL, Figdor CG, de Vries IJM. Tumoricidal activity of human dendritic cells. Trends Immunol (2014) 35:38–46. doi: 10.1016/j.it.2013.10.007
209. Krawczyk CM, Holowka T, Sun J, Blagih J, Amiel E, DeBerardinis RJ, et al. Toll-like receptor–induced changes in glycolytic metabolism regulate dendritic cell activation. Blood (2010) 115:4742–9. doi: 10.1182/blood-2009-10-249540
210. O’Neill LAJ, Pearce EJ. Immunometabolism governs dendritic cell and macrophage function. J Exp Med (2015) 213:15–23. doi: 10.1084/jem.20151570
211. Everts B, Amiel E, Huang SC, Smith AM, Chang CH, Lam WY, et al. TLR-driven early glycolytic reprogramming via the kinases TBK1-IKKε supports the anabolic demands of dendritic cell activation. Nat Immunol (2014) 15:323–32. doi: 10.1038/ni.2833
212. Guak H, Al Habyan S, Ma EH, Aldossary H, Al-Masri M, Won SY, et al. Glycolytic metabolism is essential for CCR7 oligomerization and dendritic cell migration. Nat Commun (2018) 9:2463. doi: 10.1038/s41467-018-04804-6
213. Gotoh K, Morisaki T, Setoyama D, Sasaki K, Yagi M, Igami K, et al. Mitochondrial p32/C1qbp is a critical regulator of dendritic cell metabolism and maturation. Cell Rep (2018) 25:1800–1815.e4. doi: 10.1016/j.celrep.2018.10.057
214. Thwe PM, Pelgrom LR, Cooper R, Beauchamp S, Reisz JA, D'Alessandro A, et al. Cell-intrinsic glycogen metabolism supports early glycolytic reprogramming required for dendritic cell immune responses. Cell Metab (2017) 26:558–567.e5. doi: 10.1016/j.cmet.2017.08.012
215. Murray PJ. Understanding and exploiting the endogenous interleukin-10/STAT3-mediated anti-inflammatory response. Curr Opin Pharmacol (2006) 6:379–86. doi: 10.1016/j.coph.2006.01.010
216. Rehman A, Hemmert KC, Ochi A, Jamal M, Henning JR, Barilla R, et al. Role of fatty-acid synthesis in dendritic cell generation and function. J Immunol (2013) 190:4640–9. doi: 10.4049/jimmunol.1202312
217. Basit F, de Vries IJM. Dendritic cells require PINK1-mediated phosphorylation of BCKDE1α to promote fatty acid oxidation for immune function. Front Immunol (2019) 10:2386. doi: 10.3389/fimmu.2019.02386
218. Garcia D, Shaw RJ. AMPK: mechanisms of cellular energy sensing and restoration of metabolic balance. Mol Cell (2017) 66:789–800. doi: 10.1016/j.molcel.2017.05.032
219. Kelly B, O'Neill LA. Metabolic reprogramming in macrophages and dendritic cells in innate immunity. Cell Res (2015) 25:771–84. doi: 10.1038/cr.2015.68
220. Giovanelli P, Sandoval TA, Cubillos-Ruiz JR. Dendritic cell metabolism and function in tumors. Trends Immunol (2019) 40:699–718. doi: 10.1016/j.it.2019.06.004
221. Kumar V. Adenosine as an endogenous immunoregulator in cancer pathogenesis: where to go? Purinergic Signal (2013) 9:145–65. doi: 10.1007/s11302-012-9349-9
222. Kumar V, Sharma A. Adenosine: an endogenous modulator of innate immune system with therapeutic potential. Eur J Pharmacol (2009) 616:7–15. doi: 10.1016/j.ejphar.2009.05.005
223. Novitskiy SV, Ryzhov S, Zaynagetdinov R, Goldstein AE, Huang Y, Tikhomirov OY, et al. Adenosine receptors in regulation of dendritic cell differentiation and function. Blood (2008) 112:1822–31. doi: 10.1182/blood-2008-02-136325
224. Munn DH, Mellor AL. IDO in the tumor microenvironment: inflammation, counter-regulation, and tolerance. Trends Immunol (2016) 37:193–207. doi: 10.1016/j.it.2016.01.002
225. Munn DH, Sharma MD, Baban B, Harding HP, Zhang Y, Ron D, et al. GCN2 kinase in T cells mediates proliferative arrest and anergy induction in response to indoleamine 2,3-dioxygenase. Immunity (2005) 22:633–42. doi: 10.1016/j.immuni.2005.03.013
226. Fallarino F, Grohmann U, You S, McGrath BC, Cavener DR, Vacca C, et al. The combined effects of tryptophan starvation and tryptophan catabolites down-regulate T cell receptor ζ-chain and induce a regulatory phenotype in naive T cells. J Immunol (2006) 176:6752–61. doi: 10.4049/jimmunol.176.11.6752
227. Fallarino F, Grohmann U, You S, McGrath BC, Cavener DR, Vacca C, et al. Tryptophan catabolism generates autoimmune-preventive regulatory T cells. Transplant Immunol (2006) 17:58–60. doi: 10.1016/j.trim.2006.09.017
228. Mezrich JD, Fechner JH, Zhang X, Johnson BP, Burlingham WJ, Bradfield CA. An interaction between kynurenine and the aryl hydrocarbon receptor can generate regulatory T cells. J Immunol (2010) 185:3190–8. doi: 10.4049/jimmunol.0903670
229. Manlapat AK, Kahler DJ, Chandler PR, Munn DH, Mellor AL. Cell-autonomous control of interferon type I expression by indoleamine 2,3-dioxygenase in regulatory CD19+ dendritic cells. Eur J Immunol (2007) 37:1064–71. doi: 10.1002/eji.200636690
230. Campesato LF, Budhu S, Tchaicha J, Weng CH, Gigoux M, Cohen IJ, et al. Blockade of the AHR restricts a treg-macrophage suppressive axis induced by l-kynurenine. Nat Commun (2020) 11:4011. doi: 10.1038/s41467-020-17750-z
231. Heikenwalder M, Polymenidou M, Junt T, Sigurdson C, Wagner H, Akira S, et al. Lymphoid follicle destruction and immunosuppression after repeated CpG oligodeoxynucleotide administration. Nat Med (2004) 10:187–92. doi: 10.1038/nm987
232. Wingender G, Garbi N, Schumak B, Jüngerkes F, Endl E, von Bubnoff D, et al. Systemic application of CpG-rich DNA suppresses adaptive T cell immunity via induction of IDO. Eur J Immunol (2006) 36:12–20. doi: 10.1002/eji.200535602
233. Kumar S, Calianese D, Birge RB. Efferocytosis of dying cells differentially modulate immunological outcomes in tumor microenvironment. Immunol Rev (2017) 280:149–64. doi: 10.1111/imr.12587
234. Papagno L, Kuse N, Lissina A, Gostick E, Price DA, Appay V, et al. The TLR9 ligand CpG ODN 2006 is a poor adjuvant for the induction of de novo CD8+ T-cell responses in vitro. Sci Rep (2020) 10:11620. doi: 10.1038/s41598-020-67704-0
235. Malinarich F, Duan K, Hamid RA, Bijin A, Lin WX, Poidinger M, et al. High mitochondrial respiration and glycolytic capacity represent a metabolic phenotype of human tolerogenic dendritic cells. J Immunol (2015) 194:5174–86. doi: 10.4049/jimmunol.1303316
236. Herber DL, Cao W, Nefedova Y, Novitskiy SV, Nagaraj S, Tyurin VA, et al. Lipid accumulation and dendritic cell dysfunction in cancer. Nat Med (2010) 16:880–6. doi: 10.1038/nm.2172
237. Zitvogel L, Kroemer G. Targeting dendritic cell metabolism in cancer. Nat Med (2010) 16:858–9. doi: 10.1038/nm0810-858
238. Zhao F, Xiao C, Evans KS, Theivanthiran T, DeVito N, Holtzhausen A, et al. Paracrine Wnt5a-β-Catenin signaling triggers a metabolic program that drives dendritic cell tolerization. Immunity (2018) 48:147–160.e7. doi: 10.1016/j.immuni.2017.12.004
239. Holtzhausen A, Zhao F, Evans KS, Tsutsui M, Orabona C, Tyler DS, et al. Melanoma-derived Wnt5a promotes local dendritic-cell expression of IDO and immunotolerance: opportunities for pharmacologic enhancement of immunotherapy. Cancer Immunol Res (2015) 3:1082–95. doi: 10.1158/2326-6066.CIR-14-0167
240. Hong Y, Manoharan I, Suryawanshi A, Majumdar T, Angus-Hill ML, Koni PA, et al. β-catenin promotes regulatory T-cell responses in tumors by inducing vitamin a metabolism in dendritic cells. Cancer Res (2015) 75:656–65. doi: 10.1158/0008-5472.CAN-14-2377
241. Kumar V. Chapter 8 - innate lymphoid cells in autoimmune diseases. In: Rezaei N, editor. Translational autoimmunity, vol. 1 . Academic Press (2022). p. 143–75. doi: 10.1016/B978-0-12-822564-6.00007-0
242. Kumar V. Innate lymphoid cells: new paradigm in immunology of inflammation. Immunol Lett (2014) 157:23–37. doi: 10.1016/j.imlet.2013.11.003
243. Kumar V. Innate lymphoid cells: immunoregulatory cells of mucosal inflammation. Eur J Inflammation (2014) 12:11–20. doi: 10.1177/1721727X1401200102
244. Kumar V. Innate lymphoid cell and adaptive immune cell cross-talk: a talk meant not to forget. J Leukocyte Biol (2020) 108:397–417. doi: 10.1002/JLB.4MIR0420-500RRR
245. Kumar V. Innate lymphoid cells and adaptive immune cells cross-talk: a secret talk revealed in immune homeostasis and different inflammatory conditions. Int Rev Immunol (2021) 40:217–51. doi: 10.1080/08830185.2021.1895145
246. Simoni Y, Fehlings M, Kløverpris HN, McGovern N, Koo S-L, Loh CY, et al. Human innate lymphoid cell subsets possess tissue-type based heterogeneity in phenotype and frequency. Immunity (2017) 46:148–61. doi: 10.1016/j.immuni.2016.11.005
247. Jacquelot N, Seillet C, Vivier E, Belz GT. Innate lymphoid cells and cancer. Nat Immunol (2022) 23:371–9. doi: 10.1038/s41590-022-01127-z
248. Loyon R, Jary M, Salomé B, Gomez-Cadena A, Galaine J, Kroemer M, et al. Peripheral innate lymphoid cells are increased in first line metastatic colorectal carcinoma patients: a negative correlation with Th1 immune responses. Front Immunol (2019) 10:2121. doi: 10.3389/fimmu.2019.02121
249. Bie Q, Zhang P, Su Z, Zheng D, Ying X, Wu Y, et al. Polarization of ILC2s in peripheral blood might contribute to immunosuppressive microenvironment in patients with gastric cancer. J Immunol Res (2014) 2014:923135. doi: 10.1155/2014/923135
250. de Weerdt I, van Hoeven V, Munneke JM, Endstra S, Hofland T, Hazenberg MD, et al. Innate lymphoid cells are expanded and functionally altered in chronic lymphocytic leukemia. Haematologica (2016) 101:e461–4. doi: 10.3324/haematol.2016.144725
251. Cristiani CM, Capone M, Garofalo C, Madonna G, Mallardo D, Tuffanelli M, et al. Altered frequencies and functions of innate lymphoid cells in melanoma patients are modulated by immune checkpoints inhibitors. Front Immunol (2022) 13:811131. doi: 10.3389/fimmu.2022.811131
252. Imai K, Matsuyama S, Miyake S, Suga K, Nakachi K. Natural cytotoxic activity of peripheral-blood lymphocytes and cancer incidence: an 11-year follow-up study of a general population. Lancet (2000) 356:1795–9. doi: 10.1016/S0140-6736(00)03231-1
253. Hersey P, Edwards A, Honeyman M, McCarthy WH. Low natural-killer-cell activity in familial melanoma patients and their relatives. Br J Cancer (1979) 40:113–22. doi: 10.1038/bjc.1979.147
254. Jović V, Konjević G, Radulović S, Jelić S, Spuzić I. Impaired perforin-dependent NK cell cytotoxicity and proliferative activity of peripheral blood T cells is associated with metastatic melanoma. Tumori (2001) 87:324–9. doi: 10.1177/030089160108700509
255. Nussbaum JC, Van Dyken SJ, von Moltke J, Cheng LE, Mohapatra A, Molofsky AB, et al. Type 2 innate lymphoid cells control eosinophil homeostasis. Nature (2013) 502:245–8. doi: 10.1038/nature12526
256. Jacquelot N, Seillet C, Wang M, Pizzolla A, Liao Y, Hediyeh-Zadeh S, et al. Blockade of the co-inhibitory molecule PD-1 unleashes ILC2-dependent antitumor immunity in melanoma. Nat Immunol (2021) 22:851–64. doi: 10.1038/s41590-021-00943-z
257. Grisaru-Tal S, Dulberg S, Beck L, Zhang C, Itan M, Hediyeh-Zadeh S, et al. Metastasis-entrained eosinophils enhance lymphocyte-mediated antitumor immunity. Cancer Res (2021) 81:5555–71. doi: 10.1158/0008-5472.CAN-21-0839
258. Simson L, Ellyard JI, Dent LA, Matthaei KI, Rothenberg ME, Foster PS, et al. Regulation of carcinogenesis by IL-5 and CCL11: a potential role for eosinophils in tumor immune surveillance. J Immunol (2007) 178:4222–9. doi: 10.4049/jimmunol.178.7.4222
259. Goc J, Lv M, Bessman NJ, Flamar AL, Sahota S, Suzuki H, et al. Dysregulation of ILC3s unleashes progression and immunotherapy resistance in colon cancer. Cell (2021) 184:5015–5030.e16. doi: 10.1016/j.cell.2021.07.029
260. Warner K, Ghaedi M, Chung DC, Jacquelot N, Ohashi PS. Innate lymphoid cells in early tumor development. Front Immunol (2022) 13:948358. doi: 10.3389/fimmu.2022.948358
261. Wolf NK, Kissiov DU, Raulet DH. Roles of natural killer cells in immunity to cancer, and applications to immunotherapy. Nat Rev Immunol (2022) 23:90–105. doi: 10.1038/s41577-022-00732-1
262. Gao Y, Souza-Fonseca-Guimaraes F, Bald T, Ng SS, Young A, Ngiow SF, et al. Tumor immunoevasion by the conversion of effector NK cells into type 1 innate lymphoid cells. Nat Immunol (2017) 18:1004–15. doi: 10.1038/ni.3800
263. Silver JS, Humbles AA. NK cells join the plasticity party. Nat Immunol (2017) 18:959–60. doi: 10.1038/ni.3817
264. Cuff AO, Sillito F, Dertschnig S, Hall A, Luong TV, Chakraverty R, et al. The obese liver environment mediates conversion of NK cells to a less cytotoxic ILC1-like phenotype. Front Immunol (2019) 10:2180. doi: 10.3389/fimmu.2019.02180
265. Simonetta F, Pradier A, Roosnek E. T-Bet and eomesodermin in NK cell development, maturation, and function. Front Immunol (2016) 7:241. doi: 10.3389/fimmu.2016.00241
266. Gordon SM, Chaix J, Rupp LJ, Wu J, Madera S, Sun JC, et al. The transcription factors T-bet and eomes control key checkpoints of natural killer cell maturation. Immunity (2012) 36:55–67. doi: 10.1016/j.immuni.2011.11.016
267. Daussy C, Faure F, Mayol K, Viel S, Gasteiger G, Charrier E, et al. T-Bet and eomes instruct the development of two distinct natural killer cell lineages in the liver and in the bone marrow. J Exp Med (2014) 211:563–77. doi: 10.1084/jem.20131560
268. Shimizu K, Sato Y, Kawamura M, Nakazato H, Watanabe T, Ohara O. Eomes transcription factor is required for the development and differentiation of invariant NKT cells. Commun Biol (2019) 2:150. doi: 10.1038/s42003-019-0389-3
269. Qin Y, Oh S, Lim S, Shin JH, Yoon MS, Park S-H. Invariant NKT cells facilitate cytotoxic T-cell activation via direct recognition of CD1d on T cells. Exp Mol Med (2019) 51:1–9. doi: 10.1038/s12276-019-0329-9
270. McEwen-Smith RM, Salio M, Cerundolo V. The regulatory role of invariant NKT cells in tumor immunity. Cancer Immunol Res (2015) 3:425–35. doi: 10.1158/2326-6066.CIR-15-0062
271. Wang S, Qu Y, Xia P, Chen Y, Zhu X, Zhang J, et al. Transdifferentiation of tumor infiltrating innate lymphoid cells during progression of colorectal cancer. Cell Res (2020) 30:610–22. doi: 10.1038/s41422-020-0312-y
272. Huang Y, Guo L, Qiu J, Chen X, Hu-Li J, Siebenlist U, et al. IL-25-responsive, lineage-negative KLRG1(hi) cells are multipotential 'inflammatory' type 2 innate lymphoid cells. Nat Immunol (2015) 16:161–9. doi: 10.1038/ni.3078
273. Jou E, Rodriguez-Rodriguez N, Ferreira A-CF, Jolin HE, Clark PA, Sawmynaden K, et al. An innate IL-25–ILC2–MDSC axis creates a cancer-permissive microenvironment for apc mutation–driven intestinal tumorigenesis. Sci Immunol (2022) 7:eabn0175. doi: 10.1126/sciimmunol.abn0175
274. Koyasu S. Inflammatory ILC2 cells: disguising themselves as progenitors? Nat Immunol (2015) 16:133–4. doi: 10.1038/ni.3080
275. Gowhari Shabgah A, Amir A, Gardanova ZR, Olegovna Zekiy A, Thangavelu L, Ebrahimi Nik M, et al. Interleukin-25: new perspective and state-of-the-art in cancer prognosis and treatment approaches. Cancer Med (2021) 10:5191–202. doi: 10.1002/cam4.4060
276. Chevalier MF, Trabanelli S, Racle J, Salomé B, Cesson V, Gharbi D, et al. ILC2-modulated T cell-to-MDSC balance is associated with bladder cancer recurrence. J Clin Invest (2017) 127:2916–29. doi: 10.1172/JCI89717
277. Trabanelli S, Chevalier MF, Martinez-Usatorre A, Gomez-Cadena A, Salomé B, Lecciso M, et al. Tumour-derived PGD2 and NKp30-B7H6 engagement drives an immunosuppressive ILC2-MDSC axis. Nat Commun (2017) 8:593. doi: 10.1038/s41467-017-00678-2
278. Zhao N, Zhu W, Wang J, Liu W, Kang L, Yu R, et al. Group 2 innate lymphoid cells promote TNBC lung metastasis via the IL-13-MDSC axis in a murine tumor model. Int Immunopharmacol (2021) 99:107924. doi: 10.1016/j.intimp.2021.107924
279. O’Keefe RN, Carli AL, Baloyan D, Afshar-Sterle S, Eissmann MF, Poh AR, et al. Inhibition of the tuft cell/ILC2 axis reduces gastric tumor development in mice. bioRxiv (2022) 2022.02.16.480779. doi: 10.1101/2022.02.16.480779
280. Hatzioannou A, Banos A, Sakelaropoulos T, Fedonidis C, Vidali M-S, Köhne M, et al. An intrinsic role of IL-33 in treg cell–mediated tumor immunoevasion. Nat Immunol (2020) 21:75–85. doi: 10.1038/s41590-019-0555-2
281. Fournié JJ, Poupot M. The pro-tumorigenic IL-33 involved in antitumor immunity: a yin and yang cytokine. Front Immunol (2018) 9:2506. doi: 10.3389/fimmu.2018.02506
282. Ercolano G, Gomez-Cadena A, Dumauthioz N, Vanoni G, Kreutzfeldt M, Wyss T, et al. PPARɣ drives IL-33-dependent ILC2 pro-tumoral functions. Nat Commun (2021) 12:2538. doi: 10.1038/s41467-021-22764-2
283. Gardiner CM, Finlay DK. What fuels natural killers? metabolism and NK cell responses. Front Immunol (2017) 8. doi: 10.3389/fimmu.2017.00367
284. Poznanski SM, Barra NG, Ashkar AA, Schertzer JD. Immunometabolism of T cells and NK cells: metabolic control of effector and regulatory function. Inflammation Res (2018) 67:813–28. doi: 10.1007/s00011-018-1174-3
285. Marçais A, Cherfils-Vicini J, Viant C, Degouve S, Viel S, Fenis A, et al. The metabolic checkpoint kinase mTOR is essential for IL-15 signaling during the development and activation of NK cells. Nat Immunol (2014) 15:749–57. doi: 10.1038/ni.2936
286. Keppel MP, Saucier N, Mah AY, Vogel TP, Cooper MA. Activation-specific metabolic requirements for NK cell IFN-γ production. J Immunol (2015) 194:1954–62. doi: 10.4049/jimmunol.1402099
287. Donnelly RP, Loftus RM, Keating SE, Liou KT, Biron CA, Gardiner CM, et al. mTORC1-dependent metabolic reprogramming is a prerequisite for NK cell effector function. J Immunol (2014) 193:4477–84. doi: 10.4049/jimmunol.1401558
288. Zaiatz-Bittencourt V, Finlay DK, Gardiner CM. Canonical TGF-β signaling pathway represses human NK cell metabolism. J Immunol (2018) 200:3934–41. doi: 10.4049/jimmunol.1701461
289. Viel S, Marçais A, Guimaraes FS-F, Loftus R, Rabilloud J, Grau M, et al. TGF-b inhibits the activation and functions of NK cells by repressing the mTOR pathway. . Sci Signaling (2016) 9:ra19–9. doi: 10.1126/scisignal.aad1884
290. Besson L, Mery B, Morelle M, Rocca Y, Heudel PE, You B, et al. Cutting edge: mTORC1 inhibition in metastatic breast cancer patients negatively affects peripheral NK cell maturation and number. J Immunol (2021) 206:2265–70. doi: 10.4049/jimmunol.2001215
291. Harmon C, Robinson MW, Hand F, Almuaili D, Mentor K, Houlihan DD, et al. Lactate-mediated acidification of tumor microenvironment induces apoptosis of liver-resident NK cells in colorectal liver metastasis. Cancer Immunol Res (2019) 7:335–46. doi: 10.1158/2326-6066.CIR-18-0481
292. Park YJ, Song B, Kim YS, Kim EK, Lee JM, Lee GE, et al. Tumor microenvironmental conversion of natural killer cells into myeloid-derived suppressor cells. Cancer Res (2013) 73:5669–81. doi: 10.1158/0008-5472.CAN-13-0545
293. Surace L, Di Santo JP. Local and systemic features of ILC immunometabolism. Curr Opin Hematol (2022) 29:209–17. doi: 10.1097/MOH.0000000000000722
294. Li Q, Li D, Zhang X, Wan Q, Zhang W, Zheng M, et al. E3 ligase VHL promotes group 2 innate lymphoid cell maturation and function via glycolysis inhibition and induction of interleukin-33 receptor. Immunity (2018) 48:258–270.e5. doi: 10.1016/j.immuni.2017.12.013
295. Wilhelm C, Harrison OJ, Schmitt V, Pelletier M, Spencer SP, Urban JF Jr., et al. Critical role of fatty acid metabolism in ILC2-mediated barrier protection during malnutrition and helminth infection. J Exp Med (2016) 213:1409–18. doi: 10.1084/jem.20151448
296. Surace L, Doisne JM, Croft CA, Thaller A, Escoll P, Marie S, et al. Dichotomous metabolic networks govern human ILC2 proliferation and function. Nat Immunol (2021) 22:1367–74. doi: 10.1038/s41590-021-01043-8
297. Michla M, Wilhelm C. Food for thought - ILC metabolism in the context of helminth infections. Mucosal Immunol (2022) 15:1234–42. doi: 10.1038/s41385-022-00559-y
298. Karagiannis F, Masouleh SK, Wunderling K, Surendar J, Schmitt V, Kazakov A, et al. Lipid-droplet formation drives pathogenic group 2 innate lymphoid cells in airway inflammation. Immunity (2020) 52:620–634.e6. doi: 10.1016/j.immuni.2020.03.003
299. Zheng C, Wu H, Lu Z, Bi J, Wan X. IL-33-induced reactive oxygen species are required for optimal metabolic programming in group 2 innate lymphoid cells. Cell Mol Immunol (2020) 17:1266–8. doi: 10.1038/s41423-020-0393-z
300. Michalek RD, Gerriets VA, Jacobs SR, Macintyre AN, MacIver NJ, Mason EF, et al. Cutting edge: distinct glycolytic and lipid oxidative metabolic programs are essential for effector and regulatory CD4+ T cell subsets. J Immunol (2011) 186:3299–303. doi: 10.4049/jimmunol.1003613
301. Shi LZ, Wang R, Huang G, Vogel P, Neale G, Green DR, et al. HIF1α–dependent glycolytic pathway orchestrates a metabolic checkpoint for the differentiation of TH17 and treg cells. J Exp Med (2011) 208:1367–76. doi: 10.1084/jem.20110278
302. Chang CH, Curtis JD, Maggi LB Jr., Faubert B, Villarino AV, O'Sullivan D, et al. Posttranscriptional control of T cell effector function by aerobic glycolysis. Cell (2013) 153:1239–51. doi: 10.1016/j.cell.2013.05.016
303. Peng M, Yin N, Chhangawala S, Xu K, Leslie CS, Li MO. Aerobic glycolysis promotes T helper 1 cell differentiation through an epigenetic mechanism. Science (2016) 354:481–4. doi: 10.1126/science.aaf6284
304. Quinn WJ, Jiao J, TeSlaa T, Stadanlick J, Wang Z, Wang L, et al. Lactate limits T cell proliferation via the NAD(H) redox state. Cell Rep (2020) 33:108500. doi: 10.1016/j.celrep.2020.108500
305. Angelin A, Gil-de-Gómez L, Dahiya S, Jiao J, Guo L, Levine MH, et al. Foxp3 reprograms T cell metabolism to function in low-glucose, high-lactate environments. Cell Metab (2017) 25:1282–1293.e7. doi: 10.1016/j.cmet.2016.12.018
306. Grzes KM, Field CS, Pearce EJ. Treg cells survive and thrive in inhospitable environments. Cell Metab (2017) 25:1213–5. doi: 10.1016/j.cmet.2017.05.012
307. Watson MJ, Vignali PDA, Mullett SJ, Overacre-Delgoffe AE, Peralta RM, Grebinoski S, et al. Metabolic support of tumour-infiltrating regulatory T cells by lactic acid. Nature (2021) 591:645–51. doi: 10.1038/s41586-020-03045-2
308. Kumagai S, Koyama S, Itahashi K, Tanegashima T, Lin YT, Togashi Y, et al. Lactic acid promotes PD-1 expression in regulatory T cells in highly glycolytic tumor microenvironments. Cancer Cell (2022) 40:201–218.e9. doi: 10.1016/j.ccell.2022.01.001
309. Johnson S, Haigis MC, Dougan SK. Dangerous dynamic duo: lactic acid and PD-1 blockade. Cancer Cell (2022) 40:127–30. doi: 10.1016/j.ccell.2022.01.008
310. Gu J, Zhou J, Chen Q, Xu X, Gao J, Li X, et al. Tumor metabolite lactate promotes tumorigenesis by modulating MOESIN lactylation and enhancing TGF-β signaling in regulatory T cells. Cell Rep (2022) 39:110986. doi: 10.1016/j.celrep.2022.110986
311. Itahashi K, Irie T, Yuda J, Kumagai S, Tanegashima T, Lin Y-T, et al. BATF epigenetically and transcriptionally controls the activation program of regulatory T cells in human tumors. Sci Immunol (2022) 7:eabk0957. doi: 10.1126/sciimmunol.abk0957
312. Field CS, Baixauli F, Kyle RL, Puleston DJ, Cameron AM, Sanin DE, et al. Mitochondrial integrity regulated by lipid metabolism is a cell-intrinsic checkpoint for treg suppressive function. Cell Metab (2020) 31:422–437.e5. doi: 10.1016/j.cmet.2019.11.021
313. Kobayashi S, Wannakul T, Sekino K, Takahashi Y, Kagawa Y, Miyazaki H, et al. Fatty acid-binding protein 5 limits the generation of Foxp3(+) regulatory T cells through regulating plasmacytoid dendritic cell function in the tumor microenvironment. Int J Cancer (2022) 150:152–63. doi: 10.1002/ijc.33777
314. Delgoffe GM, Kole TP, Zheng Y, Zarek PE, Matthews KL, Xiao B, et al. The mTOR kinase differentially regulates effector and regulatory T cell lineage commitment. Immunity (2009) 30:832–44. doi: 10.1016/j.immuni.2009.04.014
315. Wang H, Franco F, Tsui YC, Xie X, Trefny MP, Zappasodi R, et al. CD36-mediated metabolic adaptation supports regulatory T cell survival and function in tumors. Nat Immunol (2020) 21:298–308. doi: 10.1038/s41590-019-0589-5
316. Chen Y, Zhang J, Cui W, Silverstein RL. CD36, a signaling receptor and fatty acid transporter that regulates immune cell metabolism and fate. J Exp Med (2022) 219:e20211314. doi: 10.1084/jem.20211314
317. Xu S, Chaudhary O, Rodríguez-Morales P, Sun X, Chen D, Zappasodi R, et al. Uptake of oxidized lipids by the scavenger receptor CD36 promotes lipid peroxidation and dysfunction in CD8(+) T cells in tumors. Immunity (2021) 54:1561–1577.e7. doi: 10.1016/j.immuni.2021.05.003
318. Henson SM, Lanna A, Riddell NE, Franzese O, Macaulay R, Griffiths SJ, et al. p38 signaling inhibits mTORC1-independent autophagy in senescent human CD8⁺ T cells. J Clin Invest (2014) 124:4004–16. doi: 10.1172/JCI75051
319. Ma X, Xiao L, Liu L, Ye L, Su P, Bi E, et al. CD36-mediated ferroptosis dampens intratumoral CD8+ T cell effector function and impairs their antitumor ability. Cell Metab (2021) 33:1001–1012.e5. doi: 10.1016/j.cmet.2021.02.015
320. Gerriets VA, Kishton RJ, Johnson MO, Cohen S, Siska PJ, Nichols AG, et al. Foxp3 and toll-like receptor signaling balance t(reg) cell anabolic metabolism for suppression. Nat Immunol (2016) 17:1459–66. doi: 10.1038/ni.3577
321. Jang G-Y, Lee J, Kim YS, Lee SE, Han HD, Hong K-J, et al. Interactions between tumor-derived proteins and toll-like receptors. Exp Mol Med (2020) 52:1926–35. doi: 10.1038/s12276-020-00540-4
322. Downs-Canner S, Berkey S, Delgoffe GM, Edwards RP, Curiel T, Odunsi K, et al. Suppressive IL-17A+Foxp3+ and ex-Th17 IL-17AnegFoxp3+ treg cells are a source of tumour-associated treg cells. Nat Commun (2017) 8:14649. doi: 10.1038/ncomms14649
323. Clever D, Roychoudhuri R, Constantinides MG, Askenase MH, Sukumar M, Klebanoff CA, et al. Oxygen sensing by T cells establishes an immunologically tolerant metastatic niche. Cell (2016) 166:1117–1131.e14. doi: 10.1016/j.cell.2016.07.032
324. Haas R, Smith J, Rocher-Ros V, Nadkarni S, Montero-Melendez T, D’Acquisto F, et al. Lactate regulates metabolic and pro-inflammatory circuits in control of T cell migration and effector functions. PlLS Biol (2015) 13:e1002202. doi: 10.1371/journal.pbio.1002202
325. Brand A, Singer K, Koehl GE, Kolitzus M, Schoenhammer G, Thiel A, et al. LDHA-associated lactic acid production blunts tumor immunosurveillance by T and NK cells. Cell Metab (2016) 24:657–71. doi: 10.1016/j.cmet.2016.08.011
326. Scott KEN, Cleveland JL. Lactate wreaks havoc on tumor-infiltrating T and NK cells. Cell Metab (2016) 24:649–50. doi: 10.1016/j.cmet.2016.10.015
327. Yu YR, Imrichova H, Wang H, Chao T, Xiao Z, Gao M, et al. Disturbed mitochondrial dynamics in CD8(+) TILs reinforce T cell exhaustion. Nat Immunol (2020) 21:1540–51. doi: 10.1038/s41590-020-0793-3
328. Li W, Cheng H, Li G, Zhang L. Mitochondrial damage and the road to exhaustion. Cell Metab (2020) 32:905–7. doi: 10.1016/j.cmet.2020.11.004
329. Vardhana SA, Hwee MA, Berisa M, Wells DK, Yost KE, King B, et al. Impaired mitochondrial oxidative phosphorylation limits the self-renewal of T cells exposed to persistent antigen. Nat Immunol (2020) 21:1022–33. doi: 10.1038/s41590-020-0725-2
330. Schurich A, Pallett LJ, Jajbhay D, Wijngaarden J, Otano I, Gill US, et al. Distinct metabolic requirements of exhausted and functional virus-specific CD8 T cells in the same host. Cell Rep (2016) 16:1243–52. doi: 10.1016/j.celrep.2016.06.078
331. Lim TS, Chew V, Sieow JL, Goh S, Yeong JP, Soon AL, et al. PD-1 expression on dendritic cells suppresses CD8(+) T cell function and antitumor immunity. Oncoimmunology (2016) 5:e1085146. doi: 10.1080/2162402X.2015.1085146
332. Oh SA, Wu D-C, Cheung J, Navarro A, Xiong H, Cubas R, et al. PD-L1 expression by dendritic cells is a key regulator of T-cell immunity in cancer. Nat Cancer (2020) 1:681–91. doi: 10.1038/s43018-020-0075-x
333. Siska PJ, Rathmell JC. T Cell metabolic fitness in antitumor immunity. Trends Immunol (2015) 36:257–64. doi: 10.1016/j.it.2015.02.007
334. Nakaya M, Xiao Y, Zhou X, Chang JH, Chang M, Cheng X, et al. Inflammatory T cell responses rely on amino acid transporter ASCT2 facilitation of glutamine uptake and mTORC1 kinase activation. Immunity (2014) 40:692–705. doi: 10.1016/j.immuni.2014.04.007
335. Cham CM, Driessens G, O'Keefe JP, Gajewski TF. Glucose deprivation inhibits multiple key gene expression events and effector functions in CD8+ T cells. Eur J Immunol (2008) 38:2438–50. doi: 10.1002/eji.200838289
336. Sinclair LV, Rolf J, Emslie E, Shi YB, Taylor PM, Cantrell DA. Control of amino-acid transport by antigen receptors coordinates the metabolic reprogramming essential for T cell differentiation. Nat Immunol (2013) 14:500–8. doi: 10.1038/ni.2556
337. MacIver NJ, Michalek RD, Rathmell JC. Metabolic regulation of T lymphocytes. Annu Rev Immunol (2013) 31:259–83. doi: 10.1146/annurev-immunol-032712-095956
338. Alves NL, Derks IAM, Berk E, Spijker R, van Lier RAW, Eldering E. The Noxa/Mcl-1 axis regulates susceptibility to apoptosis under glucose limitation in dividing T cells. Immunity (2006) 24:703–16. doi: 10.1016/j.immuni.2006.03.018
339. Ecker C, Guo L, Voicu S, Gil-de-Gómez L, Medvec A, Cortina L, et al. Differential reliance on lipid metabolism as a salvage pathway underlies functional differences of T cell subsets in poor nutrient environments. Cell Rep (2018) 23:741–55. doi: 10.1016/j.celrep.2018.03.084
340. Zhang Y, Kurupati R, Liu L, Zhou XY, Zhang G, Hudaihed A, et al. Enhancing CD8+ T cell fatty acid catabolism within a metabolically challenging tumor microenvironment increases the efficacy of melanoma immunotherapy. Cancer Cell (2017) 32:377–391.e9. doi: 10.1016/j.ccell.2017.08.004
341. Bailis W, Shyer JA, Chiorazzi M, Flavell RA. No oxygen? no glucose? no problem: fatty acid catabolism enhances effector CD8+ TILs. Cancer Cell (2017) 32:280–1. doi: 10.1016/j.ccell.2017.08.013
342. Gaggero S, Martinez-Fabregas J, Cozzani A, Fyfe PK, Leprohon M, Yang J, et al. IL-2 is inactivated by the acidic pH environment of tumors enabling engineering of a pH-selective mutein. Sci Immunol (2022) 7:eade5686. doi: 10.1126/sciimmunol.ade5686
343. Gerriets VA, Kishton RJ, Nichols AG, Macintyre AN, Inoue M, Ilkayeva O, et al. Metabolic programming and PDHK1 control CD4+ T cell subsets and inflammation. J Clin Invest (2015) 125:194–207. doi: 10.1172/JCI76012
344. Wang R, Dillon CP, Shi LZ, Milasta S, Carter R, Finkelstein D, et al. The transcription factor myc controls metabolic reprogramming upon T lymphocyte activation. Immunity (2011) 35:871–82. doi: 10.1016/j.immuni.2011.09.021
345. Klysz D, Tai X, Robert PA, Craveiro M, Cretenet G, Oburoglu L, et al. Glutamine-dependent α-ketoglutarate production regulates the balance between T helper 1 cell and regulatory T cell generation. Sci Signal (2015) 8:ra97. doi: 10.1126/scisignal.aab2610
346. Leone RD, Zhao L, Englert JM, Sun IM, Oh MH, Sun IH, et al. Glutamine blockade induces divergent metabolic programs to overcome tumor immune evasion. Science (2019) 366:1013–21. doi: 10.1126/science.aav2588
347. Gnanaprakasam JNR, Sherman JW, Wang R. MYC and HIF in shaping immune response and immune metabolism. Cytokine Growth Factor Rev (2017) 35:63–70. doi: 10.1016/j.cytogfr.2017.03.004
348. Scharping NE, Menk AV, Moreci RS, Whetstone RD, Dadey RE, Watkins SC, et al. The tumor microenvironment represses T cell mitochondrial biogenesis to drive intratumoral T cell metabolic insufficiency and dysfunction. Immunity (2016) 45:374–88. doi: 10.1016/j.immuni.2016.07.009
349. Scharping NE, Rivadeneira DB, Menk AV, Vignali PDA, Ford BR, Rittenhouse NL, et al. Mitochondrial stress induced by continuous stimulation under hypoxia rapidly drives T cell exhaustion. Nat Immunol (2021) 22:205–15. doi: 10.1038/s41590-020-00834-9
350. Soto-Heredero G, Desdín-Micó G, Mittelbrunn M. Mitochondrial dysfunction defines T cell exhaustion. Cell Metab (2021) 33:470–2. doi: 10.1016/j.cmet.2021.02.010
351. Liu X, Peng G. Mitochondria orchestrate T cell fate and function. Nat Immunol (2021) 22:276–8. doi: 10.1038/s41590-020-00861-6
352. Priyadharshini B, Loschi M, Newton RH, Zhang JW, Finn KK, Gerriets VA, et al. Cutting edge: TGF-β and phosphatidylinositol 3-kinase signals modulate distinct metabolism of regulatory T cell subsets. J Immunol (2018) 201:2215–9. doi: 10.4049/jimmunol.1800311
353. Francisco LM, Salinas VH, Brown KE, Vanguri VK, Freeman GJ, Kuchroo VK, et al. PD-L1 regulates the development, maintenance, and function of induced regulatory T cells. J Exp Med (2009) 206:3015–29. doi: 10.1084/jem.20090847
354. Tu E, Chia CPZ, Chen W, Zhang D, Park SA, Jin W, et al. T Cell receptor-regulated TGF-β type I receptor expression determines T cell quiescence and activation. Immunity (2018) 48:745–759.e6. doi: 10.1016/j.immuni.2018.03.025
355. de Visser KE, Korets LV, Coussens LM. De novo carcinogenesis promoted by chronic inflammation is b lymphocyte dependent. Cancer Cell (2005) 7:411–23. doi: 10.1016/j.ccr.2005.04.014
356. Houghton AN, Uchi H, Wolchok JD. The role of the immune system in early epithelial carcinogenesis: b-ware the double-edged sword. Cancer Cell (2005) 7:403–5. doi: 10.1016/j.ccr.2005.04.026
357. DiLillo DJ, Yanaba K, Tedder TF. B cells are required for optimal CD4+ and CD8+ T cell tumor immunity: therapeutic b cell depletion enhances B16 melanoma growth in mice. J Immunol (2010) 184:4006–16. doi: 10.4049/jimmunol.0903009
358. Singh S, Roszik J, Saini N, Singh VK, Bavisi K, Wang Z, et al. B cells are required to generate optimal anti-melanoma immunity in response to checkpoint blockade. Front Immunol (2022) 13:794684. doi: 10.3389/fimmu.2022.794684
359. Sagiv-Barfi I, Czerwinski DK, Shree T, Lohmeyer JJK, Levy R. Intratumoral immunotherapy relies on b and T cell collaboration. Sci Immunol (2022) 7:eabn5859. doi: 10.1126/sciimmunol.abn5859
360. Cabrita R, Lauss M, Sanna A, Donia M, Skaarup Larsen M, Mitra S, et al. Tertiary lymphoid structures improve immunotherapy and survival in melanoma. Nature (2020) 577:561–5. doi: 10.1038/s41586-019-1914-8
361. Fridman WH, Petitprez F, Meylan M, Chen TW-W, Sun C-M, Roumenina LT, et al. B cells and cancer: to b or not to b? J Exp Med (2020) 218. doi: 10.1084/jem.20200851
362. Iglesia MD, Vincent BG, Parker JS, Hoadley KA, Carey LA, Perou CM, et al. Prognostic b-cell signatures using mRNA-seq in patients with subtype-specific breast and ovarian cancer. Clin Cancer Res (2014) 20:3818–29. doi: 10.1158/1078-0432.CCR-13-3368
363. Iglesia MD, Parker JS, Hoadley KA, Serody JS, Perou CM, Vincent BG. Genomic analysis of immune cell infiltrates across 11 tumor types. JNCI: J Natl Cancer Institute (2016) 108:djw144. doi: 10.1093/jnci/djw144
364. Selitsky SR, Mose LE, Smith CC, Chai S, Hoadley KA, Dittmer DP, et al. Prognostic value of b cells in cutaneous melanoma. Genome Med (2019) 11:36. doi: 10.1186/s13073-019-0647-5
365. Petitprez F, de Reyniès A, Keung EZ, Chen TW, Sun CM, Calderaro J, et al. B cells are associated with survival and immunotherapy response in sarcoma. Nature (2020) 577:556–60. doi: 10.1038/s41586-019-1906-8
366. Helmink BA, Reddy SM, Gao J, Zhang S, Basar R, Thakur R, et al. B cells and tertiary lymphoid structures promote immunotherapy response. Nature (2020) 577:549–55. doi: 10.1038/s41586-019-1922-8
367. Germain C, Gnjatic S, Tamzalit F, Knockaert S, Remark R, Goc J, et al. Presence of b cells in tertiary lymphoid structures is associated with a protective immunity in patients with lung cancer. Am J Respir Crit Care Med (2014) 189:832–44. doi: 10.1164/rccm.201309-1611OC
368. Wang Z, Wu X. Study and analysis of antitumor resistance mechanism of PD1/PD-L1 immune checkpoint blocker. Cancer Med (2020) 9:8086–121. doi: 10.1002/cam4.3410
369. Yuen GJ, Demissie E, Pillai S. B lymphocytes and cancer: a love-hate relationship. Trends Cancer (2016) 2:747–57. doi: 10.1016/j.trecan.2016.10.010
370. Laumont CM, Banville AC, Gilardi M, Hollern DP, Nelson BH. Tumour-infiltrating b cells: immunological mechanisms, clinical impact and therapeutic opportunities. Nat Rev Cancer (2022) 22:414–30. doi: 10.1038/s41568-022-00466-1
371. Fridman WH, Meylan M, Petitprez F, Sun C-M, Italiano A, Sautès-Fridman C. B cells and tertiary lymphoid structures as determinants of tumour immune contexture and clinical outcome. Nat Rev Clin Oncol (2022) 19:441–57. doi: 10.1038/s41571-022-00619-z
372. Chiaranunt P, Burrows K, Ngai L, Cao EY, Tai SL, Liang H, et al. Microbial energy metabolism fuels a CSF2-dependent intestinal macrophage niche within tertiary lymphoid organs. bioRxiv (2022), 2022.03.23.485563. doi: 10.1101/2022.03.23.485563
373. Carrega P, Loiacono F, Di Carlo E, Scaramuccia A, Mora M, Conte R, et al. NCR(+)ILC3 concentrate in human lung cancer and associate with intratumoral lymphoid structures. Nat Commun (2015) 6:8280. doi: 10.1038/ncomms9280
374. Lu Y, Yuan X, Wang M, He Z, Li H, Wang J, et al. Gut microbiota influence immunotherapy responses: mechanisms and therapeutic strategies. J Hematol Oncol (2022) 15:47. doi: 10.1186/s13045-022-01273-9
375. Cerutti A, Cols M, Puga I. Marginal zone b cells: virtues of innate-like antibody-producing lymphocytes. Nat Rev Immunol (2013) 13:118–32. doi: 10.1038/nri3383
376. LeBien TW, Tedder TF. B lymphocytes: how they develop and function. Blood (2008) 112:1570–80. doi: 10.1182/blood-2008-02-078071
377. Akkaya M, Pierce SK. From zero to sixty and back to zero again: the metabolic life of b cells. Curr Opin Immunol (2019) 57:1–7. doi: 10.1016/j.coi.2018.09.019
378. Montecino-Rodriguez E, Fice M, Casero D, Berent-Maoz B, Barber CL, Dorshkind K. Distinct genetic networks orchestrate the emergence of specific waves of fetal and adult b-1 and b-2 development. Immunity (2016) 45:527–39. doi: 10.1016/j.immuni.2016.07.012
379. Clarke AJ, Riffelmacher T, Braas D, Cornall RJ, Simon AK. B1a b cells require autophagy for metabolic homeostasis and self-renewal. J Exp Med (2018) 215:399–413. doi: 10.1084/jem.20170771
380. Jellusova J, Cato MH, Apgar JR, Ramezani-Rad P, Leung CR, Chen C, et al. Gsk3 is a metabolic checkpoint regulator in b cells. Nat Immunol (2017) 18:303–12. doi: 10.1038/ni.3664
381. De Silva NS, Klein U. Dynamics of b cells in germinal centres. Nat Rev Immunol (2015) 15:137–48. doi: 10.1038/nri3804
382. Mesin L, Ersching J, Victora GD. Germinal center b cell dynamics. Immunity (2016) 45:471–82. doi: 10.1016/j.immuni.2016.09.001
383. Victora GD, Nussenzweig MC. Germinal centers. Annu Rev Immunol (2022) 40:413–42. doi: 10.1146/annurev-immunol-120419-022408
384. Dominguez-Sola D, Victora GD, Ying CY, Phan RT, Saito M, Nussenzweig MC, et al. The proto-oncogene MYC is required for selection in the germinal center and cyclic reentry. Nat Immunol (2012) 13:1083–91. doi: 10.1038/ni.2428
385. Luo W, Weisel F, Shlomchik MJ. B cell receptor and CD40 signaling are rewired for synergistic induction of the c-myc transcription factor in germinal center b cells. Immunity (2018) 48:313–326.e5. doi: 10.1016/j.immuni.2018.01.008
386. Li F, Wang Y, Zeller KI, Potter JJ, Wonsey DR, O'Donnell KA, et al. Myc stimulates nuclearly encoded mitochondrial genes and mitochondrial biogenesis. Mol Cell Biol (2005) 25:6225–34. doi: 10.1128/MCB.25.14.6225-6234.2005
387. Li L, Feng C, Qin J, Li D, Liu M, Han S, et al. Regulation of humoral immune response by HIF-1α-dependent metabolic reprogramming of the germinal center reaction. Cell Immunol (2021) 367:104409. doi: 10.1016/j.cellimm.2021.104409
388. Lam WY, Becker AM, Kennerly KM, Wong R, Curtis JD, Llufrio EM, et al. Mitochondrial pyruvate import promotes long-term survival of antibody-secreting plasma cells. Immunity (2016) 45:60–73. doi: 10.1016/j.immuni.2016.06.011
389. Lam WY, Bhattacharya D. Metabolic links between plasma cell survival, secretion, and stress. Trends Immunol (2018) 39:19–27. doi: 10.1016/j.it.2017.08.007
390. Waters LR, Ahsan FM, Wolf DM, Shirihai O, Teitell MA. Initial b cell activation induces metabolic reprogramming and mitochondrial remodeling. iScience (2018) 5:99–109. doi: 10.1016/j.isci.2018.07.005
391. Lam WY, Jash A, Yao CH, D'Souza L, Wong R, Nunley RM, et al. Metabolic and transcriptional modules independently diversify plasma cell lifespan and function. Cell Rep (2018) 24:2479–2492.e6. doi: 10.1016/j.celrep.2018.07.084
392. Sandoval H, Kodali S, Wang J. Regulation of b cell fate, survival, and function by mitochondria and autophagy. Mitochondrion (2018) 41:58–65. doi: 10.1016/j.mito.2017.11.005
393. Kunisawa J, Sugiura Y, Wake T, Nagatake T, Suzuki H, Nagasawa R, et al. Mode of bioenergetic metabolism during b cell differentiation in the intestine determines the distinct requirement for vitamin B1. Cell Rep (2015) 13:122–31. doi: 10.1016/j.celrep.2015.08.063
394. Hu Q, Hong Y, Qi P, Lu G, Mai X, Xu S, et al. Atlas of breast cancer infiltrated b-lymphocytes revealed by paired single-cell RNA-sequencing and antigen receptor profiling. Nat Commun (2021) 12:2186. doi: 10.1038/s41467-021-22300-2
395. Meylan M, Petitprez F, Becht E, Bougoüin A, Pupier G, Calvez A, et al. Tertiary lymphoid structures generate and propagate anti-tumor antibody-producing plasma cells in renal cell cancer. Immunity (2022) 55:527–541.e5. doi: 10.1016/j.immuni.2022.02.001
396. Ruffin AT, Cillo AR, Tabib T, Liu A, Onkar S, Kunning SR, et al. B cell signatures and tertiary lymphoid structures contribute to outcome in head and neck squamous cell carcinoma. Nat Commun (2021) 12:3349. doi: 10.1038/s41467-021-23355-x
397. Weiner AB, Vidotto T, Liu Y, Mendes AA, Salles DC, Faisal FA, et al. Plasma cells are enriched in localized prostate cancer in black men and are associated with improved outcomes. Nat Commun (2021) 12:935. doi: 10.1038/s41467-021-21245-w
398. Rosser EC, Oleinika K, Tonon S, Doyle R, Bosma A, Carter NA, et al. Regulatory b cells are induced by gut microbiota-driven interleukin-1β and interleukin-6 production. Nat Med (2014) 20:1334–9. doi: 10.1038/nm.3680
399. Wang RX, Yu CR, Dambuza IM, Mahdi RM, Dolinska MB, Sergeev YV, et al. Interleukin-35 induces regulatory b cells that suppress autoimmune disease. Nat Med (2014) 20:633–41. doi: 10.1038/nm.3554
400. Dambuza IM, He C, Choi JK, Yu CR, Wang R, Mattapallil MJ, et al. IL-12p35 induces expansion of IL-10 and IL-35-expressing regulatory b cells and ameliorates autoimmune disease. Nat Commun (2017) 8:719. doi: 10.1038/s41467-017-00838-4
401. Rosser EC, Mauri C. Regulatory b cells: origin, phenotype, and function. Immunity (2015) 42:607–12. doi: 10.1016/j.immuni.2015.04.005
402. Balkwill F, Montfort A, Capasso M. B regulatory cells in cancer. Trends Immunol (2013) 34:169–73. doi: 10.1016/j.it.2012.10.007
403. Mirlekar B, Wang Y, Li S, Zhou M, Entwistle S, De Buysscher T, et al. Balance between immunoregulatory b cells and plasma cells drives pancreatic tumor immunity. Cell Rep Med (2022) 3:100744. doi: 10.1016/j.xcrm.2022.100744
404. Sharma A, Liaw K, Sharma R, Thomas AG, Slusher BS, Kannan S, et al. Targeting mitochondria in tumor-associated macrophages using a dendrimer-conjugated TSPO ligand that stimulates antitumor signaling in glioblastoma. Biomacromolecules (2020) 21:3909–22. doi: 10.1021/acs.biomac.0c01033
405. Sharma R, Liaw K, Sharma A, Jimenez A, Chang M, Salazar S, et al. Glycosylation of PAMAM dendrimers significantly improves tumor macrophage targeting and specificity in glioblastoma. J Control Release (2021) 337:179–92. doi: 10.1016/j.jconrel.2021.07.018
406. Halbrook CJ, Pontious C, Kovalenko I, Lapienyte L, Dreyer S, Lee H-J, et al. Macrophage-released pyrimidines inhibit gemcitabine therapy in pancreatic cancer. Cell Metab (2019) 29:1390–1399.e6. doi: 10.1016/j.cmet.2019.02.001
407. Shan X, Hu P, Ni L, Shen L, Zhang Y, Ji Z, et al. Serine metabolism orchestrates macrophage polarization by regulating the IGF1–p38 axis. Cell Mol Immunol (2022) 19:1263–78. doi: 10.1038/s41423-022-00925-7
408. Wang W, Guo MN, Li N, Pang DQ, Wu JH. Glutamine deprivation impairs function of infiltrating CD8(+) T cells in hepatocellular carcinoma by inducing mitochondrial damage and apoptosis. World J Gastrointest Oncol (2022) 14:1124–40. doi: 10.4251/wjgo.v14.i6.1124
409. Feng Q, Liu Z, Yu X, Huang T, Chen J, Wang J, et al. Lactate increases stemness of CD8 + T cells to augment anti-tumor immunity. Nat Commun (2022) 13:4981. doi: 10.1038/s41467-022-32521-8
410. Beckermann KE, Hongo R, Ye X, Young K, Carbonell K, Healey DCC, et al. CD28 costimulation drives tumor-infiltrating T cell glycolysis to promote inflammation. JCI Insight (2020) 5(16):e138729. doi: 10.1172/jci.insight.138729
411. Cribioli E, Giordano Attianese GMP, Ginefra P, Signorino-Gelo A, Vuillefroy de Silly R, Vannini N, et al. Enforcing GLUT3 expression in CD8(+) T cells improves fitness and tumor control by promoting glucose uptake and energy storage. Front Immunol (2022) 13:976628. doi: 10.3389/fimmu.2022.976628
412. Sukumar M, Liu J, Ji Y, Subramanian M, Crompton JG, Yu Z, et al. Inhibiting glycolytic metabolism enhances CD8+ T cell memory and antitumor function. J Clin Invest (2013) 123:4479–88. doi: 10.1172/JCI69589
413. Nath PR, Pal-Nath D, Kaur S, Gangaplara A, Meyer TJ, Cam MC, et al. Loss of CD47 alters CD8+ T cell activation in vitro and immunodynamics in mice. Oncoimmunology (2022) 11:2111909. doi: 10.1080/2162402X.2022.2111909
414. Liu X, Pu Y, Cron K, Deng L, Kline J, Frazier WA, et al. CD47 blockade triggers T cell-mediated destruction of immunogenic tumors. Nat Med (2015) 21:1209–15. doi: 10.1038/nm.3931
415. Vonderheide RH. CD47 blockade as another immune checkpoint therapy for cancer. Nat Med (2015) 21:1122–3. doi: 10.1038/nm.3965
416. Wang Z, Li B, Li S, Lin W, Wang Z, Wang S, et al. Metabolic control of CD47 expression through LAT2-mediated amino acid uptake promotes tumor immune evasion. Nat Commun (2022) 13:6308. doi: 10.1038/s41467-022-34064-4
417. Minogue E, Cunha PP, Quaranta A, Zurita J, Teli SS, Wadsworth BJ, et al. Glutarate regulates T cell function and metabolism. bioRxiv (2022), 2022.10.20.513065. doi: 10.1101/2022.10.20.513065
418. Lötscher J, Martí i Líndez A-A, Kirchhammer N, Cribioli E, Giordano Attianese GMP, Trefny MP, et al. Magnesium sensing via LFA-1 regulates CD8+ T cell effector function. Cell (2022) 185:585–602.e29. doi: 10.1016/j.cell.2021.12.039
419. Vardhana S, Dustin ML. Magnesium for T cells: strong to the finish! Trends Immunol (2022) 43:277–9. doi: 10.1016/j.it.2022.02.004
420. Geiger R, Rieckmann JC, Wolf T, Basso C, Feng Y, Fuhrer T, et al. L-arginine modulates T cell metabolism and enhances survival and anti-tumor activity. Cell (2016) 167:829–842.e13. doi: 10.1016/j.cell.2016.09.031
421. Martí i Líndez AA, Dunand-Sauthier I, Conti M, Gobet F, Núñez N, Hannich JT, et al. Mitochondrial arginase-2 is a cell−autonomous regulator of CD8+ T cell function and antitumor efficacy. JCI Insight (2019) 4(24):e132975. doi: 10.1172/jci.insight.132975
422. Bronte V, Zanovello P. Regulation of immune responses by l-arginine metabolism. Nat Rev Immunol (2005) 5:641–54. doi: 10.1038/nri1668
423. Canale FP, Basso C, Antonini G, Perotti M, Li N, Sokolovska A, et al. Metabolic modulation of tumours with engineered bacteria for immunotherapy. Nature (2021) 598:662–6. doi: 10.1038/s41586-021-04003-2
424. Griffin ME, Hang HC. Improving immunotherapy response through the use of designer bacteria. Cancer Cell (2021) 39:1576–7. doi: 10.1016/j.ccell.2021.11.009
425. Van Wilpe S, Koornstra R, Den Brok M, De Groot JW, Blank C, De Vries J, et al. Lactate dehydrogenase: a marker of diminished antitumor immunity. Oncoimmunology (2020) 9:1731942. doi: 10.1080/2162402X.2020.1731942
426. Cascone T, McKenzie JA, Mbofung RM, Punt S, Wang Z, Xu C, et al. Increased tumor glycolysis characterizes immune resistance to adoptive T cell therapy. Cell Metab (2018) 27:977–987.e4. doi: 10.1016/j.cmet.2018.02.024
427. Halford SER, Jones P, Wedge S, Hirschberg S, Katugampola S, Veal G, et al. A first-in-human first-in-class (FIC) trial of the monocarboxylate transporter 1 (MCT1) inhibitor AZD3965 in patients with advanced solid tumours. J Clin Oncol (2017) 35:2516–6. doi: 10.1200/JCO.2017.35.15_suppl.2516
428. Polański R, Hodgkinson CL, Fusi A, Nonaka D, Priest L, Kelly P, et al. Activity of the monocarboxylate transporter 1 inhibitor AZD3965 in small cell lung cancer. Clin Cancer Res (2014) 20:926–37. doi: 10.1158/1078-0432.CCR-13-2270
429. Silva A, Antunes B, Batista A, Pinto-Ribeiro F, Baltazar F, Afonso J. In vivo anticancer activity of AZD3965: a systematic review. Molecules (2021) 27. doi: 10.3390/molecules27010181
430. Morris A. Inhibiting glycolysis in tumour cells. Nat Rev Endocrinol (2018) 14:323. doi: 10.1038/s41574-018-0017-1
431. Tang H, Fu YX. Immune evasion in tumor's own sweet way. Cell Metab (2018) 27:945–6. doi: 10.1016/j.cmet.2018.03.013
432. Gill KS, Fernandes P, O'Donovan TR, McKenna SL, Doddakula KK, Power DG, et al. Glycolysis inhibition as a cancer treatment and its role in an anti-tumour immune response. Biochim Biophys Acta (2016) 1866:87–105. doi: 10.1016/j.bbcan.2016.06.005
433. Mei Y, Zhao L, Jiang M, Yang F, Zhang X, Jia Y, et al. Characterization of glucose metabolism in breast cancer to guide clinical therapy. Front Surg (2022) 9:973410. doi: 10.3389/fsurg.2022.973410
434. Cheng J, Liu Y, Yan J, Zhao L, Zhou Y, Shen X, et al. Fumarate suppresses b-cell activation and function through direct inactivation of LYN. Nat Chem Biol (2022) 18:954–62. doi: 10.1038/s41589-022-01052-0
435. Baryła M, Semeniuk-Wojtaś A, Róg L, Kraj L, Małyszko M, Stec R. Oncometabolites-a link between cancer cells and tumor microenvironment. Biol (Basel) (2022) 11(2):270. doi: 10.3390/biology11020270
436. Wang C, Dong Z, Hao Y, Zhu Y, Ni J, Li Q, et al. Coordination polymer-coated CaCO3 reinforces radiotherapy by reprogramming the immunosuppressive metabolic microenvironment. Advanced Materials (2022) 34:2106520. doi: 10.1002/adma.202106520
437. Wang Y, Gao D, Jin L, Ren X, Ouyang Y, Zhou Y, et al. NADPH selective depletion nanomedicine-mediated radio-immunometabolism regulation for strengthening anti-PDL1 therapy against TNBC. Advanced Sci (2023) 10:2203788. doi: 10.1002/advs.202203788
438. Yang Z, Gao D, Zhao J, Yang G, Guo M, Wang Y, et al. Thermal immuno-nanomedicine in cancer. Nat Rev Clin Oncol (2023) 20:116–34. doi: 10.1038/s41571-022-00717-y
439. Martin JD, Cabral H, Stylianopoulos T, Jain RK. Improving cancer immunotherapy using nanomedicines: progress, opportunities and challenges. Nat Rev Clin Oncol (2020) 17:251–66. doi: 10.1038/s41571-019-0308-z
440. Irvine DJ, Dane EL. Enhancing cancer immunotherapy with nanomedicine. Nat Rev Immunol (2020) 20:321–34. doi: 10.1038/s41577-019-0269-6
441. van Gisbergen MW, Zwilling E, Dubois LJ. Metabolic rewiring in radiation oncology toward improving the therapeutic ratio. Front Oncol (2021) 11. doi: 10.3389/fonc.2021.653621
442. Nian Y, Minami K, Maenesono R, Iske J, Yang J, Azuma H, et al. Changes of T-cell immunity over a lifetime. Transplantation (2019) 103:2227–33. doi: 10.1097/TP.0000000000002786
443. Martin DE, Torrance BL, Haynes L, Bartley JM. Targeting aging: lessons learned from immunometabolism and cellular senescence. Front Immunol (2021) 12. doi: 10.3389/fimmu.2021.714742
444. Kurupati RK, Haut LH, Schmader KE, Ertl HC. Age-related changes in b cell metabolism. Aging (Albany NY) (2019) 11:4367–81. doi: 10.18632/aging.102058
445. Wang H JD, Liu L, Zhang Y, Qin M, Qu Y, Wang L, et al. Spermidine promotes Nb CAR-T mediated cytotoxicity to lymphoma cells through elevating proliferation and memory. Onco Targets Ther (2022) 5:1229–43. doi: 10.2147/OTT.S382540
446. Chon HJ, Lee WS, Yang H, Kong SJ, Lee NK, Moon ES, et al. Tumor microenvironment remodeling by intratumoral oncolytic vaccinia virus enhances the efficacy of immune-checkpoint blockade. Clin Cancer Res (2019) 25:1612–23. doi: 10.1158/1078-0432.CCR-18-1932
447. Zuo S, Wei M, He B, Chen A, Wang S, Kong L, et al. Enhanced antitumor efficacy of a novel oncolytic vaccinia virus encoding a fully monoclonal antibody against T-cell immunoglobulin and ITIM domain (TIGIT). EBioMedicine (2021) 64:103240. doi: 10.1016/j.ebiom.2021.103240
448. Ribas A, Dummer R, Puzanov I, VanderWalde A, Andtbacka RHI, Michielin O, et al. Oncolytic virotherapy promotes intratumoral T cell infiltration and improves anti-PD-1 immunotherapy. Cell (2017) 170:1109–1119.e10. doi: 10.1016/j.cell.2017.08.027
Keywords: cancer, immunity, inflammation, immunometabolism, immunometabolic reprogramming, TME, TIME
Citation: Kumar V and Stewart JH IV (2023) Immunometabolic reprogramming, another cancer hallmark. Front. Immunol. 14:1125874. doi: 10.3389/fimmu.2023.1125874
Received: 16 December 2022; Accepted: 02 May 2023;
Published: 19 May 2023.
Edited by:
Soumya R. Mohapatra, KIIT University, IndiaReviewed by:
Vadim V. Sumbayev, University of Kent, United KingdomZhe Yang, Xi’an Jiaotong University, China
Copyright © 2023 Kumar and Stewart. This is an open-access article distributed under the terms of the Creative Commons Attribution License (CC BY). The use, distribution or reproduction in other forums is permitted, provided the original author(s) and the copyright owner(s) are credited and that the original publication in this journal is cited, in accordance with accepted academic practice. No use, distribution or reproduction is permitted which does not comply with these terms.
*Correspondence: John H. Stewart IV, anN0ZTE3QGxzdWhzYy5lZHU=; Vijay Kumar, dmt1bWEyQGxzdWhzYy5lZHU=; dmlqX3RveEB5YWhvby5jb20=
†ORCID: Vijay Kumar, orcid.org/0000-0001-9741-3597