 Erin C. Williams1
 Alexander Kizhner2
 Valerie S. Stark1Aria Nawab1Daniel D. Muniz1Felipe Echeverri Tribin3Juan Manuel Carreño4
 Dominika Bielak4
 Gagandeep Singh4
 Michael E. Hoffer1,5
 Florian Krammer3,6
 Suresh Pallikkuth2
 Savita Pahwa2*
- 1Department of Otolaryngology, University of Miami Miller School of Medicine, Miami, FL, United States
- 2Department of Microbiology and Immunology, University of Miami Miller School of Medicine, Miami, FL, United States
- 3Department of Biomedical Engineering, University of Miami, Miami, FL, United States
- 4Department of Microbiology, Icahn School of Medicine at Mount Sinai, New York, NY, United States
- 5Department of Neurological Surgery, University of Miami, Miller School of Medicine, Miami, FL, United States
- 6Department of Pathology, Molecular and Cell-based Medicine, Icahn School of Medicine at Mount Sinai, New York, NY, United States
Introduction: The influence of pre-existing humoral immunity, inter-individual demographic factors, and vaccine-associated reactogenicity on immunogenicity following COVID vaccination remains poorly understood.
Methods: Ten-fold cross-validated least absolute shrinkage and selection operator (LASSO) and linear mixed effects models were used to evaluate symptoms experienced by COVID+ participants during natural infection and following SARS-CoV-2 mRNA vaccination along with demographics as predictors for antibody (AB) responses to recombinant spike protein in a longitudinal cohort study.
Results: In previously infected individuals (n=33), AB were more durable and robust following primary vaccination when compared to natural infection alone. Higher AB were associated with experiencing dyspnea during natural infection, as was the total number of symptoms reported during the COVID-19 disease course. Both local and systemic symptoms following 1st and 2nd dose (n=49 and 48, respectively) of SARS-CoV-2 mRNA vaccines were predictive of higher AB after vaccination. Lastly, there was a significant temporal relationship between AB and days since infection or vaccination, suggesting that vaccination in COVID+ individuals is associated with a more robust immune response.
Discussion: Experiencing systemic and local symptoms post-vaccine was suggestive of higher AB, which may confer greater protection.
1 Introduction
The heterogeneous presentation of SARS-CoV-2 infection is associated with inter-individual factors (1, 2) including age, biological sex, comorbidities, susceptibility to the virus, exposure load, viral shedding, pre-existing binding or neutralizing antibodies (3, 4), and pre-existing cross-reactive T cells (5–7). Variability in these factors and their distinct contributions to the individual immune response has made it difficult to generalize the disease course in SARS-CoV-2-infected individuals (1, 8). Immunoassays (i.e., virus-specific serologic assays) have been used extensively throughout the COVID-19 pandemic (9). Primarily used to characterize the immune response following vaccination, assessing viability for convalescent plasma donation, and acting as a population surveillance tool (10, 11), the most pressing work remains developing correlates for protection. Neutralizing and binding titers remain well supported as protective markers (3, 12) regardless of natural infection or vaccination, including a recent study (13) which associated increased binding and neutralizing antibodies with an inverse risk for SARS-CoV-2 infection following mRNA-1273 (Moderna) vaccination.
Previous studies have evaluated change in peak post-vaccination antibody titers as a function of time (14) and the relationship between lower quantitative antibodies and disease severity (15). Additionally, evidence suggests that higher antibody titers in vaccinated, previously coronavirus disease 2019 positive (COVID+) individuals are associated with an increased degree of immune protection (16–18). Studies have also shown that vaccination with mRNA vaccines results in rapid, robust antibody production and associated reactogenicity after the first vaccine dose (19, 20) as well as following heterologous booster doses (21). Here, we investigated relationships between sociodemographic factors, reactogenicity, and immunogenicity following SARS-CoV-2 mRNA vaccination among previously SARS-CoV-2 infected (COVID+) individuals participating in our longitudinal cohort study (COVID-19 ImmuniTY study, or “CITY”). This analysis may help elucidate how underlying immunologic determinants, pre-existing immunity, and vaccine reactogenicity are associated with post-vaccination antibody titers (i.e., humoral immunogenicity) in an ethnically diverse cohort. Conclusions drawn from this study may contribute to a more personalized public health approach to future COVID-19 vaccine strategies, which could account for an individual’s demographics (e.g., age, gender, or race) or existing immunity prior to vaccination or booster receipt (22).
2 Methods
2.1 Study design and participants
2.1.1 “CITY” cohort
Participants were enrolled in our Institutional Review Board (IRB) approved (#20201026), longitudinal, observational SARS-CoV-2 immunity study (n=228) known as “CITY” (COVID-19 ImmuniTY study). The study began in October 2020 at the University of Miami Miller School of Medicine, and study subjects participated in visits every 3 months for a total of 2 years from the time of enrollment. The primary objective of the CITY study is to characterize differential antibody kinetics among SARS-CoV-2 uninfected and infected individuals in a high-risk, ethnically diverse cohort. The “high-risk” designation for inclusion referred to hazardous occupational exposure (e.g., healthcare workers) but also to advanced age or other sociodemographic characteristics known to increase risk of SARS-CoV-2 morbidity and mortality. Following written informed consent, participants provided demographic details to include lifestyle habits and relevant past medical history that would preclude them to more severe SARS-CoV-2 infection-related outcomes. Those who suffered from SARS-CoV-2 infection with a documented positive nucleic acid amplification test (NAAT+) prior to entry provided evidence details regarding their past COVID-19 infection symptoms during the baseline visit to the study team.
At all regularly scheduled visits, participants prospectively answered symptom questionnaires to screen for new or recent SARS-CoV-2 infection, and blood samples were collected for serum and peripheral blood mononuclear cell (PBMC) processing. Plasma was stored at -80°C and PBMCs were cryopreserved in liquid N2 (23). All participants agreed to sample banking for future research use. Those who received vaccines were asked to return for two optional, additional visits at 1 week and 1 month following vaccine receipt, where they answered binary “Yes/No” questions in a survey about their symptoms following vaccination. Vaccine-related symptoms were rated on a Likert scale, where a “0” indicated no symptoms and a “10” indicated the highest symptom severity. Blood samples were collected and processed as described above.
2.1.2 CITY sub-cohort analysis (COVID+ unvaccinated and COVID+ vaccinated participants)
For this study, we included three groups, comprising of CITY participants enrolled between October 2020 – June 2021 with a history of COVID-19 prior to vaccination (i.e., natural infection (NI)), COVID-19+ participants who received Dose 1 (NI + dose 1 (D1)) of an mRNA vaccine, and fully vaccinated COVID-19+ participants who received Dose 1 and Dose 2 (NI + dose 2 (D2); deemed “fully vaccinated”) of an mRNA vaccine. Pfizer (BNT162b2) and Moderna (mRNA-1273) were the primary options available (9) during the enrollment period; thus, participants who only received one dose or received Johnson & Johnson (n=4 across the entire cohort) were excluded from this analysis. Additionally, participants who were administered their second dose of an mRNA vaccine >7 days after or <4 days before the recommended (24) number of days after the first dose (21 days for Pfizer; 28 days for Moderna) were excluded as well in order to account for the temporal, transient nature of post-vaccine reactogenicity and the subsequent immune response to best reflect the general population. Individuals with suspected (>2-fold increase in Ab) or confirmed (with a NAAT+ test) reinfection or breakthrough infection were also excluded. Individuals infected with SARS-CoV-2 after June 2021 were also excluded in order to control for changes in variant-specific antigenic profiles and related changes in disease presentation (i.e., the Delta VOC). Further, limited symptomatic primary infections occurred after this June 2021 as most individuals were vaccinated during this period.
In total, 32 participants overlap between the naturally infected, pre-vaccine (NI) and post-vaccination (NI + D1; NI + D2) groups. Among those who met criteria for inclusion in the sub-analysis, all samples provided during the baseline visit and thereafter were included. Of note, participants were considered “fully vaccinated” 14 days after they received Dose 2.
2.2 Enzyme-linked immunosorbent assay
SARS-CoV-2 ELISAs were performed using a well-described assay developed by the Icahn School of Medicine at Mount Sinai (10, 11). Discrete titers were reported in values of 1:100, 1:200, 1:400, 1:800, 1:1600, 1:3200, 1:6400, 1:12800, 1:25600, 1:51200, 1:102400, and 1:204800. The limit of detection was set at 1:100.
2.3 Statistical analysis
SARS-CoV-2 antibody titers were log2-transformed before all statistical analyses. To model the bi-phasic change in antibodies over time, we utilized a generalized additive model (GAM) incorporating the rate of both antibody decay following natural infection (following COVID+ participants’ last positive SARS-CoV-2 test [LPT] result) and full vaccination (≥14 days after the second mRNA vaccine dose) [24]. The GAM modelled antibody titers with a smoothed function for number of days elapsed using a cubic regression with 3 knots as well as the fixed effect of vaccination status (NI and NI + D2). We then replicated the above as a linear mixed-effects model (LMM), where we incorporated the same fixed effects but included participants as a random-intercepts effect to control for individual differences. The rates of log-transformed antibody titer decay along with the limit of detection of our assay were used to estimate the number of days that the antibodies remain detectable after both natural infection and full vaccination.
Ten-fold cross-validated least absolute shrinkage and selection operator (LASSO) models were employed as a feature-selection and regularization technique. LASSO models were tuned to select the simplest model within one standard error of the lowest value root-mean-square error accuracy metric that included at least two predictors (Supplementary Table 1). Four models with identical demographic variables were constructed while controlling for time or days since LPT, 1st dose, or 2nd dose, respectively, including: 1) the effect of infection symptoms on the antibody response post-infection, 2) the effect of infection symptoms on the antibody response post full vaccination, 3) the effect of dose 1 vaccine symptoms on the antibody response post full vaccination, and 4) the effect of dose 2 vaccine symptoms on the antibody response post full vaccination. The selected predictors from each of the best-fitting cross-validated LASSO models were then included as fixed effects in follow-up LMMs with by-participant random intercepts, allowing us to control for individual differences. For significant categorical fixed effects from the LMMs, we conducted post-hoc Tukey tests to confirm directionality and to correct for multiple comparisons.
Additional linear regressions were used to investigate effects of each symptom following natural infection alone (NI), natural infection and the 1st dose of SARS-CoV-2 mRNA vaccination (NI + D1), and natural infection and the 2nd dose of vaccination (NI + D2) and explore possible relationships between demographics factors on peak antibody titer levels following full vaccination. Analyses were performed using R statistical software Version 4.1.1 (25). Generalized additive modeling, cross-validation, LASSO modelling, LMM, and post-hoc Tukey tests were conducted with the R packages mgcv (26), caret (27), glmnet (28), nlme (29), and glht (30), respectively, while the linear modelling, Mann-Whitney U tests, and Kruskal-Wallace tests were performed using the R package stats (25). Plots were produced using the ggplot2 (31).
3 Results
3.1 Characteristics of the study population
Demographic characteristics are detailed in Table 1. Thirty-three participants with a history of COVID-19 were included in our post infection cohort (NI [natural infection alone]). Following natural infection (prior to mRNA vaccine receipt), the median number of days since last PCR-positive SARS-CoV-2 test to the baseline study visit was 101 days. For the post dose 1 (NI + D1 [natural infection and primary vaccine dose 1]) and post dose 2 (NI + D2 [natural infection and primary vaccine dose 2]) analysis, we included 49 and 48 participants, respectively. Median days from LPT to Dose 1 and Dose 2 were 99 and 127 days, respectively. No participants were known to be immunocompromised. All infections were deemed to be mild, with none requiring hospitalization.
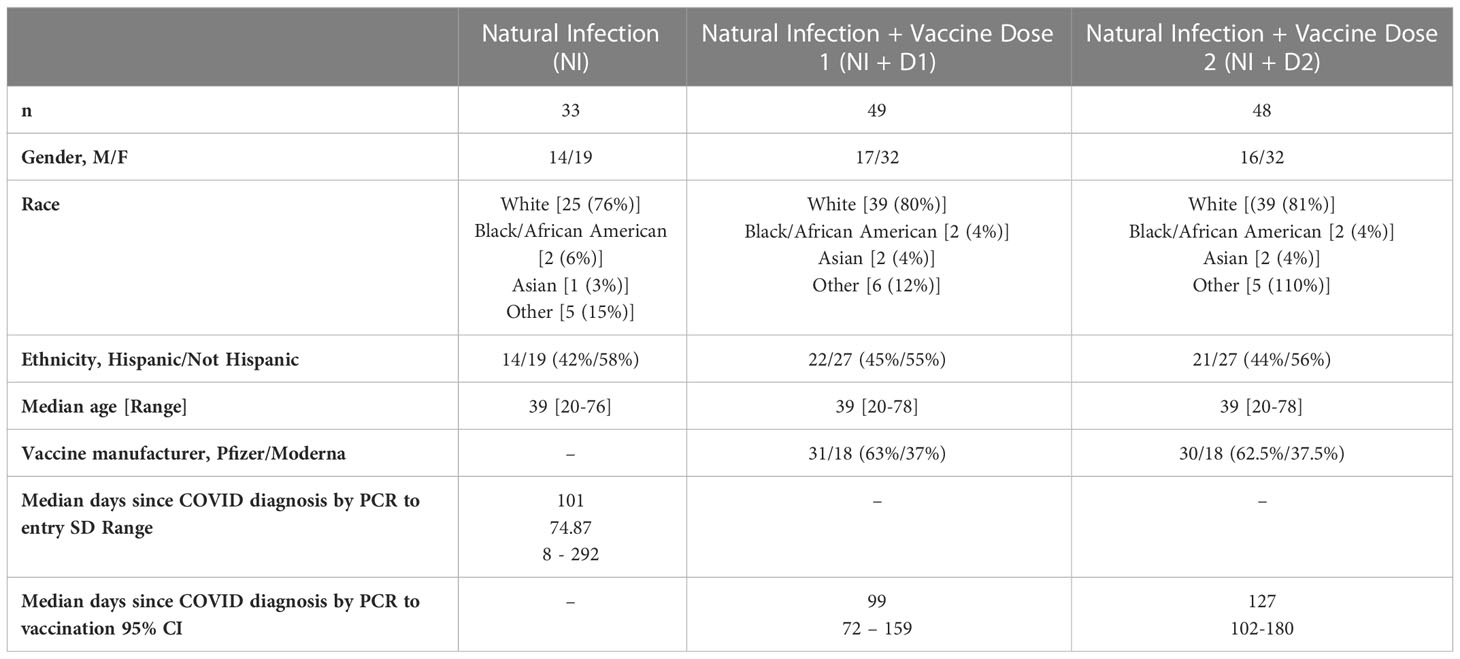
Table 1 Characteristics of the study population following natural infection, 1st dose of vaccine, and 2nd dose of vaccine.
3.2 Symptoms reported following infection and vaccination
The highest reported symptom during the vaccine-naïve COVID-19 course was fatigue (63%) (Table 2). Other highly reported symptoms included anosmia (55%), congestion (53%), and myalgias/muscle aches (57%). Following dose 1, the most common symptoms were injection site pain (51%), headache (29%), and fatigue (29%). Similarly, the most common symptoms reported following the second mRNA vaccination (dose 2) were injection site pain (53%), fatigue (39%), and myalgias (29%) (Table 2).
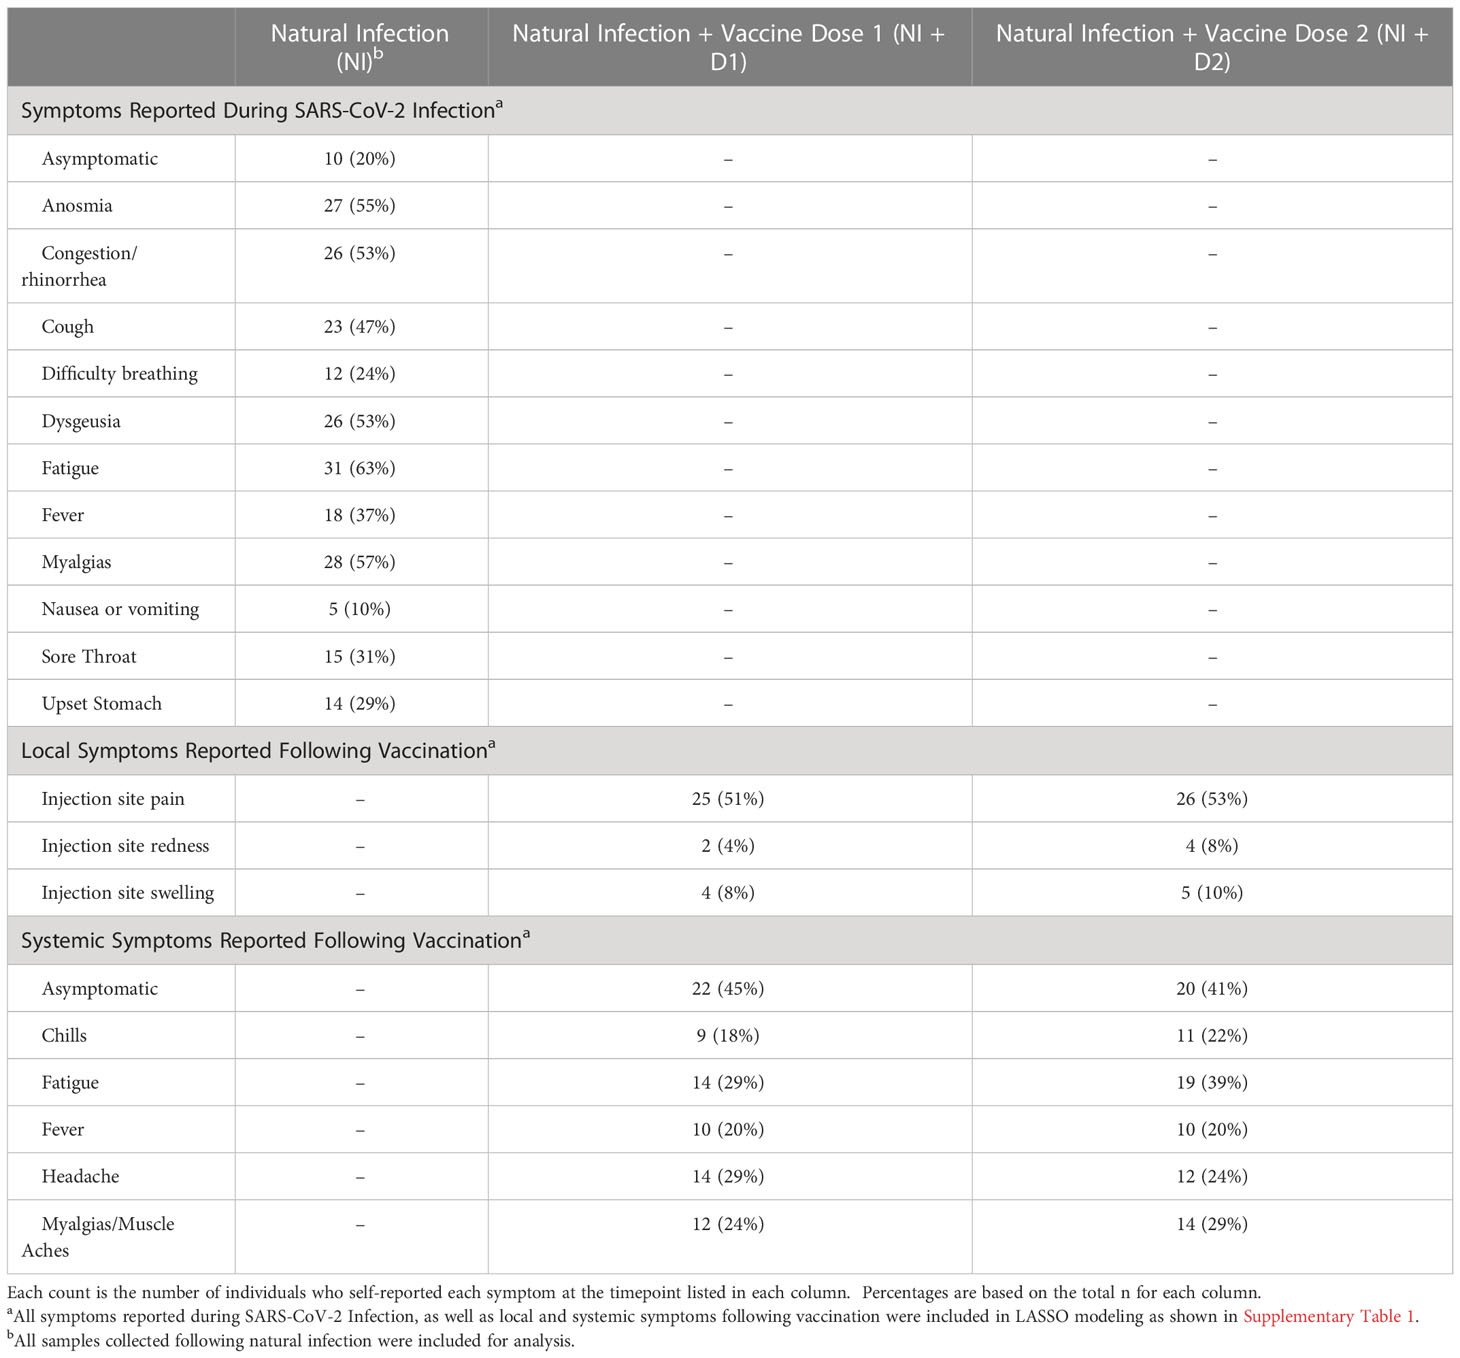
Table 2 Symptoms experienced by the study cohort following natural infection, 1st dose of vaccine, and 2nd dose of vaccine.
3.3 In previously infected individuals, antibody titers are more robust following full-vaccination as compared to post natural infection
There was a more robust antibody response immediately following full vaccination (Figure 1C) when compared to the antibody response following natural infection (estimate = 4.117, t = 12.950, p = < 0.001) (Figure 1B), where peak log2 antibody titers were greater in the vaccination with prior infection (14.517) than in natural infection (9.217). This is illustrated in Figure 1A, where natural infection and post-full vaccination titers were included in a bi-phasic model to show longitudinal antibody responses. Infected individuals had a slower rate of antibody titer decay (-0.010 vs -0.015 log per day), though this effect was small (estimate = -0.005, t = 2.351, p = 0.020).
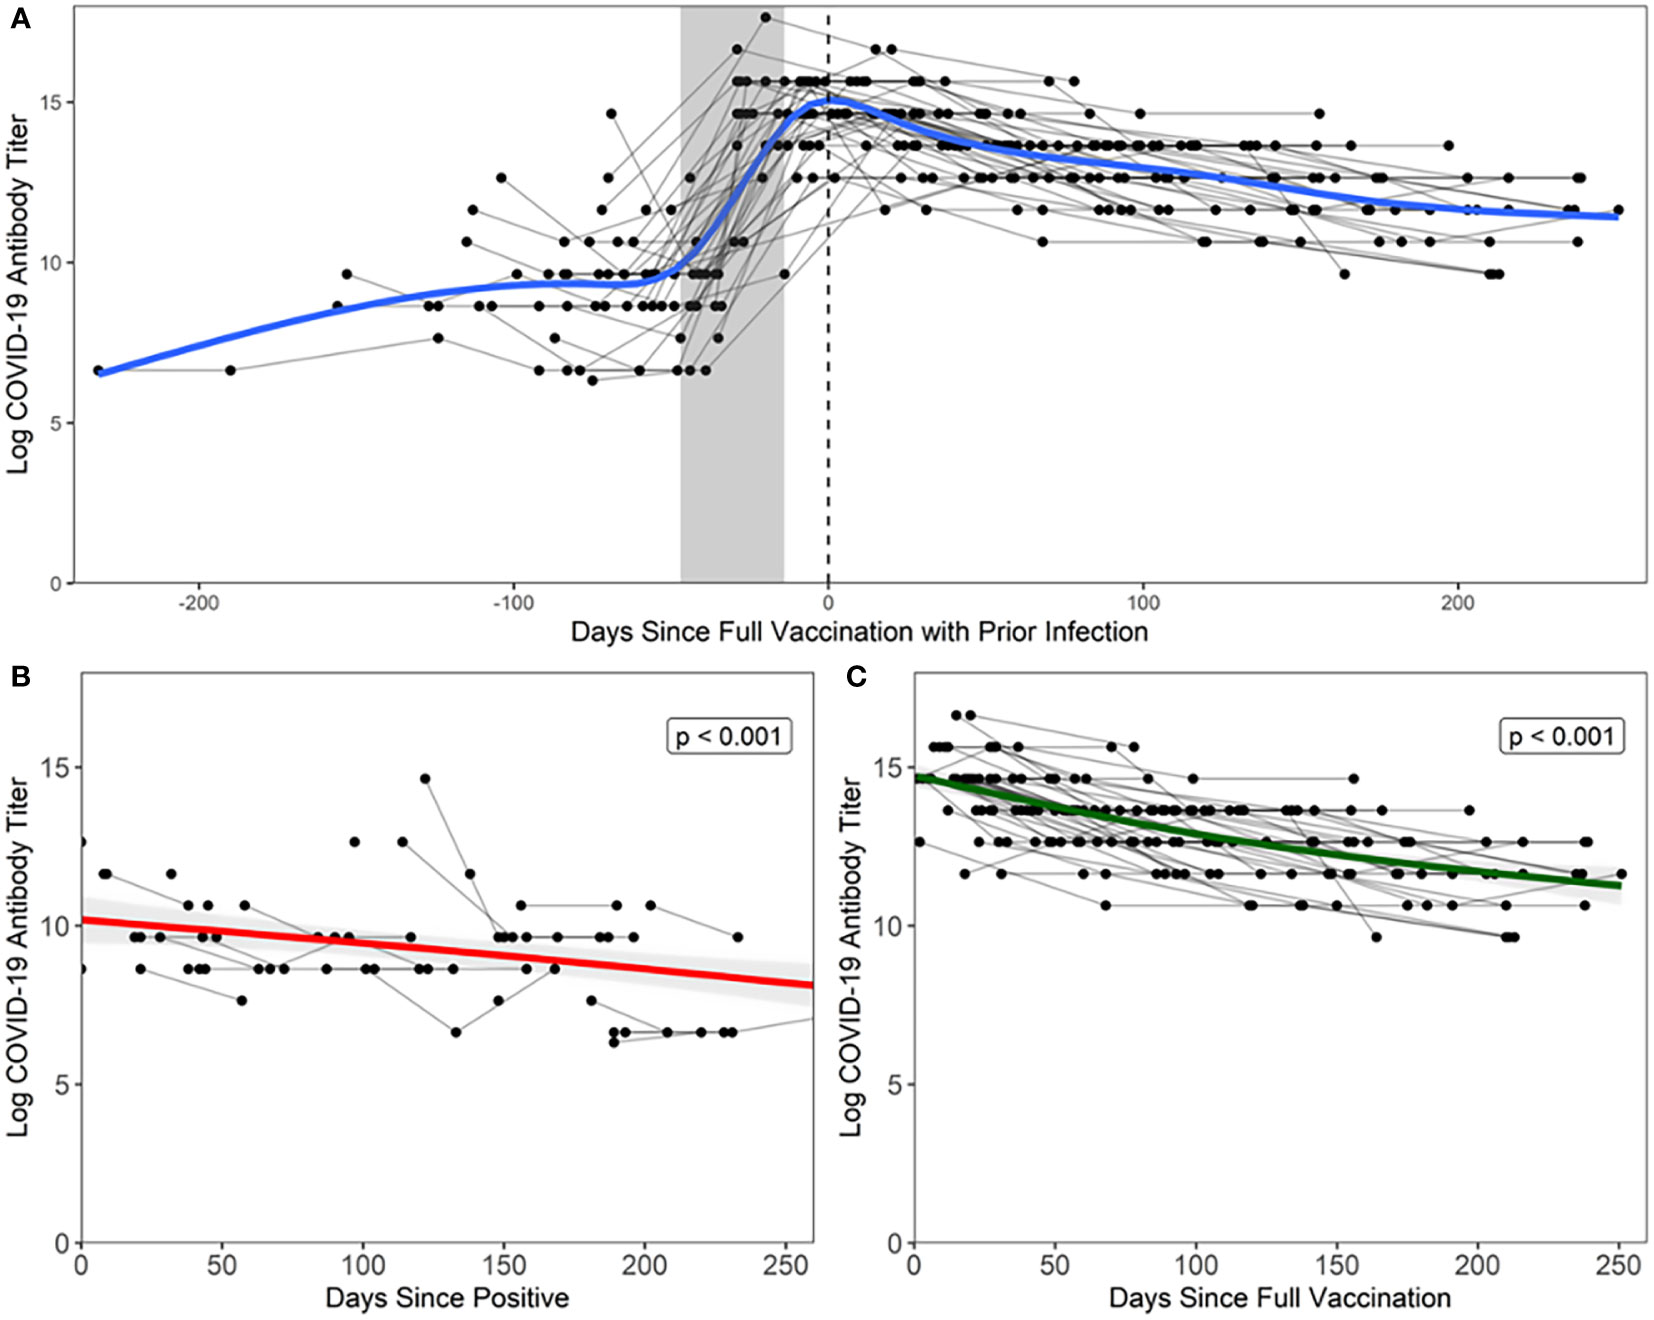
Figure 1 Antibody response following natural infection and vaccination Each black point represents a sample from a participant, grey lines connect points from the same participant, and the grey shaded area represents the maximum number of days between doses relative to date of full vaccination (14 days after second dose, regardless of vaccine manufacturer). (A) Days since full vaccination vs. log titers over time. t=0 on the x-axis represents the day when COVID+ participants became fully vaccinated (2 weeks after second vaccination). Bi-phasic, generalized additive model (GAM) is visualized by a blue line. (B) In unvaccinated COVID+ participants, log2 antibody titers decay at a rate of -0.010 per day after last positive COVID-19 test result. Fitted linear model is visualized by a red line. Note that three points were excluded from the above figure due to the temporal scale used to graphically depict the data but are included in the analyses herein. (C) In vaccinated COVID+ participants, log2 antibody titers decay at a rate of -0.015 per day after full vaccination. Fitted linear model is visualized by a green line.
LMMs confirmed our findings that antibody titer declined faster following full vaccination than in natural infection (estimate = -0.006, F =11.238, p <0.001). Of note, the combination of natural infection followed by vaccination, or so-called “hybrid immunity”, elicits a more durable antibody response than natural infection alone (estimate = 4.138, F = 794.623, p < 0.0001), as log2 antibody titers were predicted to remain detectable for a longer period of time following natural infection and full vaccination (550 days) than natural infection alone (464 days).
3.4 Days elapsed and symptoms reported during infection influence antibody titers
As shown in Table 3, difficulty breathing during infection (estimate = 1.590, F = 5.684, p = 0.024) and days elapsed since LPT (estimate = -0.006, F = 9.912, p = .004) were significant main effects in predicting antibody titers following natural infection. Post-hoc testing confirmed that antibody titers were elevated in individuals who experienced difficulty breathing (z = 2.612; p = 0.009).
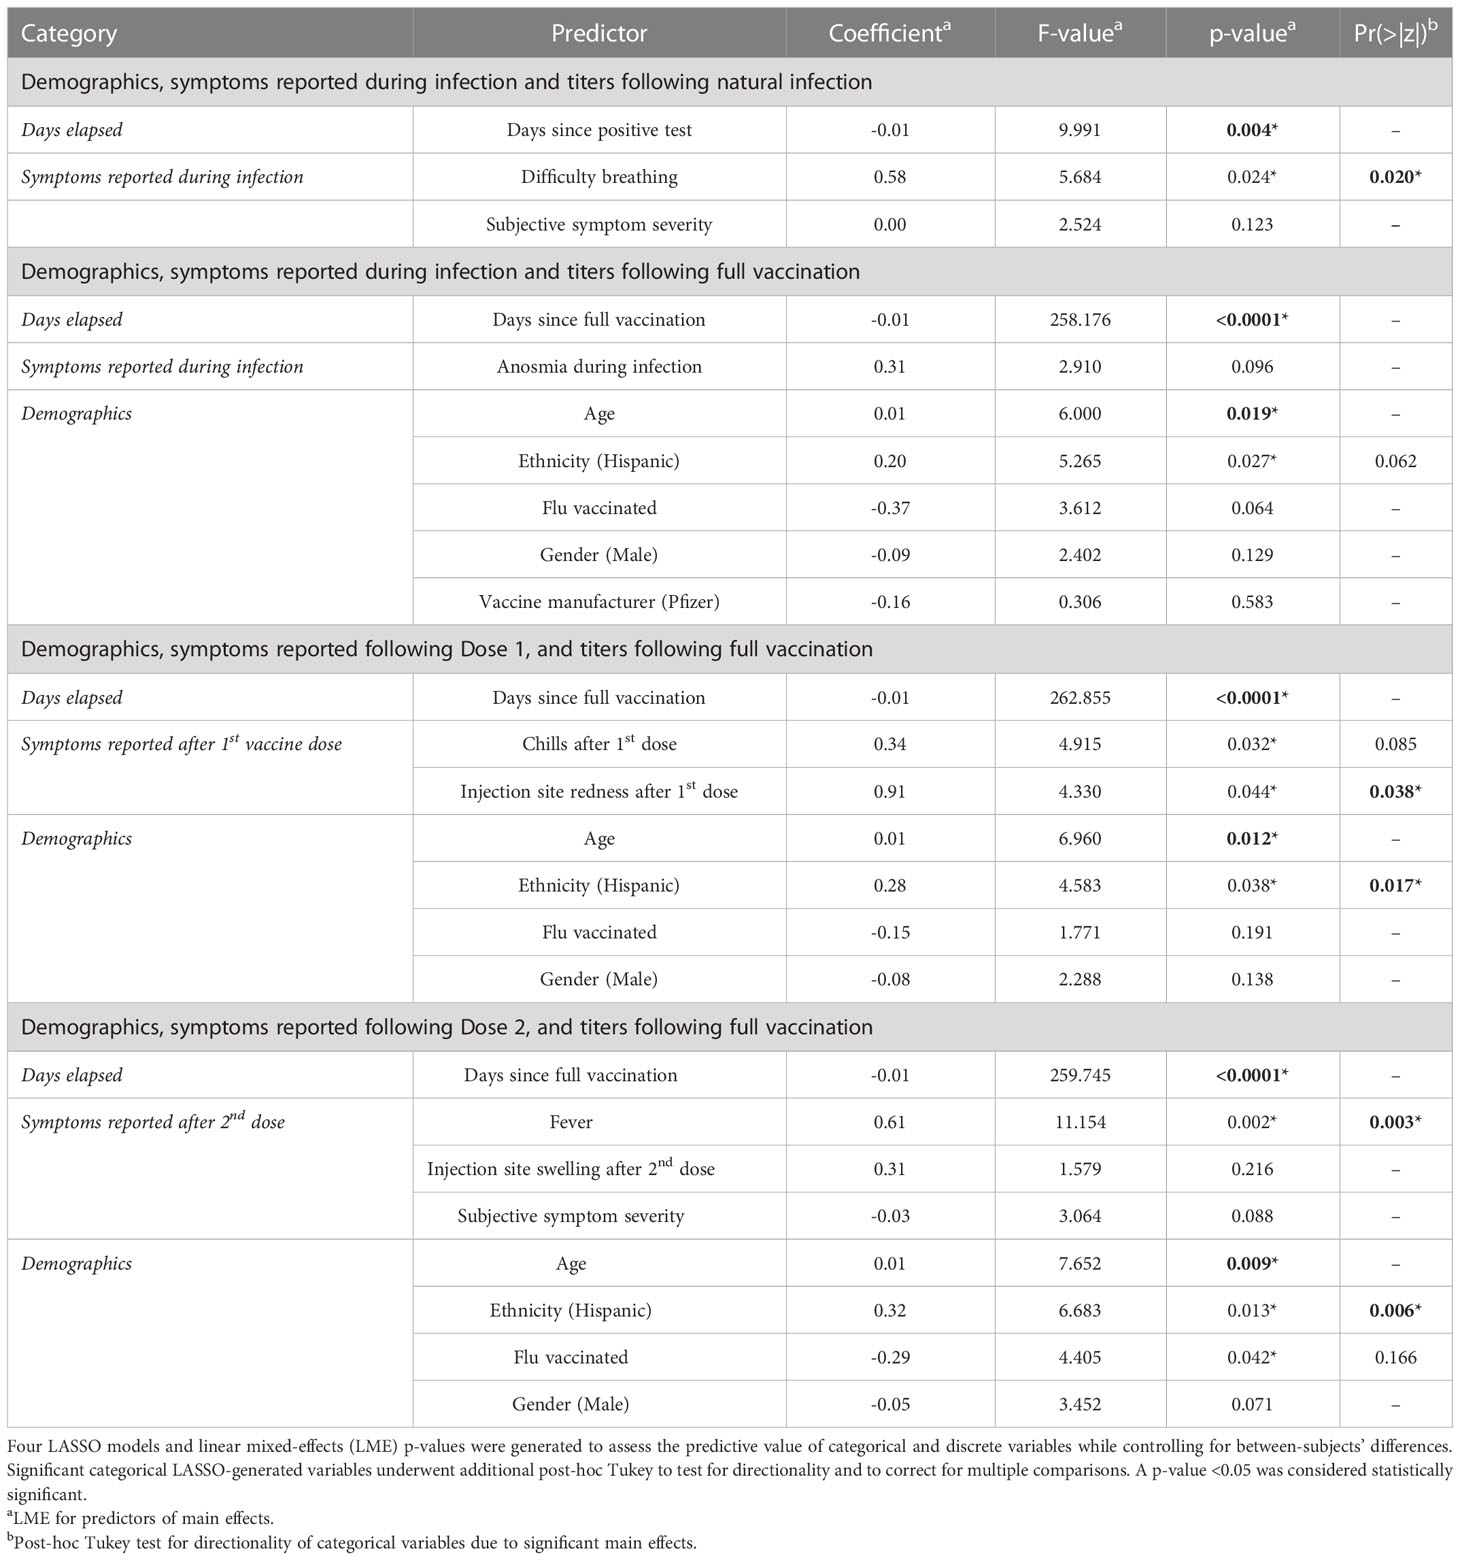
Table 3 Symptoms and demographic factors influence antibody responses following natural infection and full vaccination.
When modeling demographics and symptoms at infection to predict the antibody response after full vaccination, we found that days elapsed since full vaccination (estimate = -0.014; F = 258.176; p < 0.0001), increased age (estimate = 0.018; F = 6.000; p = 0.019), and ethnicity (Hispanic) (estimate = 0.456; F = 5.265; p = 0.018) were significant main effects, though no categorical variables were significant after post-hoc testing.
3.5 Symptoms following vaccination are predictive of higher antibody titers after full vaccination
Local and systemic symptoms following the 1st dose of SARS-CoV-2 mRNA vaccines were predictive of higher antibody titers after full vaccination. As seen in Table 3, the results of the LMM show that days elapsed since full vaccination (estimate = -0.014, F = 262.855, p < 0.0001), chills (estimate = 0.541; F = 4.915; p = 0.032), injection site redness (estimate = 1.243; F = 4.330; p = 0.044), age (estimate = 0.021; F = 6.960; p = 0.012), and ethnicity (estimate = 0.562, F = 4.583, p = 0.038) were significant. Following post-hoc Tukey testing on the significant categorical main effects, we found that injection site redness (z = 2.081, p = 0.038) and ethnicity (Hispanic) (z = 2.382, p = 0.017) were significant, while the main effect of chills was not.
We also examined demographics and symptoms reported during the 2nd dose of SARS-CoV-2 mRNA vaccination and their effect on the antibody response after full vaccination. Days since full vaccination (estimate = -0.014; F = 259.745; p < 0.0001), age (estimate = 0.023; F = 7.652; p = 0.009), identifying as Hispanic (estimate = 0.609; F = 6.683; p = 0.013), fever (estimate = 0.839; F = 11.154, p = 0.002), and influenza vaccination (estimate = -0.475; F = 4.405; p = 0.042) were observed to be significant. Fever and ethnicity (Hispanic) were found to be statistically significant (z = 3.016, p = 0.003; z = 2.735, p = 0.006, respectively) following post-hoc testing, though influenza vaccination was not.
3.6 The number of symptoms observed during infection are associated with higher peak antibody titers post full-vaccination
The number of symptoms self-reported during infection significantly predicted peak antibody titers after full vaccination (estimate = 0.10, t = 2.10, Pearson’s r = 0.296; p = .041). Additional linear models were conducted for the number of symptoms reported as a function of demographics, where we found that the number of symptoms self-reported during infection was significantly influenced by self-identifying as White (estimate = 4.679, t = 2.153, p = 0.037). No other demographic factors was significant.
4 Discussion
The goal of this study was to investigate the role of demographics, pre-existing immunity, and symptomatology following infection and vaccination to ascertain whether they independently or collectively are associated with immunogenicity following mRNA vaccination against SARS-CoV-2 infection in individuals previously infected with SARS-CoV-2. Our results demonstrate higher durability and robustness of antibody titers despite a faster rate of antibody decay following vaccination, which supports previously reported findings (32) for SARS-CoV-2 mRNA vaccines. Unsurprisingly, our results also demonstrate that a larger temporal gap between an individual’s LPT and antigen testing predicts decline of antibody titers over time. We also found that in previously infected individuals, SARS-CoV-2 mRNA vaccines result in a more robust antibody response than that following infection alone.
Following infection alone, the number of symptoms reported and difficulty breathing during the COVID-19 course were predictive of higher antibody titers. This result supports existing evidence (33, 34) that individuals who report a more severe or symptomatic SARS-CoV-2 infection have higher peak titers than asymptomatic individuals. After receiving dose 1, injection site redness was found to be significantly predictive for higher antibody titers following full vaccination. Interestingly, after dose 2 we found that fever was significantly predictive for higher antibody titers following full vaccination. It should be noted that asymptomatic individuals mounted robust immune responses as well.
In previously infected individuals, SARS-CoV-2 mRNA vaccines result in a more robust antibody response than that following infection alone. Indeed, in individuals with “hybrid immunity”, antibody titers following full vaccination peak at 4-fold higher than those following naturally acquired immunity and appear to persist at detectable levels for >500 days following vaccination. One explanation for this increased response could be the presence of pre-existing memory T and B cell responses developed during natural infection. These cells might enhance a secondary immune response following vaccination similar to that of a booster immunization. In addition to bolstering the current CDC recommendations (35) that individuals previously infected with SARS-CoV-2 receive vaccination, our results provide additional, longitudinal support for this measure.
Intrinsic factors, such as age and gender are thought to influence immunogenicity (36). Though our data support higher peak antibody titers following infection and vaccination with increasing age (33, 37) it should be noted that the median age across all groups included in this analysis was 39 years with no participant above 80 years of age and therefore should not be interpreted as a superior post-infection or post-vaccine antibody responses in the elderly. We expect that old age will be associated with poorer vaccine responses as has been described previously (38) but this was not evaluated here. Notably, our study was conducted in Miami-Dade County, an international, multi-cultural hub with a largely Hispanic and bilingual population. Our analysis demonstrated a significant relationship between Hispanic ethnicity and higher antibody titers over time at nearly every time point of interest, including infection where the analysis approached significance (p = 0.0624). Other groups have demonstrated higher rates of Hispanic SARS-CoV-2 seroconversion when compared to other ethnicities (39, 40) and have found that Hispanic ethnicity is linked to higher rates of seroprotection and seroconversion following H1N1 monovalent vaccination (41, 42), but future studies with a large number of participants are needed to support a generalizable trend for antibody magnitude over time in this population. Related, we also found that influenza vaccination was associated with higher antibody titers, though it was not significant following post-hoc testing. Though the biological relevance of this finding is unknown, we previously showed that specific CD4 responses to influenza A(H1N1) correlate with SARS-CoV-2 specific CD4 T-cells, suggesting a protective effect of pre-existing influenza specific T-cells (7). We speculate that this provides evidence of healthy and “trained” immune systems within our cohort, wherein epigenetic and metabolic reprogramming have augmented innate immune cells that enhance adaptive immunity to increase SARS-CoV-2 specific responses (7, 43).
Our study has several limitations, namely that sample sizes for each cohort examined were small due to variability in vaccination timelines and participant scheduling. Some individuals were excluded due to a confounding effect on our predictive modeling, which is controlled for by the fixed effect of time relative to desired endpoints (i.e.: infection and vaccination). The natural infection group was further limited by the study timeline, as the first SARS-CoV-2 vaccination became available shortly after enrollment began and therefore limited the number of naturally infected individuals, we were able to follow longitudinally. Additionally, our analysis only included quantitative binding antibody titers. Though recent work has demonstrated that higher binding antibodies correlate to higher neutralizing antibodies (13), expansive, multi-center longitudinal studies profiling the cellular and humoral response are needed. Comprehensive future work would benefit from characterizing immunogenetic determinants for SARS-CoV-2 vaccine effectiveness (44, 45) via a so-called “Adversomics” approach (46) and should include profiling of quantitative binding antibodies, neutralizing and non-neutralizing antibodies, memory B-cells, and T-cell responses, as immune protection appears to be contingent on all three tiers of the immune response (47, 48).
Finally, some of the predictors used in our statistical analysis were found to be significant in one test but not in post-hoc tests. Large, longitudinal studies are required to confirm a significant group difference, but the predictors utilized herein should be included in future analyses. Our bivariate analysis of symptoms experienced following the 1st and 2nd doses failed to demonstrate that individual symptoms can influence peak antibody titers following full vaccination. The same was true for race and ethnicity, which were not found to be significantly predictive for peak titers, though we contend that this is because these models failed to control for individual differences, or intercepts, to account for between-subjects’ variability.
In conclusion, this study demonstrates that a combination of systemic and local symptoms is predictive of higher antibody titers, which may correlate to a higher degree of protection. Additional studies are needed to understand the role of immunologic determinants (including underlying genetic polymorphisms that influence immune cell activation/differentiation, etc.) for protection against SARS-CoV-2 infection and breakthrough infection in the age of boosters and variants capable of immune escape, as symptom profiles seem to be variant-specific (49, 50). Repeating this type of analysis at the population level along with fully characterized adaptive cellular responses will be critical in providing personalized recommendations for future vaccine measures, including recommendations for optimal booster timing.
Data availability statement
The raw data supporting the conclusions of this article will be made available by the authors, without undue reservation.
Ethics statement
The studies involving human participants were reviewed and approved by University of Miami Institutional Review Board. The patients/participants provided their written informed consent to participate in this study.
Author contributions
SaP conceived the Miami cohort study and EW, AK, SuP contributed to conception and design of the manuscript. VS, FT, DM organized the database. AK performed the statistical analysis and generated data visualizations. EW, VS, AN, DM wrote sections of the manuscript. EW, AN, DM, FT, JMC, DB, and GS provided technical assistance or collected data for this manuscript. MH, FK, JMC, SaP, and SuP provided oversight of the study and edited the manuscript. All authors contributed to manuscript revision, read, and approved the submitted version.
Funding
This work is part of the PARIS /SPARTA studies funded by the NIAID Collaborative Influenza Vaccine Innovation Centers (CIVIC) contract 75N93019C00051 (PI F Krammer) with SaP as PI of the University of Miami site and by R01DA051202S1 to SaP.
Acknowledgments
We express our sincerest gratitude to our intellectually curious and willing study participants for donating their blood and time to this study. We also thank the core research team that have made this study logistically possible, including Margaret Roach, Elizabeth Varghese, Celeste Sanchez, Ailet Reyes, and the entire team of phlebotomists at the University of Miami’s Clinical Translational Research Site. This work has been previously published (51) on the pre-print server, medRxiv.
Conflict of interest
The Icahn School of Medicine at Mount Sinai has filed patent applications relating to SARS-CoV-2 serological assays U.S. Provisional Application Numbers: 62/994,252, 63/018,457, 63/020,503 and 63/024,436 and NDV-based SARS-CoV-2 vaccines U.S. Provisional Application Number: 63/251,020 which list Florian Krammer as co-inventor. Patent applications were submitted by the Icahn School of Medicine at Mount Sinai. Mount Sinai has spun out a company, Kantaro, to market serological tests for SARS-CoV-2. FK has consulted for Merck and Pfizer before 2020, and is currently consulting for Pfizer, Third Rock Ventures, Seqirus and Avimex. The Krammer laboratory is also collaborating with Pfizer on animal models of SARS-CoV-2.
The remaining authors declare that the research was conducted in the absence of any commercial or financial relationships that could be construed as a potential conflict of interest.
Publisher’s note
All claims expressed in this article are solely those of the authors and do not necessarily represent those of their affiliated organizations, or those of the publisher, the editors and the reviewers. Any product that may be evaluated in this article, or claim that may be made by its manufacturer, is not guaranteed or endorsed by the publisher.
Supplementary material
The Supplementary Material for this article can be found online at: https://www.frontiersin.org/articles/10.3389/fimmu.2023.971277/full#supplementary-material
References
1. Rodebaugh TL, Frumkin MR, Reiersen AM, Lenze EJ, Avidan MS, Miller JP, et al. Acute symptoms of mild to moderate COVID-19 are highly heterogeneous across individuals and over time. Open Forum Infect Dis (2021) 8(3):ofab090. doi: 10.1093/ofid/ofab090
2. Zimmermann P, Curtis N. Factors that influence the immune response to vaccination. Clin Microbiol Rev (2019) 32(2):e00084–18. doi: 10.1128/CMR.00084-18
3. Khoury DS, Cromer D, Reynaldi A, Schlub TE, Wheatley AK, Juno JA, et al. Neutralizing antibody levels are highly predictive of immune protection from symptomatic SARS-CoV-2 infection. Nat Med (2021) 27(7):1205–11. doi: 10.1038/s41591-021-01377-8
4. Garcia-Beltran WF, Lam EC, Astudillo MG, Yang D, Miller TE, Feldman J, et al. COVID-19-neutralizing antibodies predict disease severity and survival. Cell (2021) 184(2):476–88.e11. doi: 10.1016/j.cell.2020.12.015
5. da Silva Antunes R, Pallikkuth S, Williams E, Dawen Yu E, Mateus J, Quiambao L, et al. Differential T-cell reactivity to endemic coronaviruses and SARS-CoV-2 in community and health care workers. J Infect Dis (2021) 224(1):70–80. doi: 10.1093/infdis/jiab176
6. Mateus J, Grifoni A, Tarke A, Sidney J, Ramirez SI, Dan JM, et al. Selective and cross-reactive SARS-CoV-2 T cell epitopes in unexposed humans. Science (2020) 370(6512):89–94. doi: 10.1126/science.abd3871
7. Pallikkuth S, Williams E, Pahwa R, Hoffer M, Pahwa S. Association of flu specific and SARS-CoV-2 specific CD4 T cell responses in SARS-CoV-2 infected asymptomatic heath care workers. Vaccine (2021) 39:6019–24. doi: 10.1016/j.vaccine.2021.08.092
8. Thevarajan I, Buising KL, Cowie BC. Clinical presentation and management of COVID-19. Med J Aust (2020) 213(3):134–9. doi: 10.5694/mja2.50698
9. FDA. Coronavirus disease 2019 (COVID-19). EUA Informatin (2022). Available at: https://www.fda.gov/emergency-preparedness-and-response/mcm-legal-regulatory-and-policy-framework/emergency-use-authorizationvaccines.
10. Amanat F, Stadlbauer D, Strohmeier S, Nguyen THO, Chromikova V, McMahon M, et al. A serological assay to detect SARS-CoV-2 seroconversion in humans. Nat Med (2020) 26(7):1033–6. doi: 10.1038/s41591-020-0913-5
11. Stadlbauer D, Amanat F, Chromikova V, Jiang K, Strohmeier S, Arunkumar GA, et al. SARS-CoV-2 seroconversion in humans: A detailed protocol for a serological assay, antigen production, and test setup. Curr Protoc Microbiol (2020) 57(1):e100. doi: 10.1002/cpmc.100
12. Feng S, Phillips DJ, White T, Sayal H, Aley PK, Bibi S, et al. Correlates of protection against symptomatic and asymptomatic SARS-CoV-2 infection. Nat Med (2021) 27(11):2032–40. doi: 10.1038/s41591-021-01540-1
13. Gilbert PB, Montefiori DC, McDermott AB, Fong Y, Benkeser D, Deng W, et al. Immune correlates analysis of the mRNA-1273 COVID-19 vaccine efficacy clinical trial. Science (2022) 375(6576):43–50. doi: 10.1126/science.abm3425
14. Crawford KHD, Dingens AS, Eguia R, Wolf CR, Wilcox N, Logue JK, et al. Dynamics of neutralizing antibody titers in the months after severe acute respiratory syndrome coronavirus 2 infection. J Infect Dis (2021) 223(2):197–205. doi: 10.1093/infdis/jiaa618
15. Nagura-Ikeda M, Imai K, Kubota K, Noguchi S, Kitagawa Y, Matsuoka M, et al. Clinical characteristics and antibody response to SARS-CoV-2 spike 1 protein using VITROS anti-SARS-CoV-2 antibody tests in COVID-19 patients in Japan. J Med Microbiol (2021) 70(4):001291. doi: 10.1099/jmm.0.001291
16. Callegaro A, Borleri D, Farina C, Napolitano G, Valenti D, Rizzi M, et al. Antibody response to SARS-CoV-2 vaccination is extremely vivacious in subjects with previous SARS-CoV-2 infection. J Med Virol (2021) 93(7):4612–5. doi: 10.1002/jmv.26982
17. Lozano-Ojalvo D, Camara C, Lopez-Granados E, Nozal P, Del Pino-Molina L, Bravo-Gallego LY, et al. Differential effects of the second SARS-CoV-2 mRNA vaccine dose on T cell immunity in naive and COVID-19 recovered individuals. Cell Rep (2021) 36(8):109570. doi: 10.1016/j.celrep.2021.109570
18. Mungmunpuntipantip R, Wiwanitkit V. Antibody response to SARS-CoV-2 vaccination, previous SARS-CoV-2 infection, and change to single-dose vaccination. J Med Virol (2021) 93(12):6474. doi: 10.1002/jmv.27263
19. Kelsen SG, Braverman AS, Aksoy MO, Hayman JA, Patel PS, Rajput C, et al. SARS-CoV-2 BNT162b2 vaccine–induced humoral response and reactogenicity in individuals with prior COVID-19 disease. JCI Insight (2022) 7(4). doi: 10.1172/jci.insight.155889
20. Ontañón J, Blas J, de Cabo C, Santos C, Ruiz-Escribano E, García A, et al. Influence of past infection with SARS-CoV-2 on the response to the BNT162b2 mRNA vaccine in health care workers: Kinetics and durability of the humoral immune response. EBioMedicine (2021) 73:103656. doi: 10.1016/j.ebiom.2021.103656
21. Pereson MJ, Amaya L, Neukam K, Baré P, Echegoyen N, Badano MN, et al. Heterologous gam-COVID-vac (sputnik V)/mRNA-1273 (moderna) vaccination induces a stronger humoral response than homologous sputnik V in a real-world data analysis. Clin Microbiol Infection (2022) 28(10):1382–8. doi: 10.1016/j.cmi.2022.05.009
22. Tsang JS, Dobaño C, VanDamme P, Moncunill G, Marchant A, Othman RB, et al. Improving vaccine-induced immunity: Can baseline predict outcome? Trends Immunol (2020) 41(6):457–65. doi: 10.1016/j.it.2020.04.001
23. HANC. Cross-network PBMC processing standard operating procedure. HIV/AIDS Network Coordination (2018). pp. 1–45. Available at: https://www.hanc.info/content/dam/hanc/documents/laboratory/cross-network-procedures-sops/HANC-LAB-P0001_v6.0_2018-04-26_PBMC_SOP.pdf
24. CDC. Interim clinical considerations for use of COVID-19 vaccines currently approved or authorized in the united states. Centers for Disease Control and Prevention (2022). Available at: https://www.cdc.gov/vaccines/covid-19/clinical-considerations/covid-19-vaccines-us.html
25. R Development Core Team. R: A language and environment for statistical computing. R Core Team (2021). Availabe at: https://www.R-project.org
26. Wood SN. Stable and efficient multiple smoothing parameter estimation for generalized additive models. J Am Stat Assoc (2022) 99:673–86. doi: 10.1198/016214504000000980 https://cran.r-project.org/web/packages/nlme/nlme.pdf
27. Kuhn M. Caret: Classification and regression training. Springer: Verlag New York (2021). Availabe at: https://github.com/topepo/caret/
28. Friedman J, Hastie T, Tibshirani R. Regularization paths for generalized linear models via coordinate descent. J Stat Software (2010) 33(1):1–22. doi: 10.18637/jss.v033.i01
29. Pinheiro J, Bates D, DebRoy S, Sarkar D, R Core Team. Nlme: Linear and nonlear mixed effects models. R package version 31-1522021. (2022). Available at: https://cran.r-project.org/web/packages/nlme/nlme.pdf
30. Hothorn T, Bretz F, Westfall P. Simultaneous inference in general parametric models. Biometric J (2008) 50(3):346–63. doi: 10.1002/bimj.200810425
32. Levin EG, Lustig Y, Cohen C, Fluss R, Indenbaum V, Amit S, et al. Waning immune humoral response to BNT162b2 covid-19 vaccine over 6 months. New Engl J Med (2021) 385(24):e84. doi: 10.1056/NEJMoa2114583
33. Röltgen K, Powell AE, Wirz OF, Stevens BA, Hogan CA, Najeeb J, et al. Defining the features and duration of antibody responses to SARS-CoV-2 infection associated with disease severity and outcome. Sci Immunol (2020) 5(54). doi: 10.1126/sciimmunol.abe0240
34. Gudbjartsson DF, Norddahl GL, Melsted P, Gunnarsdottir K, Holm H, Eythorsson E, et al. Humoral immune response to SARS-CoV-2 in Iceland. New Engl J Med (2020) 383(18):1724–34. doi: 10.1056/NEJMoa2026116
36. Hervé C, Laupèze B, Del Giudice G, Didierlaurent AM, Tavares Da Silva F. The how’s and what’s of vaccine reactogenicity. NPJ Vaccines (2019) 4(1):39. doi: 10.1038/s41541-019-0132-6
37. Dan JM, Mateus J, Kato Y, Hastie KM, Yu ED, Faliti CE, et al. Immunological memory to SARS-CoV-2 assessed for up to 8 months after infection. Science (2021) 371(6529). doi: 10.1126/science.abf4063
38. Müller L, Andrée M, Moskorz W, Drexler I, Walotka L, Grothmann R, et al. Age-dependent immune response to the Biontech/Pfizer BNT162b2 coronavirus disease 2019 vaccination. Clin Infect Dis (2021) 73(11):2065–72. doi: 10.1093/cid/ciab381
39. Kennedy JL, Forrest JC, Young SG, Amick B, Williams M, James L, et al. Temporal variations in seroprevalence of SARS-CoV-2 infections by race and ethnicity in Arkansas. medRxiv (2021). doi: 10.1101/2021.07.15.21260213
40. Rogawski McQuade ET, Guertin KA, Becker L, Operario D, Gratz J, Guan D, et al. Assessment of seroprevalence of SARS-CoV-2 and risk factors associated with COVID-19 infection among outpatients in Virginia. JAMA Network Open (2021) 4(2):e2035234–e. doi: 10.1001/jamanetworkopen.2020.35234
41. Pass RF, Nachman S, Flynn PM, Muresan P, Fenton T, Cunningham CK, et al. Immunogenicity of licensed influenza a (H1N1) 2009 monovalent vaccines in HIV-infected children and youth. J Pediatr Infect Dis Soc (2013) 2(4):352–60. doi: 10.1093/jpids/pit040
42. Arguedas A, Soley C, Lindert K. Responses to 2009 H1N1 vaccine in children 3 to 17 years of age. New Engl J Med (2010) 362(4):370–2. doi: 10.1056/NEJMc0909988
43. Netea MG, Domínguez-Andrés J, Barreiro LB, Chavakis T, Divangahi M, Fuchs E, et al. Defining trained immunity and its role in health and disease. Nat Rev Immunol (2020) 20(6):375–88. doi: 10.1038/s41577-020-0285-6
44. Smatti MK, Alkhatib HA, Al Thani AA, Yassine HM. Will host genetics affect the response to SARS-CoV-2 vaccines? historical precedents. Front Med (2022) 9. doi: 10.3389/fmed.2022.802312
45. Valdés-Fernández BN, Duconge J, Espino AM, Ruaño G. Personalized health and the coronavirus vaccines-do individual genetics matter? Bioessays (2021) 43(9):e2100087. doi: 10.1002/bies.202100087
46. Whitaker JA, Ovsyannikova IG, Poland GA. Adversomics: A new paradigm for vaccine safety and design. Expert Rev Vaccines (2015) 14(7):935–47. doi: 10.1586/14760584.2015.1038249
47. Rydyznski Moderbacher C, Ramirez SI, Dan JM, Grifoni A, Hastie KM, Weiskopf D, et al. Antigen-specific adaptive immunity to SARS-CoV-2 in acute COVID-19 and associations with age and disease severity. Cell (2020) 183(4):996–1012.e19. doi: 10.1016/j.cell.2020.09.038
48. Vardhana S, Baldo L, Morice WG 2nd, Wherry EJ. Understanding T cell responses to COVID-19 is essential for informing public health strategies. Sci Immunol (2022) 7(71):eabo1303. doi: 10.1126/sciimmunol.abo1303
49. Graham MS, Sudre CH, May A, Antonelli M, Murray B, Varsavsky T, et al. Changes in symptomatology, reinfection, and transmissibility associated with the SARS-CoV-2 variant B.1.1.7: An ecological study. Lancet Public Health (2021) 6(5):e335–e45. doi: 10.1016/S2468-2667(21)00055-4
50. Whitaker M, Elliott J, Bodinier B, Barclay W, Ward H, Cooke G, et al. Variant-specific symptoms of COVID-19 in a study of 1,542,510 adults in England. Nat Commun (2022) 13(1):6856. doi: 10.1038/s41467-022-34244-2
Keywords: vaccine reactogenicity, infection, protective antibodies, COVID-19, SARS-CoV-2
Citation: Williams EC, Kizhner A, Stark VS, Nawab A, Muniz DD, Echeverri Tribin F, Carreño JM, Bielak D, Singh G, Hoffer ME, Krammer F, Pallikkuth S and Pahwa S (2023) Predictors for reactogenicity and humoral immunity to SARS-CoV-2 following infection and mRNA vaccination: A regularized, mixed-effects modelling approach. Front. Immunol. 14:971277. doi: 10.3389/fimmu.2023.971277
Received: 16 June 2022; Accepted: 27 January 2023;
Published: 09 February 2023.
Edited by:
Edwin Bölke, Heinrich Heine University of Düsseldorf, GermanyReviewed by:
Gualberto Ruaño, Hartford Hospital, United StatesKarin Neukam, Virgen del Rocío University Hospital, Spain
Copyright © 2023 Williams, Kizhner, Stark, Nawab, Muniz, Echeverri Tribin, Carreño, Bielak, Singh, Hoffer, Krammer, Pallikkuth and Pahwa. This is an open-access article distributed under the terms of the Creative Commons Attribution License (CC BY). The use, distribution or reproduction in other forums is permitted, provided the original author(s) and the copyright owner(s) are credited and that the original publication in this journal is cited, in accordance with accepted academic practice. No use, distribution or reproduction is permitted which does not comply with these terms.
*Correspondence: Savita Pahwa, c3BhaHdhQG1lZC5taWFtaS5lZHU=