 Aditya Mankame
 Babak Shotorban
- Department of Mechanical and Aerospace Engineering, The University of Alabama in Huntsville, Huntsville, AL, United States
The focus of the present work is on the deposition of firebrands in a flow over a rectangular cubic block representative of a structure in wildland-urban interface (WUI). The study was carried out by physics based modeling where the wind flow turbulence was dealt with by large eddy simulation (LES) and firebrands were treated by Lagrangian tracking. The Lagrangian equations coupled with the flow solver, accounted for both translational and rotational motions as well as thermochemical degradation of firebrands, assumed to be cylindrical. The dimensions of the structure were varied from 3 to 9 m in the simulations for a parametric study. The simulations were carried out by tracking many firebrands randomly released with a uniform distribution from a horizontal plane 35 m above the ground into the computational domain. The coordinates of the deposited firebrands were used to calculate their normalized number density (number of landed firebrands per unit surface area) to quantify their deposition pattern. On the leewardside of the block, an area, referred to as the safe zone, was identified right behind the structure where firebrands never deposit. The size of the safe zone in the direction perpendicular to the wind was nearly identical to the width of the structure. The length of the safe zone in the wind direction was proportional to the height of the structure. The leeward face of the blocks was never hit by a firebrand. The windward face was hit by many more firebrands than the lateral faces but much less than the top face. The distribution of the number density of the deposited firebrands on the top face was found to be correlated with the flow separation and reattachment on this face.
1 Introduction
A critical mechanism for the spread of large outdoor fires, e.g., wildland-urban interface (WUI) fires is spotting. Spotting is the creation of the secondary (spot) fires by firebrands that are generated by the primary fires. Firebrands can be lofted up into the atmosphere and carried away by the ambient wind to short/long distances (Tarifa et al., 1967; Sardoy et al., 2008). In the presence of strong ambient winds, firebrands can cross distances from a few 100 m to a few kilometers, thus capable of spreading fires over barriers such as rivers, lakes, hills, etc. Spotting is seen frequently in WUI fires and can burn down many WUI structures under extreme conditions such as an ember shower (Manzello, 2014). This motivated the present computational study with a focus on characterizing the deposition pattern of firebrands carried by the wind on top and in the vicinity of a structure shaped as a rectangular cuboid mounted on the ground. The computational configuration here can be considered as a simplified representation of a single isolated WUI structure.
There have been several studies on the role of firebrands in the spread of wildland and WUI fires. Manzello et al. (2007) performed experiments by burning two Douglas-fir trees with 2.6 and 5.2 m heights. They found that the generated firebrands were predominately cylindrical in shape with an average diameter of 3 mm and length of 40 mm for the shorter tree and 4 and 53 mm for the taller tree. Manzello et al. (2008) constructed an apparatus capable of generating glowing firebrands and used it to release firebrand in a wind tunnel. The firebrands released in the wind-tunnel at 9 m/s experienced a mass loss of 20–40% when compared to firebrands released in no wind condition. Tohidi and Kaye (2017b), Tohidi and Kaye (2017a) experimentally and computationally studied the lofting of firebrands in a wind tunnel where in addition to wind, a convective plume was included. They observed that for higher wind speeds, the change in the initial vertical velocity of the convective column did not affect the mean or standard deviation of the heights where the firebrands lofted or the distances they traveled to land. Yin et al. (2003), Oliveira et al. (2014) developed numerical models for the firebrand transport accounting for the drag, lift and gravitational forces and their effect on the rotation of firebrands to model both translational and rotational motions of cylindrical firebrands. To validate their model, Oliveira et al. (2014) performed computations and experiments for a cylindrical firebrand (balsa wood) falling from an elevated point under a no ambient flow condition. The influence of different formulations for the distance between center of pressure and center of mass of a cylindrical object in motion was explored in the modeling by Rayleigh (1876), Marchildon et al. (1964), Rosendahl (2000), Yin et al. (2003).
Anand et al. (2018) preformed simulations to investigate the deposition of cylindrical firebrands released in a turbulent wind environment from a fixed elevated point. They assumed for firebrands to retain their mass from release to landing. They reported a bivariate Gaussian function like distribution for the landed firebrand position with a larger variance in the streamwise direction, compared to the spanwise direction. Anand (2018) performed similar simulations while allowing firebrands to experience mass loss due to thermal degradation, taking into account the effect of burning. They observed that, firebrands with a higher mass density
Properties of the flow over a cubic obstacle mounted on the ground have been studied in the past (Murakami et al., 1987; Werner and Wengle, 1993; Lee and Bienkiewicz, 1997; Rodi, 1998). One of the earliest works is due to Murakami et al. (1987) who simulated a cube submerged in a boundary layer using large-eddy simulation (LES). Werner and Wengle (1993), Rodi (1998) computationally studied a cube mounted on a surface in a channel flow with a Reynolds number of
The present work is a modeling study focused on deposition of firebrands in a flow over a cubic block representative of a structure in WUI. The flow is dealt with by LES while the deposition of firebrands is treated in the Lagrangian framework. In Section 2, modeling approaches are illustrated for both firebrands and the flow. In Section 3, results are presented with the model validation results included. Concluding remarks are made in Section 4.
2 Modeling Approaches
2.1 Firebrand Equations
The firebrand equations are expressed and solved in the Lagrangian framework. Firebrands are assumed to be cylinders with a large ratio of length to diameter, undergoing both translational and rotational motions (Yin et al., 2003; Oliveira et al., 2014; Anand et al., 2018) and thermal degradation as a result of pyrolysis and charring (Morvan and Dupuy, 2004; Anand, 2018).
2.1.1 Translational Motion
The position and velocity of the center of mass of the firebrand are denoted by
where
Here,
2.1.2 Rotational Motion
The rotational motion is described by the Euler rotation equation:
where
Here,
Quaternions are governed by
The quaternions are correlated with Euler angles
2.1.3 Mass and Temperature
Heat is transfered from the firebrand to the surrounding gas through thermal radiation and convection. The firebrand undergoes thermal degradation and loses mass as a result of pyrolysis and char oxidation. To take this effect into account, the firebrand model assumes for the firebrand to be thermally thin (i.e. temperature throughout the firebrand is spatially uniform) with a mass governed by:
where
where
The firebrand temperature is governed by
where
where A is the surface area of the firebrand,
2.2 Computational Approach
Our group developed a model that handles the transport and burning of firebrands, according to Eqs. 1–26, in the framework of Fire Dynamic Simulator (FDS, version 6.7.0) (McGrattan et al., 2018). FDS is computational fluid dynamics (CFD) based software capable of modeling the fire dynamics while representing significant thermal, chemical and physical processes such as combustion, turbulence, radiation, etc. In the present study, only the fluid dynamical features of FDS are relevant. Turbulence is dealt with by LES in FDS with the default option of Deardoff model (Deardorff, 1980) set to represent the subgrid-scale (SGS) terms here. FDS uses Wall-Adapting Local Eddy-viscosity model (WALE) (Nicoud and Ducros, 1999) as the near-wall model by default. The firebrand equations are solved by a second-order Admas-Bashforth time integration method, as described by Anand et al. (2018) and Anand (2018). In computations,
3 Results and Discussion
3.1 Firebrand Model Validation
To validate the firebrand model, first, a firebrand drop test previously investigated both experimentally and computationally (Oliveira et al., 2014) was considered. The exercise involved a non-burning cylindrical firebrand made from balsa wood with diameter 10 mm and length 80 mm, which was released from the height 8.7 m in a no-wind condition. At the release point, the firebrand had zero velocities and made an angle of

TABLE 1. Landing time of a cylindrical firebrand released in a still air in the previous experiment and simulation (Oliveira et al., 2014), and present simulations using different formula for the center of pressure
Table 1 tabulates the landing times calculated in the current study using various
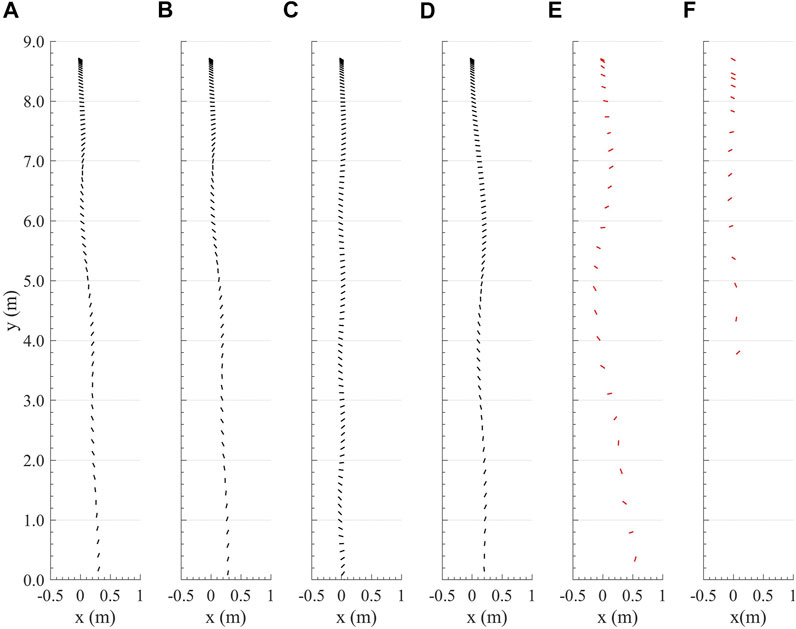
FIGURE 1. Trajectory of a cylindrical particle released in still air condition in the present simulations using center of pressure formulation of (A)Rayleigh (1876); (B)Marchildon et al. (1964); (C)Rosendahl (2000); (D)Yin et al. (2003); (E)Oliveira et al. (2014); and (F) the experiment of Oliveira et al. (2014).
3.2 Flow Model Validation
The flow model used here was first validated against the previous experimental and modeling data obtained in a wind tunnel for a flow over a cubic block (Lim et al., 2009). The test section of the wind tunnel had dimensions of
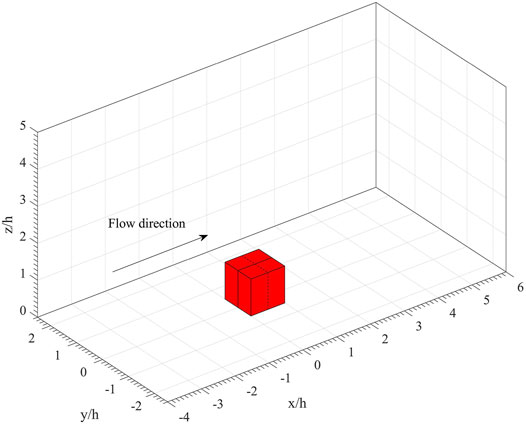
FIGURE 2. Computational domain
Figure 3 shows the mean velocity streamlines at a slice
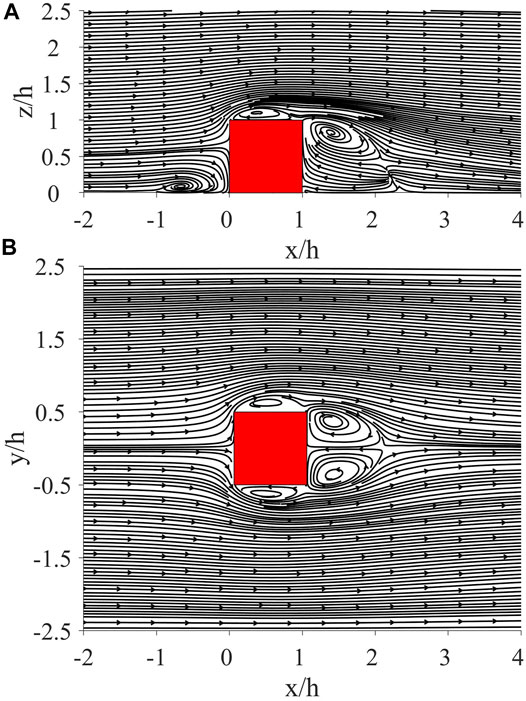
FIGURE 3. Mean velocity streamlines at (A) slice

TABLE 2. The locations of the center of the horseshoe vortex (HSV)
Figure 4 shows the pressure coefficient
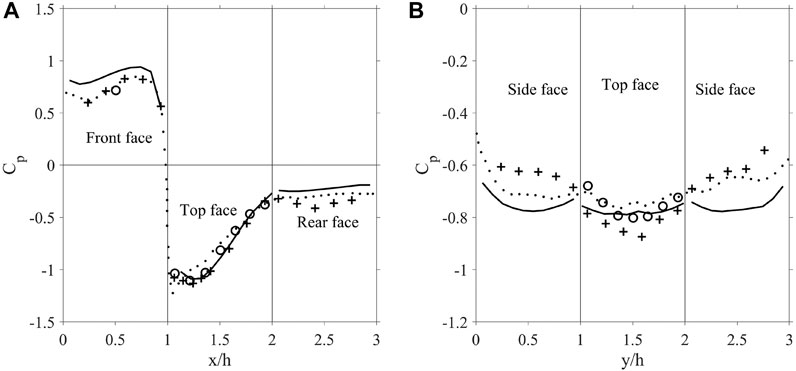
FIGURE 4. Pressure coefficient on the surface of the cube in the flow validation study; (A) the axial centerline where
In Figure 5, the mean streamwise and vertical velocities are plotted vs. z on the axial centerline of the top face of the block at various x’s. The agreement between the current simulation and the previous experiment and simulation (Lim et al., 2009) is very good. The change of the velocity profile in the x direction is attributed to the flow separation on the top face.
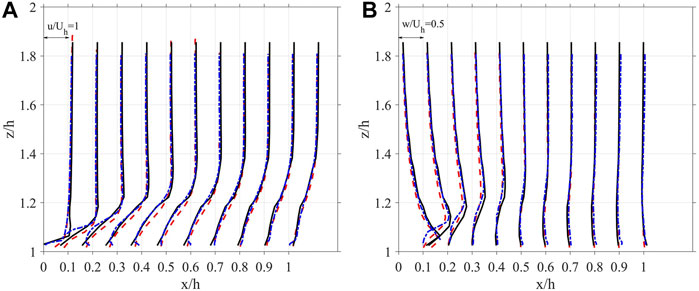
FIGURE 5. Profiles of (A) the streamwise mean velocity; and (B) the vertical mean velocity in the flow model validation study; the experiment (blue dashed-dotted line), and simulation (red dashed line) of Lim et al. (2009) and the present simulation (solid line).
Figure 6 shows the profiles of the root mean square (rms) of the streamwise and vertical velocities as well as the Reynolds shear stress at various x’s on the axial center-line of the top face of the block. As could be seen in Figures 6A,B, the current simulation substantially over-predicts the rms values obtained in the previous experiments and the simulation (Lim et al., 2009). On the other hand, the Reynolds shear stress in the simulation is in reasonably good agreement with the previous experimental and simulation data.
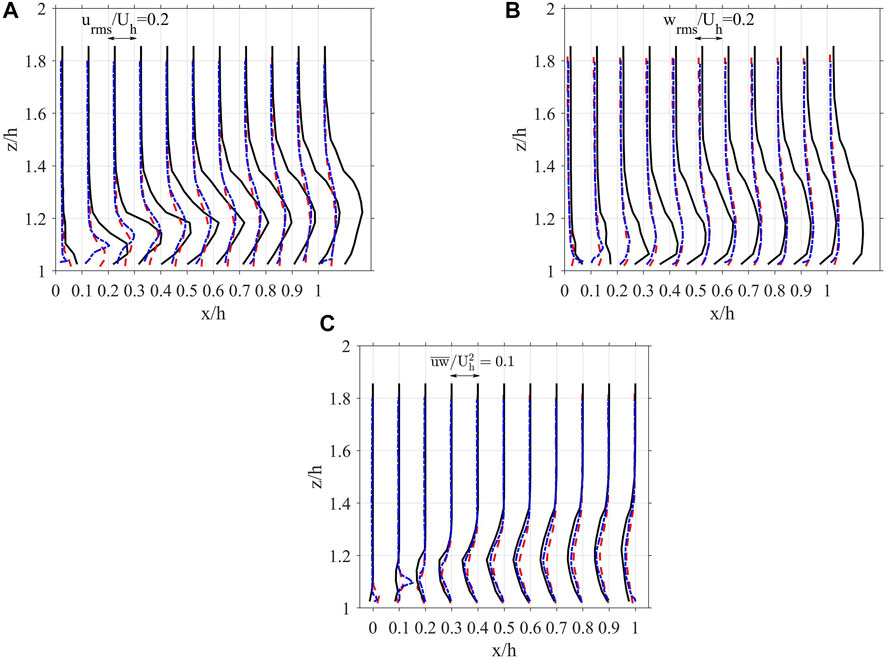
FIGURE 6. Profiles of (A) the streamwise velocity rms; (B) the vertical velocity rms; and (C) Reynolds shear stress
3.3 Firebrand Deposition in the Flow Over a Single Structure
Figure 7 shows the computational configuration used in the simulation of firebrand deposition in a flow over a single cubic structure. The length, width and height of the structure are indicated by L, W and H, which are its dimensions in the x, y and z directions, respectively. Simulations were carried out for structures with various lengths, widths and heights. The domain size is
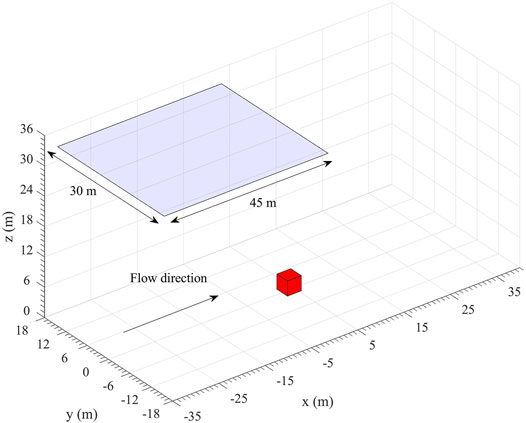
FIGURE 7. Computational configuration in the firebrand deposition study with a structure
The firebrands were released every second from positions with coordinates randomly selected with a uniform distribution from a horizontal plane passing
To quantify the spatial distribution of the firebrands deposited on the ground and the top face of the block, a criterion proposed by Anand et al. (2018) with the following function, was used:
where n is the total number of the deposited firebrands, and
Figure 8 shows the mean velocity streamlines superimposed on the contour plots of mean velocity magnitude on the slice
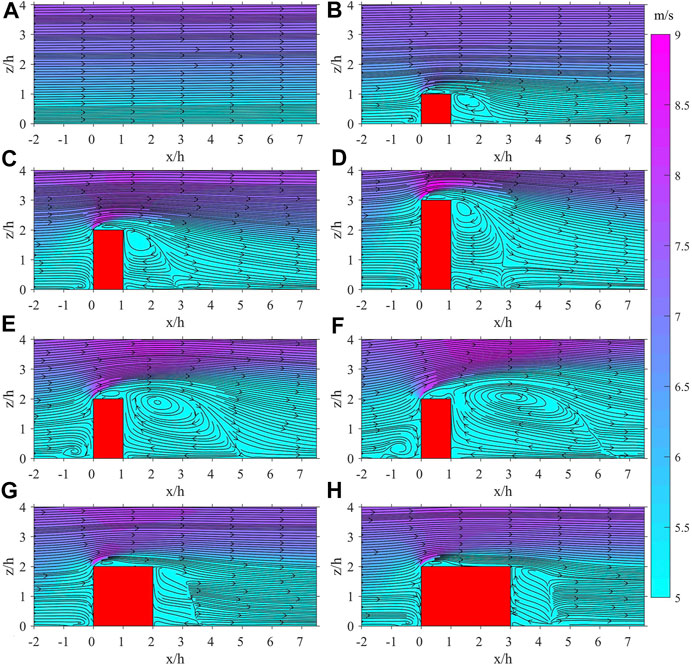
FIGURE 8. Mean velocity streamlines superimposed on the contour plots of mean velocity magnitude at slice
Figure 9 shows a top view of the contour plots of NND of the deposited firebrands for cases displayed in Figure 8. As seen in this figure, there is a region of very low NND on the leeward side in panels with structures. Examining the scattered deposited particle data revealed that no firebrands were deposited on this region. This region is hereby referred to as the safe zone. The safe zone is approximately shaped like a rectangle with a length
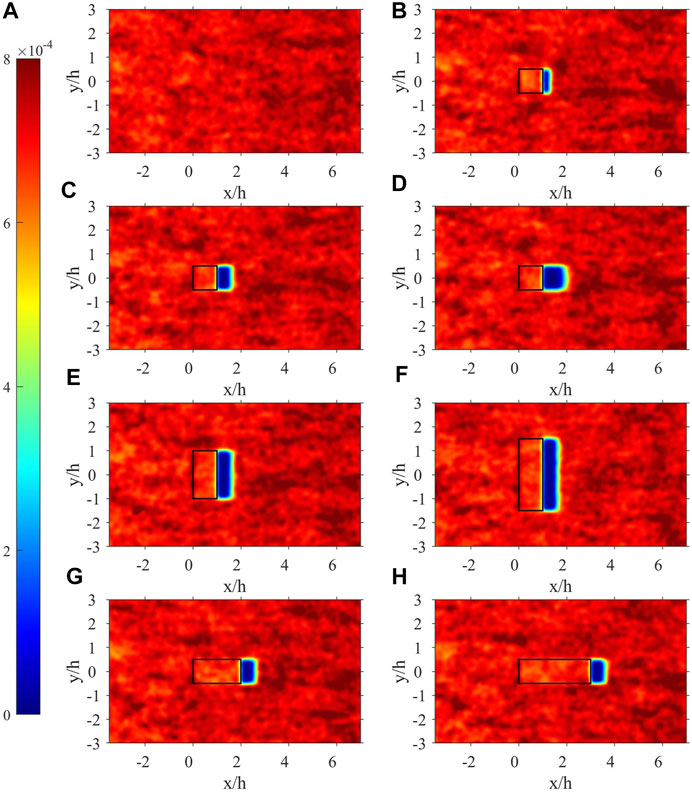
FIGURE 9. Contour plots of normalized number density of the deposited firebrands on the ground (A) with no structure; top face and the ground around single structures with (B)L = W = H = 3 m; (C)L = W = 3 m, H = 6 m; (D)L = W = 3 m, H = 9 m; (E)L = 3 m, W = H = 6 m; (F)L = 3 m, W = 9 m, H = 6 m; (G)L = H = 6 m, W = 3 m; (H)L = 9 m, W = 3 m, H = 6 m.
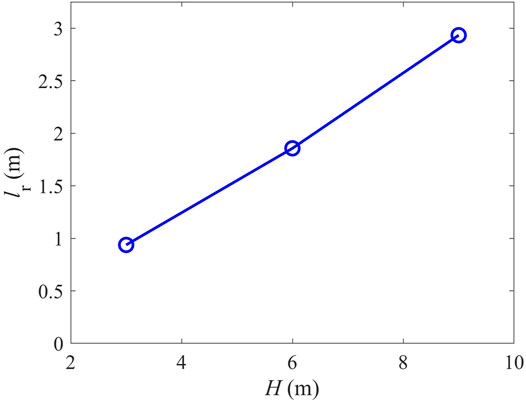
FIGURE 10. Length of the region with no deposited firebrands vs. structure height for L = W = 3 m.
Figures 11A–C shows the NND of deposited firebrands vs. x at
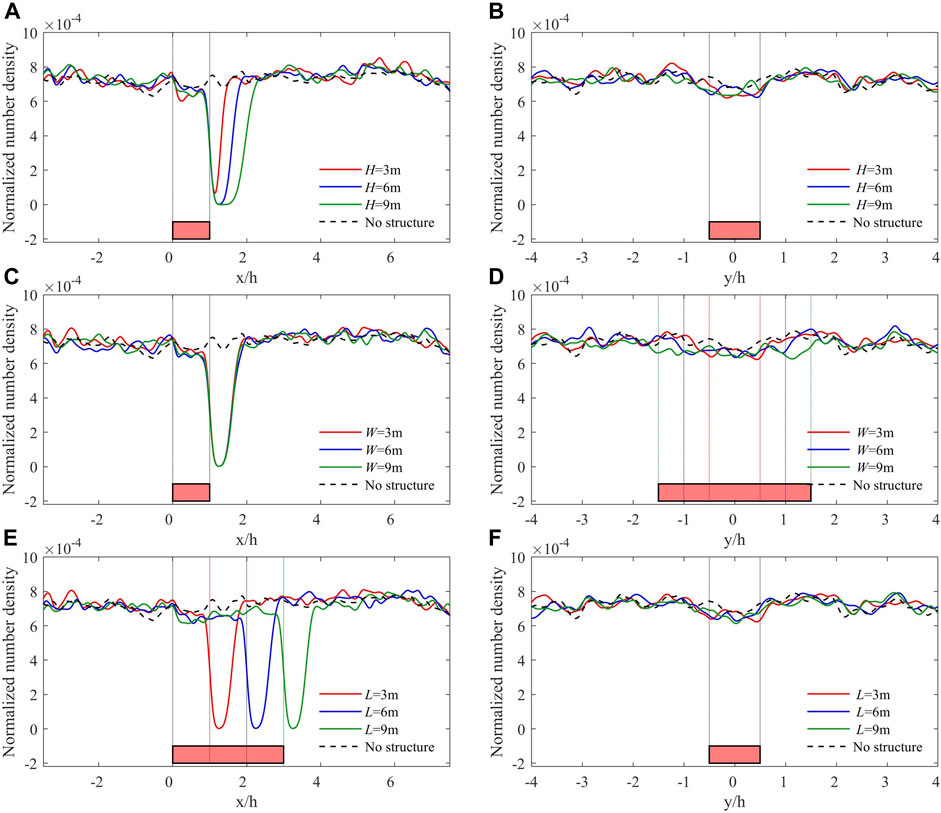
FIGURE 11. Normalized number density of deposited firebrands vs. x at
Table 3 shows the number of firebrands deposited and their temperatures on the top, front and lateral faces of the structure. In none of the cases, a firebrand was deposited on the back face of the structure. This table shows that in the cases with varying height but the same width and length, the number of firebrands deposited on the top face and their average temperature increase with an increasing height. The reason for this average temperature increase is that overall as firebrands descend, their temperatures drop. Figure 12 shows the exact location and temperature of each deposited firebrand on all faces of one of the considered structures but the leeward face. As noted earlier, the leeward face did not receive any firebrands in any of the cases. As evident in this figure, the temperature of the firebrands deposited on the windward face decrease with the decrease of z. A triangular like region with no firebrands on either lateral face of the block is noticeable.
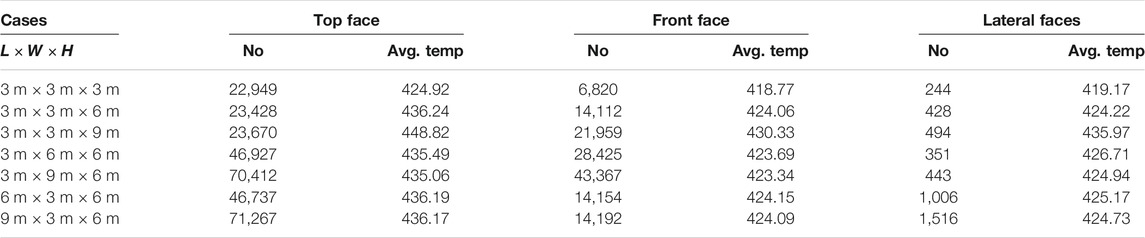
TABLE 3. Number and average temperature (K) of firebrands deposited on the top, front and lateral faces of the structure.
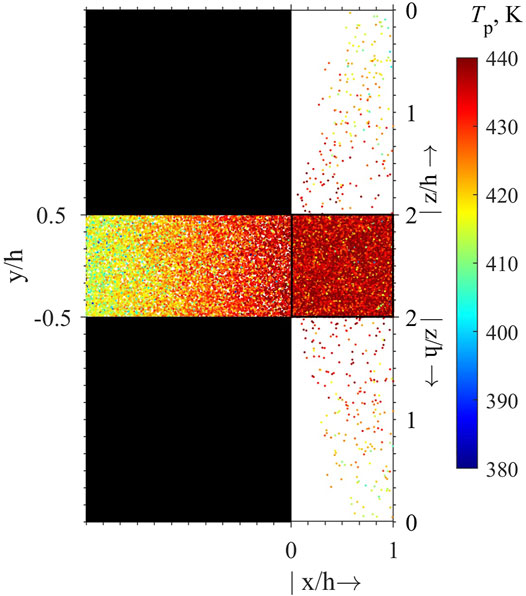
FIGURE 12. Location and temperature of the firebrands deposited on the faces of the structure with length and width of 3 m and height of 6 m. Dots indicate the positions of the deposited firebrands on the block faces. The leeward face is not shown since no firebrands are deposited on it. The rectangles with the smallest number of dots are the lateral faces. The square between these two faces is the top face. The rectangle on the left of the top face is the windward face.
4 Summary and Conclusion
A model was developed for simulation of cylindrical firebrand motion and burning in the FDS computational framework. The model was validated against the previous experimental and computational data (Oliveira et al., 2014) for a firebrand falling in a no-wind condition. The current model showed better agreement with the experimental data than the previous computational model. In addition, the previous experimental and CFD data (Lim et al., 2009) for a flow over a mounted 0.08 m height cube in a wind tunnel was used to validate FDS for simulation of flows over obstacles. The pressure coefficients in the simulation was in relatively good agreement with the experimental data. The mean velocity profiles in the streamwise and vertical directions as well as the Reynolds shear stress in the simulation closely matched the experimental data. On the other hand, the simulation substantially over-predicted the measured rms of the velocities in the streamwise and vertical directions. The developed firebrand model then used with FDS to simulate the deposition of firebrands carried by a flow over a rectangular cubic structure, as a representative of a single structure in an open domain. The Reynolds number in the deposition study was an order of magnitude larger than that in the validation study. A parametric study was conducted where heights, widths and lengths were varied from 3 to 9 m. It revealed an area on the leeward side of the structure on the ground where no firebrands were deposited. This area was refereed to as the safe zone. The width of the zone was the same as the width of the structure (the dimension of the structure in the spanwise direction). The length of this zone in the streamwise direction was proportional to the height of the structure. No firebrand was deposited on the leeward face of the structure regardless of the size of the structure. The NND on the top face of the structure increases slightly with its height. For structures with longer lengths, the NND dropped near the leading edge and rose back again toward the trailing edge of the structure. This effect was attributed to the flow accelerating above the leading edge of the structure thus imparting extra momentum onto the firebrands and carrying them farther away.
Shapes of the structures considered here were simple but fundamental. Understanding the problem in fundamental setups seems an essential first step but considerations should be given to shapes representing more realistic structures. Realistic structures can significantly change from one to another in shape while involving additional geometric parameters, which can hinder the interpretation of the results. It is noted that the dimensions chosen for the structures here ranged from 3 to 9 m which are relevant to the overall dimensions of realistic small structures, e.g., houses. Future work should include sensitivity studies of the wind speed and direction. It should also include heat flux transferred from the deposited firebrands because of its consequence on ignition of the recipient fuel. Calculations of this flux require additional models to represent this phenomenon.
Data Availability Statement
The data that support the findings of this study are available from the corresponding author upon reasonable request.
Author Contributions
AM made changes to the code, ran the simulation and post processed the acquired data for this study under the supervision of BS. Both authors contributed to the development of the manuscript.
Funding
This work was performed under the following financial assistance award 70NANB17H281 from United States Department of Commerce, National Institute of Standards and Technology.
Conflict of Interest
The authors declare that the research was conducted in the absence of any commercial or financial relationships that could be construed as a potential conflict of interest.
Acknowledgments
The authors acknowledge the work by Chandanda Anand on integration of the firebrand model with the FDS version used in this study. The authors acknowledge the help received from Randall J. McDermott of NIST for the flow model validation study. High performance computing resources and technical support from the Alabama Supercomputer Authority are appreciated.
References
Anand, C. (2018). “Computational Investigations of Ignition Characteristics of Live Fuels and Deposition of Firebrands in a Turbulent Boundary Layer,”. Ph.D. thesis (The University of Alabama in Huntsville).
Anand, C., Shotorban, B., and Mahalingam, S. (2018). Dispersion and Deposition of Firebrands in a Turbulent Boundary Layer. Int. J. Multiphase Flow 109, 98–113. doi:10.1016/j.ijmultiphaseflow.2018.07.012
Deardorff, J. W. (1980). Stratocumulus-capped Mixed Layers Derived from a Three-Dimensional Model. Boundary-layer Meteorol. 18, 495–527. doi:10.1007/bf00119502
Germano, M., Piomelli, U., Moin, P., and Cabot, W. H. (1991). A Dynamic Subgrid‐scale Eddy Viscosity Model. Phys. Fluids A: Fluid Dyn. 3, 1760–1765. doi:10.1063/1.857955
Kelbaliyev, G. I. (2011). Drag Coefficients of Variously Shaped Solid Particles, Drops, and Bubbles. Theor. Found. Chem. Eng. 45, 248–266. doi:10.1134/s0040579511020084
Lee, S., and Bienkiewicz, B. (1997). Large-eddy Simulation of Wind Effects on bluff Bodies Using the Finite Element Method. J. wind Eng. Ind. aerodynamics 67-68, 601–609. doi:10.1016/s0167-6105(97)00103-7
Lim, H. C., Thomas, T. G., and Castro, I. P. (2009). Flow Around a Cube in a Turbulent Boundary Layer: LES and experiment. J. Wind Eng. Ind. Aerodynamics 97, 96–109. doi:10.1016/j.jweia.2009.01.001
Manzello, S. (2014). Enabling the Investigation of Structure Vulnerabilities to Wind- Driven Firebrand Showers in Wildland-Urban Interface (WUI) Fires. Fire Saf. Sci. 11, 83–96. doi:10.3801/iafss.fss.11-83
Manzello, S. L., Maranghides, A., and Mell, W. E. (2007). Firebrand Generation from Burning Vegetation. Int. J. Wildland Fire 16, 458–462. doi:10.1071/wf06079
Manzello, S. L., Shields, J. R., Cleary, T. G., Maranghides, A., Mell, W. E., Yang, J. C., et al. (2008). On the Development and Characterization of a Firebrand Generator. Fire Saf. J. 43, 258–268. doi:10.1016/j.firesaf.2007.10.001
Marchildon, E. K., Clamen, A., and Gauvin, W. H. (1964). Drag and Oscillatory Motion of Freely Falling Cylindrical Particles. Can. J. Chem. Eng. 42, 178–182. doi:10.1002/cjce.5450420410
McGrattan, K., Hostikka, S., Floyd, J., McDermott, R., and Vanella, M. (2018). Fire Dynamics Simulator Technical Reference Guide Volume 1: Mathematical Model. NIST Special Publication. Sixth Edition. U.S. Department of Commerce, National Institute of Standards and Technology, 1018–1026.
Mell, W., Maranghides, A., McDermott, R., and Manzello, S. L. (2009). Numerical Simulation and Experiments of Burning douglas Fir Trees. Combustion and Flame 156, 2023–2041. doi:10.1016/j.combustflame.2009.06.015
Moin, P., Squires, K., Cabot, W., and Lee, S. (1991). A Dynamic Subgrid‐scale Model for Compressible Turbulence and Scalar Transport. Phys. Fluids A: Fluid Dyn. 3, 2746–2757. doi:10.1063/1.858164
Morvan, D., and Dupuy, J. L. (2004). Modeling the Propagation of a Wildfire through a Mediterranean Shrub Using a Multiphase Formulation. Combustion and flame 138, 199–210. doi:10.1016/j.combustflame.2004.05.001
Murakami, S., Mochida, A., and Hibi, K. (1987). Three-dimensional Numerical Simulation of Air Flow Around a Cubic Model by Means of Large Eddy Simulation. J. Wind Eng. Ind. Aerodynamics 25, 291–305. doi:10.1016/0167-6105(87)90023-7
Nicoud, F., and Ducros, F. (1999). Subgrid-scale Stress Modelling Based on the Square of the Velocity Gradient Tensor. Flow, turbulence and Combustion 62, 183–200. doi:10.1023/a:1009995426001
Oliveira, L. A., Lopes, A. G., Baliga, B. R., Almeida, M., and Viegas, D. X. (2014). Numerical Prediction of Size, Mass, Temperature and Trajectory of Cylindrical Wind-Driven Firebrands. Int. J. Wildland Fire 23, 698–708. doi:10.1071/wf13080
Rayleigh, L. (1876). LIII. On the Resistance of Fluids. Lond. Edinb. Dublin Phil. Mag. J. Sci. 2, 430–441. doi:10.1080/14786447608639132
Richards, P. J., Hoxey, R. P., Connell, B. D., and Lander, D. P. (2007). Wind-tunnel Modelling of the Silsoe Cube. J. Wind Eng. Ind. Aerodynamics 95, 1384–1399. doi:10.1016/j.jweia.2007.02.005
Richards, P. J., Hoxey, R. P., and Short, L. J. (2001). Wind Pressures on a 6m Cube. J. Wind Eng. Ind. Aerodynamics 89, 1553–1564. doi:10.1016/s0167-6105(01)00139-8
Rodi, W. (1998). Large-eddy Simulations of the Flow Past bluff Bodies: State-Of-The Art. JSME International Journal. Ser. B, Fluids Thermal Engineering 41, 361–374. doi:10.1299/jsmeb.41.361
Rosendahl, L. (2000). Using a Multi-Parameter Particle Shape Description to Predict the Motion of Non-spherical Particle Shapes in Swirling Flow. Appl. Math. Model. 24, 11–25. doi:10.1016/s0307-904x(99)00023-2
Sardoy, N., Consalvi, J. L., Kaiss, A., Fernandez-Pello, A. C., and Porterie, B. (2008). Numerical Study of Ground-Level Distribution of Firebrands Generated by Line Fires. Combustion and Flame 154, 478–488. doi:10.1016/j.combustflame.2008.05.006
Sardoy, N., Consalvi, J., Porterie, B., and Fernandezpello, A. (2007). Modeling Transport and Combustion of Firebrands from Burning Trees. Combustion and Flame 150, 151–169. doi:10.1016/j.combustflame.2007.04.008
Smagorinsky, J. (1963). General Circulation Experiments with the Primitive Equations. Mon. Wea. Rev. 91, 99–164. doi:10.1175/1520-0493(1963)091<0099:gcewtp>2.3.co;2
Song, J., Huang, X., Liu, N., Li, H., and Zhang, L. (2017). The Wind Effect on the Transport and Burning of Firebrands. Fire Technol. 53, 1555–1568. doi:10.1007/s10694-017-0647-1
Tarifa, C. S., del Notario, P. P., and Moreno, F. G. (1967). “Transport and Combustion of Fire Brands,”.
Tohidi, A., and Kaye, N. B. (2017a). Comprehensive Wind Tunnel Experiments of Lofting and Downwind Transport of Non-combusting Rod-like Model Firebrands during Firebrand Shower Scenarios. Fire Saf. J. 90, 95–111. doi:10.1016/j.firesaf.2017.04.032
Tohidi, A., and Kaye, N. B. (2017b). Stochastic Modeling of Firebrand Shower Scenarios. Fire Saf. J. 91, 91–102. doi:10.1016/j.firesaf.2017.04.039
Vreman, A. W. (2004). An Eddy-Viscosity Subgrid-Scale Model for Turbulent Shear Flow: Algebraic Theory and Applications. Phys. Fluids 16, 3670–3681. doi:10.1063/1.1785131
Werner, H., and Wengle, H. (1993). “Large-eddy Simulation of Turbulent Flow over and Around a Cube in a Plate Channel,” in Turbulent Shear Flows (Springer), 8, 155–168. doi:10.1007/978-3-642-77674-8_12
Yakhot, A., Orszag, S. A., Yakhot, V., and Israeli, M. (1989). Renormalization Group Formulation of Large-Eddy Simulations. J. Sci. Comput. 4, 139–158. doi:10.1007/bf01061499
Yin, C., Rosendahl, L., Knudsen Kær, S., and Sørensen, H. (2003). Modelling the Motion of Cylindrical Particles in a Nonuniform Flow. Chem. Eng. Sci. 58, 3489–3498. doi:10.1016/s0009-2509(03)00214-8
Nomencalture
α Angle of incidence
ϵ emmisitivity of the firebrand
ω Rotational velocity of the firebrand;
σ Stefan-Boltzmann constant
A Surface area of the firebrand
A Transformation matrix
a radius of a firebrand
h Reference height
l Length of the firebrand
n Total number of firebrands deposited
Keywords: firebrands, flow over a block, large eddy simulation, firebrand deposition, WUI fire, Lagrangian tracking
Citation: Mankame A and Shotorban B (2021) Deposition Characteristics of Firebrands on and Around Rectangular Cubic Structures. Front. Mech. Eng 7:640979. doi: 10.3389/fmech.2021.640979
Received: 12 December 2020; Accepted: 17 May 2021;
Published: 10 June 2021.
Edited by:
Naian Liu, University of Science and Technology of China, ChinaReviewed by:
Wei Tang, National Institute for Occupational Safety and Health (NIOSH), United StatesXinyan Huang, Hong Kong Polytechnic University, Hong Kong
Copyright © 2021 Mankame and Shotorban. This is an open-access article distributed under the terms of the Creative Commons Attribution License (CC BY). The use, distribution or reproduction in other forums is permitted, provided the original author(s) and the copyright owner(s) are credited and that the original publication in this journal is cited, in accordance with accepted academic practice. No use, distribution or reproduction is permitted which does not comply with these terms.
*Correspondence: Babak Shotorban, YmFiYWsuc2hvdG9yYmFuQHVhaC5lZHU=