 Adithya Challapalli
 John Konlan
 Dhrumil Patel
 Guoqiang Li
- 1Department of Mechanical and Industrial Engineering, Louisiana State University, Baton Rouge, LA, United States
- 2Department of Computer Science and Engineering, Louisiana State University, Baton Rouge, LA, United States
Cellular materials have been widely used in load carrying lightweight structures. Although lightweight increases natural frequency, low stiffness of cellular structures reduces natural frequency. Designing structures with higher natural frequency can usually avoid resonance. In addition, because of the less amount of materials used in cellular structures, the energy absorption capability usually decreases such as under impact loading. Therefore, designing cellular structures with higher natural frequency and higher energy absorption capability is highly desired. In this study, machine learning and novel inverse design techniques enable to search a huge space of unexplored structural designs. In this study, machine learning regression and Generative Neural Networks (GANs) were used to form an inverse design framework. Optimal cellular unit cells that surpass the performance of biomimetic structures inspired from honeycomb, plant stems and trabecular bone in terms of natural frequency and impact resistance were discovered using machine learning. The discovered optimal cellular unit cells exhibited 30–100% higher natural frequency and 300% higher energy absorption than those of the biomimetic counterparts. The discovered optimal unit cells were validated through experimental and simulation comparisons. The machine learning framework in this study would help in designing load carrying engineering structures with increased natural frequency and enhanced energy absorption capability.
Introduction
Lightweight structures such as lattice cored sandwich have been widely used in load bearing engineering structures such as fuselage and wing of aircraft, wind turbine blade, ship hull, bridge deck, offshore oil platform, etc. One concern with these lightweight structures persists in their resonance to dynamic load and vulnerability to impact load. Increasing the natural frequency to avoid resonance and enhancing energy absorption are viable ways to improve the performance of these lightweight structures. To this end, biomimetic design has been a driving force for discovering optimal lattice structures.
Biomimetic cellular structures inspired from nature such as honeycombs, plant stems, luffa-sponges, trabecular bones, muscles, beetle wings, etc., are widely studied for their excellent specific stiffness, strength, and energy absorption properties (Gibson and Ashby, 1997; Zhang et al., 2015; Xiyue and Fan, 2016; Tsang and Raza, 2018; Tsang et al., 2019; Yu et al., 2019; Challapalli and Li, 2020; Ha and Lu, 2020). Hexagon shaped cellular structures inspired from honeycombs have been extensively studied and optimized for their superior energy absorption capacities (Zhang et al., 2015). Different plant stems like bamboo, rice and square stems have been mimicked to design cylindrical rods with the buckling strength seven times higher than solid and hollow cylinders (Challapalli and Li, 2020; Ha and Lu, 2020). The hierarchical bio-cellular structure of luffa sponge with micro and macro pores is mimicked to manufacture foam cylinders reinforced by stiff thin-walled carbon fiber reinforced polymer (CFRP) tubes with good energy absorption properties (Xiyue and Fan, 2016). The hierarchical inner structures of tabular bones and muscles are taken as inspiration to design energy absorbing and impact resistant tubular sections that exhibited 176% increase in the energy absorption for the third order hierarchy compared to the first order (Tsang and Raza, 2018; Tsang et al., 2019). Highly efficient energy absorbent properties of beetle electra provide inspiration to design trabecular honeycomb structures that are five times better than conventional quadrilateral tubes used in the crash box beams of modern devices and vehicles (Yu et al., 2019). Frequency optimization of macroscopic structures is studied to be an important criterion to avoid destructive response (Zhang et al., 2020). Natural frequency is optimized by 40% to aid structures subjected to dynamic loading (Huang et al., 2010).
Apart from biomimicry of cellular structures, topology optimization has been widely used to propose and optimize novel cellular structures for superior performance in various applications (Huang et al., 2010; Huang et al., 2018; Zhang et al., 2020; Li et al., 2021; Lu and Tong, 2021). Inhomogeneous cellular materials with higher natural frequencies are designed using a multiscale topology optimization method (Zhang et al., 2020). Topology optimization is also used to optimize the microstructure orientation of cellular materials, cellular structures with zero Poisson’s ratio and non-uniform cellular structures (Huang et al., 2018; Li et al., 2021; Lu and Tong, 2021). One disadvantage of topology optimization is that it can only optimize an already existing structure by mass reduction or can only produce a few optimal structures based on the required criteria. It is believed that there exists a huge unexplored space of cellular structures that can perform better than their biomimetic counterparts. In our previous studies, we demonstrated inverse structural design techniques by using machine learning regression and Generative Neural Networks (GANs) to optimize several lightweight lattice unit cell structures with superior load carrying capacity compared to octet lattice unit cell (Challapalli et al., 2021). Machine learning techniques like forward regression with adequate training data can drastically reduce the computational time for calibrating the structural properties of cellular structures while GANs can be used to generate many new structures based on the training data. These machine learning techniques have been successfully used to assist the discovery of various new polymers, materials, and chemical compounds and predict structural properties (Aru et al., 2016; Chen et al., 2018; Wu et al., 2019; Challapalli et al., 2021; Challapalli and Li, 2021; Guo et al., 2021). Nonlinear relations in the polymer property predictions have been handled using Kernel Ridge Regression (KRR) that accelerates the discovery of new polymers (Aru et al., 2016). It has been studied and indicated that Gaussian Process Regression (GPR) is more suitable for predicting a better uncertain/confidence interval of polymers and their properties (Wu et al., 2019). GPR models have been used to predict the structural properties of lattice unit cells under uniaxial compression and assisted in their structural optimization, which exhibits 57% increase in the compression strength and 160% increase in their buckling strength (Challapalli and Li, 2021). The mechanical properties of cement have been predicted by using Support Vector Machines (SVM) which are found to be very effective in real value function estimation (Chen et al., 2018).
In this study, we implemented the inverse design framework similar to our previous study (Challapalli et al., 2021) to propose novel cellular structures that exhibit superior energy absorption properties compared to the widely accepted honeycomb structure and other biomimetic cellular structures. This was done by first considering a representative volume element (RVE) which can be used to form a huge datasets of new cellular structure designs. ANSYS workbench was initially used to create a dataset consisting of around 2,000 cellular unit cell structure designs to calibrate their mass, compression strength and natural frequencies. Using this training data set, forward regression models to estimate the structural properties and GANs to propose new designs were established. Finally, optimal cellular structures with superior natural frequencies and equivalent specific strength compared to biomimetic honeycomb structures were proposed by combining the GANs and forward regression models into an inverse design framework. Considering these structures, uniaxial compression, Dynamic Mechanical Analysis (DMA) and impact tests were conducted to compare their compression strength and energy absorption capacities. Detailed discussions on the methods used, results and validations are presented in the following sections.
Methods
Dataset Generation and Fingerprinting
Data generation and fingerprinting are crucial parts in any study involving machine learning application. In order to train a regression model to predict the mass, compression load and natural frequency of various cellular unit cells, a training dataset needs to be formed. In this study, the structures in focus are thin-wall cellular unit cell structures that exhibit higher natural frequencies compared to honeycomb and other biomimetic structures. The height of all the unit cells and their wall thickness is constant for simplicity in generating new designs. A representative volume element (RVE) as shown in Figure 1A with 9 vertices is formed in a 2D format. Using vertices of the RVE, several lines can be drawn connecting any two neighboring vertices. Combining a few lines that connect different neighboring vertices will form a quarter of the unit cell. Now by mirroring this combination of lines in horizontal and vertical axis can form a 2D image. By assigning thickness to the lines and extruding them in the third dimension form a full 3D unit cell.
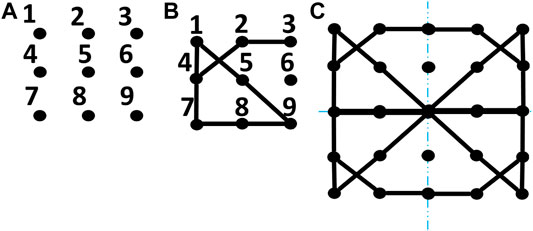
FIGURE 1. (A) Representative volume element (RVE), (B) quarter of the cellular structure design formed using the RVE and (C) complete cellular structure formed by mirroring the RVE in horizontal and vertical axis (top view).
Fingerprinting is the process of converting the designs into a consistent machine-readable format. Since all the designs are formed by mirroring the RVE in horizontal and vertical axis and have the same wall thickness and height, these features do not contribute to the machine learning process and can be omitted from the fingerprints. This reduces the fingerprinting process to the initial RVE which only consists of thin lines connecting the 9 vertices in the 3 by 3 matrix. For the fingerprinting, all the vertices are named from 1 to 9 and each line formed by connecting the neighboring vertices is named after the two vertices it connects. Now the fingerprint of a single unit cell is formed by combining the names of all the lines forming that unit cell. For example, in Figure 1B the lines connecting vertices 1 and 4, 1 and 5, and 2 and 4 are named as 14, 15 and 24, respectively. The rest of the lines are named in a similar manner and the combination of all the line names (14 15 23 24 47 59 78 89) will be the fingerprint of a single unit cell. While designing the unit cell for numerical simulations, the fingerprint design from the RVE is mirrored into the horizontal and vertical axis to form a complete unit cell as stated earlier. Using this fingerprinting process, a design can be easily inferred from a fingerprint, or a design can be easily converted into a fingerprint. For forward regression and inverse design, these fingerprints are further converted into a vector of 1’s and 0’s for more accurate machine learning predictions. This is done by assigning a 20-vector space (12 14 15 23 24 25 26 35 36 45 47 48 56 57 58 59 68 69 78 89) for all the possible lines of the RVE in a vector and by placing “1” in the vector if a particular fingerprint consists of that line and by placing “0s” in the rest of the spaces. For example, the final fingerprint of the design in Figure 1B will be of the form (0 1 1 1 1 0 0 0 0 0 1 0 0 0 0 1 0 0 1 1). Consistent boundary conditions should be set for generating all the data points and the same technique should be adopted to fingerprint all the designs for logical forward regression and inverse design.
Forward Regression
Once the data generation and fingerprinting process is ready, a training dataset of 2,000 fingerprints are considered to train machine learning models for forward regression (Refer to Supplementary Material Table 1 for training dataset fingerprints). ANSYS workbench tools are used to predict the mass, load, and first natural frequency of each fingerprint under uniaxial compression from the training dataset (Refer to Supplementary Material S7, S8 for numerical simulations). As discussed earlier, natural frequency plays a prominent role in dynamic structural loading (Huang et al., 2010). Here only the first natural frequencies of the cellular unit cells are considered as the rest of the natural frequencies follow similar trend as the first one and it simplifies the regression process. MATLAB regression analysis tool (MATLAB, 2020) is used to test the accuracy of various regression models like ensemble trees, Gaussian Process Regression (GPR) and Support Vector Machines (SVM) to predict the mass, maximum load, and natural frequency of new cellular structures. The quadratic SVM model was able to do the mass predictions with a root mean squared error (RMSE) of 0.0048 Kg while the GPR models gave the best accuracy in predicting the maximum load and natural frequency of cellular unit cell structures with a RMSE of 0.16628 N and 0.8031 Hz, respectively. Figure 2 shows the prediction vs. response plots for the best performing regression models. The roughly symmetric scattering of the points along the diagonal line implicates good models.
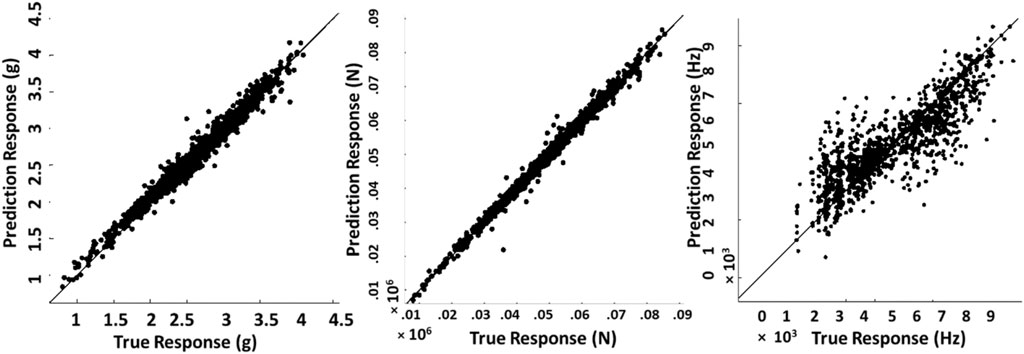
FIGURE 2. True Vs. Prediction responses of mass (Quadratic SVM), load (Cubic GPR) and natural frequency (Rational quadratic GPR) from left to right respectively.
Though the forward regression models exhibit good results and can be used to estimate the structural properties of the cellular unit cells within a very short period and minimal computational effort, it is hard to pick the desired optimal structures from the datasets consisting of hundreds of thousands of designs. Handling huge datasets and manually filtering them are not ideal. Hence, GANs are used to generate optimal structures that consists of the desired properties. An inverse design framework constructed using GANs, forward regression and training datasets to generate optimal cellular unit cells based on their natural frequency is presented in the next section.
Optimization Through Inverse Design
Once the best regression models are identified, an inverse design framework is developed, which is able to predict optimal cellular unit cells compared to honeycomb unit cell and to predict unit cells with desired structural properties. The inverse design framework is constructed by combining GANs with forward regression and other desired boundary conditions. GANs are a type of machine learning technique that is formed by combining two neural networks. A generative neural network that generates random noise and feeds it to the discriminator that trains on the input data to discriminate fake data from the generator that doesn’t match the input data. These two neural networks iteratively train until the discriminator couldn’t distinguish fake or real data, i.e., the generator neural network only generates data that is very close to the input data fed to the discriminator. GANs have been used widely. For example, GANs were used to produce 121 new crystalline porous materials by considering energy and material dimensions (Kim et al., 2020). GANs have also been used to discover new meta-surfaces with better control over optical properties of light (Liu et al., 2018). A novelty of 92.83% is achieved in designing new materials using GANs in which 84.5% percentage of the samples are chemically valid (Dan et al., 2020). GANs have been successfully used to design complex architecture porous materials with Hashin-Shtrikman upper bounds on isotropic elastic stiffness (Mao et al., 2020). The mechanical response of non-uniform geometrical patterns is predicted by using a DNN (Deep Neural Network) system with an NMSE (Normalized Mean Square Error) of 0–0.3 (Ma et al., 2020). In this study, to train the GAN system, a subset of 300 cellular unit cells that have better natural frequency as compared to honeycomb unit cell are extracted from the initial training dataset and are fed to the discriminator of the GAN system. The discriminator iteratively trains with the generator until the generator generates new fingerprints that are very similar but not the same as the subset of cellular unit cells fed to the discriminator. Thus, new untrained fingerprints are generated using the GANs and the cellular unit cell properties like the mass and natural frequency are predicted using the forward regression models. Combined, the inverse design framework consists of GANs, forward regression models, initial conditions, and boundary conditions. Design constraints like the required mass, maximum load or natural frequency can be set as the boundary conditions to generate new cellular unit cells with desired structural properties. The input to this framework will be the desired properties in a cellular unit cell in the form of boundary conditions and the output will be a set of novel cellular unit cells as shown in Figure 3. Here, to predict optimal cellular unit cells that perform better than biomimetic cellular structures, honeycomb unit cell structural properties are set as boundary conditions along with the regression models. Novel optimal cellular unit cell fingerprints that have higher natural frequencies without compromising the mass and strength compared to the honeycomb unit cell are generated using the inverse design framework. Simulation comparisons for natural frequencies of the proposed models are presented in the following sections.
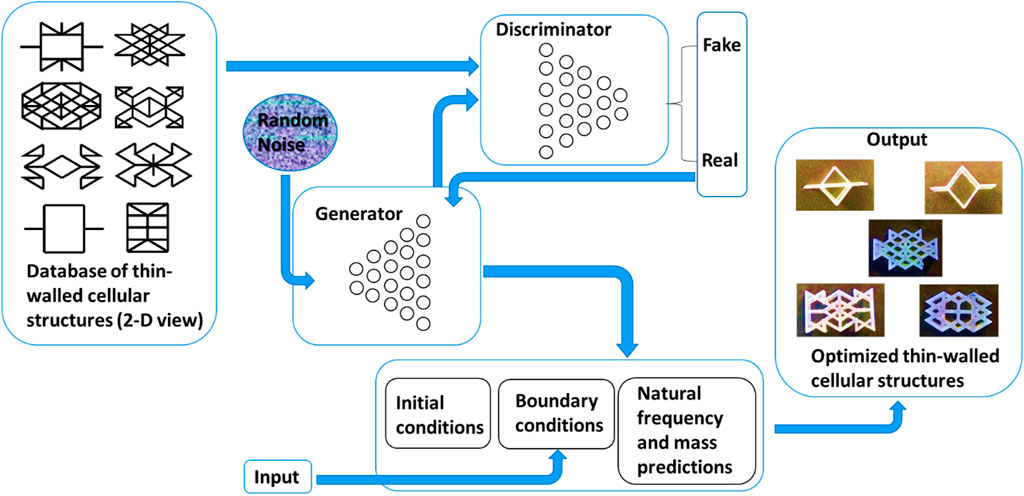
FIGURE 3. Framework for inverse design of optimal cellular unit cells. Step 1. The GAN system is trained to generate novel cellular unit cell fingerprints. Step 2. Desired properties (high natural frequency, low mass) are fed as inputs to the boundary conditions. Step 3. The newly generated fingerprints from the GAN system are passed through the boundary conditions and forward regression model for mass and natural frequency predictions. Step 4. Optimal cellular unit cell fingerprints that satisfy the boundary conditions are produced.
Uniaxial Compression
A few fingerprints of optimal cellular unit cell structures based on their superior performance in natural frequency compared to honeycomb structured unit cell are selected to observe their uniaxial compression behavior. These structures are designed into 3D models using a CAD design software (Solidworks (BIOVIA, 2021)). All the 3D models were converted into STL files and are 3D printed using a stereolithographic 3D printer and photopolymer procured from Formlabs as shown in Figure 4A (Refer to S1 for material properties). Figure 4B shows a specimen under uniaxial compression test. After postprocessing, a Q-TEST 150 machine is used to conduct uniaxial compression tests on all the samples. The maximum load before failure for each sample is recorded for comparisons and validations. ANSYS design modeler and simulation software were used for the numerical analysis. The 3D models from Solidworks were converted into XML format and imported to the ANSYS design (ANSYS, 2021) modeler for pre-processing. The bulk material properties like the density, Poisson’s ratio, and stress—strain curves from uniaxial compression were uploaded directly into the software. These bulk material properties are obtained from the uniaxial compression test of 3D printed cylinders (12.7 × 12.7 × 25.4) by following the ASTM D695-15 standard (ASTM D695-15, 2015) for 3D printable polymers. Constant printing orientation for calibrating the material properties and manufacturing the cellular structures is followed. A mesh convergence test is conducted for the design to obtain consistent results without too much affecting the computational time (Refer to Supplementary Materials S1, S9 for details).
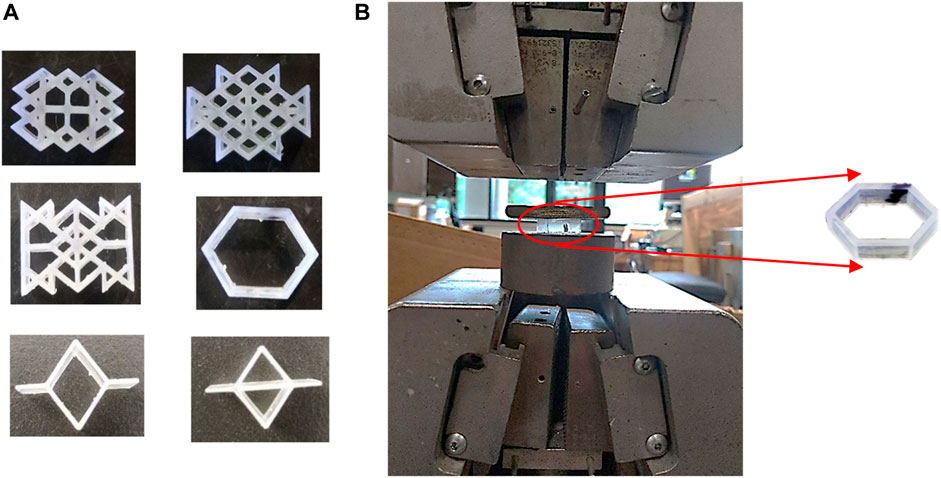
FIGURE 4. Additively manufactured (A) cellular unit cells and (B) Uniaxial compression.
Dynamic Compression Analysis
To observe the behavior of the proposed unit cells under cyclic loading, several designs were 3D printed using the same SLA printer and clear photopolymer mentioned in the uniaxial compression section. An RSA-G2 Dynamic Mechanical Analyzer is used to conduct dynamic analysis on all the specimens at a constant room temperature with varying frequency as shown in Figure 5. The storage modulus, loss modulus and damping (tan (delta)) properties of the specimen are obtained for an angular frequency range of 1–62 rad/s (0.16–10 Hz) and 0.125% strain under compression (Refer to S10 (c) for theoretical background). All the specimens are designed to have similar overall volume (2 mm × 1.2 mm × 1.15 mm).
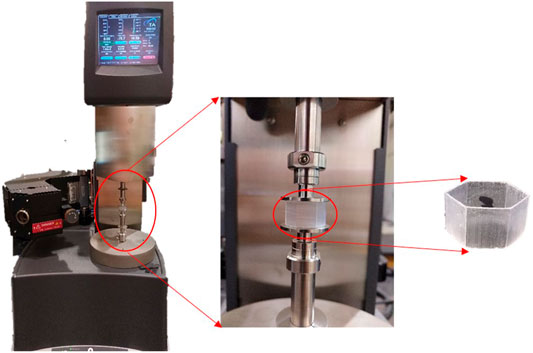
FIGURE 5. RSA-G2 Dynamic Mechanical Analyzer with honeycomb unit cell specimen.
Impact Test
The optimal cellular unit cells obtained through inverse design framework are used to fabricate cellular core sandwich structures. Extrusion based 3D printing is used to manufacture all the samples using PLA as raw material as shown in Figure 6B. Instron Dynatup 8250 H V impact tester was used to conduct the low velocity impact tests with a hammer weight of 11.2 kg and impact velocity of 2 m/s (Konlan et al., 2020) as shown in Figure 6A. Solidworks is used to design all sandwich structures and ANSYS LS-DYNA was used to conduct the explicit non-linear finite element simulations of the low velocity impact tests. The sandwich structures are designed to be of the same overall volume (120 mm × 25.4 mm × 4 mm).
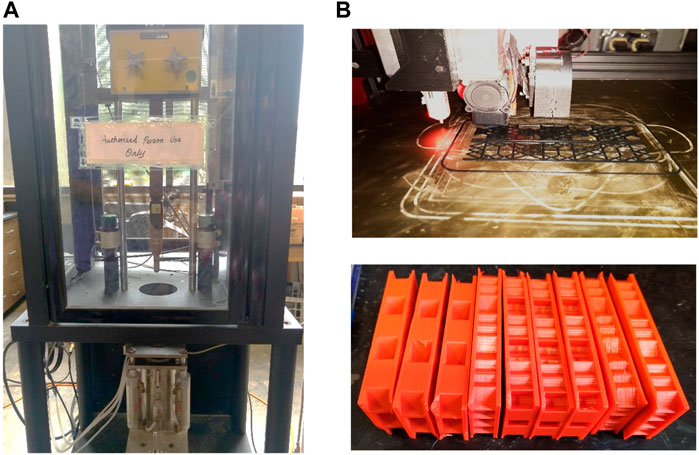
FIGURE 6. (A) Instron Dynatup impact tester, (B) Extrusion based 3D printer (upper right), Additively manufactured of sandwich structures (lower right).
Theoretical Background
Vibration Theory of Cellular Structures
To evaluate the natural frequencies of the cellular unit cells, the structures are assumed to have constant stiffness and mass with no damping, time varying force, displacement or pressures applied. The natural circular frequency
where
From Eq. 1, it can be observed that the natural frequency of a structure depends upon the effective properties of the structure and mass. To calibrate the effective properties of the cellular structures, the computational homogeneous technique (CHT) based on the Hooke’s law (Autar, 2006; Cheng et al., 2017) has been used and proved to be effective. Based on the CHT, the generalized Hooke’s law can be used to determine the stiffness matrix of cellular unit cells. In this study, all the unit cells are designed with a twofold rotational symmetry. Hence the Hooke’s law will be of the form (Refer to Supplementary Material S10B for background),
here
From the above model (Refer to Supplementary Material S10B for more details on CHT) it can be observed that the stiffness properties of the cellular unit cells depend on the geometry of individual unit cell as
where
Since the training dataset in this study consists of several complex designs, it is hard and time consuming to adopt these models for each design. Hence, numerical simulation was adopted to generate the training dataset. Further, the machine learning regression models were trained and they were much faster and simpler than the theoretical model in predicting the structural properties.
Machine Learning Models
In this study, MATLAB regression learner toolbox was used to predict the mass, load, and natural frequency of each cellular unit cell in this study. Support Vector Regression models (SVM) were used to predict the mass values of the cellular structures. SVM model tries to find a best hyperplane that fits within a threshold value rather than trying to minimize the error between real and predicted values. The MATLAB toolbox implements the inbuilt linear epsilon-insensitive SVM
where
The Gaussian Process Regression (GPR) model used to predict the load and natural frequency is a kernel-based probabilistic model. A set of random latent variables for which any finite number of them have a Gaussian distribution is used by the GPR models to get the response. The function for the GPR model is as follows (Rasmussen and Williams, 2006):
where
Results
Natural Frequency
ANSYS workbench—design modeler is used to design the cellular structures and the model analysis tool using mechanical APDL solver is employed to simulate the natural frequency of each cellular unit cell with fixed support on one end and uniform displacement of 20% on the other end for all the designs. The optimized unit cells are compared for their natural frequency. The comparisons are made by designing several unit cells with varying wall thickness and the calibrated normalized first natural frequencies. Here, honeycomb unit cells are considered as the datum structure, hence the normalized natural frequencies are calculated with the following equation:
where
It can be seen from Figure 7 that the normalized natural frequency of the optimized cellular unit cells is about 10–50% higher than the biomimetic unit cells like honeycomb, bamboo and trabecular bone structures that are widely studied for their high natural frequency and energy absorption properties. The honeycomb structure can be seen to perform better than other biomimetic structures like the bamboo stem and trabecular bone within the same overall volume. It is seen that, within the same mass range, Models 1 to 4 all have higher natural frequency than that of the biomimetic counterparts. Once the mass exceeds about 2g, Model 5 also shows higher natural frequency (Refer to Supplementary Material S2A for Mass vs. Load and Supplementary Material S2B for Mass vs. Natural Frequency comparisons). The higher natural frequency makes Models 1 to 5 better choice as cellular unit cells. Hence these structures are considered for further experimental and simulation validations to observe their behavior under uniaxial compression, DMA, and impact tests.
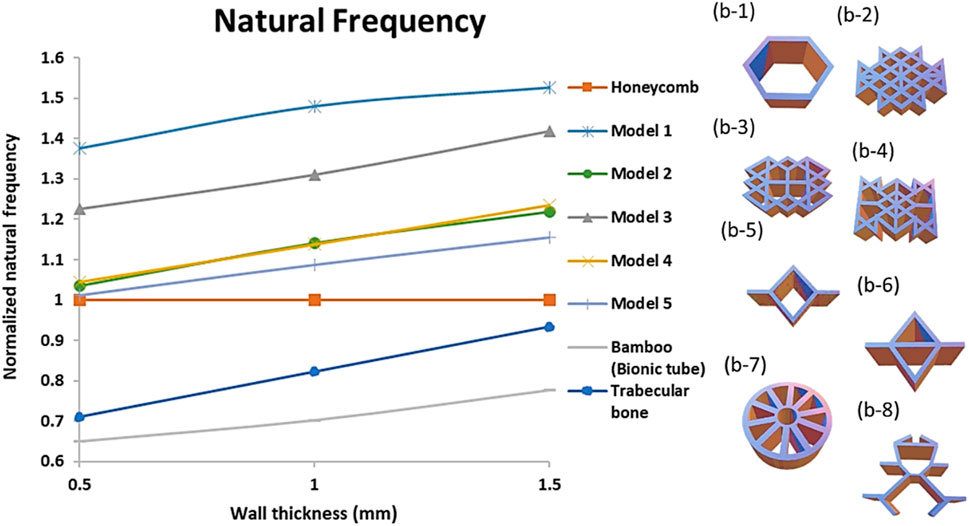
FIGURE 7. Numerical simulations for Wall thickness versus Normalized natural frequency of optimal cellular unit cells compared with biomimetic cellular unit cells, (b-1) Honeycomb, (b-2) Model 1, (b-3) Model 2, (b-4) Model 3, (b-5) Model 4, (b-6) Model 5, (b-7) Bamboo (Bionic tube) and (b-8). Trabecular bone.
Experimental and Simulation Validation for Uniaxial Compression of Optimal Cellular Unit Cells
Figure 8 shows the performance of the optimized cellular unit cells in terms of normalized load plotted with changing wall thickness compared with honeycomb structure. Here, the wall thickness on the x-axis is incremented for all the designs identically.
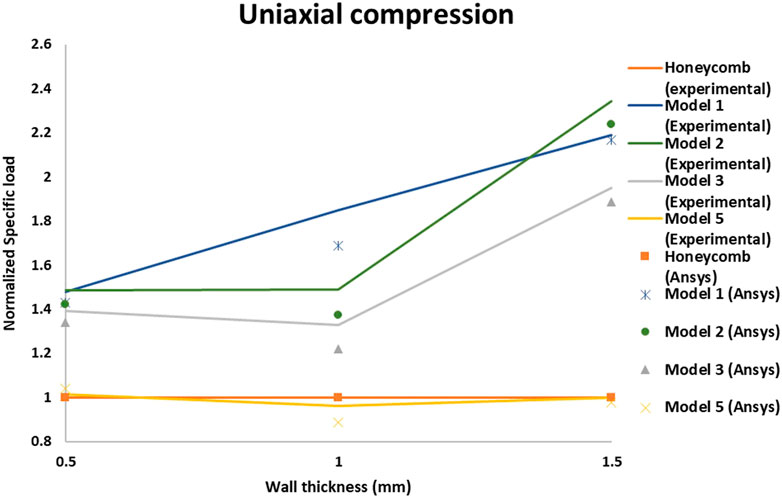
FIGURE 8. Experimental and simulation Wall Thickness versus Normalized Specific load comparison for several cellular structures under uniaxial compression.
Here,
Hence, the normalized loads of honeycomb unit cells appear to be 1 for all the wall thicknesses and the performance of the optimal cellular unit cells can be clearly seen to be ranging from 50–250% better than honeycomb unit cell, except for Model 5. The experimental and simulation results can be seen to be in good agreement and the slight difference can be attributed to the minor imperfections in the 3D printed parts caused during the support removal process or part handling. It can be observed that the load range of optimal cellular unit cells like Models 1, 2 and 3 is much higher compared to honeycomb unit cell with the same overall volume and wall thickness. From Supplementary Material S2, the Mass vs. Load comparisons, it is seen that the optimal unit cells can be designed with much wider range of mass, as compared to the honeycomb unit cell. It is known that the natural frequency is inversely proportional with the square root of the mass. Here we show in Supplementary Material S2 that the optimal unit cells with higher mass have higher natural frequency, instead of lower natural frequency. The reason is that the stiffness for these optimal unit cells grows faster than the increase in mass, leading to increasing natural frequency. Supplementary Material S3 shows Porosity vs. Normalized load comparisons. It is seen that within the same porosity range from 90 to 98%, the optimal unit cells have higher load carrying capacity than the honeycomb unit cell, except for Model 1 when the porosity is 90%. From Supplementary Material S2, it is observed that within the same mass range about 0.2–0.4 g, all the optimal cellular unit cells perform similar to the honeycomb structures under uniaxial compression.
DMA Test Results
Figure 9A shows the storage modulus of different optimized cellular structures compared to honeycomb structures with frequency sweep at room temperature. It can be observed that the storage modulus of the cellular structures trend to gradually increase with higher frequency. Figure 9B shows the variations in normalized tan (delta) with wall thicknesses for different optimal cellular unit cell designs compared to honeycomb unit cell. The normalized tan (delta) in Figure 9B is obtained in a similar manner to the normalized specific load in the uniaxial compression comparisons.
where
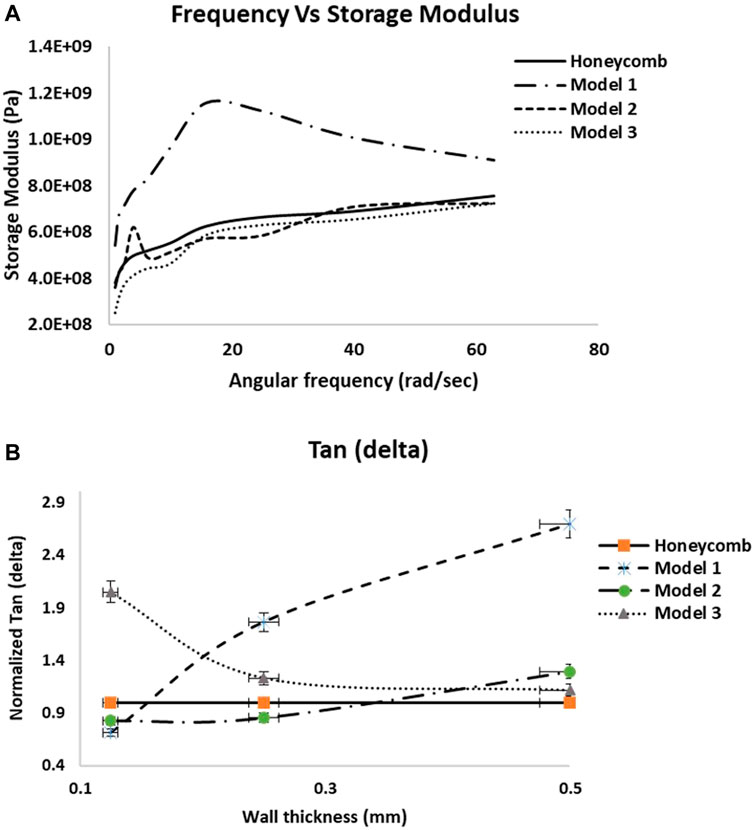
FIGURE 9. (A) Storage modulus plotted with angular frequency, (B) Normalized Tan (delta) plotted with Wall thickness for different cellular structures.
The optimal cellular unit cells like Models 1, 2 and 3 can be seen to perform decently in comparison to honeycomb unit cell in terms of tan (delta). It can be observed that all the structures follow similar trends and the storage modulus and tan (delta) increase with mass and frequency, except Model 1 in storage modulus and Model 3 in tan (delta). With the same overall volume, structures like Model 1 and Model 2 exhibit a wider range of damping properties because of their higher natural frequencies and mass (Refer to Supplementary Material S4A,B for storage modulus and tan (delta) comparisons).
Simulation and Experimental Results of Low Velocity Impact Tests
The optimal unit cells proposed through the inverse design are tested for their energy absorption capacities. The normalized energy for impact energy comparisons is calculated by,
where
It can be seen from Figure 10A that the optimal cellular structures when oriented flat (i.e., the walls of the structures perpendicular to surface) perform 300–800% better than honeycomb structure in terms of normalized energy (Refer to Supplementary Material S8 for numerical impact test comparisons). This is due to the huge voids (porosity) in the honeycomb structures unlike the optimal cellular unit cells which mostly have weblike designs that can cover the impact region of the sandwich structure. In vertical orientations (i.e., the walls of the structures parallel to surface), it is observed that the optimal structures perform 50–350% of the honeycomb structure (Figure 10B). Experimental tests (Figure 10C) conducted on sandwich structures made of the optimal cellular lattice core shows the superior performance of the optimal cellular structures. The gradual decline can be noticed in the normalized energies of the optimal sandwich panels with the increase in wall thickness of the unit cells in Figure 10C. The reason behind this is, as the wall thickness of the unit cells increases, the mass of the structures also increases. Since the impact is localized at the central unit cell of the sandwich structure, the mass increase in the rest of the unit cells within the sandwich structure do not contribute to the overall performance (normalized energy) of the sandwich structure. As a result, this increase in the mass of the sandwich structure affects the normalized energy when compared with wall thickness. More comparison relative to mass can be seen in Supplementary Material S5. The experimental results for the impact test in vertical orientation are not presented in this study because the optimization through machine learning is only done with the unit cells in flat orientation. The difference in the normalized energies between the numerical and experimental analysis in the flat direction (Figures 10A, C) is due to the number of unit cells used in the sandwich structures in both the methods. Only a single cellular unit cell is used in the analytical study to compensate for the computational time and power of the dynamic analysis, while multiple unit cells are used in the experimental study to meet the minimum dimensional requirements for specimens (120 mm × 25.4 mm × 4 mm) when using the impact testing machine.
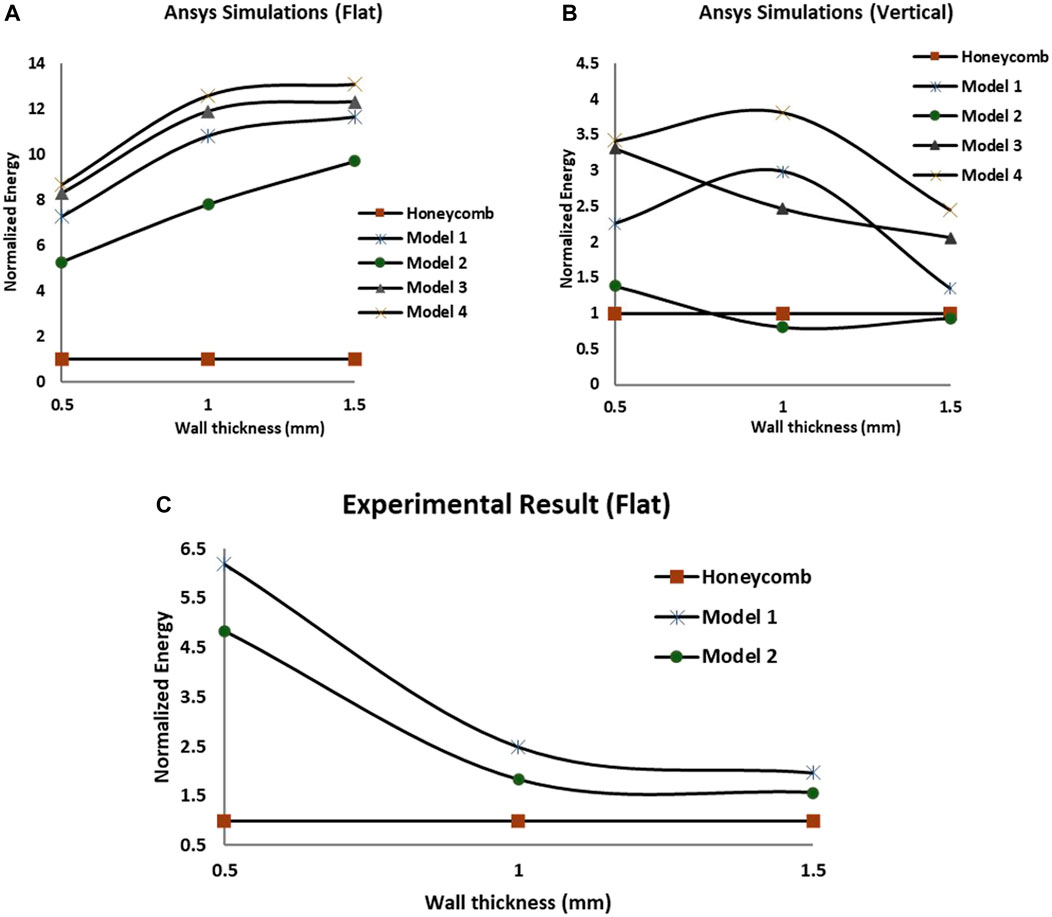
FIGURE 10. Numerical simulations for low velocity impact test on various optimal cellular structures in (A) flat, (B) vertical orientations and (C) experimental results in flat orientation.
Conclusion
New inverse machine learning technique to design optimal cellular unit cells that perform better than biomimetic structures is proposed. Through this technique, a vast unexplored space of optimal designs (nearly 750,000) was explored to propose novel designs with superior structural properties. The optimal cellular unit cells proposed through this technique exhibit 30–100% higher normalized natural frequencies, 50–250% better normalized load carrying capacity, and 300% better normalized impact energy absorption compared to biomimetic honeycomb structures. The machine learning discovered unit cells are validated by both numerical simulation and experimental testing. We believe that the inverse machine learning framework would be a strong design tools for discovering other types of structures.
Data Availability Statement
The original contributions presented in the study are included in the article/Supplementary Material, further inquiries can be directed to the corresponding author.
Author Contributions
AC contributed towards data generation, structural design, and analysis and wrote the manuscript. JK contributed towards the experimental impact testing. DP contributed towards coding for the inverse framework. GL initiated the conception, raised funding for the work, guided the research, and revised the manuscript.
Funding
This work is supported by the US National Science Foundation under grant number OIA-1946231 and the Louisiana Board of Regents for the Louisiana Materials Design Alliance (LAMDA), National Science Foundation under grant number 1736136, and NASA cooperative agreement NNX16AQ93A under contract number NASA/LEQSF (2016-19)-Phase3-10.
Conflict of Interest
The authors declare that the research was conducted in the absence of any commercial or financial relationships that could be construed as a potential conflict of interest.
Publisher’s Note
All claims expressed in this article are solely those of the authors and do not necessarily represent those of their affiliated organizations or those of the publisher, the editors, and the reviewers. Any product that may be evaluated in this article, or claim that may be made by its manufacturer, is not guaranteed or endorsed by the publisher.
Supplementary Material
The Supplementary Material for this article can be found online at: https://www.frontiersin.org/articles/10.3389/fmech.2021.779098/full#supplementary-material
References
ANSYS (2021). Academic Research Mechanical. 19.1. Available at: https://www.ansys.com/en-in/academic.
Aru, M., Ghanshyam, P., Tran, D. H., Turab, L., and Rami, R. (2016). Machine Learning Strategy for Accelerated Design of Polymer Dielectrics. Scientific Rep. 6, 20952. doi:10.1038/srep20952
ASTM D695-15 (2015). Standard Test Method for Compressive Properties of Rigid Plastics. West Conshohocken, PA: ASTM International.
Challapalli, A., and Li, G. (2020). 3D Printable Biomimetic Rod with superior Buckling Resistance Designed by Machine Learning. Sci. Rep. 10, 20716. doi:10.1038/s41598-020-77935-w
Challapalli, A., and Li, G. (2021). Machine Learning Assisted Design of New Lattice Core for Sandwich Structures with Superior Load Carrying Capacity. Sci. Rep. 11, 18552. doi:10.1038/s41598-021-98015-7
Challapalli, A., Patel, D., and Li, G. (2021). Inverse Machine Learning Framework for Optimizing Lightweight Metamaterials. Mater. Des. 208, 109937. doi:10.1016/j.matdes.2021.109937
Chen, H., Qian, C., Liang, C., and Kang, W. (2018). An Approach for Predicting the Compressive Strength of Cement-Based Materials Exposed to Sulfate Attack. PLoS ONE 13, e0191370. doi:10.1371/journal.pone.0191370
Cheng, Q., Zhidong, G., Siyuan, J., and Zeng, Li. (2017). A Method of Determining Effective Elastic Properties of Honeycomb Cores Based on Equal Strain Energy. Chin. J. Aeronautics 30, 2. doi:10.1016/j.cja.2017.03.016
Dan, Y., ZhaoLi, Y., Li, X., Li, S., Hu, M., and Hu, J. (2020). Generative Adversarial Networks (GAN) Based Efficient Sampling of Chemical Composition Space for Inverse Design of Inorganic Materials. Npj Comput. Mater. 6, 84. doi:10.1038/s41524-020-00352-0
Gibson, L. J., and Ashby, M. F. (1997). Cellular Solids: Structure and Properties. 2nd ed. Cambridge, MA: Cambridge University Press.
Guo, K., Yang, Z., Yu, C.-H., and Buehler, M. J. (2021). Artificial Intelligence and Machine Learning in Design of Mechanical Materials. Mater. Horiz. 8, 1153–1172. doi:10.1039/d0mh01451f
Ha, N. S., and Lu, G. (2020). A Review of Recent Research on Bio-Inspired Structures and Materials for Energy Absorption Applications. Composites B: Eng. 181, 107496. doi:10.1016/j.compositesb.2019.107496
Huang, J., Zhang, Q., Scarpa, F., Liu, Y., and Leng, J. (2018). Multi-stiffness Topology Optimization of Zero Poisson's Ratio Cellular Structures. Composites Part B: Eng. 140, 35–43. doi:10.1016/j.compositesb.2017.12.014
Huang, X., Zuo, Z. H., and Xie, Y. M. (2010). Evolutionary Topological Optimization of Vibrating Continuum Structures for Natural Frequencies. Comput. Structures 88, 357–364. doi:10.1016/j.compstruc.2009.11.011
Kim, B., Lee, S., and Kim, J. (2020). Inverse Design of Porous Materials Using Artificial Neural Networks. Sci. Adv. 6, eaax9324. doi:10.1126/sciadv.aax9324
Konlan, J., Mensah, P., Ibekwe, S., Crosby, K., and Li, G. (2020). Vitrimer Based Composite Laminates with Shape Memory alloy Z-Pins for Repeated Healing of Impact Induced Delamination. Composites Part B: Eng. 200, 108324. doi:10.1016/j.compositesb.2020.108324
Li, Q., Xu, R., Wu, Q., and Liu, S. (2021). Topology Optimization Design of Quasi-Periodic Cellular Structures Based on Erode-Dilate Operators. Comp. Methods Appl. Mech. Eng. 377, 113720. doi:10.1016/j.cma.2021.113720
Liu, Z., Zhu, D., RodriguesLee, S. P., Lee, K.-T., and Cai, W. (2018). Generative Model for the Inverse Design of Metasurfaces. Nano Lett. 18, 6570–6576. doi:10.1021/acs.nanolett.8b03171
Lu, Y., and Tong, L. (2021). Concurrent Topology Optimization of Cellular Structures and Anisotropic Materials. Comput. Structures 255, 106624. doi:10.1016/j.compstruc.2021.106624
Ma, C., Zhang, Z., Luce, B., Pusateri, S., Xie, B., Rafiei, M., et al. (2020). Accelerated Design and Characterization of Non-uniform Cellular Materials via a Machine-Learning Based Framework. npj Comput. Mater. 6, 1–8. doi:10.1038/s41524-020-0309-6
Mao, Y., He, Q., and Zhao, X. (2020). Designing Complex Architectured Materials with Generative Adversarial Networks. Sci. Adv. 6, eaaz4169. doi:10.1126/sciadv.aaz4169
Rasmussen, C. E., and Williams, C. K. I. (2006). Gaussian Processes for Machine Learning. Cambridge, Massachusetts: MIT Press.
Singiresu, S., R. (2018). Mechanical Vibrations. Sixth edition. United Kingdom: Peasrson Education Limited.
Tsang, H. H., and Raza, S. (2018). Impact Energy Absorption of Bio-Inspired Tubular Sections with Structural Hierarchy. Compos. Structures 195, 199–210. doi:10.1016/j.compstruct.2018.04.057
Tsang, H. H., Tse, K. M., Chan, K. Y., Lu, G., and Lau, A. K. T. (2019). Energy Absorption of Muscle-Inspired Hierarchical Structure: Experimental Investigation. Compos. Structures 226, 111250. doi:10.1016/j.compstruct.2019.111250
Wu, S., Kondo, Y., Kakimoto, M.-a., Yang, B., Yamada, H., Kuwajima, I., et al. (2019). Machine-learning-assisted Discovery of Polymers with High thermal Conductivity Using a Molecular Design Algorithm. Npj Comput. Mater. 5, 66. doi:10.1038/s41524-019-0203-2
Xiyue, A., and Fan, H. (2016). Hybrid Design and Energy Absorption of Luffa-sponge-like Hierarchical Cellular Structures. Mater. Des. 106, 247–257.
Yu, X., Pan, L., Chen, J., Zhang, X., and Wei, P. (2019). Experimental and Numerical Study on the Energy Absorption Abilities of Trabecular-Honeycomb Biomimetic Structures Inspired by Beetle Elytra. J. Mater. Sci. 54, 2193–2204. doi:10.1007/s10853-018-2958-0
Zhang, Q., Yang, X., Li, P., Huang, G., Feng, S., Shen, C., et al. (2015). Bioinspired Engineering of Honeycomb Structure - Using Nature to Inspire Human Innovation. Prog. Mater. Sci. 74, 332–400. doi:10.1016/j.pmatsci.2015.05.001
Keywords: cellular structures, optimization, machine learning, Gans, inverse design, natural frequency, energy absorption, 3D printing
Citation: Challapalli A, Konlan J, Patel D and Li G (2021) Discovery of Cellular Unit Cells With High Natural Frequency and Energy Absorption Capabilities by an Inverse Machine Learning Framework. Front. Mech. Eng 7:779098. doi: 10.3389/fmech.2021.779098
Received: 17 September 2021; Accepted: 15 November 2021;
Published: 30 November 2021.
Edited by:
Xin-Lin Gao, Southern Methodist University, United StatesReviewed by:
Haifeng Zhao, Chinese Academy of Sciences (CAS), ChinaNan Hu, South China University of Technology, China
Copyright © 2021 Challapalli, Konlan, Patel and Li. This is an open-access article distributed under the terms of the Creative Commons Attribution License (CC BY). The use, distribution or reproduction in other forums is permitted, provided the original author(s) and the copyright owner(s) are credited and that the original publication in this journal is cited, in accordance with accepted academic practice. No use, distribution or reproduction is permitted which does not comply with these terms.
*Correspondence: Guoqiang Li, bGd1b3FpMUBsc3UuZWR1