 S. N. Mat Saliah†
 N. Md Nor*
- Centre for Civil Engineering Studies, Universiti Teknologi MARA Cawangan Pulau Pinang, Pulau Pinang, Malaysia
Today, the use of a non-destructive technique to assess the integrity of reinforced concrete structures strengthened with carbon fibre-reinforced polymer (CFRP) is becoming increasingly important. It is highly important to assess the behaviour of the structure under load. This paper presents the evaluation of a reinforced concrete beam laminated with CFRP at the soffit using the acoustic emission technique. Two types of beams were made, a normal reinforced concrete beam and a reinforced concrete beam laminated with CFRP. CFRP was used to reinforce the bottom part of the beam. The beams were subjected to three-point loading and loaded to failure. During the loading tests, the integrity of the beams was monitored using the acoustic emission technique, and the crack patterns were observed visually. The intensity analysis was carried out on two sensors, designated as CH6 and CH7. CH6 and CH7 were located on top of the beam. Based on the intensity analysis of the acoustic emissions, five intensity crack zones were identified, namely zone A-no crack, zone B-minor, zone C-intermediate, zone D-follow up and zone E-major. With increasing load, which tended to progress the crack modes in the beam, the plots in the intensity zones developed for each crack mode from zone A to zone E. The crack progression matched well with the plots in the intensity zones. Using the intensity zones enables the early detection and prediction of damage.
1 Introduction
Nowadays, carbon fibre-reinforced polymer (CFRP) is widely used to strengthen or retrofit reinforced concrete (RC) structures due to their high tensile strength, light weight, elastic modulus, corrosion resistance and ease of installation. Morsy and Mahmoud (Morsy and Mahmoud, 2013) found that externally bonding CFRP is an effective method of strengthening an RC beam and improving its structural capacity. They found that CFRP can delay failure until the overall functioning of the lamination, which carries most of the tensile strength, and before compressive failure of the concrete occurs. Wan Ahmad et al. (Wan Ahmad and Md Nor, 2016) found that CFRP can increase the strength of a beam compared to an unreinforced beam. Generally, CFRP sheets are externally bonded to the tensile part of a beam, which leads to failure of the RC beams. This failure is usually due to the fracturing and debonding of the CFRP. It is also due to the load exceeding the maximum capacity. Since the CFRP is reinforced at the surface of a beam, it is difficult to investigate the occurrence of cracks in the beam. The debonding process of the CFRP sheet from the beam surface is very difficult to access. This CFRP debonding significantly affects the beam integrity. Therefore, reliable monitoring techniques are needed to assess the structural integrity of RC beams reinforced with CFRP sheets.
The assessment of crack modes for RC beams has been extensively investigated by Funaria and Verre (Funari and Verre, 2021). However, the crack modes of RC beams strengthened with CFRP are of great importance as they are essential for the preservation of structures in terms of both human safety and economic stability. For any assessment and monitoring system, it is essential to use an appropriate non-destructive testing (NDT) technique. NDT techniques are widely used to determine the internal condition of materials and provide real-time information on a structure’s condition. NDT provides a regular safety assessment during the long-term use of strengthened structures (Zou et al., 2022). The acoustic emission technique, one of the NDT techniques, is relatively easy to install and capable of predicting the location in which damage has occurred. Acoustic emission is a versatile method as it can be developed and applied with different approaches and for specific needs (Kouprianoff et al., 2021). Not only is it versatile, but the acoustic emission technique also analyses the properties of elastic waves caused by microscopic damage in a concrete member (Yun et al., 2010). The technique has been used to evaluate microscopic damage located inside concrete elements and caused by various external loading conditions.
The use of acoustic emission has been extensively studied by Noorsuhada (Noorsuhada, 2016) in the context of fatigue. Acoustic emission has been shown to be a powerful technique for assessing the damage to concrete structures and materials to determine the integrity of the structure (Pohoryles et al., 2017). The characteristics of crack progression in fibre-reinforced polymer-strengthened concrete cylinders under compressive loading were effectively determined using acoustic emission (Ma et al., 2021). The development of fatigue damage in RC beams can also be assessed using this technique (Md Nor et al., 2021). Based on the distribution of acoustic emission activity, the health status and fatigue damage of RC beams under fatigue loading can be assessed through real-time monitoring. As part of damage assessment using the acoustic emission technique for a CFRP-strengthened RC structure, an extensive investigation was conducted for concrete columns under cyclic loading (Ma and Li, 2017). The acoustic emission energy, hits and b-value were analysed, and it was found that the cumulative acoustic emission energy had a good correlation with the cumulative hysteresis energy dissipated during the cyclic tests on CFRP-strengthened columns. In assessments of the integrity of RC structures strengthened with CFRP, most literature focuses on the analysis of acoustic emission parameters for crack monitoring (Yun et al., 2010; Ma and Li, 2017; Oz et al., 2017). However, crack monitoring for the crack classification of CFRP-strengthened RC beams, especially in terms of crack zones, is still limited. Therefore, it is meaningful to extend the acoustic emission technique to monitor the crack zone and assess the crack levels of an RC beam strengthened with CFRP as this could form guidelines for determining the integrity of this type of structure.
The main aim of this paper was to assess the integrity of a CFRP-strengthened RC beam on the soffit using the acoustic emission technique. Two types of RC beams were made, a normal beam (without CFRP) and a CFRP-strengthened RC beam. To determine the crack zone, the intensity analysis was conducted on the association between the historical index (HI) and the severity analysis (Sr), based on the acoustic emission signal. Prior to determining the crack zone, the background of CFRP, the acoustic emission intensity analysis, the methodology and the results are described and discussed.
2 Background of CFRP
CFRP is not a new industrial material. It has been used for various applications. Thousands of tonnes of CFRP are produced every year to meet the global market demand. According to Kühnel and Kraus (Kühnel and Kraus, 2016), in 2015, 30% of the CFRP was produced for the purposes of aerospace and defence, 22% was utilised in the automotive industry and only 5% was used in civil engineering. The high market demand for CFRP is generally because it possesses the highest specific mechanical properties. CFRP possesses a higher modulus of elasticity (MoE) and greater strength than steel. The strength of CFRP may reach 7 GPa, and it has a low density of 1800 kg/m3. It also has high chemical inertness. However, the MoE and strength of CFRP differ depending on the type used. Five types of CFRP have been addressed, namely ultra-high modulus (the MoE is 450 GPa), high modulus (the MoE is in the range of 350–450 GPa), intermediate modulus (the MoE is in the range of 200–350 GPa), high tensile and low modulus (the MoE <100 Gpa and the tensile strength >3 GPa) and super high-tensile (the tensile strength is 4.5 GPa). Owing to those properties, CFRP is extensively used in the aerospace and automotive industries.
In the context of the civil engineering industry, CFRP has generally been used for repairing and retrofitting pre-cracked RC structures. General information on CFRP as a reinforcement for concrete structures has been provided by ACI 440R–96 (ACI 440R–96, 2002). Guidelines for design and construction using this material have been documented in ACI 440.2R–02 (ACI 440.2R–02, 2002). The general background of CFRP, in terms of its material composition and mechanical properties, is depicted in Table 1. Figure 1 shows the typical stress-strain curves for CFRP, glass fibre-reinforced polymer (GFRP) and mild steel, which indicates the behaviour of CFRP compared to other materials. As the graph illustrates, compared to mild steel, CFRP possesses high stress with low strain as it exhibits no ductility behaviour.

TABLE 1. Mechanical properties of CFRP, taken from Sika (SikaWrap, 2017).
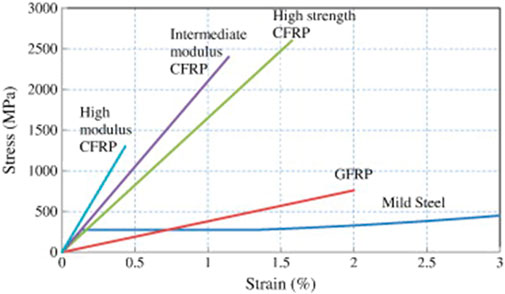
FIGURE 1. Comparison of the stress-strain relationships for CFRP and other materials (Teng et al., 2012).
3 Acoustic Emission Intensity Analysis
The analysis of intensity includes the log HI (abscissa) and log Sr (ordinate) graphs, as shown in Figure 2. Both the Sr and HI depend significantly on the acoustic emission energy, such as the signal strength (Degala et al., 2009). Chotickai (Chotickai, 2001) found that the signal intensity can effectively identify trends within the acoustic emission data because it takes amplitude and duration into account. To display the intensity analysis in the graph, the HI and Sr were calculated based on the acoustic emission signal obtained from the sensor during monitoring (see eqs 1, 2). The position in the intensity plot represents the classification of damage that could occur to the structure (Chotickai, 2001; Degala et al., 2009; Proverbio, 2011).
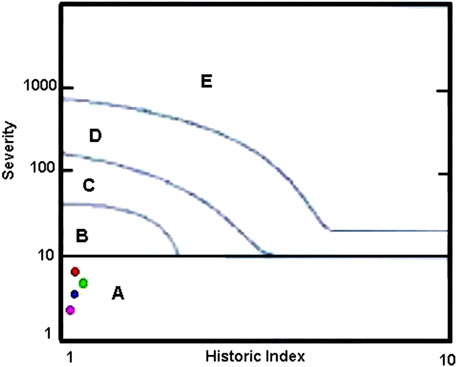
FIGURE 2. Established intensity chart for the application of concrete (Golaski et al., 2002)
Where N is the number of hits up to and including time t, Soi is the signal strength of the ith hits or events, K is a parameter that depends on the number of acoustic emission hits, J is an empirically derived constant based on material type, and the order of i is based on the dimension, where i = 1 is the hit with the largest signal strength.
As shown in Figure 2, Zone A is defined as being where no significant emission or crack occurred, and no follow-up was recommended. Zone B is defined as a minor crack, as typically only minor surface defects occurred on the structure, which would require future reference. Zone C is defined as an intermediate crack that would require a follow-up evaluation. Zone D is defined as needing a follow-up as the crack was expanding; it required a follow-up inspection. Zone E is defined as a major crack, and a shut-down and follow-up were required.
4 Methodology
4.1 Preparation of RC Beams
A concrete grade 45 (C45) was designed with the amounts of water, fine aggregate, and coarse aggregate in the proportion of 1: 0.43:1.73: 2.70, respectively. Two types of admixtures were used, retarder and superplasticiser, at constant dosages of 1221 and 1832 ml/m3, respectively. The coarse aggregate was cut to a maximum size of 20 mm. The RC beam specimens were designed using BS8110: Part 1 (BS 8110-1, 1997) as a guideline for singly reinforced beams. The beams employed in this study were 200 mm wide, 300 mm deep and 1500 mm long. Two different diameters of high-yield bars (460 N/mm2) and one mild steel bar (250 N/mm2) were used to reinforce the beam. The high-yield bars were 16 mm (T16) in diameter and were utilised to enhance the tension zone. Two 10 mm-diameter hanger bars (2T10) were employed in the compression zone. Meanwhile, as stirrups, a mild-yield bar of 8 mm (R8) was used. The distance between the stirrups was 175 mm from centre to centre. The schematic diagram of the beam is presented in Figure 3, which shows the side view and the cross-sectional view.
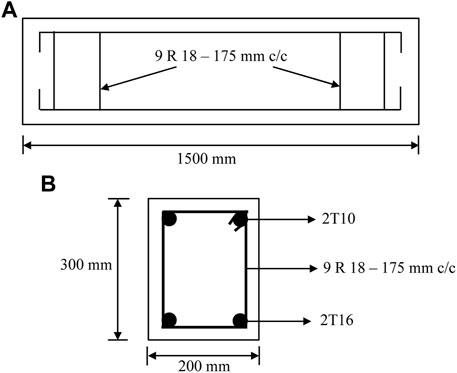
FIGURE 3. Details of the beam specimen (A) the side-view (B) the section view (unit in mm).
The concrete mix was poured into a 200 mm × 300 mm x 1500 mm mould, into which the reinforcement was immersed with a 20 mm cover. A total of six beams were produced. After ±24 h of casting, the beams were demoulded and cured for 28 days. A detail of the beam is shown in Figure 3. In this study, two types of beams were prepared. The first type was a control beam, designated as S1C. This beam was used as a reference beam. The second type of beam was a control beam and was retrofitted with CFRP on the soffit. This beam was designated as S2B. The results from both types of beams were compared, and these are discussed in the following section.
4.2 Installation of CFRP on the RC Beams
CFRP was used to reinforce the clean surface of the underside of the RC beam. The normal surface preparation was carried out before installing the CFRP, in accordance with ACI 440 (ACI 440.2R–02, 2002), on the beam surface under tension. Table 2 shows the properties of the CFRP. A Sikadur 330 epoxy resin was used to laminate the CFRP to the beam surface. The epoxy resin Sikadur 330 for part A and part B was mixed in a weight ratio of 4:1. The epoxy resin was applied to the tension side of the beam at the point where the CFRP strip was to be installed. The CFRP strip was cut to a length of 1300 mm so that it was on the effective length of the beam. The CFRP strip was then cut lengthwise with scissors to a width of 200 mm. As Ding et al. (Ding et al., 2014) found, the CFRP length contributes to the strength of a beam. A length of 75% of the beam is recommended as the optimal length to use as a good reference for retrofitting buildings. The CFRP was then applied evenly to the concrete surface, as shown in Figure 4.
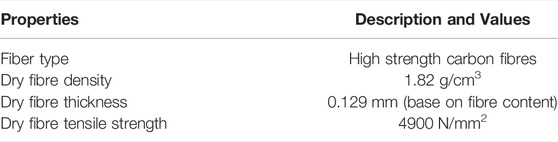
TABLE 2. The properties of the CFRP used in this study.
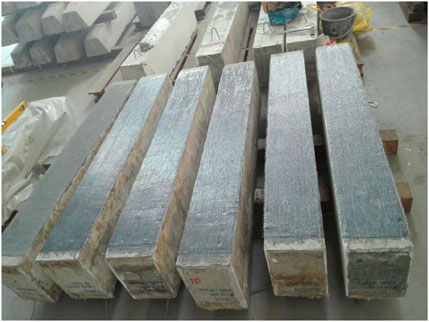
FIGURE 4. The installed CFRP on the beam surface.
In this study, one layer of CFRP was used. The layer was smoothed with a plastic roller so that a wrinkle-free surface could be achieved. The curing process took about a week to ensure that the CFRP was properly laminated to the concrete surface. Figure 4 shows the beam after reinforcement with CFRP and before the tests.
4.3 Test Set up of the Beam
Four acoustic emission sensors were placed on the surface of the beam. Two sensors were placed on the top of the beam at 250 mm from the point load; these were designated as CH6 and CH7. Two other sensors were placed in the centre of the beam surface at 300 mm from the top of the point load; these were designated as CH5 and CH8. In this study, only the CH6 and CH7 sensors were analysed since they captured more data than the other two. Figure 5 shows the placement of the sensors on the beam surface after accounting for the attenuation effect. The sensors were attached to the beam surface with a thin layer of vacuum grease and then fixed with holding magnets to limit their movement. With the acoustic emission hardware, the threshold was set at 45 dB, with a rearm time of 1.62 ms, a pre-trigger sampling of 200 and a sampling rate of 10 MHz. A wave speed of 4000 m/s was used for all the tests.
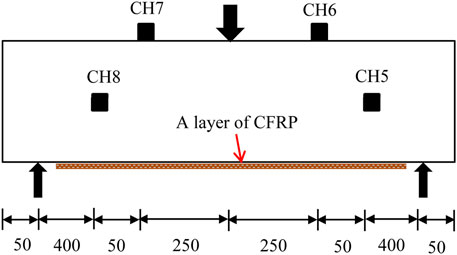
FIGURE 5. Schematic diagram of the beam set up (unit in mm).
Monotonic testing was performed using a servo-controlled hydraulic testing machine with a capacity of 1000 kN, in conjunction with acoustic emission monitoring. A three-point load was applied to the beam until it failed completely. A constant load rate of 0.02 kN/s was used. Figure 5 shows the schematic diagram of the beam setup. Meanwhile, Figure 6 shows the beam setup with all the instruments.

FIGURE 6. Beam set up and set up of all instrumentations.
4.4 Analyses
In this study, the plotting of the severity index and historical index was carried out for the two sensors, CH6 and CH7. The plot was performed for each crack mode of the beam. The definition of the crack zones in the intensity analysis was based on the types of cracks observed visually on the beam surface when the beam was loaded, as well as on the high signal strength when monitoring the acoustic emission. Six crack modes were identified. Crack mode 1 (CM1) is the crack initiation, where a crack is visually undetectable. Crack mode 2 (CM2) is the first crack to appear on the surface of a beam when it is loaded. Crack mode 3 (CM3) is a flexural crack, which sometimes propagates below and beyond the neutral axis of a beam. Crack mode 4 (CM4) is the development of the shear crack in a beam. Crack mode 5 (CM5) is the debonding of the concrete cover or the failure of the CFRP sheets at the ends of the concrete, which occurs either at the bottom or at the sides of a beam. Crack mode 6 (CM6) is the breaking of the reinforcement before the failure of the beam.
5 Results and Discussion
5.1 Identification of Crack Modes for the Beams
Figures 7, 8 show the acoustic emission signal strength distribution and the load used to identify the crack modes for the control beam, S1C and the beam retrofitted with CFRP. The identification of the crack modes was described in the preceding analysis section. Five crack modes were identified for the control beam, S1C: the initiation crack (CM1), first crack (CM2), flexural crack (CM3), shear crack (CM4) and failure (CM6) as the beam broke down. However, beam S2B, which had been retrofitted with a layer of CFRP on the soffit, had six crack modes. These were the first crack (CM1), first crack initiation (CM2), flexural crack (CM3), shear crack (CM4), debonding of the concrete cover or failure of the CFRP bonding (CM5) and failure of the beam (CM6). The load on the respective crack modes is presented in Table 3. The crack progression in both beams was visually observed by the naked eye and validated through the acoustic emission signal strength that appeared on the computer screen during testing.
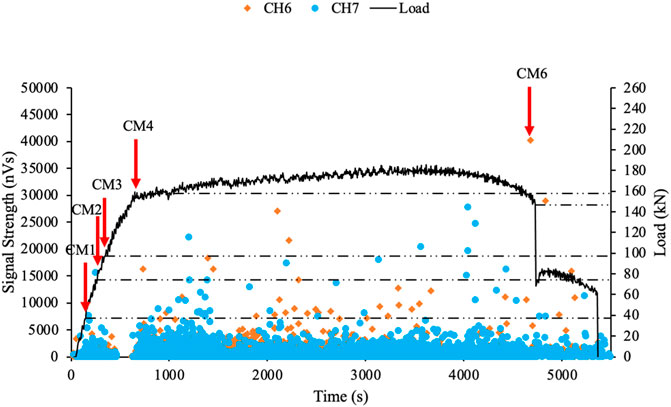
FIGURE 7. Signal strength distribution and load for Beam S1C.
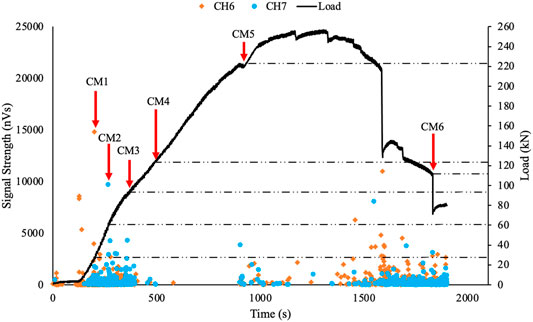
FIGURE 8. Signal strength distribution and load for Beam S2B.

TABLE 3. The load for each crack mode and the ultimate load for the beams.
The results in Table 3 indicate that beam S2B had the higher load-bearing capacity, with a value of 258.66 kN, compared to beam S1C, for which the value was 185.20 kN. The strength of the beam with CFRP produced good results, with a strength effectiveness of 39.66% compared to the control beam. This shows that CFRP improves the strength of a beam and doubly reinforces its performance. Therefore, the integrity and performance of a beam can be improved. Meanwhile, the surface preparation, lamination technique and type of materials used also influence the increased strength of a beam (Ekenel and Myers, 2007).
5.2 Crack Zones for Control Beam, S1C
The intensity plots of CH6 and CH7 in beam S1C, which was subjected to monotonic loading of all crack modes, are shown in Figures 9–11. The plots of the intensity zones for both sensors could be used to predict the future performance of the beam. Figure 9A shows that the intensity zone for the crack initiation (CM1) for both sensors fell into zone A when the beam was subjected to a load of 37.00 kN. Therefore, no significant crack emission occurred in the beam.
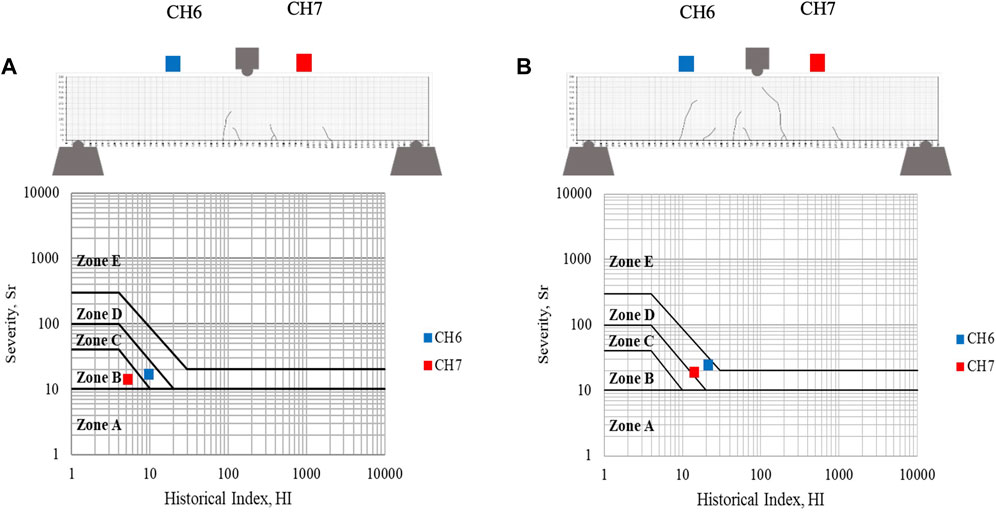
FIGURE 9. The crack zones obtained from CH6 and CH7 for beam S1C (A) CM1 and (B) CM2.
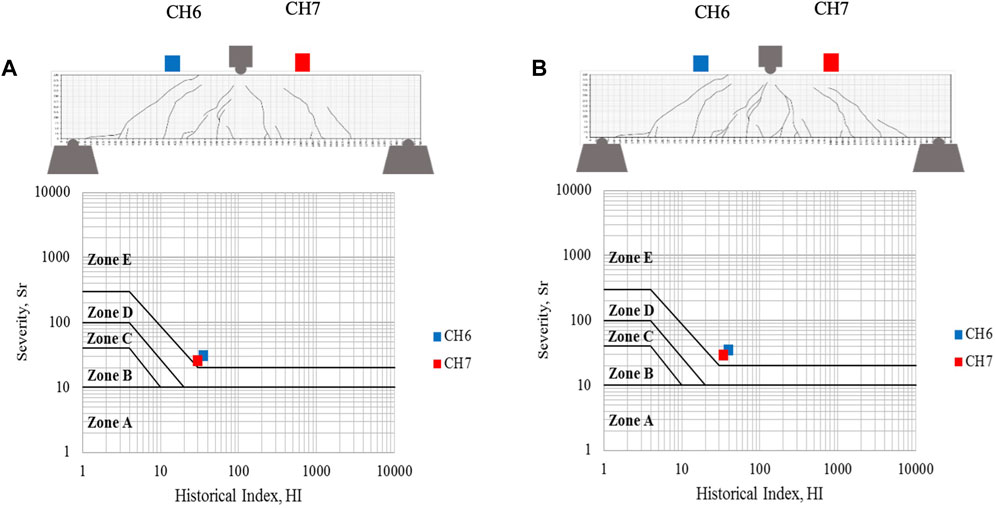
FIGURE 10. The crack zones obtained from CH6 and CH7 for beam S1C (A) CM3 and (B) CM4.
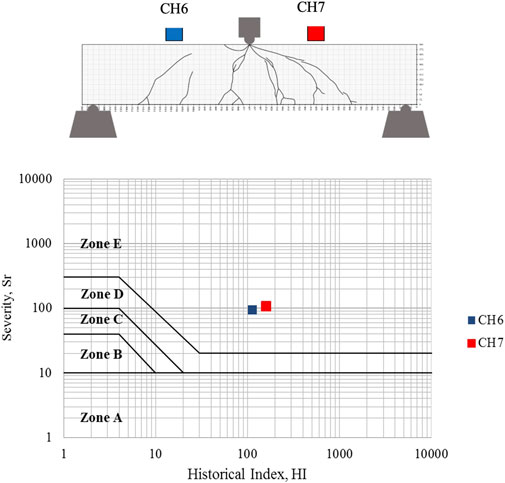
FIGURE 11. The crack zones obtained from CH6 and CH7 for beam S1C under CM6.
CH6 indicates that CM2 was in intensity zone B (minor damage), indicating the formation of the first crack in the beam (see Figure 9B). This occurred when the load was increased to 73.81 kN. However, CH7 was located in zone C, meaning that two cracks formed on the underside of the beam in tension, representing moderate damage. Although the sensors were in the same position, namely on the top of the beam and 300 mm from the point load, the sensors showed different intensity zones. This is closely related to the waveform of the acoustic emission detected by the sensors. The waveform of the acoustic emission arriving at the sensor plays an important role in detecting the energy released by the source. It is also related to the arrival time (TOA) of the wave and the distance of the crack to the sensor. This is because the strength of the acoustic emission signal is the most important parameter for determining the HI and Sr. In this finding, CH7 received more acoustic emission activity compared to CH6, resulting in the formation of an intensity zone. At the same time, the propagation of the crack was also found to affect the signal strength results.
When a tensile crack was localised (CM3), the intensity zone for CH6 indicated that the beam was in zone B, meaning that it was slightly damaged (see Figure 10A). CH7, on the other hand, indicated that the beam was in the middle of zones C and D. This means that the beam was in transition between moderate damage and consequential damage, where a significant defect would be present and require a follow-up (Gostautas et al., 2005). The intensity zones corresponded well with the crack pattern, as can be seen in Figure 10A), where smaller cracks occurred under CH6 than under CH7. Under CH6, most cracks propagated below the neutral axis. A crack closing at CH7, on the other hand, propagated beyond the neutral axis, resulting in the development of high levels of AE activities.
As the shear crack (CM4) developed, the plot for CH6 shows that the beam was in zone D, whereby a follow-up investigation would be required (Figure 10C). However, the situation was different for CH7, where the plot lay between zone D and zone E, indicating that the beam was in transition from follow-up inspection to major damage. As Buyukozturk et al. (Buyukozturk et al., 2004) noted, shear failure occurs when the shear capacity of a beam cannot accommodate an increase in bending capacity. The plots agree effectively with the crack pattern when the CM4 developed. However, all the plots of both sensors show that the beam had experienced major damage, as shown in Figure 11, when it failed (CM6).
5.3 Reinforced Concrete Beam Strengthened With Carbon Fibre Reinforced Polymer, S2B
Figure 12A shows the crack zones of beam S2B, which had been subjected to a load of 27.68 kN or at CM1. Since no crack occurred on the beam surface, the damage crack zone plot shows that the beam was in zone A at CH6. In this case, there was no plot for CH7 because the number of hits detected by the acoustic emission sensor was less than 50 (Chotickai, 2001). This means that the intensity plot represents the actual condition of the control beam reinforced with CFRP.
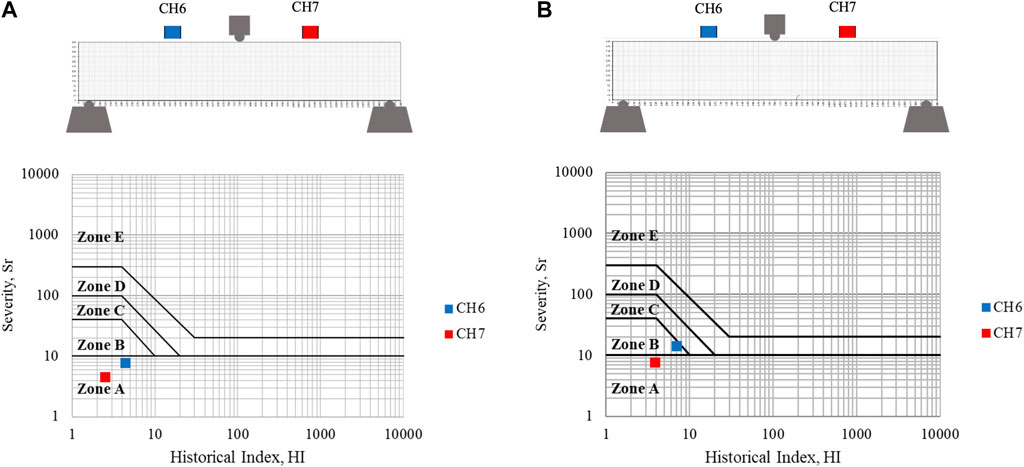
FIGURE 12. The crack zones obtained from CH6 and CH7 for beam S2B (A) CM1 and (B) CM2.
When the load was increased to 60.85 kN, CM2 appeared on the beam surface and propagated from the bottom of the beam. In this crack mode, the intensity plot was in zone B and zone A at CH6 and CH7, respectively. Even though no crack was visible below CH6 (see Figure 12B), the intensity zone showed that the beam had a small crack. This means that the beam would need to be checked in the future (Nor et al., 2018). CH6 showed more internal cracks (micro cracks) and no external cracks, compared to CH7 at CM2. In contrast to CH7, the intensity diagram shows that the beam had no crack, although the first crack occurred under CH7. Since the intensity analysis is closely related to the signal strength or energy of AE, the crack did not seem to produce a high level of energy that could be detected by CH7, compared to CH6. In general, the sensor closest to the crack would detect more energy than the furthest sensor, which is closely related to the time at which the AE wave reaches the sensor.
If the crack pattern in CM3 is referred (see Figure 13A), the damage crack zone for CM2 derived from CH6 can predict the occurrence of an impending crack in the beam. Therefore, the damage crack zone at CM2 could be used to predict the beam-derived intensity zone when the load was increased to 93.28 kN. As Golaski et al. (Golaski et al., 2002) stated, the intensity analysis can be used to predict an impending crack in a beam when it is subjected to load. Furthermore, the integrity and performance of the CFRP-reinforced beam can be determined at an early stage.
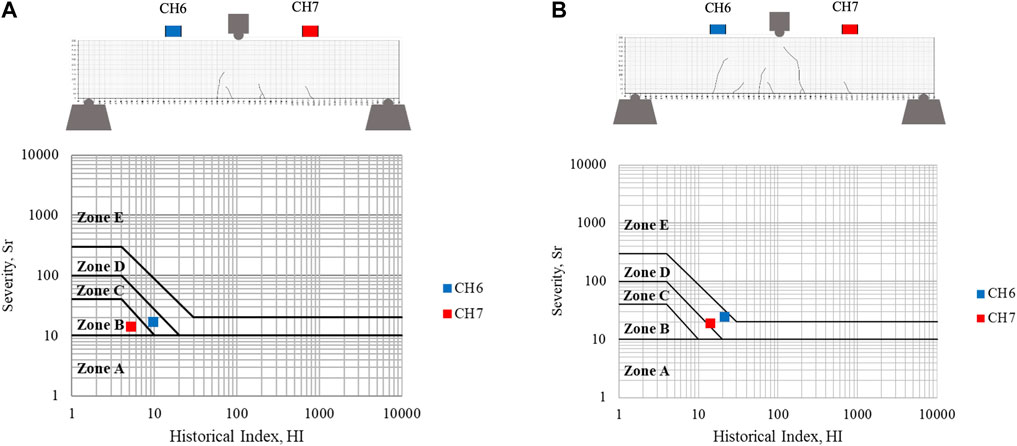
FIGURE 13. The crack zones obtained from CH6 and CH7 for beam S2B under (A) CM3 and (B) CM4.
When the CM3 appeared on the beam surface, the intensity analysis crack plots (see Figure 13A) showed that the CFRP-strengthened control beam was at CH6 and CH7 in Zone C and Zone B, respectively. When the crack pattern was examined, it was found that the crack under CH6 existed and propagated far more than the other cracks under CH7. The crack under CH6 propagated almost halfway up the beam. Considering the statement by McCormac and Nelson (McCormac and Nelson, 2006) that a crack originates beyond the neutral axis, this means that the rebars had yielded. This resulted in a high stress concentration in the beam. In this context, zone C means that the beam had intermediate damage that would require further assessment.
When the load was increased to 123.20 kN, CM4 was identified. More new cracks appeared and were observed on the beam surface (see Figure 13B). Due to the presence of these cracks, the intensity of the acoustic emissions from CH6 and CH7 fell into Zone D. Zone D indicates a significant defect in the beam that requires a follow-up investigation.
Further cracks were visually observed under CH6 and CH7 when the load was increased to 222.71 kN. At this load, the concrete at the plate end of the CFRP debonded and was designated as CM5. In this cracking mode, the AE intensity curve recorded at CH6 and CH7 fell into zone E. Zone E means that the beam strengthened with CFRP had experienced a larger defect. In a real situation, the beam must be shut down immediately and its condition beam must be generally monitored. In this RC beam, a high stress concentration occurred at the plate end of the CFRP system.
At this stage, the CFRP system could no longer withstand the load, and debonding of the plate end occurred. From the observation of this beam, it appears that the failure of the CFRP system occurred after the occurrence of a shear crack. However, at the same time, the beam could still resist the applied load. As described in ACI 440.2R-02 (ACI 440.2R–02, 2002), losses of the CFRP system do not lead to beam failure. As CM6 occurred in the beam due to the applied load of 111.48 kN, more cracks were visible on the beam surface, as shown in Figure 14B. Most of the cracks propagated from the top of the previous crack mode. At CM6, the AE intensity plot taken with both sensors fell into zone E.
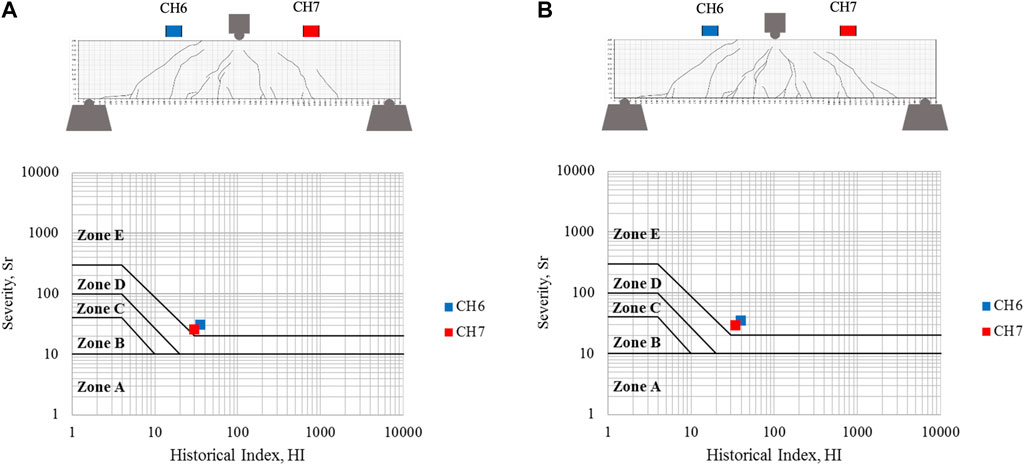
FIGURE 14. The crack zones obtained from CH6 and CH7 for beam S2B, (A) CM5 and (B) CM6.
6 Conclusion
This study mainly aimed to use acoustic emission to determine the crack zones of a reinforced concrete beam strengthened with CFRP on the soffit when subjected to monotonic loading. The crack modes were observed through visual observation and high acoustic emission signals before being matched with the load application to the beam. The load for crack modes in beam SC1 represented a higher value compared to S2B, from the initiation of a crack to shear crack formation. However, after the shear crack, beam S2B represented a higher load than the control beam, with the ultimate loads of 258.66 kN for S2B and 185.20 kN for S1C. Hence, the beam strengthened with CFRP presented a higher load-bearing capacity than the control beam, with a strength effectiveness of 39.67%.
The progression of the intensity crack zone plots for each damage mode matched well with the occurrence of cracks that appeared on the beam surfaces of both beams, S1C and S2B. This proved that CM1 was in zone A as no crack occurred in the beam for either beam or according to either sensor. As the load was continuously applied and the first crack appeared on the beam surface, beam S1C showed the progression of intensity plots from zone B to zone E. This indicates that from the intensity chart of severity and historical indices, major precautions should be taken in regard to the beam condition before a crack worsens.
The intensity plot illustrates that CH7 represented the faster progression of damage, from no cracks to failure, compared to CH6 for beam S1C as the crack progressively developed under this sensor. This indicates that CH7 captured more signal consequences of the signal arrival times to this sensor. Meanwhile, CH6 represented the faster progression of damage, compared to CH7 for beam S2B, as the acoustic emission source occurred under this sensor. The plot of the intensity damage zone is significantly useful for predicting the future performance of a beam, so the integrity of a beam can thus be assessed at an early stage.
Author Contributions
MN carried out the experimental work and data analysis. MNN came up with the idea, advised on the research and contributed to the writing of the manuscript. All authors contributed to the article and approved the submitted version.
Conflict of Interest
The authors declare that the research was conducted in the absence of any commercial or financial relationships that could be construed as a potential conflict of interest.
Publisher’s Note
All claims expressed in this article are solely those of the authors and do not necessarily represent those of their affiliated organizations, or those of the publisher, the editors and the reviewers. Any product that may be evaluated in this article, or claim that may be made by its manufacturer, is not guaranteed or endorsed by the publisher.
Acknowledgments
The authors would like to thank Universiti Teknologi MARA, Cawangan Pulau Pinang for the support in the form of materials to conduct this research.
References
ACI 440.2R–02 (2002). Guide for Design and Construction of Externally Bonded FRP Systems for Strengthening Concrete Structures. American Concrete Institute (ACI) committee 440.
ACI 440R–96 (2002). State of the Art Report on Fibre Reinforced Plastic (FRP) Reinforcement for Concrete Structures. Farmington Hills, Michingan, USA: American Concrete Institute (ACI) Committee 440.
BS 8110-1 (1997). Structural Use of Concrete — Part 1: Code of Practice for Design and Construction. London: British Standard.
Buyukozturk, O., Gunes, O., and Karaca, E. (2004). Progress on Understanding Debonding Problems in Reinforced Concrete and Steel Members Strengthened Using FRP Composites. Constr. Build. Mater. 18, 9–19. doi:10.1016/s0950-0618(03)00094-1
Chotickai, P. (2001). “Acoustic Emission Monitoring of Prestressed Bridge Girders with Premature Concrete Deterioration,” in Thesis of Master Science in Engineering (Austin: The University of Texas).
Degala, S., Rizzo, P., Ramanathan, K., and Harries, K. A. (2009). Acoustic Emission Monitoring of CFRP Reinforced Concrete Slabs. Constr. Build. Mater. 23 (5), 2016–2026. doi:10.1016/j.conbuildmat.2008.08.026
Ding, J., Wang, F., Huang, X., and Chen, S. (2014). The Effect of CFRP Length on the Failure Mode of Strengthened Concrete Beams. Polymers 6, 1705–1726. doi:10.3390/polym6061705
Ekenel, M., and Myers, J. J. (2007). Durability Performance of RC Beams Strengthened with Epoxy Injection and CFRP Fabrics. Constr. Build. Mater. 21, 1182–1190. doi:10.1016/j.conbuildmat.2006.06.020
Funari, M. F., and Verre, S. (2021). The Effectiveness of the DIC as a Measurement System in SRG Shear Strengthened Reinforced Concrete Beams. Crystals 11, 265. doi:10.3390/cryst11030265
Golaski, L., Gebski, P., and Ono, K. (2002). Diagnostics of Reinforced Concrete Bridges by Acoustic Emission. J. Acoust. Emiss. 20.
Gostautas, R. S., Ramirez, G., Peterman, R. J., and Meggers, D. (2005). Acoustic Emission Monitoring and Analysis of Glass Fibre Reinforced Composites Bridge Deck. J. Bridge Eng. 10, 6. doi:10.1061/(asce)1084-0702(2005)10:6(713)
Kouprianoff, D., Yadroitsava, I., du Plessis, A., Luwes, N., and Yadroitsev, I. (2021). Monitoring of Laser Powder Bed Fusion by Acoustic Emission: Investigation of Single Tracks and Layers. Front. Mech. Eng. 7 doi:10.3389/fmech.2021.678076
Kühnel, M., and Kraus, T. (2016). The Global CFRP Market 2016. Experience Composites. Augsburg. Sept 21st to 23rd.
Ma, G., and Li, H. (2017). Acoustic Emission Monitoring and Damage Assessment of FRP Strengthened Reinforced Concrete Columns under Cyclic Loading. Constr. Build. Mater. 144, 86–98. doi:10.1016/j.conbuildmat.2017.03.169
Ma, G., Wu, C., Hwang, H. J., and Li, B. (2021). Crack Monitoring and Damage Assessment of BFRP-Jacketed Concrete Cylinders under Compression Load Based on Acoustic Emission Techniques. Constr. Build. Mater. 272, 121936. doi:10.1016/j.conbuildmat.2020.121936
Md Nor, N., Abdullah, S., and Mat Saliah, S. N. (2021). On the Need to Determine the Acoustic Emission Trend for Reinforced Concrete Beam Fatigue Damage. Int. J. Fatigue 152, 106421. doi:10.1016/j.ijfatigue.2021.106421
Morsy, A., and Mahmoud, E. T. (2013). Bonding Techniques for Flexural Strengthening of RC Beams Using CFRP Laminates. Ain Shams Eng. J. 4, 369–374. doi:10.1016/j.asej.2012.11.004
Noorsuhada, M. N. (2016). An Overview on Fatigue Damage Assessment of Reinforced Concrete Structures with the Aid of Acoustic Emission Technique. Constr. Build. Mater. 112, 424–439. doi:10.1016/j.conbuildmat.2016.02.206
Nor, M. N. (2018). “6-Structural Health Monitoring through Acoustic Emission,” in Eco-efficient Repair and Rehabilitation of Concrete Infrastructures. Editors F. Pacheco-Torgal, R E. Melchers, X Shi, N De Belie, K V Tittelboom, and A Saez (Woodhead Publishing and Elsevier Ltd.), 123–146.
Oz, F. E., Ersoy, N., and Lomov, S. V. (2017). Do high Frequency Acoustic Emission Events Always Represent Fibre Failure in CFRP Laminates. Compos. Part A Appl. Sci. Manuf. 103, 230–235. doi:10.1016/j.compositesa.2017.10.013
Pohoryles, D. A., Melo, J., Rossetto, T., Fabian, M., McCague, C., Stavrianaki, K., et al. (2017). Use of DIC and AE for Monitoring Effective Strain and Debonding in FRP and FRCM-Retrofitted RC Beams. J. Compos. Constr. 21. doi:10.1061/(asce)cc.1943-5614.0000715
Proverbio, E. (2011). Evaluation of Deterioration in Reinforced Concrete Structures by AE Technique. Mater. Corros. 62 (2), 161–169. doi:10.1002/maco.201005735
Teng, J. G., Yu, T., and Fernando, D. (2012). Strengthening of Steel Structures with Fiber-Reinforced Polymer Composites. J. Constr. Steel Res. 78, 131–143. doi:10.1016/j.jcsr.2012.06.011
Wan Ahmad, W. N. A., and Md Nor, N. (2016). A Study on Damage Assessment of RC Beam Wrapped with Carbon Fibre Sheets Using Parameters of Acoustic Emission Signal. J. Eng. Appl. Sci. 11, 8.
Yun, H. D., Choi, W. C., and Seo, S. Y. (2010). Acoustic Emission Activities and Damage Evaluation of Reinforced Concrete Beams Strengthened with CFRP Sheets. NDT&E Int. 43, 615–628. doi:10.1016/j.ndteint.2010.06.006
Keywords: intensity analysis, carbon fibre reinforced polymer, acoustic emission, reinforced concrete, damage mode, strengthened
Citation: Mat Saliah SN and Md Nor N (2022) Assessment of the Integrity of Reinforced Concrete Beams Strengthened With Carbon Fibre Reinforced Polymer Using the Acoustic Emission Technique. Front. Mech. Eng 8:885645. doi: 10.3389/fmech.2022.885645
Received: 28 February 2022; Accepted: 31 May 2022;
Published: 30 June 2022.
Edited by:
Denis Benasciutti, University of Ferrara, ItalyReviewed by:
Marco Funari, University of Minho, PortugalJulian Marcell Enzveiler Marques, Czech Technical University in Prague, Czechia
Copyright © 2022 Mat Saliah and Md Nor. This is an open-access article distributed under the terms of the Creative Commons Attribution License (CC BY). The use, distribution or reproduction in other forums is permitted, provided the original author(s) and the copyright owner(s) are credited and that the original publication in this journal is cited, in accordance with accepted academic practice. No use, distribution or reproduction is permitted which does not comply with these terms.
*Correspondence: N. Md Nor, aWRhX25zbkB1aXRtLmVkdS5teQ==
†These author have contributed equally to this work