 Shunsuke Iwase
 Taisuke Maruyama
 Satoshi Momozono
 Satoru Maegawa
 Fumihiro Itoigawa3
- 1Core Technology R&D Center, NSK Ltd., Fujisawa, Japan
- 2NSK Tribology Collaborative Research Cluster, Tokyo Institute of Technology, Yokohama, Japan
- 3Nagoya Institute of Technology, Nagoya, Japan
Failures in tribological components such as bearings can significantly affect the performance and lifespan of machinery, necessitating the implementation of effective condition monitoring technologies. This study verified the feasibility of dielectric spectroscopy (DES) as a method for detecting abnormalities before damage occurs. A comparative evaluation was conducted between dielectric relaxation parameters and measurements from size exclusion chromatography, total acid number, and viscosity for oxidatively degraded poly (α-olefin) oils. The results confirmed that DES is an effective method for assessing the oxidative degradation state of lubricants. These findings suggest that DES could be applied to oil film condition monitoring and predictive maintenance.
1 Introduction
Failures in tribological components such as bearings have a significant impact on the overall performance and lifespan of machinery, necessitating the implementation of appropriate condition monitoring technologies. Traditionally, abnormal vibration sensing has been widely employed to monitor the condition of bearings (Kiral and Karagülle, 2003; Al-Badour et al., 2011; Zarei et al., 2014; Cambow et al., 2018). However, abnormal vibrations typically manifest as a result of damage caused by lubrication failure at the sliding surfaces, and by the time such vibrations are detected, component replacement is often required. In contrast, monitoring the condition of the lubricating oil film offers the potential to detect abnormalities before surface damage occurs. If this method is established, it could allow for methods other than part replacement, such as lubricant replacement, leading to significant reductions in maintenance costs. Additionally, it could serve as a means to identify the specific causes of failure within components, such as incorrect lubricant selection or improper design and installation methods. While optical techniques, such as optical interferometry (Johnston et al., 1991; Kaneta et al., 1993; Sugimura et al., 1998; Maruyama and Saitoh, 2010), are commonly used for monitoring oil films, they cannot be applied to metal components. Therefore, electrical methods have gained attention as potential oil film monitoring techniques for metal-to-metal sliding surfaces.
The capacitance method calculates oil film thickness from the film capacitance and can be applied to thin oil films, ranging from tens to hundreds of nanometers, formed under EHL (elastohydrodynamic lubrication) conditions (Crook, 1961; Prashad, 1988; Jablonka et al., 2012). Moreover, the impedance method, which builds upon the capacitance technique, allows for high-precision oil film thickness measurement and simultaneously provides information on metal contact (Nakano and Akiyama, 2006; Manabe and Nakano, 2008; Nihira et al., 2015; Schnabel et al., 2016; Maruyama and Nakano, 2018). Consequently, this method has been actively studied in recent years as a predictive maintenance (PdM) technique for rolling bearings (Becker-Dombrowsky and Kirchner, 2024; Maruyama and Nakano, 2018; Maruyama et al., 2024).
Thus, monitoring oil film thickness using electrical methods is considered a promising advanced condition monitoring technology for bearings, but it does not predict lubrication failure leading to metal contact. Generally, lubrication failure is caused by factors such as a decrease in lubricant quantity due to leakage or evaporation, as well as changes in lubricant properties caused by oxidation degradation or contamination. In particular, when lubricant oxidation progresses, it is expected that while the oil film may temporarily thicken due to the increased viscosity of the lubricant based on the Hamrock and Dowson theory (Hamrock and Dowson, 1977), it may simultaneously undergo viscosity reduction due to a rise in temperature caused by increased shear resistance. In other words, monitoring only oil film thickness may not allow for the prediction of damage due to lubrication failure until just before it occurs. If changes in the chemical properties of the lubricant, such as viscosity or acid number, can be monitored, it may become possible to predict the time remaining until lubrication failure during the steady state, when changes in oil film thickness are minimal, thus enabling the realization of PdM for bearings. This means that condition-based maintenance can be implemented, rather than the conventional time-based maintenance. For bearings equipped with oil circulation systems, sensors capable of monitoring lubricant degradation can be installed within the circulation mechanism, making it possible to apply previously reported diagnostic techniques (Patocka et al., 2020). However, particularly in the case of rolling bearings, the lubricant is often sealed, leaving no space to insert a sensor. Therefore, direct sensing in the oil film area is more desirable.
Although there are currently no reported methods for monitoring the chemical property changes of lubricants in oil films formed between metal sliding surfaces, it is possible that existing electrical measurement techniques for bulk lubricants between parallel electrodes could be adapted. Dielectric spectroscopy (DES), which observes the AC frequency response of the complex permittivity, provides direct information on molecular dynamics, making it a promising measurement technique for monitoring chemical property changes, such as lubricant degradation. Guan et al. reported that the total acid number (TAN) and sludge content could be predicted by analyzing DES measurement data (Guan et al., 2011). Additionally, Gong et al. stated that the quantification of nitrogen compounds and sulfur oxides generated in the oil could be achieved by analyzing the temperature dependence of the complex permittivity obtained from two-dimensional DES measurements (Gong et al., 2016; Gong et al., 2017).
However, DES measurements of lubricants reported so far have mainly focused on degradation state prediction based on statistical analysis, and a systematic theoretical framework regarding the underlying physical mechanisms has not yet been sufficiently established. Thus, the challenges associated with applying DES to oil film monitoring remain unclear.
Therefore, in this study, we aim to utilize DES measurements of oil films for the PdM of bearings and consider the information obtained from DES measurements of lubricants under static conditions from the perspective of dielectric relaxation theory. Specifically, we conduct DES measurements of degraded oils using parallel plate capacitors and discuss the relationships between the dielectric properties obtained and the concentration of degradation products, molecular weight, kinematic viscosity, and TAN obtained from various chemical analyses. Additionally, we will discuss the potential for applying oil film DES measurements to PdM and the challenges involved. The insights gained from this report on the dielectric relaxation properties of oils associated with lubricant degradation will contribute to advancements in lubricant degradation monitoring technology for tribological components, further supporting the realization of PdM.
2 Experimental details
In this section, we explain the principles and techniques of dielectric spectroscopy. We also explore various models used to describe the relaxation phenomena observed in the frequency characteristics of complex permittivity obtained through measurement, and provide a detailed explanation of the fitting methods applied to these models.
2.1 DES and dielectric relaxation
Except for purely non-polar oils, most lubricants contain polar molecules within their components. Examples of such components include ester-based oils, grease thickeners, certain additives, and oxidative degradation products of lubricants. The complex permittivity
Here,
Dielectric relaxation refers to the phenomenon where polarization of a dielectric material lags behind the applied alternating electric field. Dielectric relaxation appears as the frequency characteristics of complex permittivity in DES measurements. An example of DES measurements is shown in Figure 1.
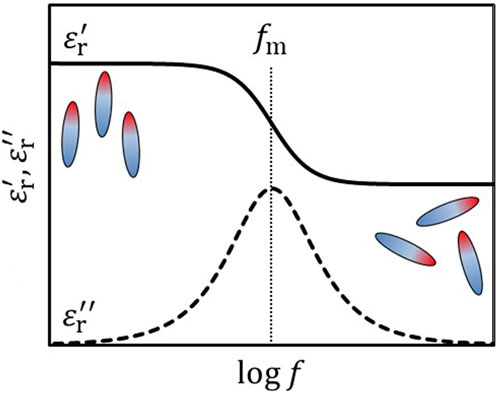
Figure 1. Conceptual diagram of DES measurement.
In the low-frequency region, the permanent dipoles align with the external electric field, resulting in a high
The equivalent circuit for dielectric spectroscopy measurements of lubricants using parallel plate electrodes is shown in Figure 2.
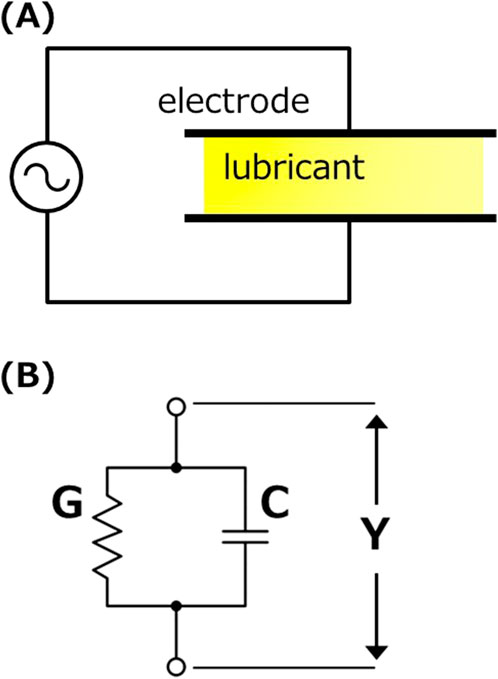
Figure 2. DES measurement method for lubricants, (A) Schematic diagram, (B) Equivalent circuit.
Since lubricants may exhibit conductivity due to additives or oxidation degradation products, they should be considered as a parallel circuit of a capacitor and a resistor. The complex admittance
Here,
Here,
Here,
The first term on the left-hand side of Equation 6 represents the conductive dielectric loss due to the conductive component. The equation including the conductive dielectric loss term is also described in the review by Woodward et al.; for further details, please refer to that source (Woodward, 2021).
2.2 Curve fitting
In this report, the Cole-Cole relaxation model was adopted to describe the relaxation phenomena. The Cole-Cole relaxation equation is a semi-empirical extension of the theoretical Debye relaxation equation and is commonly used in the analysis of dielectric relaxation (Kremer and Schönhals, 2003). However, the Cole-Cole model addresses only absorptive losses and does not take conductive losses into account. Specifically, it does not include the contribution of the first term on the left-hand side of Equation 6. As mentioned earlier, the conductivity of lubricants, which emerges due to oxidative degradation, can serve as an important indicator for estimating lubricant degradation. Therefore, in this study, the Cole-Cole relaxation model was directly applied to fit
where
3 Experimental method
3.1 Materials
In this experiment, two types of PAO (Poly (α-olefin)) with different viscosities were used. Each sample was placed in a glass beaker and subjected to thermal degradation by heating in an oven at 160°C. The heating duration and kinematic viscosity of each sample are presented in Table 1. Additionally, the values of TAN, which is commonly used as an indicator of oxidative degradation, are also provided.
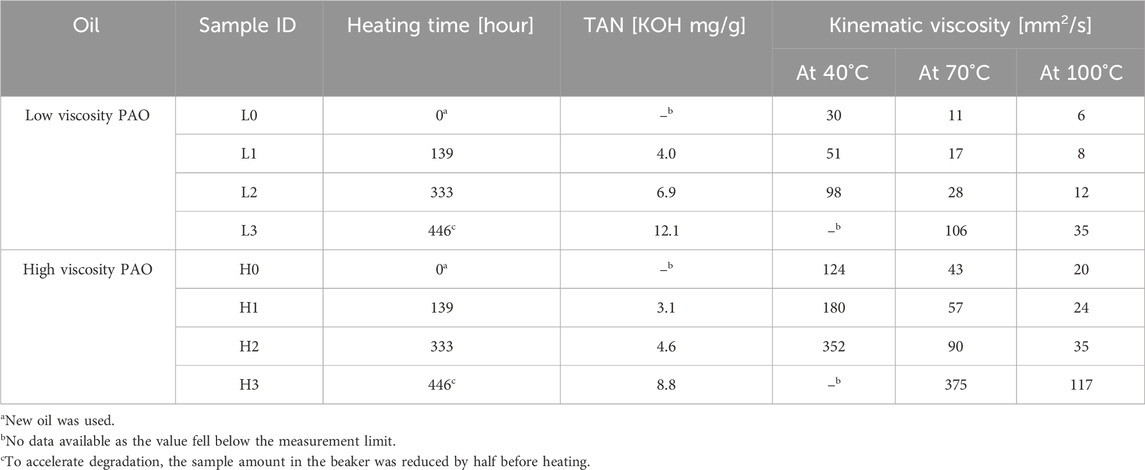
Table 1. Test oil properties.
3.2 Apparatus
The electrodes used in this study were Keysight 16452A. The electrode material was nickel-plated kovar (Fe: 54%, Co.: 17%, Ni: 29%), with an electrode gap of 0.3 mm and an electrode diameter of 38 mm. Complex impedance was measured using the HIOKI IM3536 impedance analyzer. For kinematic viscosity measurements, the Omnitek S-flow 1,200 capillary viscometer was used, following ASTM D445. The total acid number (TAN) was measured according to ASTM D 664, with automatic titration performed using the HIRANUMA COMTITE-550. SEC (size exclusion chromatography) measurements were carried out using the Nexera™ GPC System by Shimadzu, with a Shodex 803L column. Tetrahydrofuran was used as the measurement solvent. A refractive index detector was employed, and the molecular weights were calculated using polyethylene standards for calibration.
3.3 Measurement procedure for DES
The complex impedance was obtained using the apparatus described in Section 3.2 and measured by the four-terminal pair method. The applied voltage was set to 1 V, and the AC frequency was swept from 30 Hz to 1 MHz. The cell temperature during measurement was monitored with a thermocouple and maintained at 20°C for all experiments. Moreover, preliminary evaluations confirmed that the variation in complex impedance measurements is negligibly small, with minimal impact on the results. Consequently, all data presented in this paper were derived from a single measurement.
4 Results
4.1 DES measurements
From the values of TAN and kinematic viscosity shown in Table 1, it can be seen that the degree of oxidative degradation of the prepared samples increased in the order of L0 < L1 < L2 < L3 for the low viscosity oil, and H0 < H1 < H2 < H3 for the high viscosity oil.
Figure 3 shows an example of DES measurements (sample L3) and the results of curve fitting.
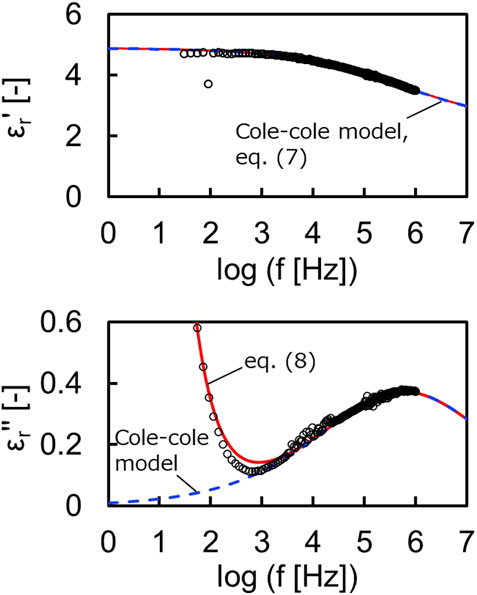
Figure 3. Curve fitting results of
When using the Cole-Cole relaxation model, a significant deviation in
Figure 4A shows the DES measurement results for low viscosity PAO, and Figure 4B shows those for high viscosity PAO. In the undegraded state (L0, H0),
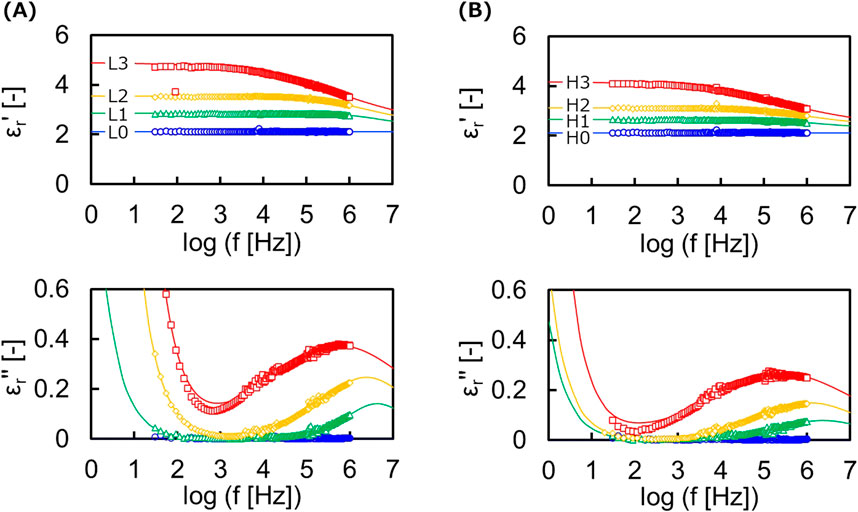
Figure 4. The

Table 2. Relaxation parameters of degraded PAO obtained from curve fitting.
4.2 SEC analysis
SEC measurements were conducted to obtain information on the molecular weight and concentration of components generated by degradation. The results of the SEC measurements for low viscosity PAO are shown in Figure 5. The intensity shown on the vertical axis in Figure 5 was normalized using the peak derived from the fresh component detected around log M = 2.8. Compared to the undegraded sample (L0), an increase in high molecular weight components was observed as degradation progressed. The calculated values of the mass concentration of degraded components,
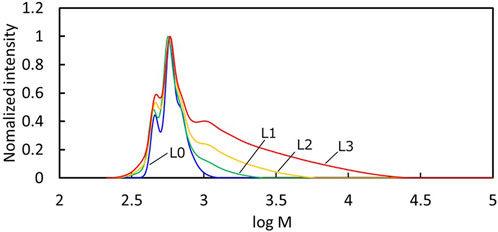
Figure 5. SEC results of low viscosity PAO; blue, green, yellow, and red line represent the measurements of L0, L1, L2, and L3, respectively.
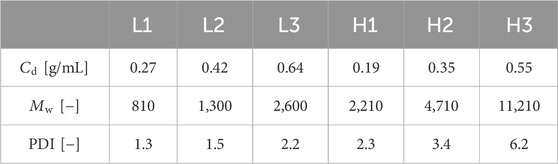
Table 3. Parameters of degraded components obtained from SEC.
5 Discussion
DES measurements were conducted on oxidatively degraded PAO. As the oxidative degradation progressed, changes were observed in the relaxation strength,
5.1 Relationship between
Here,
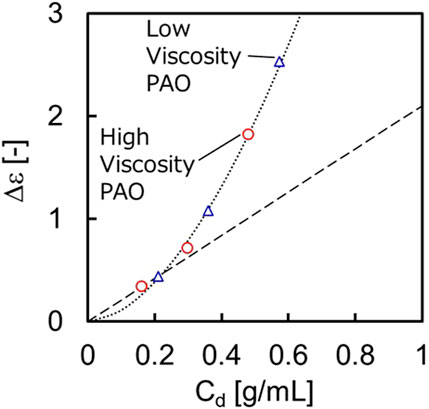
Figure 6. Relationship between
For the two points in the region where
5.2 Relationship between
According to Debye’s theory (Debye, 1929),
Here,
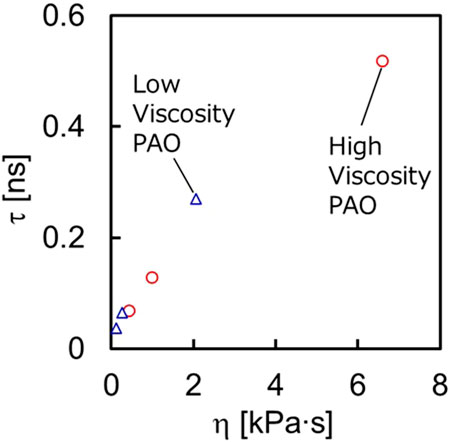
Figure 7. Relationship between τ and η; Red circles represent samples H1, H2, and H3, while blue triangles represent samples L1, L2, and L3.
As shown in Figure 8, R remained nearly constant value regardless of the weight-average molecular weight,
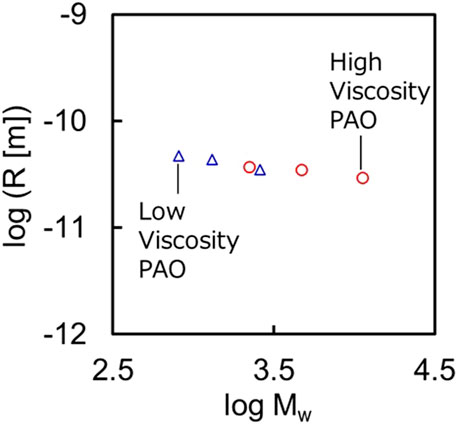
Figure 8. Relationship between R and Mw; Red circles represent samples H1, H2, and H3, while blue triangles represent samples L1, L2, and L3.
5.3 Relationship between
The parameter
Figure 9 shows the relationship between
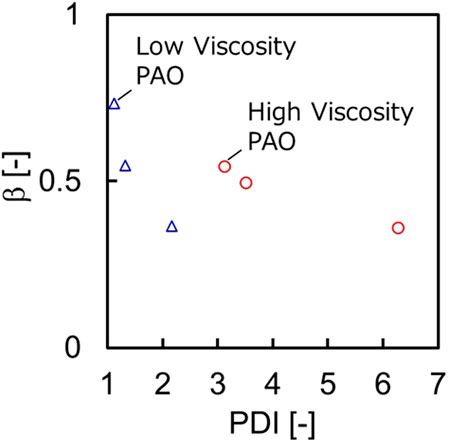
Figure 9. Relationship between
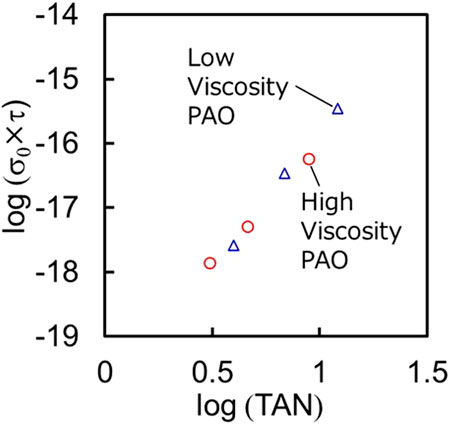
Figure 10. Relationship between σ0τ and TAN; Red circles represent samples H1, H2, and H3, while blue triangles represent samples L1, L2, and L3.
5.4 Relationship between
TAN is a parameter that indicates the concentration of fatty acids produced by degradation and is widely used as an indicator of oxidative degradation of lubricants. Additionally, the concentration of fatty acids significantly affects the conductivity of the oil (Kajimoto et al., 2003), as it has been reported that the increase in ionicity is due to the high acid dissociation constant (Wada et al., 2014). The conductivity of a solution is generally expressed by equation Equation 11.
Here,
As mentioned in section 5.2, the viscosity of oxidatively degraded PAO is proportional to the relaxation time
Here, assuming that some of the carriers are fatty acid ions,
This suggests that by utilizing two parameters observed in different frequency ranges, the degree of oxidative degradation of PAO can be diagnosed independently of the absolute value of viscosity. In other words, this method implies that when applied to lubricating oil films, it would be possible to diagnose oil degradation in a steady state where there is little change in oil film thickness. However, the plot in Figure 10 shows that
6 Conclusion
In this study, thermal degradation tests were conducted at 160°C using two types of poly (α-olefin) (PAO) with different viscosities to produce multiple samples with varying degrees of degradation. Dielectric spectroscopy (DES) with a parallel plate capacitor was applied to these samples to obtain detailed measurements of complex permittivity over a wide frequency range (30 Hz–1 MHz). The obtained dielectric relaxation parameters (
1. It was demonstrated that
2. A proportional relationship between
3. The product of
These findings reveal that DES is an effective means of comprehensively evaluating lubricant degradation from the perspective of relaxation phenomena. Although further insights on pressure and temperature effects are needed to apply DES to oil film condition monitoring, the present results suggest the possibility of detecting early signs of lubrication failure, thus supporting the feasibility of implementing predictive maintenance (PdM) for bearings.
Data availability statement
The original contributions presented in the study are included in the article/supplementary material, further inquiries can be directed to the corresponding author.
Author contributions
SI: Writing–review and editing, Writing–original draft. TM: Writing–review and editing. SM: Writing–review and editing. SM: Writing–review and editing. FI: Writing–review and editing.
Funding
The author(s) declare that no financial support was received for the research, authorship, and/or publication of this article.
Acknowledgments
In writing this paper, I received valuable advice through discussions with Atsumi Koda of NSK Ltd. I would like to express my gratitude to her for the support.
Conflict of interest
Authors SI, TM, and SM were employed by NSK Ltd.
The remaining authors declare that the research was conducted in the absence of any commercial or financial relationships that could be construed as a potential conflict of interest.
Generative AI statement
The author(s) declare that no Generative AI was used in the creation of this manuscript.
Publisher’s note
All claims expressed in this article are solely those of the authors and do not necessarily represent those of their affiliated organizations, or those of the publisher, the editors and the reviewers. Any product that may be evaluated in this article, or claim that may be made by its manufacturer, is not guaranteed or endorsed by the publisher.
Supplementary material
The Supplementary Material for this article can be found online at: https://www.frontiersin.org/articles/10.3389/fmech.2024.1504347/full#supplementary-material
References
Al-Badour, F., Sunar, M., and Cheded, L. (2011). Vibration analysis of rotating machinery using time–frequency analysis and wavelet techniques. Mech. Syst. Signal Process. 25 (6), 2083–2101. doi:10.1016/j.ymssp.2011.01.017
Becker-Dombrowsky, F. M., and Kirchner, E. (2024). Electrical impedance based condition monitoring of machine elements–a systematic review. Frontiers 10. doi:10.3389/fmech.2024.1412137
Böttcher, C. J. F., and Bordewijk, P. (1973). “Theory of electric polarization, vol. I,” in Dielectrics in static fields (Amsterdam, Oxford, New York: Elsevier).
Böttcher, C. J. F., and Bordewijk, P. (1980). “Theory of electric polarization, vol. II,” in Dielectrics in time-dependent fields. 2nd edn. (Amsterdam: Elsevier Science).
Cambow, R., Singh, M., Bagha, A. K., and Singh, H. (2018). To compare the effect of different level of self-lubrication for bearings using statistical analysis of vibration signal. Mater. Today Proc. 5 (14), 28364–28373. doi:10.1016/j.matpr.2018.10.121
Crook, A. W. (1961). Elastohydrodynamic lubrication of rollers. Nature 190, 1182–1183. doi:10.1038/1901182a0
Gong, Y., Guan, L., Feng, X., Zhou, J., Xu, X., and Wang, L. (2017). Low-temperature dielectric spectroscopy characterization of the oxidative degradation of lubricating oil. Energy and Fuels 31 (3), 2501–2512. doi:10.1021/acs.energyfuels.6b02795
Gong, Y., Guan, L., Wang, L., and Zhu, L. (2016). Two-channel and differential dielectric spectroscopy characterizationof lubricating oil. Sensors Actuators A Phys. 241, 74–86. doi:10.1016/j.sna.2016.02.013
Guan, L., Feng, X. L., Xiong, G., and Xie, J. A. (2011). Application of dielectric spectroscopy for engine lubricating oil degradation monitoring. Sensors Actuators A Phys. 168 (1), 22–29. doi:10.1016/j.sna.2011.03.033
Hamrock, B. J., and Dowson, D. (1977). Isothermal elastohydrodynamic lubrication of point contacts: Part III–Fully flooded results. J. Lubr. Technol. 99 (2), 264–275. doi:10.1115/1.3453074
Iwamoto, S., and Kumagai, H. (1998). Analysis of the dielectric relaxation of a gelatin solution. Biosci. Biotechnol. Biochem. 62 (7), 1381–1387. doi:10.1271/bbb.62.1381
Jablonka, K., Glovnea, R., and Bongaerts, J. (2012). Evaluation of EHD films by electrical capacitance. J. Phys. D Appl. Phys. 45 (38), 385301. doi:10.1088/0022-3727/45/38/385301
Johnston, G. J., Wayte, R., and Spikes, H. A. (1991). The measurement and study of very thin lubricant films in concentrated contacts. Tribol. Trans. 34 (2), 187–194. doi:10.1080/10402009108982026
Kajimoto, G., Nakamura, M., and Yamaguchi, M. (2003). Changes in organic acid components of volatile degradation products during oxidation of oil, and effects of organic acid on increased conductivity determined by the Rancimat method. J. Jpn. Soc. Food Sci. Technol. 50 (3), 223–229. doi:10.4327/jsnfs.50.223
Kaneta, M., Sakai, T., and Nishikawa, H. (1993). Effects of surface roughness on point contact EHL. Tribol. Trans. 36 (4), 605–612. doi:10.1080/10402009308983201
Kiral, Z., and Karagülle, H. (2003). Simulation and analysis of vibration signals generated by rolling element bearing with defects. Tribol. Int. 36 (9), 667–678. doi:10.1016/s0301-679x(03)00010-0
Manabe, K., and Nakano, K. (2008). Breakdown of oil films and formation of residual films. Tribol. Int. 41 (11), 1103–1113. doi:10.1016/j.triboint.2008.02.001
Maruyama, T., Kosugi, D., Iwase, S., Maeda, M., Nakano, K., and Momozono, S. (2024). Application of the electrical impedance method to steel/steel EHD point contacts. Frontiers 10. doi:10.3389/fmech.2024.1489311
Maruyama, T., Maeda, M., and Nakano, K. (2019). Lubrication condition monitoring of practical ball bearings by electrical impedance method. Tribol. Online 14 (5), 327–338. doi:10.2474/trol.14.327
Maruyama, T., and Nakano, K. (2018). In situ quantification of oil film formation and breakdown in EHD contacts. Tribol. Trans. 61 (6), 1057–1066. doi:10.1080/10402004.2018.1468519
Maruyama, T., and Saitoh, T. (2010). Oil film behavior under minute vibrating conditions in EHL point contacts. Tribol. Int. 43, 1279–1286. doi:10.1016/j.triboint.2009.11.004
Nakano, K., and Akiyama, Y. (2006). Simultaneous measurement of film thickness and coverage of loaded boundary films with complex impedance analysis. Tribol. Lett. 22 (1), 127–134. doi:10.1007/s11249-006-9074-z
Nihira, T., Manabe, K., Tadokoro, C., Ozaki, S., and Nakano, K. (2015). Complex impedance measurement applied to short-time contact between colliding steel surfaces. Tribol. Lett. 57 (3), 29. doi:10.1007/s11249-015-0478-5
Patocka, F., Schneidhofer, C., Dörr, N., Schneider, M., and Schmid, U. (2020). 'Novel resonant MEMS sensor for the detection of particles withdielectric properties in aged lubricating oils. Sensors Actuators A Phys. 315, 112290. doi:10.1016/j.sna.2020.112290
Prashad, H. (1988). Theoretical evaluation of impedance, capacitance and charge accumulation on roller bearings operated under electrical fields. Wear 125 (3), 223–239. doi:10.1016/0043-1648(88)90115-9
Schnabel, S., Marklund, P., Minami, I., and Larsson, R. (2016). Monitoring of running-in of an EHL contact using contact impedance. Tribol. Lett. 63 (3), 35. doi:10.1007/s11249-016-0727-2
Sugimura, J., Jones, W. R., and Spikes, H. A. (1998). EHD film thickness in non-steady state contacts. J. Tribol. 120 (3), 442–452. doi:10.1115/1.2834569
Wada, J., Ueta, G., Okabe, S., and Amimoto, T. (2014). Method to evaluate the degradation condition of transformer insulating oil: experimental study on the hydrophilic and dissociative properties of degradation products. IEEE Trans. Dielectr. Electr. Insulation 21 (2), 873–881. doi:10.1109/tdei.2013.004204
Woodward, W. H. (2021). “Broadband dielectric spectroscopy—a practical guide,” in ACS symposium series (Washington, DC: American Chemical Society).
Keywords: dielectric spectroscopy, lubricants, oil, degradation, electrical impedance method, condition monitoring, oil diagnosis
Citation: Iwase S, Maruyama T, Momozono S, Maegawa S and Itoigawa F (2024) Studies on dielectric spectroscopy of oxidatively degraded Poly(α-olefin). Front. Mech. Eng. 10:1504347. doi: 10.3389/fmech.2024.1504347
Received: 30 September 2024; Accepted: 07 November 2024;
Published: 27 November 2024.
Edited by:
Andras Vernes, Vienna University of Technology, AustriaReviewed by:
Michał Stosiak, Wroclaw University of Science and Technology, PolandMilan Bukvic, University of Kragujevac, Serbia
Copyright © 2024 Iwase, Maruyama, Momozono, Maegawa and Itoigawa. This is an open-access article distributed under the terms of the Creative Commons Attribution License (CC BY). The use, distribution or reproduction in other forums is permitted, provided the original author(s) and the copyright owner(s) are credited and that the original publication in this journal is cited, in accordance with accepted academic practice. No use, distribution or reproduction is permitted which does not comply with these terms.
*Correspondence: Shunsuke Iwase, aXdhc2Utc2hAbnNrLmNvbQ==