 Adtihya Nambiar
 P. Mythravaruni
- Rubber Technology Centre, Indian Institute of Technology Kharagpur, Kharagpur, India
Traditionally, fatigue of hyperelastic materials has been modelled using Continuum Damage Mechanics. Although CDM can very accurately simulate damage due to fatigue, CDM can simulate only a small control volume of the material efficiently. If the model is not extremely precise, simulating the bulk structure becomes computationally costly and more error-prone. A systematic approach is utilised to examine the fatigue-induced property change in rubber composites. Hyperelasticity, and failure characteristics, such as tensile strength and elongation at break, are used to create the model. In this paper, the Energy Limiter approach is used to develop a constitutive model that can capture the variation of material parameters with fatigue. To model the variation of material parameters with the number of loading cycles, uniaxial tensile tests are conducted after subjecting the samples to different number of fatigue loading cycles. The experimental data obtained from the tensile test is used in an optimisation algorithm to find the model parameters that provide the best fit to the experimental behaviour. With the predicted parameters, the tensile test is simulated in ABAQUS incorporating element deletion and the results of the ABAQUS simulation are compared with experimental behaviour and model response. Finally, a relation for model parameters as a function of life factor is obtained.
Introduction
Fatigue can be simulated for hyperelastic materials using Continuum Damage Mechanics by phasefield modelling (Miehe and Schänzel, 2014; Loew et al., 2020). In the work by Miehe and Schänzel (2014), using phase-field modelling, they were able to simulate crackinitiationaccording to Griffith’s Law, and in the work by Loew et al. (2020), fatigue damage was simulated with phasefield modelling incorporating viscous dissipation. However, in both works (Miehe and Schänzel, 2014) and (Loew et al., 2020), the modelling was done by using the CDM approach, which simulates damage at the microstructure level. This method gives extremely accurate results, but the computational power required and time will be very high. In CDM the degradation of material properties is described by the damage parameter, which is an internal variable governed by the damage evolution equation. To model damage evolution including initiation and propagation of microcracks, a very fine mesh is needed leading to a high computational load and time (Rodríguez et al., 2006). Due to the absence of internal variables, their critical threshold conditions, and evolution equations this energy limiter approach is simpler than CDM (Volokh, 2007a; Volokhh, 2008). Volokh (2007a) proposed the softening Hyperelasticity approach as a potential substitute for both the complex technique of damage mechanics including internal variables and the straightforward pointwise failure criterion of material strength. Volokhh (2008) used this approach to model failure in soft biological tissues and fracture of brittle materials. In this case, using energy limiters can be seen as a promising method for simulating failure in hyperelastic materials. Rather than using Continuum Damage Mechanics, using energy limiters is computationally less expensive and provides excellent accuracy. Volokh (2007b) introduced the concept of the critical failure energy to limit the strain energy. The material softening is controlled by this energy limiter. Energy limiters do not consider any changes to the microstructure of the material since the main energy limiter term
The main limitation of the energy limiter approach used in all these works is that this approach is suitable for monotonic loadings. Many researchers in the past have conducted studies to assess the change in the material response due to cyclic loading. Vinogradov et al. (2001), have performed experiments including vibrocreep tests and post cyclic stress strain teststo study the effects of temperature, frequencies, mean stress and stress amplitudes on the creep behaviour of Nylon 6/6 and polyvinylidene fluoride (PVDF). Tasdemir et al. (2023), developed data-driven constitutive model based on feed-forward neural networks trained with data obtained from random uniaxial stress controlled loading of titanium specimens. Sánchez-Santana et al. (2008), investigated the dynamic response of 6061-T6 aluminium alloy and AISI 4140T steel specimens with prior fatigue damage induced due to low cycle fatigue. Fang et al. (2008), performed experiments to study the degradation of tensile fracture properties of polycarbonate and acrylonitrile–butadiene–styrene (PC/ABS) due to cyclic loading. Galán López et al. (2011), studied the change in the microstructure and tensile properties of titanium alloy specimens subjected to different number of fatigue loading cycles. In all these studies, theenergy limiter approach has not been used to obtain the change in the mechanical response of elastomer blends due to fatigue cycles of loading and unloading.
Until now, all such experiments related to the energy limiter approach and material constant prediction by optimisation have only been done on pristine samples. None have been subjected to any sort of prior loading (dynamic or fatigue). The motivation for this work is that there has not been any investigation into the effect of fatigue loading on the material parameters used in constitutive models for elastomeric blends. Also, there has not been any study using the energy limiter approach in investigating the effect of fatigue loading on material parameters.
Materials and methods
Sample preparation
SBR/NR blends have the combined properties of NR: exceptional tensile properties, better stress relief, electrical insulation, high abrasion and fatigue resistance and SBR: abrasion resistance and weather resistance. These properties make SBR/NR blend very much suited for use in tyres and rubber belts. NR was masticated for 4 min before being blended with SBR for another 4 min in the first stage. Carbon black is incorporated in the SBR/NR blend in two major parts. Half of the constituents (zinc oxide and stearic acid) are added after half of the carbon black was added. The other half of the carbon black and remaining constituents are added after some time.
The following formulation was used to prepare the samples to be used for experimentation:
This formulation shown in Table 1 is selected from Anand and Vishvanathperumal (2022). The formulation is first mixed in Brabender Plasticorder. The total compounding is done for 25 min at 50°C. The cure characteristics of prepared samples are found using a moving die rheometer at 160°C for 40 min. The mix is then moulded into 2 mm thick sheets and cured simultaneously in a hydraulic moulding machine. ASTM D412-shaped dumbbell samples are punched out from the moulded sheet for performing experiments.
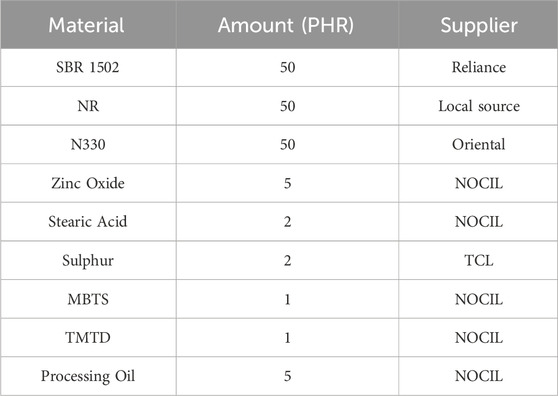
Table 1. Formulation for sample preparation.
A total of 7 samples are taken and tested. Out of these seven samples, only one is pristine, and the remaining are subjected to prior fatigue loading in DeMattia Flex tester before subjecting the samples to tensile test in UTM. In the flex tester, the samples were subjected to pure tensile strain in each cycle. Each cycle incorporated an R ratio of 0 as the samples were subjected to tensile strain only. The strain amount was set by calibrating the cross-head displacement to a value of 66 mm. In the DeMattia Flex Tester, the sample was subjected to cyclic loading at a frequency of 5 Hz. Each sample was subjected to tensile fatigue and one sample was removed from the setup whenever there was a significant growth in the crack length. Then this sample is subjected to uniaxial extension at a rate of 500 mm/min in ZWICK UTM 1445 and the uniaxial stress-strain response is obtained.
Modelling using energy limiters
Next, the tensile test data from UTM is used to calibrate and validate the compressible Yeoh Model (Bergström, 2015) incorporating energy limiters. This constitutive model describes the stress-strain response of intact material without failure.
Here,
Here,
in which
Where
and,
where
For uniaxial tensile loading of isotropic rubber composite, the stretch ratios in the other two orthogonal axes are assumed to be the same, which gives:
Hence,
Therefore, from the above relation, Equation 2,
Equation 3 gives the strain invariant used in Equation 1 in terms of the principal stretches. Now the hyperelastic stress-strain response of the Yeoh model when the material fails is obtained by introducing energy limiter (Rodríguez et al., 2006) in the strain energy density function of the Yeoh model to incorporate failure:
Where
From this strain energy density, the Cauchy stress is given by:
From Equation 4,
Where
Since the stress state in the gauge section of the dumbbell specimen is uniaxial during tensile loading in UTM, only the stress component in the direction along loading is non-zero. Thus,
From Equations 1, 5,
where
and I is the identity matrix.
Here, from the tensile test, the engineering stress is obtained. This can be related to true stress
Finally, from Equations 6, 7,
Also, since
The condition for the strain energy function used to define the element deletion in the simulation is given by Volokh (2007b) as,
Equation 10 gives the element deletion criterion that has been implemented in the user subroutine VUMAT used in this work.
Equation 8 is used to define the stress strain relationship in the simulation. In this work, the element deletion criterion that has been implemented in the user subroutine VUMAT is that once the strain energy density
Results
Initially, uniaxial tensile tests are performed on pristine sample and samples subjected to fatigue cycles and the result obtained for the stress-strain response of these samples is shown in Figure 1.

Figure 1. ASTM D412 geometry.
It is seen that the material is getting weaker with increasing number of cycles. The discrepancies in the initial loading part of the curves can be due to errors induced by clamping and UTM calibration.
Out of these seven uniaxial tensile tests, the tests conducted at 700 cycles, 1,200 cycles and 1933 cycles are used to validate the model. The model parameters are obtained by calibrating the model using the data for pristine, 1,100, 2,447 and 3,701 cycles.
A total of 8,640 linear brick elements (hexahedral elements) with reduced integration (C3D8R) elements are used in the simulation. Mesh density is high in the gauge section compared to the ends. The size of the elements in the ends is around 1.8 mm whereas in the gauge section, it is chosen to be around 0.5 mm. The simulation of the uniaxial tensile test was performed by fixing one end of the specimen and pulling the other end at an elongation rate of 500 mm/min (8.333 mm/s). Dynamic Explicit step has been used for analysis as this tensile test has been conducted at a high rate and explicit time integration is computationallyefficient, especially for short-duration, high-speed dynamic events, and requires less memory as it solves element-level equations without needing to calculate global stiffness and mass matrices.
During optimization, the value of
It is seen that there is also a decrease in the Modulus of the SBR/NR blends with the number of cycles. Here, the trend for all parameters is seen to vary exponentially with the Life factor (N/Nf) and hence can be written as shown in Table 3.
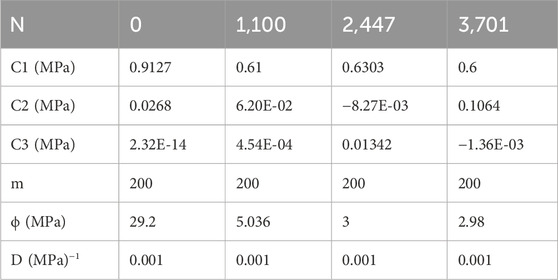
Table 2. Yeoh Model parameter values after different fatigue loading cycles.
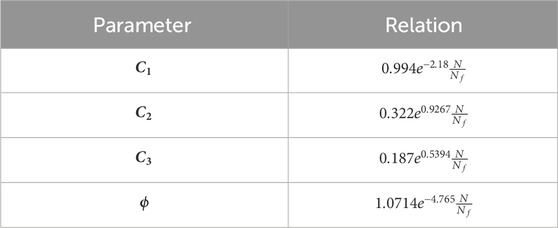
Table 3. Material parameters as functions of life factor, coefficients are obtained from fitting optimised parameters to an exponential function.
Using the above relations and values of
Consequently, for the strain energy density incorporating failure,
Finally, the engineering uniaxial stress component can be written as:
The variation of lateral stretch obtained from the model response with uniaxial strain appliedduring the tensile test is plotted as shown in Figures 2, 3. The model response is also compared with the simulation result from ABAQUS.
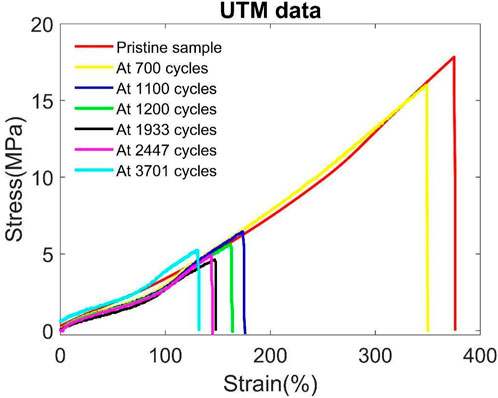
Figure 2. Stress vs. strain response of pristine samples and samples fatigued for different number of cycles.
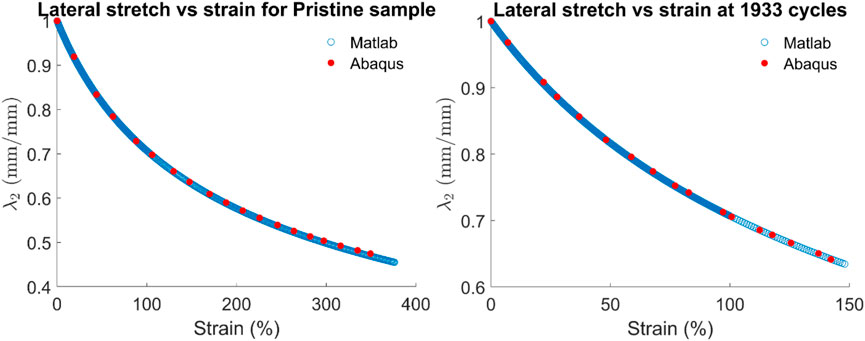
Figure 3. Variation of lateral stretch with uniaxial strain for pristine sample and sample fatigued for 1933 cycles.
Figures 3, 4 show that the lateral and axial strains do not have a fixed proportionality, meaning Poisson’s ratio changes with increasing strain, which is typical behaviour of rubber components due to nonlinear elasticity. Variation of lateral stretch in these figures shows that SBR/NR blends exhibit material softening which is evident from the deviation of Poisson’s ratio from 0.5 (incompressible behaviour) under large strains. The lateral stretch for the same amount of axial strain in specimens is constant with fatigue loading which is in line with the choice of constant compressibility (D) value.
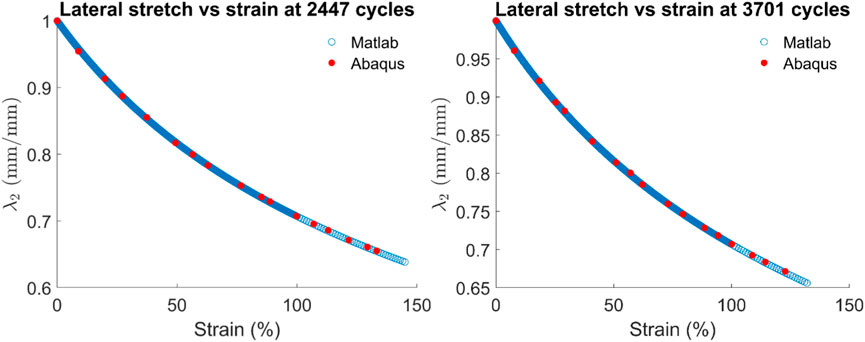
Figure 4. Variation of lateral stretch with uniaxial strain for samples fatigued for 2,447 cycles and 3,701 cycles.
Figures 5–11 show the comparison between the experimental result of tensile testing and the results obtained from MATLAB analysis and ABAQUS simulation for all samples. Out of these, Figures 5, 7, 10, 11 show the calibration of the model and Figures 6, 8, 9 show the validation of the model. From these figures, it can be seen that the developed model captures the experimental response quite well. The discrepancy with the ABAQUS simulation may be due to the relatively coarse mesh used in the simulation because of the limitation on node count. In Figure 11, the curves for experimental and simulated data are nearly parallel. The mismatch between them could be due to any calibration error of the UTM which may be due to residual stress in the load cell.
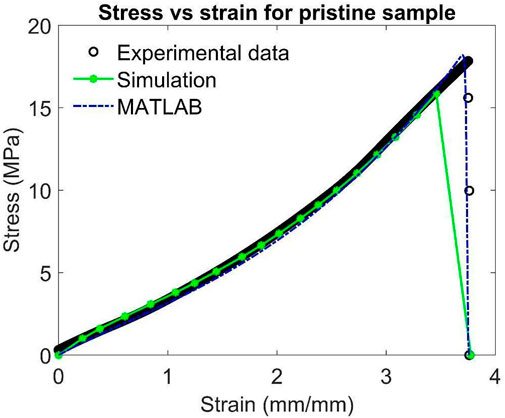
Figure 5. Variation of stress with strain for Pristine Sample.
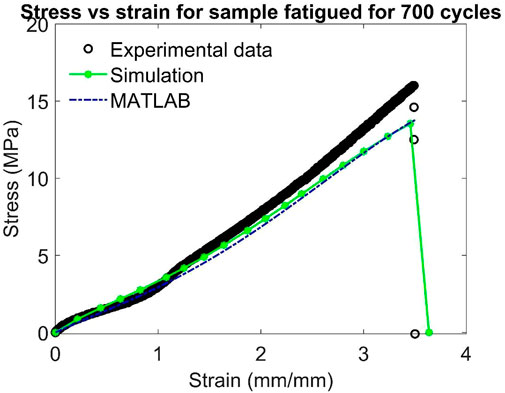
Figure 6. Variation of stress with strain for sample at 700 cycles.

Figure 7. Variation of stress with strain for sample at 1,100 cycles.
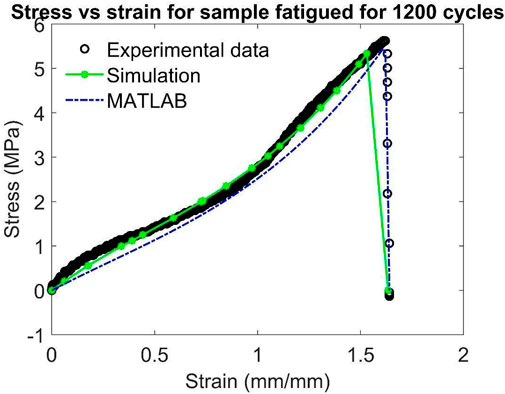
Figure 8. Variation of stress with strain for sample at 1,200 cycles.
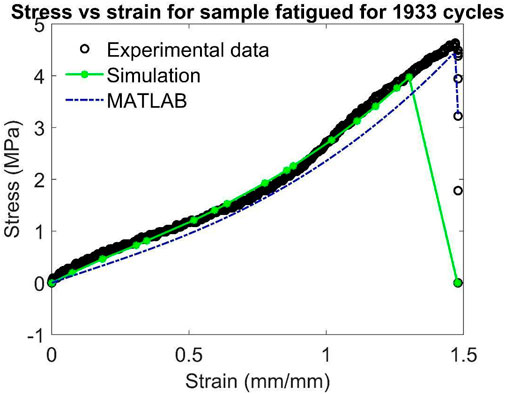
Figure 9. Variation of stress with strain for sample at 1,933 cycles.
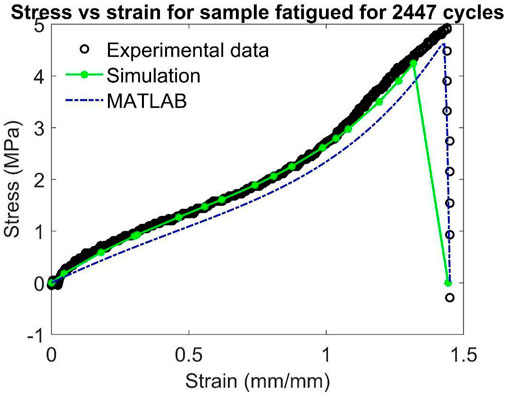
Figure 10. Variation of stress with strain for sample at 2,447 cycles.
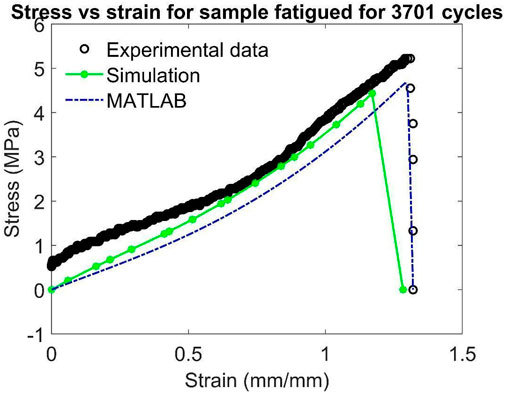
Figure 11. Variation of stress with strain for sample at 3,701 cycles.
Limitations
Although this study uses the energy limiter approach which has advantages compared to other approaches like CDM and the Strength of Materials approach, this study too has its limitations due to the experimental and simulation errors. Experimental errors include errors during the weighing and mixing of ingredients, the presence of foreign particles in the mix, errors during the rolling process, such as roll temperature, roll speed, and roller gap, temperature fluctuation during compression moulding, and errors during clamping and UTM calibration. Simulation errors include limitation on node count due to license terms affecting accuracy and as it is dynamic explicit analysis, the choice of mass scaling value may also affect the accuracy of the simulation.
Discussion
From this work, it is seen that the developed constitutive model is capable of predicting the change in the hyperelastic response during uniaxial tensile fatigue as seen from the good match between the MATLAB and ABAQUS simulation results obtained for stress-strain response and experimental behaviour. Also, it is seen that the variation of all the model parameters is able to capture the degradation in stiffness of the material with the progression in fatigue cycles reasonably well.
From this work, it can be concluded that the application of the energy limiter approach can be used to predict changes in material response due to fatigue with excellent accuracy. Comparing the use of CDM to the energy limiter approach used in this work for simulating fatigue, it can be seen that the energy limiter approach is less computationally intensive and much easier to implement.
Data availability statement
The raw data supporting the conclusions of this article will be made available by the authors, without undue reservation.
Author contributions
AN: Conceptualization, Data curation, Formal Analysis, Investigation, Methodology, Resources, Software, Validation, Visualization, Writing – original draft, Writing – review and editing. PM: Conceptualization, Formal Analysis, Investigation, Project administration, Software, Supervision, Validation, Visualization, Writing – review and editing, Methodology.
Funding
The author(s) declare that no financial support was received for the research and/or publication of this article.
Conflict of interest
The authors declare that the research was conducted in the absence of any commercial or financial relationships that could be construed as a potential conflict of interest.
Generative AI statement
The author(s) declare that no Generative AI was used in the creation of this manuscript.
Publisher’s note
All claims expressed in this article are solely those of the authors and do not necessarily represent those of their affiliated organizations, or those of the publisher, the editors and the reviewers. Any product that may be evaluated in this article, or claim that may be made by its manufacturer, is not guaranteed or endorsed by the publisher.
References
Anand, V., and Vishvanathperumal, S. (2022). Properties of SBR/NR blend: the effects of carbon black/silica (CB/SiO2) hybrid filler and silane coupling agent. Silicon 14, 9051–9060. doi:10.1007/s12633-022-01675-x
Bergström, J. (2015). Mechanics of solid polymers: theory and computational modelling. Norwich, NY, USA: William Andrew Publishing.
Fang, Q.-Z., Wang, T. J., Beom, H. G., and Li, H. M. (2008). Effect of cyclic loading on tensile properties of PC and PC/ABS. Polym. Degrad. Stab. 93 (Issue 8), 1422–1432. doi:10.1016/j.polymdegradstab.2008.05.022
Galán López, J., Verleysen, P., De Baere, I., and Degrieck, J. (2011). Tensile properties of thin-sheet metals after cyclic damage. Procedia Eng. 10, 1961–1966. doi:10.1016/j.proeng.2011.04.325
Loew, P. J., Peters, B., and Beex, L. A. A. (2020). Fatigue phase-field damage modeling of rubber using viscous dissipation: crack nucleation and propagation. Mech. Mater. 142, 103282. doi:10.1016/j.mechmat.2019.103282
Miehe, C., and Schänzel, L.-M. (2014). Phase field modeling of fracture in rubbery polymers. Part I: finite elasticity coupled with brittle failure. J. Mech. Phys. Solids 65, 93–113. doi:10.1016/j.jmps.2013.06.007
Mythravaruni, P., and Volokh, K. Y. (2018). Failure of rubber bearings under combined shear and compression. ASME. J. Appl. Mech. 85. doi:10.1115/1.4040018
Rodríguez, J. F., Cacho, F., Bea, J. A., and Doblaré, M. (2006). A stochastic-structurally based three dimensional finite-strain damage model for fibrous soft tissue. J. Mech. Phys. Solids 54 (4), 864–886. doi:10.1016/j.jmps.2005.10.005
Sánchez-Santana, U., Rubio-González, C., Mesmacque, G., Amrouche, A., and Decoopman, X. (2008). Effect of fatigue damage induced by cyclic plasticity on the dynamic tensile behavior of materials. Int. J. Fatigue 30 (Issues 10–11), 1708–1719. doi:10.1016/j.ijfatigue.2008.03.011
Tasdemir, B., Tagarielli, V., and Pellegrino, A. (2023). A data-driven model of the yield and strain hardening response of commercially pure titanium in uniaxial stress. Mater. and Des. 229, 111878. doi:10.1016/j.matdes.2023.111878
Trapper, K. Y. V. (2010). Elasticity with energy limiters for modeling dynamic failure propagation. Int. J. Solids Struct. 47 (Issues 25–26), 3389–3396. doi:10.1016/j.ijsolstr.2010.08.016
Vinogradov, A. M., Jenkins, C. H. M., and Winter, R. M. (2001). Cyclic loading effects on durability of polymer systems, Editors: P. J. M. Monteiro, K. P. Chong, J. Larsen-Basse, and K. Komvopoulos, Long term durability of structural materials, Elsevier Science Ltd, 159–170.
Volokh, K. Y. (2007a). Hyperelasticity with softening for modeling materials failure. J. Mech. Phys. Solids 55 (10), 2237–2264. doi:10.1016/j.jmps.2007.02.012
Volokh, K. Y. (2007b). Hyperelasticity with softening for modeling materials failure. J. Mech. Phys. Solids 55 (10), 2237–2264. doi:10.1016/j.jmps.2007.02.012
Keywords: hyperelasicity, fatigue, ABAQUS, yeoh model, rubber, MATLAB, energy limiter
Citation: Nambiar A and Mythravaruni P (2025) Modelling fatigue induced change in hyperelastic response of SBR/NR blends. Front. Mech. Eng. 11:1514002. doi: 10.3389/fmech.2025.1514002
Received: 19 October 2024; Accepted: 17 March 2025;
Published: 31 March 2025.
Edited by:
Abdelmageed A. Elmustafa, Old Dominion University, United StatesReviewed by:
Davood Rahmatabadi, University of Tehran, IranAntonio Pellegrino, University of Bath, United Kingdom
Copyright © 2025 Nambiar and Mythravaruni. This is an open-access article distributed under the terms of the Creative Commons Attribution License (CC BY). The use, distribution or reproduction in other forums is permitted, provided the original author(s) and the copyright owner(s) are credited and that the original publication in this journal is cited, in accordance with accepted academic practice. No use, distribution or reproduction is permitted which does not comply with these terms.
*Correspondence: Adtihya Nambiar, YWRpdGh5YW5hbWJpYXI5OThAZ21haWwuY29t; P. Mythravaruni, dmFydW5pLm15dGhyYUBnbWFpbC5jb20=, cG12YXJ1bmlAcnRjLmlpdGtncC5hYy5pbg==