 Balachandar Krishnamurthy1†
 Jegadeeshwaran Rakkiyannan2*
- 1School of Mechanical Engineering, Vellore Institute of Technology, Chennai, India
- 2Centre for e-Automation Technologies, Vellore Institute of Technology, Chennai, India
Introduction: Friction Stir Welding (FSW) is a critical industrial process in which a rotating tool generates heat through friction, enabling the solid-state joining of materials. This versatile method is widely applicable across numerous industries, including marine and auto-motive sectors.
Method: Real-time tool condition monitoring is essential for businesses to identify and address issues before they escalate into costly failures or product defects. While traditional methods such as visual inspection and endoscopy are used to observe tool conditions, they cannot be performed in real-time during welding operations. As a result, specific real-time tool condition monitoring methods are employed for continuous analysis. The real-time tool condition monitoring process involves acquiring vibrational data and extracting statistical features from the raw data. A feature importance study is conducted using a decision tree algorithm, which selects only the most significant features to reduce computational complexity.
Result: Feature classification is then performed using various machine learning and deep learning algorithms, including Support Vector Machines (SVM), Multi-Layer Perceptron (MLP), Cascade Correlation, GMDH Polynomial Neural Networks, and Linear Discriminant Analysis Among these classifiers, Probabilistic Neural Networks (PNN) consistently deliver the best results as 91.25% under 1,400 rpm.
Discussion: Based on these findings, the Probabilistic Neural Network algorithm is identified as a robust and reliable prediction model for monitoring FSW tool conditions.
1 Introduction
Friction stir welding (FSW) is an advanced welding process in which a rotating tool generates heat through frictional contact with the workpieces, softening the materials and facilitating solid-state joining without melting them (Di Bella et al., 2023). In FSW, the material sur-face is rough, leading to friction when brought into contact. An external revolving tool is used in FSW to provide friction on the surface by offering a revolving motion. It can be concluded that FSW has more advantages than others when compared side by side. Due to its versatility, FSW can be used with various metals and alloys, overcoming parameters such as shape and size (Solanki and Dhruv, 2024). FSW is not only limited to aluminium alloys, but also used to join dissimilar materials, such as copper alloys on one side and aluminium alloys on the other (Sun et al., 2022). The applications of FSW span across industries, including the marine, automotive, armor, aerospace, and railway sectors (Thomas and Nicholas, 1997). The quality of a weld in FSW depends on two key factors: the workpieces and the tool. However, not all materials are suitable for FSW; only those with a lower melting point, such as aluminium (Al), copper (Cu), and magnesium (Mg), are ideal for this process (Devaiah et al., 2018). Different industries require different tool materials. Commonly used tool materials in FSW include 883 tool steel (H13), high-speed steel (H.S.S), and high-carbon high-chromium steel (D3 or HcHcr). A comparative study between HSS, H13 and D3 (HcHcr) found that H13 is the most efficient and effective material for FSW tools (Khaliq and Bharti, 2015).
Persisting with a worn-out tool during welding can lead to weld defects, compromising the weld’s quality. To address this, we have established a distinct vibration range for three types of defects. During a new FSW operation, the system collects vibrational data, which the model uses to categorize the current vibration condition. Once a defect is identified, corrective actions are implemented. For example, the model is trained to recognize three types of defects as well as a “good” condition. When a new FSW operation begins, real-time vibrational data is generated and analyzed by the model. If the data indicates a misalignment defect, the operator is notified to inspect and correct the alignment of the workpieces. This corrective action enhances the weld’s quality. Without a machine learning classification model, the weld’s quality would suffer due to defects like misalignment, leading to tool wear, damage, and a shortened lifespan.
Tool Condition Monitoring (TCM) systems provide real-time feedback on the tool and welding process. This data enables immediate adjustments and management, ensuring consistent weld quality and tool condition throughout the operation. Implementing TCM in FSW offers significant financial benefits to companies by reducing tool failures, lowering scrap rates, and extending tool lifespan. Real-time monitoring allows businesses to identify and address issues before they escalate into costly failures or product defects. This enhances productivity, improves quality, reduces maintenance expenses, and minimizes rework, ultimately contributing to increased profitability.
Vibration plays a critical role in Friction Stir Welding (FSW) as it directly impacts weld quality. Monitoring tool vibration is essential because it acts as an early warning system, detecting wear and damage to the tool. Vibrations change with the tool’s condition, providing a reliable indicator of its health. This enables timely maintenance or re-placement, preventing tool failure and associated weld defects. Continuous vibration monitoring throughout the welding process ensures that any changes in tool performance are immediately addressed, reducing the risk of producing subpar welds. Additionally, the collected vibration data offers valuable insights for process optimization, allowing adjustments to maintain consistent material mixing, temperature distribution, and pressure. These adjustments lead to improved weld quality. By detecting changes in vibrational patterns, FSW tool condition monitoring helps prevent catastrophic tool failure during welding, reducing the likelihood of severe weld defects and material expulsion. Furthermore, monitoring vibrations extends the tool’s lifecycle, minimizes scrap and rework, and provides real-time feedback for process control. Collectively, these benefits enhance the overall quality and efficiency of the welding process.
Condition monitoring is a method used to monitor a tool during operation using sensors. In this study, researchers employ vibration sensors to monitor the FSW tool. Vibration analysis is one of the most effective non-destructive testing methods, providing precise values of specific components and aiding in predicting their lifespan (Alamelu Manghai and Jegadeeshwaran, 2019). Vibration-based condition monitoring has proven to be the most reliable method for assessing the state of functioning machine components. In this study, we propose an analysis of vibrations using machine learning and deep learning to monitor the FSW tool. This approach leverages advanced algorithms to analyze vibration data effectively. The FSW tool must always be maintained in a position and condition that ensures optimal welding properties. If the tool deteriorates, weld quality may be compromised. However, determining weld quality during welding is challenging. Except for vibrational analysis, there is no other method to assess the condition of the FSW tool during the welding process.
The vibration characteristics under various fault conditions were investigated using machine learning and deep learning for the fault detection approach. The fault identification method consists of three steps: feature extraction, feature selection, and feature classification. Feature extraction is the process of extracting parametric information from raw vibration signals. Several features, such as Wavelets (Alamelu Manghai and Jegadeeshwaran, 2019), statistical (Balachandar and Jegadeeshwaran, 2024), and histograms (Sakthivel et al., 2024), can be derived from raw data. This work focuses on the statistical features classification of fault. Feature selection is a process used to identify the most notable features. Various methods are available, such as Decision Tree (DT) (Balachandar and Jegadeeshwaran, 2024), (Sakthivel et al., 2011) and Principal Component Analysis (PCA) (Sakthivel et al., 2011). In this study, feature selection was carried out using the effect of the number of features study (Sun et al., 2007). The selected features were then classified using various ML algorithms such as Support Vector Machine (SVM) (Krishnamurthy et al., 2025), Proximal Support Vector Machine (PSVM) (Sakthivel et al., 2010), Bayes Net (BN) (Kumar et al., 2014), Naïve Bayes (NB) (Muralidharan and Sugumaran, 2012), Best-First Tree (Jegadeeshwaran and Sugumaran, 2014), Fuzzy Logic Model (Jegadeeshwaran and Sugumaran, 2015), etc.
This paper highlights the significance of condition monitoring, particularly through vibration analysis, in maintaining the optimal performance of Friction Stir Welding (FSW) tools. The proposed vibration-based condition monitoring method, incorporating machine learning and deep learning techniques, aims to enhance the predictive capabilities for FSW tool conditions, especially during welding. By searching into the vibrational characteristics under various fault conditions, this study contributes to the understanding of FSW tool behaviour. While traditional examination methods post-welding remains crucial for identifying external wear and damage, the limitations of their timing prompted the introduction of real-time vibrational data acquisition. The integration of machine and deep learning models, as demonstrated in Figure 1, empowers both skilled and unskilled labour to identify and rectify errors during the welding process promptly. This innovative approach not only enhances quality control but also improves efficiency, aligning with the broader trend of utilizing artificial intelligence in the manufacturing and materials sectors to optimize mechanical and microstructure qualities. It also offers valuable insights into advancing the reliability and performance of FSW tools through advanced condition monitoring techniques.
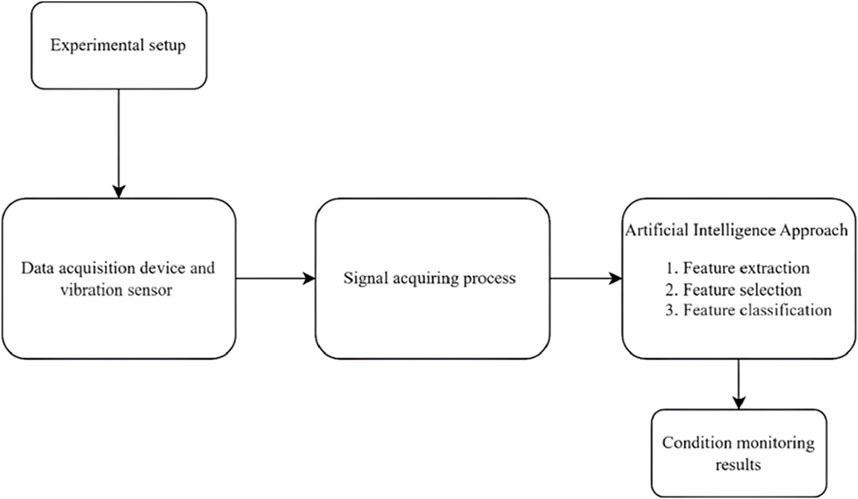
Figure 1. Methodology.
2 Experimental studies
A PLC-controlled friction stir welding machine was utilized to conduct the experiments, as illustrated in Figure 2. The machine specifications are detailed in Table 1.
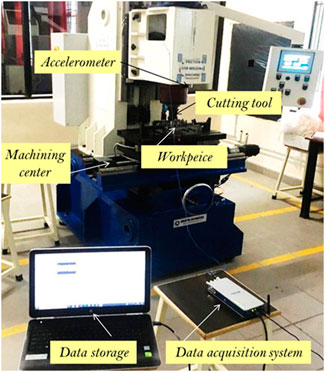
Figure 2. Experimental setup.
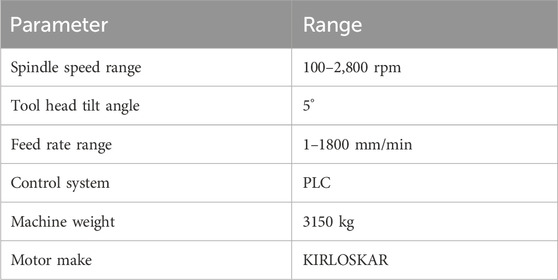
Table 1. Standard parameters of FSW.
2.1 Experimental setup
The workpiece used in this study was an Aluminum alloy (Aluminum 5,083) plate, with dimensions of 25 mm × 25 mm × 6 mm. The joints were created using a single-pass welding process, employing a threaded cylindrical pin-profiled H13 tool steel, as illustrated in Figure 3. The spindle speed was considered as 1,200 rpm and 1,400 rpm, while the feed rate was maintained at 30 mm/min. To capture vibration signals during the welding process, a piezoelectric accelerometer (manufactured by Daytron, with a capacity of 500 g and a sensitivity of 10.26 mV/g) was attached to the FSW machine using an adhesive method, as shown in Figure 4. These signals were acquired through a data acquisition module (NI 9234), capable of recording at 51.2 k samples per second, integrated with a C9191 Wi-Fi chassis (refer to Figure 5). The NI Lab-VIEW graphical program was utilized for recording the vibration data.
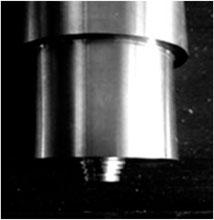
Figure 3. FSW Tool with threaded Pin.
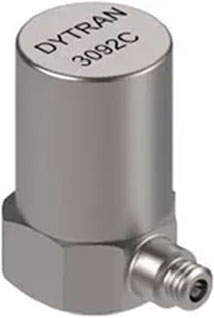
Figure 4. Piezoelectric accelerometer.
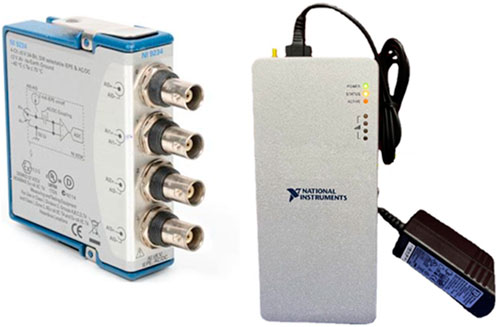
Figure 5. Data acquisition systems.
Both functional and defective conditions of the FSW tools were examined to collect vibration data. Four specific fault conditions were investigated:
• Airgap Defect: This occurs when there is a gap between the tool shoulder and the workpiece. Such a defect can result in incomplete penetration, voids, and other imperfections in the weld.
• Misalignment: This refers to improper alignment of the two edges of the material being welded. Misalignment can lead to poor weld quality, voids, and even cracking in the joint.
• One-Side Lift Defect: A common issue in Friction Stir Welding (FSW), where the material on one side of the weld lifts, creating a visible gap between the welded pieces.
• Good Condition Tool: A brand-new FSW tool with a tapered threaded pin was used as a reference for optimal performance.
The following welding parameters were used while recording the vibration signals:
• Speed 1,200 rpm and 1,400 rpm
• Feed 30 mm/min
• Feed piercing depth: 5.7 mm.
• Sample length: 8,192 (213) arbitrarily chosen.
• Sampling frequency: 20 kHz.
The selected parameter values were based on commonly reported operational ranges in the FSW literature, particularly for similar aluminium alloy workpiece materials used in this study.
Later, the vibration signals were captured by imitating the FSW tool’s most common failures, including air gaps, Misalignment, and One side Lift. The sample signal from the excellent and defective states of the FSW tool under various operating speeds is shown in Figures 6a–h.

Figure 6. Sample Vibration Signals. (a) Vibration Plot for good at 1,200 rpm (b) Vibration Plot for good at 1,400 rpm. (c) Vibration Plot for Airgap at 1,200 rpm (d) Vibration Plot for Airgap at 1,400 rpm. (e) Vibration Plot for Misalignment at 1,200 rpm (f) Vibration Plot for Misalignment at 1,400 rpm (g) Vibration Plot for Oneside lift at 1,200 rpm. (h) Vibration Plot for Oneside lift at 1,400 rpm.
3 Feature extraction and feature selection
Various features, such as statistical, wavelet, histogram, etc., can be derived from the vibration signal, depending on the nature of the signals. This study specifically focuses on extracting statistical features, which are fundamental and straightforward for feature classification. The study is grounded in a uniform set of statistical factors, including mean, median, mode, standard deviation, standard error, sample variance, kurtosis, skewness, maximum, minimum, count, and sum. These features were extracted from the vibration signal using a Visual Basic code. However, not all features extracted from the raw signal may be necessary for the classification study. Therefore, the next step is featuring selection to choose the best features from the group. Features that provide little or no information should be removed from the group. Feature selection can significantly improve the understandability of the resulting classifier models and often create a model that generalizes better to unseen data points. Several techniques have been proposed for feature selection, including the Decision Tree (Sun et al., 2007), Correlation, Principal Factor Analysis, and attribute evaluator using the best-first search method. Among these, the Decision Tree is a more appropriate choice for feature selection. The effectiveness of this feature selection is confirmed using an attribute evaluator.
4 Feature classification
The classification stage is the final step in machine learning, encompassing the training and testing of available data using a model or system. The model undergoes training with specific data and subsequently undergoes testing with previously unseen data, following the standard procedure in machine learning. An algorithmic approach is essential for training the model, and the subsequent subsections elaborate on six such algorithmic models.
4.1 Support vector machine (SVM)
The Support Vector Machine is a supervised machine learning algorithm employed for classification and regression tasks. Its functioning involves determining the most optimal hyperplane that effectively separates data points of distinct classes in a high-dimensional space (Krishnamurthy et al., 2025). An integral aspect of this algorithm is the support vectors, referring to the data points nearest to the hyperplane. The removal of these support vectors can alter the position of the dividing hyperplane, emphasizing the critical role of support vectors in a dataset. The hyperplane, responsible for linearly separating and classifying the given data set, is known as a hyperplane. The confidence in correct classification increases as data points move farther away from the hyperplane, remaining on the correct side of it. The SVM algorithm was chosen for its commendable classification accuracy and its effectiveness in classifying smaller, cleaner datasets. SVM’s efficiency is notable as it utilizes a subset of training points.
4.2 Multi-Layer Perception (MLP)
Multi-Layer Perceptron (MLP) stands as an Artificial Neural Network utilized in both machine learning and deep learning, finding applications in diverse fields like language processing and image recognition (Gao et al., 2025). Comprising numerous small neurons organized into layers, an MLP typically features three types of layers:
Input Layer: Neurons in this layer receive the data.
Hidden Layer: Neurons in the hidden layer preprocess the data, seeking patterns.
Output Layer: Neurons in the output layer produce the result.
The connections between neurons are influenced by weights, determining the significance of each connection. Each neuron sums up its inputs, weights them, and passes them through an activation function, which determines whether a neuron should be active. This introduces non-linearity, enabling the model to capture complex functions. During training, the MLP is presented with the dataset and corresponding labels. To enhance accuracy, it adjusts the weights iteratively. When faced with a new dataset, the MLP employs the learned weights to make predictions. As the data traverses the layers, weights are adjusted, and neurons are activated until the model generates an output.
4.3 Cascade correlation (CC)
Cascade Correlation (CC) is a versatile machine learning algorithm suitable for addressing a broad spectrum of problems, including pattern recognition, regression, and classification (Trzepieciński et al., 2025). Characterized as a self-organizing neural network, cascade correlation exhibits a unique learning approach by dynamically expanding its structure during the learning process. It initiates with a small network and incrementally adds new hidden units one at a time. The cascade correlation method involves the continuous creation of new hidden units, each connected to all input units. Subsequently, the training process focuses on maximizing the correlation between the output of the new hidden unit and the residual error. This iterative procedure continues until the error is minimized or the maximum designated number of hidden units has been reached. Notably, the training of cascade correlation neural networks is robust, often yielding good results with minimal parameter adjustments. Unlike some other algorithms, cascade correlation demonstrates a low likelihood of being trapped in local minima during the training process.
4.4 Probabilistic neural network (PNN)
The Probabilistic Neural Network (PNN) is a type of feedforward neural network widely employed in pattern recognition and classification, particularly when dealing with continuous target variables (Chaki et al., 2022). Its foundation lies in the application of Bayes’ theorem, a statistical principle describing the probability of an event occurring given the occurrence of another event. In the context of PNN, the probability density function (PDF) for each class in the training dataset is estimated. This function characterizes the likelihood of a specific input vector belonging to a particular class. Once the PDF for each class is determined, PNN utilizes Bayes’ theorem to calculate the posterior probability of a new input vector belonging to each class. The posterior probability signifies the likelihood of a new input vector being associated with a particular class, considering the known PDFs of each class. Ultimately, PNN assigns the new input vector to the class with the highest posterior probability. Known for its accuracy in classification, PNN distinguishes itself by its faster training process and heightened resilience to the influence of outliers.
4.5 GMDH (Group Method of Data Handling) polynomial neural network
GMDH, or Group Method of Data Handling, represents a recursive algorithm employed in modeling relationships between input and output data through polynomials within a GMDH polynomial neural network (Chen et al., 2020). This neural network variant possesses self-organizing capabilities, allowing it to learn the network’s structure directly from the data. In the GMDH algorithm, each candidate neuron takes the form of a polynomial with a specific degree, generated by combining input features in various configurations. Evaluation of candidates is conducted using a fitness function, often the mean squared error on training data. The most optimal candidate neurons are selected and incorporated into the network. The iterative process involves creating a pool of candidate neurons, evaluating them, and selecting the best candidates until the desired level of accuracy or the maximum designated number of neurons is reached. To assess the network’s ability to generalize new data, its performance is evaluated on a testing set. GMDH networks boast interpretability due to their foundation in polynomials, which are simple mathematical functions. Moreover, these networks exhibit robustness to outliers present in the data.
4.6 Linear discriminant analysis (LDA)
Linear discriminant analysis (LDA) serves as a supervised machine learning algorithm specializing in classification tasks, renowned for its simplicity and effectiveness (Uthirapathy and Sandanam, 2023). Operating on a labeled dataset where each data point is assigned to a specific class, LDA undergoes a systematic process. For each class, LDA computes the mean vector of the features, symbolizing the centroid of that class. Subsequently, LDA calculates two scatter matrices: the within-class scatter matrix (Sw), gauging data dispersion within each class, and the between-class scatter matrix (Sb), assessing the separation between class centroids. Next, LDA identifies the eigenvectors and eigenvalues for the matrix Sw^(-1) * Sb. These eigenvectors signify the directions, i.e., linear combinations of features, that optimize the separation between classes. Discriminant components are derived from the eigenvectors corresponding to the largest eigenvalues. The Discriminant components play a crucial role in protecting the data onto a lower-dimensional space while maximizing class separability. New data points undergo projection onto the same discriminant components, and their class labels are determined based on their proximity to class centroids.
4.7 Summary
Support Vector Machine (SVM) relies on finding optimal decision boundaries using kernel functions, making it effective for high-dimensional data without iterative training. Multi-Layer Perceptron (MLP) is a traditional neural network that learns through backpropagation, allowing it to model complex non-linear relationships but requiring careful tuning to avoid overfitting. Cascade Correlation (CC) stands out by building its network architecture dynamically during training, adding neurons one at a time. Probabilistic Neural Network (PNN) uses statistical distributions and kernel estimation for fast, probabilistic classification, avoiding the need for iterative learning. GMDH Polynomial Neural Network automatically evolves its structure layer by layer, combining polynomial regression with feature selection to model complex systems. Linear Discriminant Analysis (LDA) is a simple, linear method that assumes Gaussian distribution and maximizes class separability in reduced space. Each algorithm differs in learning strategy, complexity, speed, and suitability for specific data types and problem domains.
The six algorithms—SVM, MLP, CC, PNN, GMDH, and LDA—differ from other machine learning models in their structure, training, and assumptions. Unlike decision trees or random forests, they rely on mathematical or statistical functions rather than rule-based splits. SVM uses kernel-based separation, MLP and CC are trained iteratively like neural networks, PNN applies probabilistic density estimation for fast classification, GMDH self-organizes polynomial models, and LDA assumes Gaussian distributions for linear class separation—setting them apart from more flexible or data-driven methods like k-NN or deep learning.
5 Results and discussion
The prognosis for the tool life of the Friction Stir Welding (FSW) tool was determined using vibration-based machine learning, The experimental materials chosen for this study were aluminium alloy 5,083 and H13 steel. The experiments were conducted under fixed parameters, including spindle speed and piercing depth, to examine the vibration behaviour. Vibration signals were systematically recorded under various conditions of the FSW tool, and a comprehensive analysis was performed employing a machine learning approach. The experiments involved recording vibration signals at both 1,400 and 1,200 rpm, maintaining a consistent feed rate of 30 mm/min. Initially, the tool was in optimal condition, and vibration signals were recorded. Subsequently, each fault was intentionally simulated on the tool, and the corresponding signals were recorded under identical parameters. A total of 13 statistical parameters were then extracted from the raw vibration signals for further analysis.
5.1 Effect of the number of features studies
Not all the features extracted are necessary for classification. Therefore, feature selection was performed. The study of the effect of the number of features was used to select the most appropriate features. In this study, an attribute evaluator was used to determine the order of the features. The attribute evaluator uses a best-first search algorithm to order the contributing features. This order was confirmed by classifying it in algorithms. In this process, the first feature and the condition class were used for classification and the accuracy was recorded. The top two features were combined and classified again. This process was repeated until all feature combinations were combined and classified. Tables 2, 3 display the effect of individual feature combinations on classification accuracy.
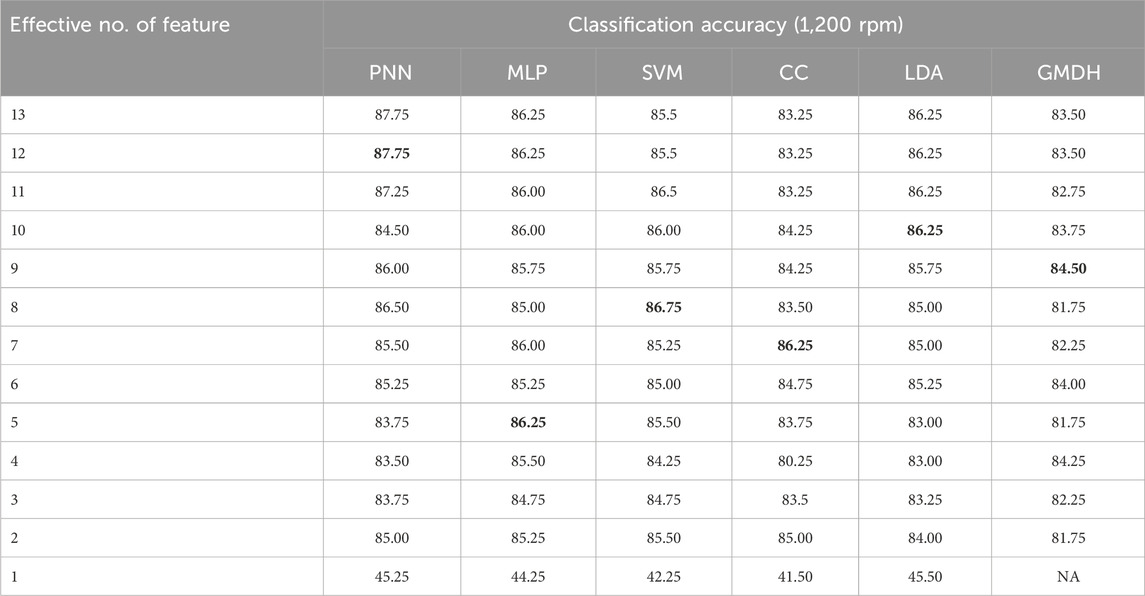
Table 2. Effect of number of features on classification accuracy for 1,200 rpm.
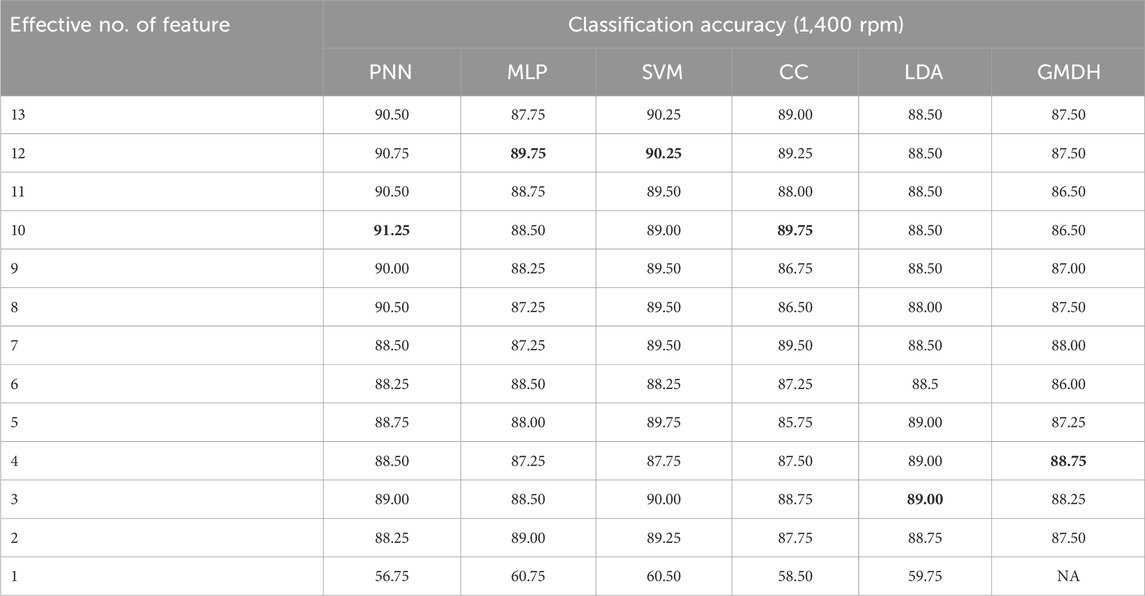
Table 3. Effect of number of features on the classification accuracy for 1,400 rpm.
In Table 3, feature selection procedures were applied to refine the chosen features, and these selected features underwent classification using the specified feature classifiers. As depicted in Table 2, the highest classification accuracy achieved at 1,200 rpm was 87.75%, employing the PNN algorithm and incorporating 12 effective features. An option to reduce the number of effective features from 12 to eight exists, resulting in a marginal accuracy reduction of approximately 1.25%. This reduction, however, comes with the advantage of decreased computational complexity. It is noteworthy that in situations where stringent classification sensitivity is a priority, retaining all 12 features, despite increased computational demands, might be more judicious to attain higher accuracy.
Upon examining Table 3, the PNN algorithm demonstrated the highest classification accuracy of 91.25% at 1,400 rpm, utilizing 10 effective features. Similarly, there is an option to reduce the number of effective features from 10 to 3, with a subsequent accuracy reduction of around 2.25%. This reduction provides a computational complexity advantage. Again, the decision to retain all 10 features or opt for a reduced set depends on the specific needs of the classification study. In scenarios where heightened sensitivity in classification is crucial, retaining all 10 features might be preferred, despite the associated increase in computational complexity required to achieve higher accuracy. The rationale behind considering a reduced number of effective features is primarily to mitigate computational complexity. It is essential to acknowledge that while reducing the number of features can streamline computational demands, there may be instances where prioritizing higher classification accuracy is warranted, even at the expense of increased computational complexity due to a larger effective feature set.
5.2 Feature classification using the probabilistic neural network
Based on the results presented in Tables 2, 3, the Probabilistic Neural Network (PNN) emerged as the most effective algorithm for classification, achieving the highest accuracy regardless of spindle speed. At 1,200 rpm, PNN achieved a classification accuracy of 87.75%, while at 1,400 rpm, it reached 91.25%. At 1,400 rpm, the top ten features used for classification were: standard error, mean, sum, standard deviation, sample variance, minimum, range, median, maximum, mode, skewness, and kurtosis. At 1,200 rpm, the top twelve features included: standard error, standard deviation, sample variance, mean, range, kurtosis, sum, minimum, maximum, mode, skewness, and median. To further analyze the classification performance, confusion matrices were generated. Table 4 shows the confusion matrix for 1,200 rpm, where the diagonal elements indicate correctly classified instances. For example, out of 100“Good” samples, 93 were correctly identified, seven were misclassified as “Airgap,” and 1 as “One side Lift.” In the “Airgap” category, 89 were correctly classified, one was misclassified as “Good,” and 10 as “One side Lift.”
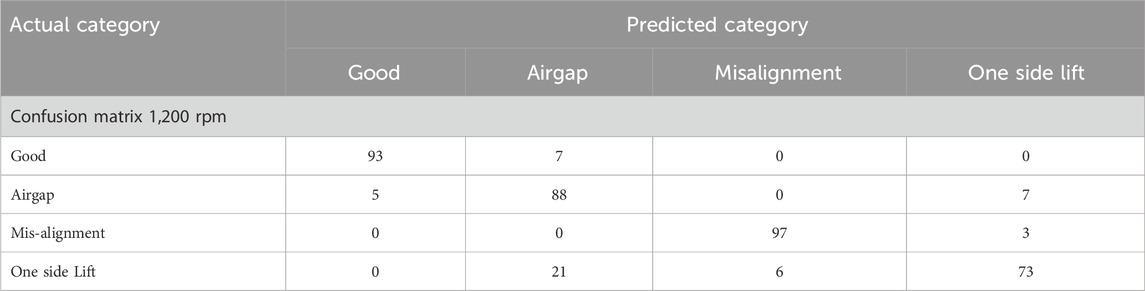
Table 4. Confusion matrix for Probabilistic Neural Network algorithm under 1,200 rpm.
Table 5 presents similar results for 1,400 rpm, revealing a reduction in misclassifications. Specifically, only 49 out of 400 data points were misclassified at 1,200 rpm (accuracy: 87.75%), compared to just 37 misclassifications at 1,400 rpm (accuracy: 91.25%). These matrices provide a detailed view of the model’s precision across different fault categories, highlighting the robustness of the PNN in diagnosing faults under varying spindle speeds. Although the accuracy at 1,200 rpm was slightly lower, PNN consistently demonstrated strong predictive performance at both speeds. The Probabilistic Neural Network provided superior classification accuracy for the selected features at both 1,200 rpm and 1,400 rpm, confirming its effectiveness in fault diagnosis under variable machining conditions.
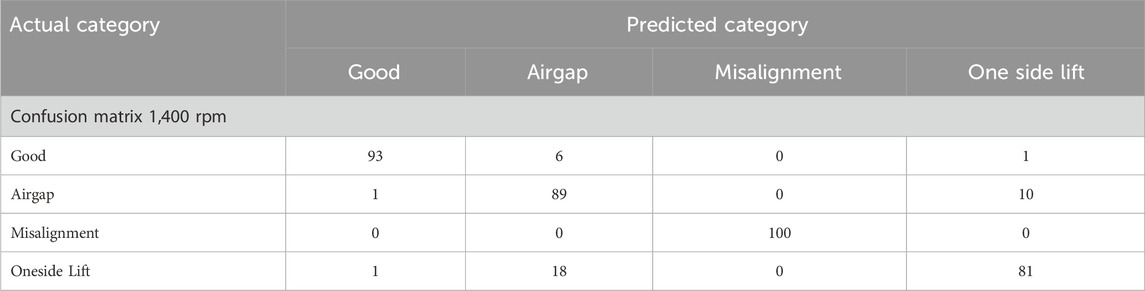
Table 5. Confusion matrix for Probabilistic Neural Network algorithm under 1,200 rpm.
5.3 Comparative study
The classification study involved the evaluation of seven different classifiers, each applied to the vibration-based machine learning analysis at spindle speeds of 1,200 rpm and 1,400 rpm. Notably, the Probabilistic Neural Network emerged as the most effective classifier, consistently demonstrating superior classification accuracy for both speeds. A comprehensive comparison of the classifier performances is presented in Table 6. The results reveal a higher accuracy at 1,400 rpm compared to 1,200 rpm. This discrepancy in accuracy can be attributed to the lower variation among fault conditions and the generally poorer weld quality observed at the lower spindle speed of 1,200 rpm. In contrast, at the higher speed of 1,400 rpm, the vibration patterns become more distinguishable, contributing to the increased accuracy of fault classification. Specifically, the Probabilistic Neural Network exhibited the highest accuracy among all classifiers, achieving 87.75% accuracy at 1,200 rpm and an even more impressive 91.25% accuracy at 1,400 rpm. This underscores the efficacy of the PNN algorithm in accurately identifying and classifying faults in Friction Stir Welding tool conditions under varying operational speeds.
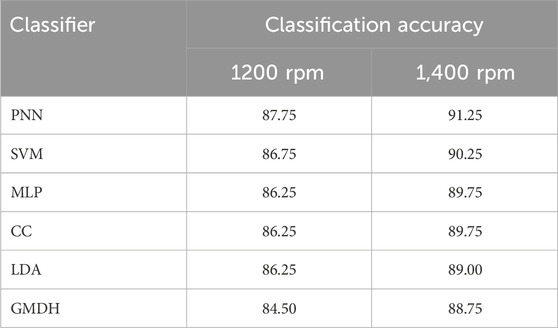
Table 6. Comparative results.
5.4 Future scope
Given the encouraging outcomes observed in this study, there is an opportunity to extend the predictive capabilities of vibration data to intermediate speeds using artificial intelligence techniques. The methodologies and procedures employed in this research can be applied to extrapolate and predict vibration data for spindle speeds between the tested 1,200 rpm and 1,400 rpm. Furthermore, the success of artificial intelligence techniques, particularly the Probabilistic Neural Network (PNN), in accurately assessing FSW tool health at different operating conditions opens avenues for exploring and identifying the best predictive models. By systematically applying similar procedures to diverse operating conditions, the study can contribute to establishing robust predictive models that cater to a broader range of scenarios. This suggests a promising direction for future research, where the application of artificial intelligence in FSW tool condition monitoring can be expanded and optimized for various operational parameters. Such an approach could enhance the versatility and adaptability of predictive models, ultimately contributing to a comprehensive understanding of FSW tool health across a spectrum of working conditions.
6 Conclusion
This study focused on the condition monitoring of Friction Stir Welding (FSW) tools, utilizing aluminium alloy 5,083 as the workpiece material and conducting experiments at spindle speeds of 1,200 rpm and 1,400 rpm. Four distinct conditions, namely, good condition, air gap, misalignment, and one-side lift, were examined, and vibrational signals were acquired to investigate the tool’s performance. The analysis involved the extraction of statistical features from the raw vibrational signals, and these features were subsequently subjected to classification using a range of machine learning and deep learning algorithms which includes, support vector machines, multilayer perceptron, Cascade Correlation, Probabilistic Neural Network, Group Method of Data Handling, Linear Discriminant Analysis. Notably, the Probabilistic Neural Network (PNN) emerged as the most effective algorithm, achieving a remarkable accuracy of 87.75% at 1,200 rpm and an even higher accuracy of 91.25% at 1,400 rpm. The disparity in classification accuracy between the two spindle speeds is attributed to the distinguishability of vibration patterns. At 1,200 rpm, the lower speed resulted in less distinguishable vibration patterns among fault conditions, leading to a lower classification accuracy. In contrast, the higher spindle speed of 1,400 rpm facilitated easier detection of vibration patterns, contributing to the superior accuracy observed at this speed. Based on these findings, the Probabilistic Neural Network algorithm is identified as a robust and reliable prediction model for monitoring FSW tool conditions, particularly at spindle speeds of 1,200 rpm and 1,400 rpm. The study underscores the importance of selecting appropriate algorithms based on operational parameters for effective tool condition monitoring in FSW processes.
Data availability statement
The raw data supporting the conclusions of this article will be made available by the authors, without undue reservation.
Author contributions
BK: Methodology, Software, Conceptualization, Writing – original draft, Investigation. JR: Supervision, Formal Analysis, Resources, Validation, Writing – review and editing, Project administration, Visualization.
Funding
The author(s) declare that no financial support was received for the research and/or publication of this article.
Conflict of interest
The authors declare that the research was conducted in the absence of any commercial or financial relationships that could be construed as a potential conflict of interest.
Generative AI statement
The author(s) declare that no Generative AI was used in the creation of this manuscript.
Publisher’s note
All claims expressed in this article are solely those of the authors and do not necessarily represent those of their affiliated organizations, or those of the publisher, the editors and the reviewers. Any product that may be evaluated in this article, or claim that may be made by its manufacturer, is not guaranteed or endorsed by the publisher.
Author disclaimer
The statements, opinions and data contained in all publications are solely those of the individual author(s) and contributor(s) and not of MDPI and/or the editor(s). MDPI and/or the editor(s) disclaim responsibility for any injury to people or property resulting from any ideas, methods, instructions or products referred to in the content.
References
Alamelu Manghai, T. M., and Jegadeeshwaran, R. (2019). Vibration based brake health monitoring using wavelet features: a machine learning approach. JVC/Journal Vib. Control 25 (18), 2534–2550. doi:10.1177/1077546319859704
Balachandar, K., and Jegadeeshwaran, R. (2024). Enhancing friction stir welding: quality machine learning based friction stir welding tool condition monitoring. Int. Res. J. Multidiscip. Technovation 6 (3), 245–259. doi:10.54392/irjmt24319
Chaki, S., Routray, A., and Mohanty, W. K. (2022). A probabilistic neural network (PNN) based framework for lithology classification using seismic attributes. J. Appl. Geophys. 199, 104578. doi:10.1016/j.jappgeo.2022.104578
Chen, J., Yin, H., and Zhang, D. (2020). A self-adaptive classification method for plant disease detection using GMDH-Logistic model. Sustain. Comput. Inf. Syst. 28, 100415. doi:10.1016/j.suscom.2020.100415
Devaiah, D., Kishore, K., and Laxminarayana, P. (2018). Optimal FSW process parameters for dissimilar aluminium alloys (AA5083 and AA6061) Using Taguchi Technique. Mater. Today Proc. 5, 4607–4614. doi:10.1016/j.matpr.2017.12.031
Di Bella, G., Favaloro, F., and Borsellino, C. (2023). Effect of process parameters on friction stir welded joints between dissimilar Aluminum alloys: a review. Metals 13, 1176. doi:10.3390/met13071176
Gao, H., Guo, Q., Zhang, Z., and Li, Y. (2025). An integrated feature extraction framework of linear multi-layer perceptron to reduce computation complexity for remaining useful life prediction. Eng. Appl. Artif. Intell. 141, 109846. doi:10.1016/j.engappai.2024.109846
Jegadeeshwaran, R., and Sugumaran, V. (2014). Comparative study of decision tree classifier and best first tree classifier for fault diagnosis of automobile hydraulic brake system using statistical features. Measurement 46 (9), 3247–3260. doi:10.1016/j.measurement.2013.04.068
Jegadeeshwaran, R., and Sugumaran, V. (2015). Fuzzy classifier with automatic rule generation for fault diagnosis of hydraulic brake system using statistical features. Int. J. Fuzzy Comput. Model. 1 (3), 333. doi:10.1504/ijfcm.2015.069958
Khaliq, A., and Bharti, P. K. (2015). Influence of tool material on mechanical properties of AA6061-O during the friction stir welding process. IOSR J. Mech. Civ. Eng. Ver. I 12 (5). doi:10.9790/1684-12513136
Krishnamurthy, B., Rakkiyannan, J., Gnanasekaran, S., and Thangamuthu, M. (2025). Condition monitoring of friction stir welding tool with vibration signals using support vector machine classifiers. Eng. Res. Express 7 (1), 015564. doi:10.1088/2631-8695/adb93b
Kumar, H., Ranjit Kumar, T. A., Amarnath, M., and Sugumaran, V. (2014). Fault diagnosis of bearings through vibration signal using Bayes classifiers. Int. J. Comput. Aided Eng. Technol. 6 (1), 14. doi:10.1504/IJCAET.2014.058002
Muralidharan, V., and Sugumaran, V. (2012). A comparative study of Naïve Bayes classifier and Bayes net classifier for fault diagnosis of monoblock centrifugal pump using wavelet analysis. Appl. Soft Comput. 12 (8), 2023–2029. doi:10.1016/j.asoc.2012.03.021
Sakthivel, G., Pathi Jakkamputi, L., Rakkiyannan, J., Thangamuthu, M., and Bhalerao, Y. (2024). A comprehensive approach for detecting brake pad defects using histogram and wavelet features with nested dichotomy family classifiers. Sensors 23 (22). doi:10.3390/s23229093
Sakthivel, N. R., Indira, V., Nair, B. B., and Sugumaran, V. (2011). Use of histogram features for decision tree-based fault diagnosis of monoblock centrifugal pump. Int. J. Granul. Comput. Rough. Sets Intell. Syst. 2 (1), 23. doi:10.1504/ijgcrsis.2011.041458
Sakthivel, N. R., Sugumaran, V., and Nair, B. B. (2010). Application of support vector machine (SVM) and proximal support vector machine (PSVM) for fault classification of monoblock centrifugal pump. Int. J. Data Anal. Tech. Strateg. 2 (1), 38. doi:10.1504/IJDATS.2010.030010
Solanki, S. A., and Dhruv, A. B. (2024). A comparative study of friction stir welding and friction stir scribe technique for dissimilar metal joining. Eng. Res. Express 6 (4), 042502. doi:10.1088/2631-8695/ad849e
Sun, W., Chen, J., and Li, J. (2007). Decision tree and PCA-based fault diagnosis of rotating machinery. Mech. Syst. Signal Process. 21 (3), 1300–1317. doi:10.1016/j.ymssp.2006.06.010
Sun, Y., Gong, W., Feng, J., Lu, G., Zhu, R., and Li, Y. (2022). A review of the friction stir welding of dissimilar materials between Aluminum alloys and copper. Metals 12, 675. doi:10.3390/met12040675
Thomas, W. M., and Nicholas, E. D. (1997). Friction stir welding for the transportation industries. Mater. Des. 18 (4–6), 269–273. doi:10.1016/s0261-3069(97)00062-9
Trzepieciński, T., Szwajka, K., Zielińska-Szwajka, J., and Szewczyk, M. (2025). Current trends in monitoring and analysis of tool wear and delamination in wood-based panels drilling. Machines 13 (3), 249. doi:10.3390/machines13030249
Keywords: friction stir welding, real-time tool condition monitoring, statistical features, probabilistic neural network, classification accuracy
Citation: Krishnamurthy B and Rakkiyannan J (2025) Enhancing tool condition monitoring in friction stir welding with probabilistic neural network algorithm. Front. Mech. Eng. 11:1613216. doi: 10.3389/fmech.2025.1613216
Received: 16 April 2025; Accepted: 15 May 2025;
Published: 26 May 2025.
Edited by:
Mohanraj Thangamuthu, Amrita Vishwa Vidyapeetham, IndiaReviewed by:
Padmanaban Ramasamy, Amrita Vishwa Vidyapeetham University, IndiaDinesh Kumar Madheswaran, SRM Institute of Science and Technology, India
Copyright © 2025 Krishnamurthy and Rakkiyannan. This is an open-access article distributed under the terms of the Creative Commons Attribution License (CC BY). The use, distribution or reproduction in other forums is permitted, provided the original author(s) and the copyright owner(s) are credited and that the original publication in this journal is cited, in accordance with accepted academic practice. No use, distribution or reproduction is permitted which does not comply with these terms.
*Correspondence: Jegadeeshwaran Rakkiyannan, amVnYWRlZXNod2FyYW4uckB2aXQuYWMuaW4=
†ORCID: Balachandar Krishnamurthy, orcid.org/0000-0001-9019-4803