 Honglan Pei1
 Chun Xiao
- 1State Grid Yuncheng Electric Power Supply Company, Yuncheng, Shanxi, China
- 2State Grid Taiyuan Electric Power Supply Company, Taiyuan, Shanxi, China
- 3State Grid Shanxi Marketing Service Center, Taiyuan, Shanxi, China
Introduction: With the continuous increase in the penetration rate of distributed photovoltaic and energy storage systems in distribution networks, the deterioration of harmonic pollution problems poses a threat to the safe operation of the power grid.
Methods: This paper proposes an improved particle Swarm optimization algorithm (IPSO) for optimizing the harmonic suppression strategy of distributed photovoltaic energy storage distribution networks. By introducing weighted average and fuzzy control, the problems of poor search accuracy and local optima in traditional algorithms can be solved. Based on the harmonic distortion rate objective function of the filter device, the optimal configuration of the capacity and position of the filter device is achieved through an improved algorithm, effectively suppressing the harmonics in the distribution network and improving the power quality of the distribution network. To test the feasibility of the strategy, simulation experiments were conducted.
Results: The results showed that after the harmonic suppression device was installed in the distribution network, the distortion rate of the grid-connected current decreased from 19.99% to 2.54%, verifying the effectiveness of the proposed strategy in reducing current harmonic distortion and improving the quality of the current waveform.
Discussion: It can be seen that it is feasible to optimize and suppress harmonics in distributed photovoltaic storage distribution networks by improving the Particle Swarm Optimization (PSO)algorithm, providing new ideas for harmonic control in distribution networks under the high proportion of renewable energy access and promoting the development of the domestic power industry.
Introduction
Under the dual carbon goals, distributed photovoltaic and energy storage systems have been large-scale integrated into distribution networks. However, the nonlinear characteristics of power electronic equipment have exacerbated harmonic problems (Chen, 2024). Standards such as IEEE 519-2022 put forward higher requirements for harmonic limits, and the design of traditional passive filters is difficult to adapt to the complex and changeable harmonic environment (Liu and Wang, 2023; Ning et al., 2021). The existing research mainly focuses on centralized harmonic suppression (such as active power filters (APF)), but there is insufficient research on the collaborative optimization of multiple harmonic sources in distributed photovoltaic storage scenarios (Yao et al., 2024; Li and Gao, 2024; Li et al., 2025). Intelligent algorithms (such as PSO and Genetic Algorithm (GA)) show potential in parameter optimization, but there are problems such as premature convergence and local optimality (Shu et al., 2025; Xu et al., 2017). In order to face the global climate change situation, adjust the energy consumption structure and cultivate a number of strategic emerging industries for the rapid development of related industries, countries around the world have formulated and introduced some relevant policies to promote the development of the global new energy industry and gradually expand the scale of the new energy power generation market (Yuan et al., 2025). For example, the overview of solar thermal utilization in Japan in 1985 (Noguchi, 1985), “The Development of Photovoltaic Power Generation Systems under Solar Engineering in Japan in 1991 (Morishita et al., 1991)”, the solar roof project in Italy (Palladino and Calabrese, 2023), and the solar roof tiles proposed by Mokheseng MB: Towards a macroeconomic model (Mokheseng, 2010), etc. With the continuous progress and rapid development of solar energy technology, industries, equipment and grid connection technologies related to photovoltaic have been constantly innovating and breaking through. Coupled with the excellent solar energy resources and low construction costs, as well as the continuous expansion of photovoltaic power generation scale, solar power generation has become the fastest-growing new energy source.
In China, photovoltaic power generation started relatively late, but its research and popularization have been rapid, with the growth rate ranking first in the world. From 2017 to 2022, the investment and financing in China’s photovoltaic industry generally showed a growth trend. The photovoltaic industry is a new energy sector encouraged by the state and also an important component of the strategic emerging industries that the state focuses on supporting (Jiang et al., 2025). By the end of 2015, the installed capacity of photovoltaic units in China had exceeded 40 million kW. According to the national power industry statistics released by the National Energy Administration of China, China’s new and cumulative installed capacity of photovoltaic power has ranked first in the world for many consecutive years. In 2022, China’s installed capacity of photovoltaic power increased by 87.43 million kW, a year-on-year growth of 60.3%. By the end of 2022, the total installed capacity of photovoltaic power generation in China was 393 million kW, increasing by 28.1% year-on-year (The National Energy Administration released the 2023 National Power Industry Statistics, 2024). However, the inherent intermittency and volatility of photovoltaic power pose a huge challenge to its efficient consumption.
To this end, this paper proposes to improve PSO to solve the spatio-temporal coupling characteristics of distributed harmonic sources and the collaborative optimization problem of treatment equipment, which has both theoretical innovation and engineering application value.
Analysis of harmonic characteristics of distributed photovoltaic storage and distribution networks
Harmonic suppression device
Harmonic control in distribution networks is an effective means to improve the power quality of distribution networks. By installing filters, the power quality of distribution networks can be effectively enhanced and a certain amount of reactive power can be compensated. Among them, the passive power filter, while considering the functions of reactive power compensation and voltage regulation, adjusts the internal passive components to make the resonant frequency cancel out the harmonic frequency to be filtered, thereby achieving the purpose of filtering. Generally, three-phase transformers can achieve the purpose of eliminating multiples of three harmonics by using different wiring methods. The requirements for cost, filtering performance and stability are all factors that need to be taken into account when designing passive filters. Active power filters can dynamically suppress harmonics and compensate reactive power. According to the grid connection mode, active power filters can be classified into independent series type, independent parallel type, hybrid active filters and multi-converter hybrid type. It can also be classified into voltage type and current type according to the type. The independent series APF is connected in series in the system through a transformer. Its principle is to track the harmonic components in the harmonic source voltage, generate opposite harmonic voltages, and thereby cancel out the harmonic components in the system. Single and parallel APF can be regarded as APF harmonic current generators. Its principle is that dynamic compensation of reactive power can be easily achieved through cascade connection, and it can compensate for large-capacity harmonic currents. Limited by the withstand voltage and overcurrent capacity of switching devices, in high-power applications, a hybrid filter constructed by connecting active filters in series and passive filters in parallel can effectively solve problems such as power level limitations. The harmonic control effect of APF is not affected by changes in the system structure. In addition,APF also features strong controllability, fast response speed, dynamic harmonic control and other characteristics, and series and parallel resonances occur with different system impedances. However, it is necessary to deal with the problems of large active power loss, large capacity and complex control. In conclusion, the reasonable configuration of active and passive filters is one of the main measures to solve the power system network at present. Due to the complexity of the actual power grid operation, the optimal configuration of multiple filtering devices can be considered after the distributed photovoltaic storage system is connected to the distribution network.
Construction of the harmonic suppression objective function
The power quality of the distribution network can be optimized by rationally configuring the capacity and position of the filters. Aiming at the problem of how to find the optimal configuration position and capacity of the filter, by setting the objective function of the total distortion rate of harmonic voltage, and under the constraints of voltage, current, etc., a new adaptive fuzzy particle swarm optimization algorithm is studied to achieve the optimal configuration of the capacity and position of the filter device, suppress the harmonics of the distribution network, and improve the power quality of the distribution network. Among them, the total harmonic voltage distortion rate of each node in the objective function of the total harmonic voltage distortion rate is represented by Equation 1.
The average value of the total distortion of harmonic voltage at each node can be calculated by Equation 2.
The basic constraints of voltage, current and capacity are shown in Equation 3.
The current, voltage, power constraints of the passive filter and the capacity constraints of the active filter are shown in Equation 4.
Among them, the effective value of each characterization of the capacitor is represented by
Among them, the upper limit value of the total harmonic distortion rate of voltage is represented by
Among them, the system frequency characterizations are respectively the fundamental frequency
Improve the PSO design
In the
Among them, the inertia weight is represented by
Among them,
Among them, the weight vector is represented by
Because PSO does not consider both the optimal value of particle velocity and the optimal position of particles simultaneously, it is very easy to fall into the problem of local optimum. In this paper, by adopting the fuzzy strategy to iteratively update the particle positions, the overall optimum is obtained. Fuzzy policy control is applied to Equation 7 to obtain Equations 12, 13.
Among them,
Among them,
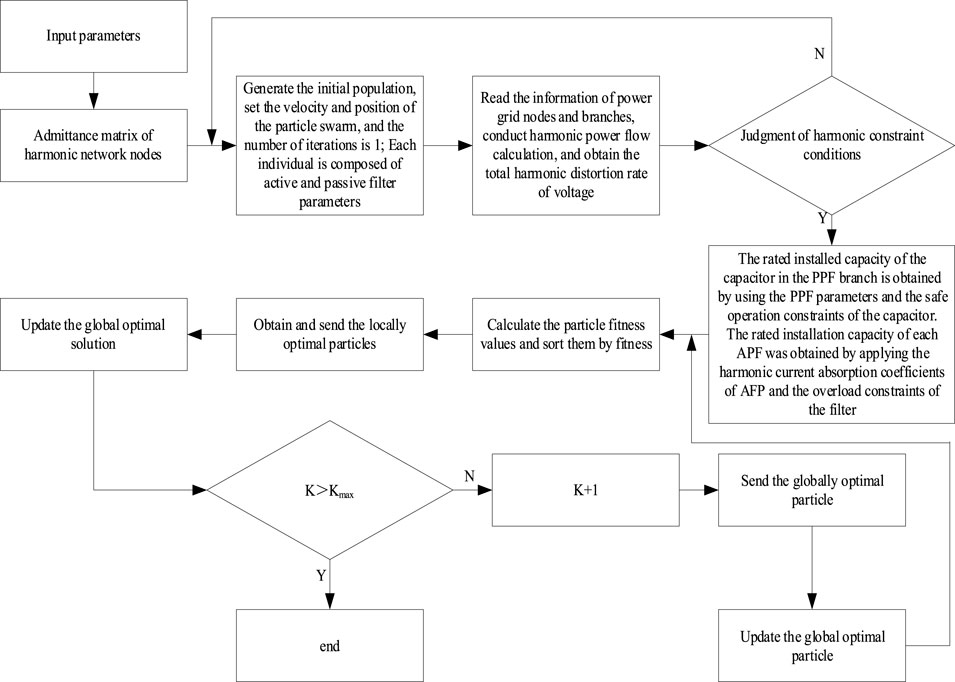
Figure 1. Optimization process of distribution network filtering.
It can be seen that after inputting the parameters, the admittance matrix of the harmonic network nodes generates an initial group, and then the velocity and position of the particle swarm can be set. At this time, the number of iterations is 1. Each individual is composed of active and passive filter parameters. Then, read the information of the power grid nodes and branches, and perform harmonic power flow calculation to obtain the total harmonic distortion rate of the voltage. Secondly, determine the harmonic constraint conditions. When the harmonic constraint conditions are met, impose constraints on the PPF parameters and the safe operation of the capacitor, and obtain the rated installation capacity of the capacitor in the PPF branch. Meanwhile, the rated installation capacity of each APF is obtained by applying the harmonic current absorption coefficients of each APF and the overload constraints of the filter. Finally, calculate the optimal solution. When
Simulation experiment and result analysis
Simulation analysis
An empirical analysis was conducted by drawing on the operation diagram of the local distribution network system in Area A of Hunan Province. As shown in Figure 2.
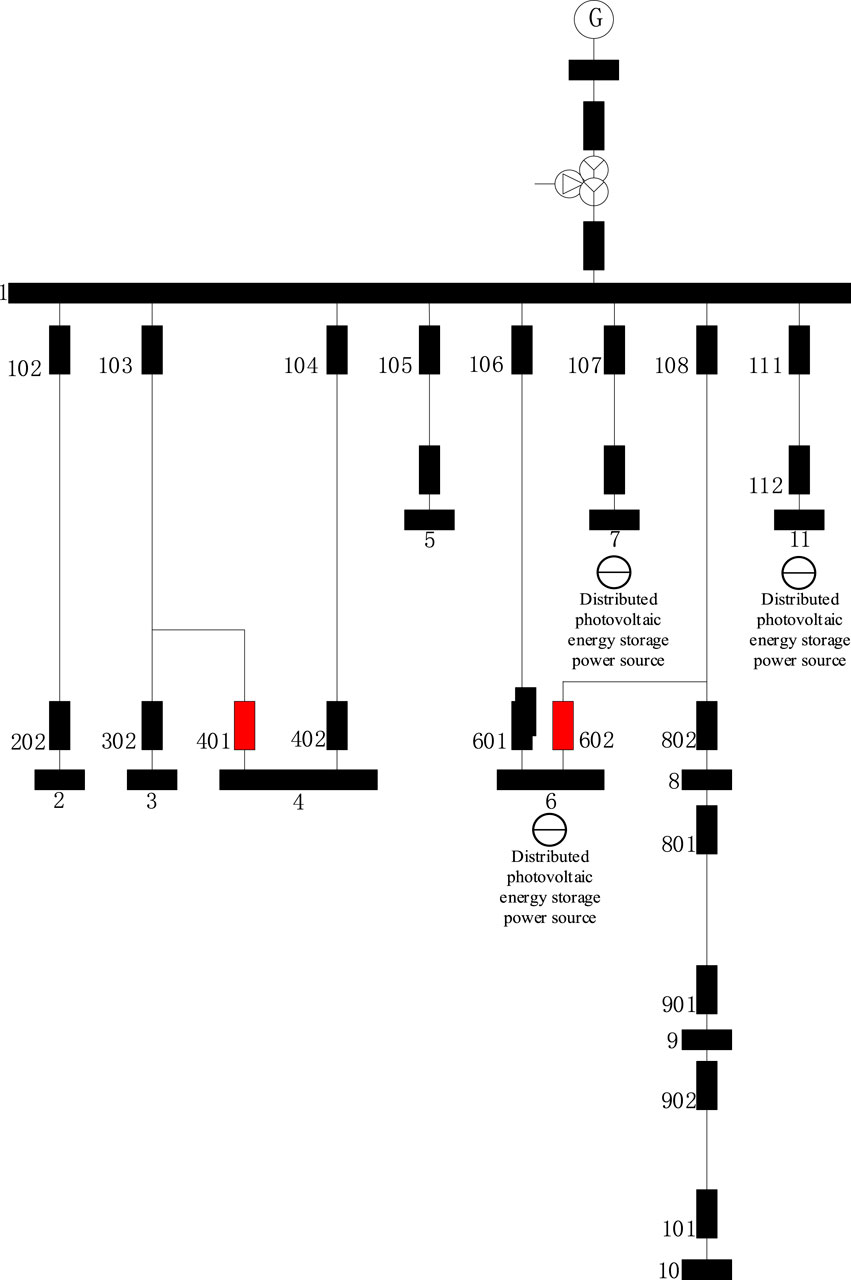
Figure 2. Power wiring of 10 kV with distributed photovoltaic storage power supply.
Among them, the core parameters of the 11-node distribution network are as follows: The system impedance of the 10 kV main busbar (node 1) is 0.012 + j0.035Ω (corresponding to a short-circuit capacity of 150MVA); The impedance of the photovoltaic storage access lines at nodes 6, 7, and 11 is uniformly set at 0.078 + j0.112Ω. The photovoltaic storage capacity parameters are shown in Table 1.
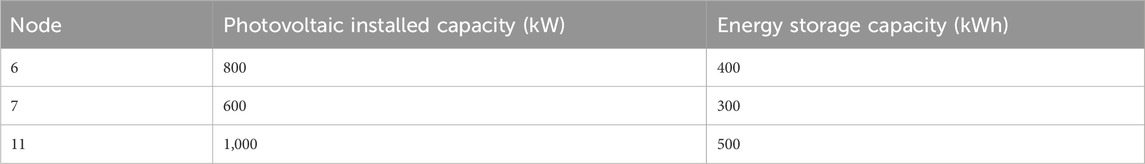
Table 1. Core capacity of optical storage system (Nodes 6, 7, 11).
Its distribution network consists of 11 nodes, among which node 1 is the main busbar. Node 6, Node 7 and Node 1-1 have distributed photovoltaic storage power sources. Node 2, Node 3, Node 4, Node 5, Node 8, Node 9 and Node 10 are ordinary nodes and do not have distributed photovoltaic storage power sources. Switch 401 and switch 602 are disconnected and in operation. This network has both ring and chain topological structures. Meanwhile, when new energy is connected to the grid, harmonics will be generated. Coupled with the interaction of various monitoring and transmission power electronic devices in the system and the traditional harmonic sources of the system, varying degrees of current waveform distortion will occur. Each node is affected by the harmonics generated by the harmonic sources on the associated nodes. As shown in Table 2. The point voltage distortion situation when the filter is not installed is shown in Table 3.
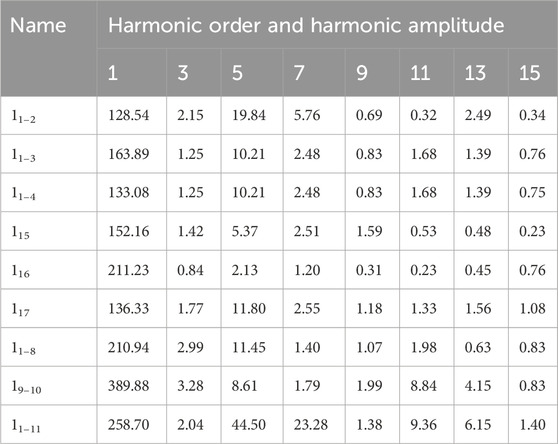
Table 2. Effective values of harmonic current without filter installation (A).

Table 3. Point voltage distortion without filter installation (%).
As can be seen from the above table, the harmonic voltage distortion at nodes 1, 2, 5, 9 and 10 is severe and does not meet the requirements of the national power quality standards. The main harmonic sources are the distributed photovoltaic storage power sources and load applications at nodes 6, 7 and 11. On the one hand, based on the dynamic real-time detection effect of the active power filter and the characteristics of the harmonic source, the active power filter is selected. On the other hand, considering the economic issue of active filters, a combined form of passive and active filters is chosen, as shown in Equations 15, 16.
Meanwhile, for a better comprehensive effect, the power quality at nodes 1, 2, 5, 9, and 10 is constrained by the harmonic current and harmonic voltage distortion limits of the system, as shown in Equation 17.
The installation position and capacity selection of the filter device are determined by improving the PSO, as shown in Equations 18, 19.
Result analysis
Based on the Settings in the previous text, three schemes have been formulated for the installation position and type of the filter, as shown in Tables 4–6 respectively. At the same time, the number of filter configurations, capacity and cost of the three schemes were compared, as shown in Table 7.
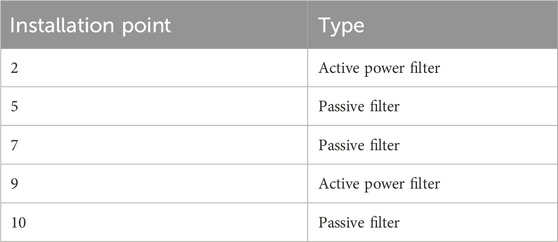
Table 4. Scheme 1.
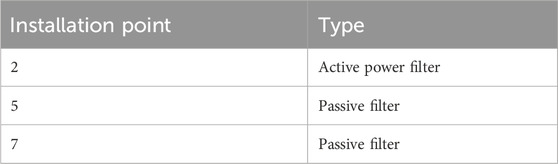
Table 5. Scheme 2.
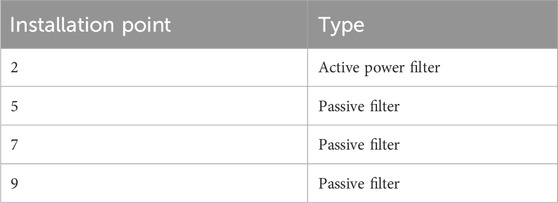
Table 6. Scheme 3.

Table 7. Comparison of the number, capacity and cost of filter configurations among the three schemes.
Key parameters of the filters in each scheme: 1. The APF uniformly adopts a three-phase parallel type with a response time of ≤5 ms and a DC side voltage of 750 V. For example, the single-unit capacity of the 2/9 APF at node 1 in Scheme 1 is 0.85MVA, and the capacity of the 2 APF at node 3 in scheme 3 is 1.0MVA. 2. In the PPF, the single-tuned filter targets the 5th and 7th harmonics (5th: C = 28.5μF, L = 36.8mH; 7th: C = 18.2μF, L = 38.6 mH). The cut-off frequency of the high-pass PPF at node 9 of Scheme 3 is 550 Hz (C = 12.5μF, L = 15.8 mH).
From the specific situations of the three filter installation schemes, each scheme presents different characteristics in dealing with harmonic problems. Plan 1 is more comprehensive in the selection of installation points, covering nodes 2, 5, 7, 9 and 10. Among them, considering the intermittent and random characteristics of the harmonics at nodes 2 and 9, an active power filter device was chosen for installation. This selection fully takes into account the excellent suppression capability of the active power filter for dynamic and random harmonics. Nodes 5 and 7 are respectively equipped with corresponding single-tuned filter devices, and node 10 is installed with multiple sets of single-tuned passive filter devices. The selection of passive filters can effectively deal with harmonics of fixed frequencies. This plan installs a total of 3 PPF and 2 APF, with capacities reaching 2.4MVA and 1.8MVA respectively, and the total cost is 5.411 million yuan. Thanks to comprehensive installation coverage and scientific filter type matching, the overall filtering effect of Scheme 1 is quite outstanding, with the core power quality indicators showing an average THDU of 1.82%, a 5th harmonic suppression rate of 95.3%, and a power factor of 0.97, capable of effectively addressing harmonic issues at each node.
The installation points of Plan 2 are relatively few, involving only nodes 2, 5 and 7. One APF and two PPF are installed, with capacities of 0.9MVA and 1.5MVA respectively. The total cost is relatively low, amounting to 2.895 million yuan. Its core power quality indicators are an average THDU of 3.05%, a 5th harmonic suppression rate of 88.7%, and a power factor of 0.93. Although this solution has obvious cost advantages, due to the lack of filtering processing on nodes 9 and 10, the harmonic problems of these two nodes may not be effectively solved, and there are certain limitations in the overall filtering effect, making it difficult to comprehensively guarantee the harmonic control effect of the system.
Scheme 3 adds the processing of node 9 on the basis of Scheme 2. A high-pass passive filter is installed at this node, with a total of 1 APF and 3 PPF installed, with capacities of 1.0MVA and 2.6MVA respectively. The total cost is 3.804 million yuan. Its core power quality indicators are an average THDU of 2.15%, a 5th harmonic suppression rate of 96.8%, and a power factor of 0.98. However, the harmonics at node 9 are intermittent and random. The high-pass passive filter is not as effective as the active filter in dealing with such harmonics. Therefore, although the filtering effect of Scheme 3 is better than that of Scheme 2, it is still not as good as that of Scheme 1.
Overall, although Option 1 is relatively expensive, it can comprehensively and effectively address the harmonic issues at each node through a reasonable selection of installation points and a combination of filter types. Its filtering effect is more ideal, making it the better choice among the three options. In order to further compare the robustness of these several schemes, simulation experiments were conducted on their harmonic distortion conditions. The results (shown in Figure 3) intuitively reflect the THDU variation of each node under the three schemes: the THDU of nodes 1, 2, 9 and 10 in Scheme 1 is the lowest, while Scheme 2 has obvious over-standard THDU at nodes 9 and 10, and Scheme 3 has a moderate improvement compared with Scheme 2.

Figure 3. The harmonic distortion results of each scheme node after configuring the filter.
In addition, to verify the superiority of the improved PSO (IPSO) algorithm proposed in this paper, a comparative experiment was carried out with traditional PSO and genetic algorithm (GA) under the same objective function and constraint conditions. The core optimization effects are shown in Table 8:
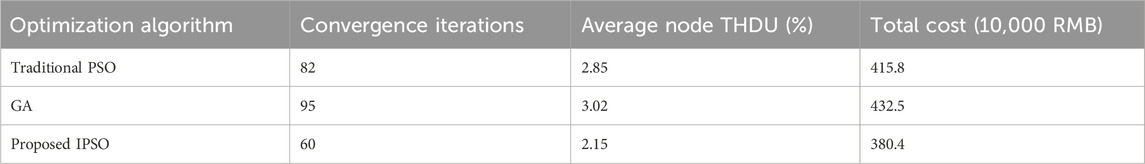
Table 8. Comparison of core algorithms.
It can be seen from Table 8 that compared with traditional PSO and GA, the proposed IPSO algorithm has fewer convergence iterations (60 times, 26.8% less than traditional PSO and 36.8% less than GA), lower average node THDU (2.15%, 24.6% lower than traditional PSO and 28.8% lower than GA), and lower total cost (380.4 ten thousand yuan, 8.5% lower than traditional PSO and 12.1% lower than GA), which fully reflects the advantages of IPSO in optimization efficiency, filtering effect and economy.
From the perspective of the harmonic distortion rates of the busbars in these three schemes, Scheme 1 and Scheme 2 have different focuses in terms of filtering effect and economy. Scheme 1 has a better filtering effect but poor economy. Scheme 2 has a poor filtering effect but good economy. The voltage distortion rate of each node in Scheme 3 is relatively low. While ensuring economy, it has a good filtering effect. Based on Scheme 3, on the one hand, resonance verification is carried out between Scheme 3 and the system after configuring the filter; On the other hand, Matlab/Simulink simulation was applied to verify the feasibility and superiority of the algorithm, and the current waveforms and spectra before and after the filter configuration were compared and analyzed. Its impedance spectrum is shown in Figure 4.
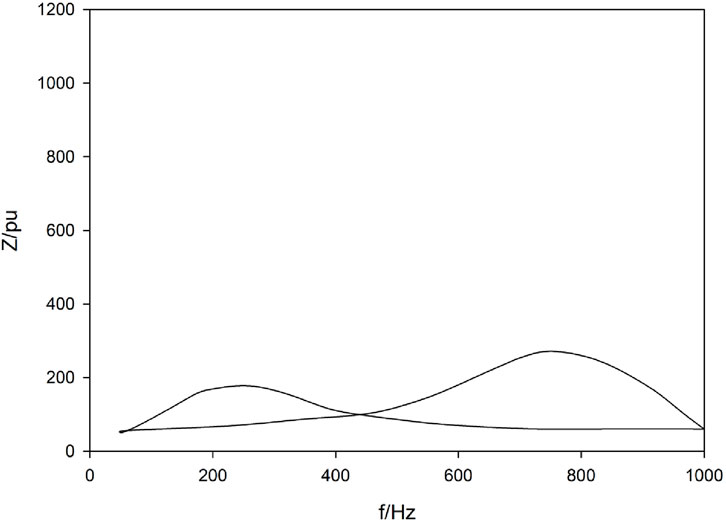
Figure 4. System impedance spectrum of Scheme 3.
It is known from the impedance spectrum curve of the system resonance verification after configuring the filter that optimizing the configuration of the filter by using the resonance detection method in the distribution network can effectively avoid the occurrence of resonance. The current waveforms before and after the filter configuration are shown in Figures 5,6, .
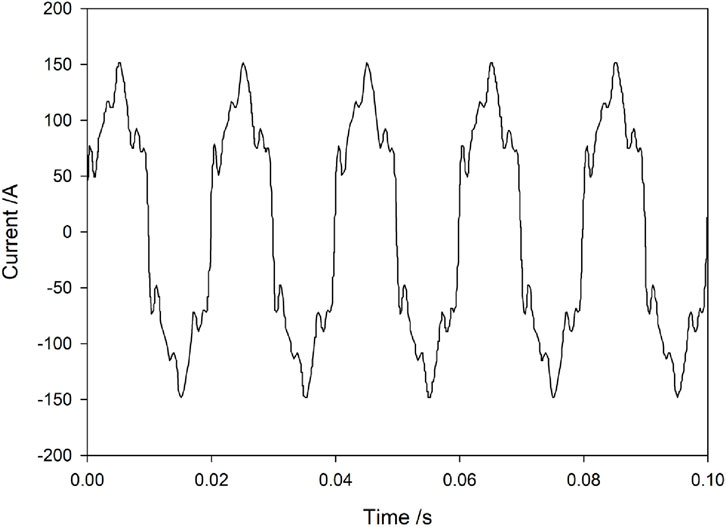
Figure 5. Current waveform before filter configuration.
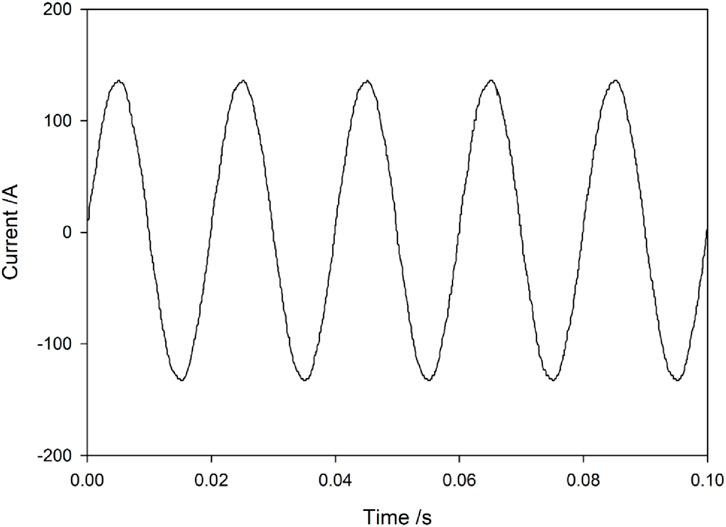
Figure 6. Current waveform after filter configuration.
By observing the impedance spectrum curve of the system resonance check after configuring the filter in Figure 3, it can be seen that the curve presents the impedance variation law in a specific frequency range. In the operation scenario of distribution networks, harmonic sources can trigger the risk of system resonance. However, after optimizing the configuration of filters using resonance detection methods, from the analysis of impedance spectral characteristics: when the frequency changes, the impedance curve does not show abnormal peaks caused by resonance (i.e., the sudden change point of extremely high impedance values). This means that a rationally configured filter alters the impedance frequency characteristics of the system. For frequency points that may cause resonance, through the tuning effect of the filter, the impedance of the system at these frequencies is kept within a stable and reasonable range, effectively disrupting the impedance matching conditions for resonance occurrence. Specifically, the impedance compensation and frequency response characteristics of the filter interact with the original impedance characteristics of the system. In the harmonic frequency range, the filter presents a low-impedance path for specific frequency harmonics, guiding the harmonic current to flow through the filter branch and avoiding resonant amplification effects in other circuits of the system due to poor matching of high and low impedance. From the overall trend of the spectral curve, it can be seen that the impedance transitions smoothly at different frequencies without the abrupt changes of resonant characteristics. This fully demonstrates that this filter configuration scheme, with the optimization of the resonant detection algorithm, can precisely adjust the system impedance frequency distribution, effectively achieving the goal of avoiding resonance, and providing effective technical support for the harmonic control and safe and stable operation of the distribution network.
Meanwhile, by comparing the current waveforms before and after the filter configuration (Figure 5 shows before configuration and Figure 6 shows after configuration), the current waveform before configuration (Figure 5) shows obvious distortion, with irregular peaks and troughs and burrs, indicating severe harmonic interference. This is because the harmonic sources in the distribution network make the current rich in various frequency harmonic components. After configuration (Figure 6), the current waveform approaches a standard sine wave, with a smooth waveform and periodic stability. The distortion rate of the grid-connected current drops from 19.99% to 2.54%, indicating that the filter is functioning effectively, compensating and filtering out specific frequency harmonics, significantly reducing harmonic content and improving the quality of the current waveform. In conclusion, the resonance detection method optimizes the configuration of filters, which not only avoids resonance through impedance spectrum regulation but also suppresses harmonics by optimizing current waveforms. From the perspectives of system resonance risk and power quality, it verifies the feasibility and superiority of the scheme in the harmonic control of distribution networks, providing technical support for the safe and efficient operation of distribution networks.
Conclusion
This chapter first points out that in practical work, the power quality of the distribution network can be optimized by rationally configuring the position and capacity of the filter. Aiming at the problem of how to find the optimal configuration position and capacity of the filter, an improved PSO is studied. By correcting the adaptive inertia coefficient of the PSO and introducing weighted average and fuzzy control, the poor search accuracy and local optimum of the traditional algorithm can be solved question. Based on the harmonic distortion rate of the filtering device and the economic objective function, the optimal configuration of the capacity and position of the filtering device is achieved by improving the algorithm, effectively suppressing the harmonics of the distribution network and improving the power quality of the distribution network. The effectiveness of the proposed strategy in reducing current harmonic distortion and improving the quality of current waveforms was verified through simulation results. However, no on-site application has been carried out. In the future, we will deeply integrate the actual situation on site, conduct in-depth research and thorough experimental verification on the voltage distribution and harmonic mechanism principles. At the same time, the focus will also be on studying the optimization control strategies of the system when multiple new energy sources such as distributed photovoltaic and wind power, as well as energy storage, coexist and are combined with traditional energy sources such as hydropower and thermal power, to enhance the energy consumption capacity of the distribution network and achieve economic operation of the power grid.
Discussion
This paper proposes an improved harmonic optimization suppression method based on PSO (IPSO) from three core dimensions: filtering accuracy, algorithm complexity and cost, and makes a quantitative comparison with existing related research to clarify its academic innovation and engineering application value. For filtering accuracy, the main evaluation indicators include the average total harmonic distortion rate (THDU) of nodes and the true rate of grid-connected current loss. Shu et al. (2025) proposed a energy storage configuration method for high photovoltaic penetration distribution networks based on discrete pso. Experimental results show that the average THDU of nodes after harmonic control is 3.02%. Li et al. (2025) applied the active power filter (APF) alone in engineering for harmonic control, and the distortion rate of grid-connected current was reduced to 3.8%. In contrast, the IPSO-optimized scheme 3 in this study achieved an average THDU of 2.15% for nodes and a grid-connected current distortion rate of 2.54%. Compared with Shu et al. (2025), the average THDU was reduced by 28.8%, and compared with Li et al. (2025), the current distortion rate was optimized by 33.2%. This advantage is attributed to the introduction of weighted average and fuzzy control in IPSO. Weighted average avoids the deviation of the global optimal solution caused by the extreme harmonic data of a single node, while fuzzy control dynamically adjusts the particle iteration step size, ensuring both the coverage of key harmonic nodes (such as nodes 2 and 9) and the accuracy of filter parameter configuration. For algorithm complexity, the main quantitative indicators are the number of convergence iterations and the time for a single optimization. Xu et al. (2017) adopted the GA-BP neural network for fault evaluation of battery energy storage systems, and the algorithm requires 95 iterations of convergence. The discrete PSO algorithm of Shu et al. (2025) requires 82 iterations for harmonic correlation optimization. The IPSO in this study only requires 60 iterations to reach the optimal solution, which is 26.8% less than that of the discrete PSO and 36.8% less than that of the GA-BP algorithm. In terms of the single optimization time, under the same Matlab/Simulink simulation environment, the IPSO algorithm takes approximately 120 s, while the traditional PSO algorithm and GA-BP algorithm take 180 s and 210 s respectively. This efficiency improvement is mainly attributed to the adaptive inertia weight of IPSO, which reduces redundant searches in the early stage of iteration. The local optimum trap in the later stage was avoided. In terms of cost, the key point of comparison is the total equipment investment of the harmonic suppression scheme. Yao et al. (2024) found that the total cost of the APF solution with a capacity of only 1.2MVA exceeded 500 gigabits. The total cost of the 1 APF +2 PPF hybrid configuration scheme proposed by Li et al. (2025) is 432.5 gigabits. In this study, Scheme 3 not only achieved better filtering accuracy than the aforementioned schemes, but also controlled the total cost at 380.4 gigahertz, which was 12.1% lower than the scheme proposed by Li et al. (2025) and approximately 24% lower than the full APF scheme proposed by Yao et al. (2024). This cost advantage stems from IPSO’s precise optimization of filter types and capacities: for nodes with fixed-frequency harmonics (such as nodes 5 and 7), low-cost passive filters (PPF) are used, while active filters (APF) are only deployed at nodes with intermittent and random harmonics (Node 2), avoiding the waste of high-cost APF resources. It should be noted that this study also has limitations: the comparison samples are limited to 10 kV distributed photovoltaic energy storage distribution networks, and no comparative analysis has been conducted on microgrid systems or distribution networks with a high penetration rate of wind power. In addition, the cost calculation only includes the initial equipment investment and does not cover long-term operation and maintenance costs such as filter replacement and parameter adjustment. Future research can refer to the economic analysis framework of distributed photovoltaic energy storage by Zhou et al. (2025), further expand the comparison scope, incorporate operation and maintenance costs into the optimization objective function, and improve the long-term applicability of the scheme. Overall, compared with existing research, the harmonic optimization suppression method based on ipso proposed in this paper shows better coordination in the three aspects of “filtering accuracy - algorithm complexity - cost”, and is particularly suitable for harmonic control in 10 kV distribution networks with high proportion of photovoltaic energy storage access, providing a more practical technical option for engineering applications.
Data availability statement
The original contributions presented in the study are included in the article/supplementary material, further inquiries can be directed to the corresponding author.
Author contributions
HP: Conceptualization, Data curation, Formal Analysis, Funding acquisition, Investigation, Methodology, Project administration, Resources, Software, Supervision, Validation, Visualization, Writing – original draft, Writing – review and editing. GY: Conceptualization, Data curation, Formal Analysis, Funding acquisition, Investigation, Methodology, Project administration, Resources, Software, Supervision, Validation, Visualization, Writing – original draft, Writing – review and editing. YZ: Conceptualization, Data curation, Formal Analysis, Funding acquisition, Investigation, Methodology, Project administration, Resources, Software, Supervision, Validation, Visualization, Writing – original draft, Writing – review and editing. WZ: Conceptualization, Data curation, Formal Analysis, Funding acquisition, Investigation, Methodology, Project administration, Resources, Software, Supervision, Validation, Visualization, Writing – original draft, Writing – review and editing. CX: Conceptualization, Data curation, Formal Analysis, Funding acquisition, Investigation, Methodology, Project administration, Resources, Software, Supervision, Validation, Visualization, Writing – original draft, Writing – review and editing.
Funding
The authors declare that financial support was received for the research and/or publication of this article. This work was supported by Science and technology project of State Grid Shanxi Electric Power Company “Research on Collaborative Optimization Technology for Flexible Loads Participation in Distribution Network Voltage Regulation and Harmonic Suppression” (5205M0250005).
Conflict of interest
Authors HP, GY, and YZ were employed by State Grid Yuncheng Electric Power Supply Company. Author WZ was employed by State Grid Taiyuan Electric Power Supply Company.
The remaining authors declare that the research was conducted in the absence of any commercial or financial relationships that could be construed as a potential conflict of interest.
Generative AI statement
The authors declare that no Generative AI was used in the creation of this manuscript.
Any alternative text (alt text) provided alongside figures in this article has been generated by Frontiers with the support of artificial intelligence and reasonable efforts have been made to ensure accuracy, including review by the authors wherever possible. If you identify any issues, please contact us.
Publisher’s note
All claims expressed in this article are solely those of the authors and do not necessarily represent those of their affiliated organizations, or those of the publisher, the editors and the reviewers. Any product that may be evaluated in this article, or claim that may be made by its manufacturer, is not guaranteed or endorsed by the publisher.
References
Chen, H. (2024). Monitoring and improvement strategies for power quality in distributed photovoltaic grid connection. Light Source Illumin, 120–122.
Jiang, H., Wang, W., and Ma, F. (2025). Development situation and main challenges and coping strategies China pv analysis. Sci. Technol. Innov, 192–195.
Li, Z., and Gao, P. (2024). Adaptive particle swarm optimization algorithm for optimizing the active disturbance rejection control parameters of APF DC side voltage. Autom. Instrum. 39, 12–17. doi:10.19557/j.cnki.1001-9944.2024.12.003
Li, M., Sun, J., Cui, J., Du, S., and Wang, Z. (2025). The application of APF in the engineering design of harmonic control. Sci. Technol. Innov, 221–224.
Liu, X., and Wang, T. (2023). Design of passive filter for harmonic suppression in electrified railways. Mach. Des. Manuf. 219-222, 3. doi:10.19356/j.cnki.1001-3997.20230302.003
Mokheseng, M. B. (2010). Solar roof tiles: towards a macro - economic model. Stellenbosch, South Africa: University of Stellenbosch.
Morishita, H., Agawa, T., Morishige, T., Miyazato, M., Hashimoto, E., Takigawa, K., et al. (1991). The development of photovoltaic power generation system under the sunshine project of Japan. Tenth E.C. Photovolt. Sol. Energy Conf., 1326–1329. doi:10.1007/978-94-011-3622-8_330
Ning, S., Zhang, J., and Zhou, S. (2021). Multi-objective optimization model of passive filter for harmonic control. Sichuan Electr. Power Technol. 44, 29–34. doi:10.16527/j.issn.1003-6954.20210306
Noguchi, T. (1985). Overview on thermal application of solar energy in Japan. Sol. Wind Technol. 2, 155–171. doi:10.1016/0741-983x(85)90011-6
Palladino, D., and Calabrese, N. (2023). Energy planning of renewable energy sources in an italian context: energy forecasting analysis of photovoltaic systems in the residential sector [J]. Energies, 16, (7). doi:10.3390/EN16073042
Shu, X., Xiao, M., Wu, Y., Sun, B., and Wang, H. (2025). Energy storage configuration of high photovoltaic permeability distribution network based on discrete PSO. Electron. Des. Engineering 33, 141–144+149. doi:10.14022/j.issn1674-6236.2025.11.031
The National Energy Administration released the 2023 National Power Industry Statistics (2024). The national energy administration released the 2023 national power industry statistics. Electr. Power Technol. Environ. Protect. 40, 95.
Xu, S., Wang, C., Zhao, Z., and Han, X. J. (2017). Fuzzy comprehensive evaluation of soft faults in battery energy storage systems based on GA-BP neural network. Electr. Appl. Energy Effic. Manag. Technol, 74–81. doi:10.16628/j.cnki.2095-8188.2017.13.012
Yao, Y., Liu, B., and Hu, Z. (2024). Research on the resonant characteristics of APF based on EigenValue perturbation of admittance matrix. Power Electr. Technol. 58, 23–27.
Yuan, Y., Lu, F., and Liu, J. (2025). The mechanism and practical path of new quality productivity empowering the high-quality development of the new energy industry. J. Chang. Univ. Sci. Technol. 40, 35–45. doi:10.16573/j.cnki.1672-934x.2025.03.006
Keywords: improve PSO distributed, photovoltaic storage and distribution network, harmonic optimization inhibition, power system operation and control, power marketing technology
Citation: Pei H, Yan G, Zhao Y, Zhang W and Xiao C (2025) Research on harmonic optimization and suppression of distributed photovoltaic storage and distribution networks by improving PSO. Front. Mech. Eng. 11:1667908. doi: 10.3389/fmech.2025.1667908
Received: 17 July 2025; Accepted: 26 November 2025;
Published: 16 December 2025.
Edited by:
Mohamed Arezki Mellal, University of Boumerdés, AlgeriaReviewed by:
Minh Quan Duong, The University of Danang, VietnamKyaw Myo Lin, Pyay Technological University, Myanmar
Zhenjun Zhang, Anyang Institute of Technology, China
Copyright © 2025 Pei, Yan, Zhao, Zhang and Xiao. This is an open-access article distributed under the terms of the Creative Commons Attribution License (CC BY). The use, distribution or reproduction in other forums is permitted, provided the original author(s) and the copyright owner(s) are credited and that the original publication in this journal is cited, in accordance with accepted academic practice. No use, distribution or reproduction is permitted which does not comply with these terms.
*Correspondence: Chun Xiao, eGNfeGlhb2NodW5AaG90bWFpbC5jb20=