 Dandan Yu1†
 Yan Tong2†
 Xinnian Guo1
 Lingfang Feng1Zhaoqiang Jiang1
 Shibo Ying1Junlin Jia1Yuan Fang1Min Yu1Hailing Xia1Li Shi1
 Jianlin Lou1*
- 1Institute of Occupational Diseases, Zhejiang Academy of Medical Sciences (ZJAMS), Hangzhou, China
- 2Department of Outpatient Office, Affiliated Hangzhou First People's Hospiital, Zhejiang University School of Medicine, Hangzhou, China
The diagnostic value of the concentration of circulating cell-free DNA (cfDNA) for breast cancer has generated inconsistent results. The aim of this study was to evaluate the first diagnostic value of the concentration of cfDNA for breast cancer by meta-analysis. Studies were retrieved by searching PubMed, Cochrane Library, and Web of Science before June 2018. Sensitivity, specificity, diagnostic odds ratio (DOR), the summary receiver operating characteristic (SROC) curve, and the area under curve (AUC) were used to summarize overall diagnostic performance. The random-effects model was used to calculate the pooled statistics. Subgroup analysis and meta-regression analysis were carried out to detect the source of heterogeneity. A total of 13 studies were identified with 1,087 breast cancer patients and 720 healthy controls. Overall, the pooled sensitivity and specificity of concentration of cfDNA for breast cancer were 87% (95% CI, 73–94%) and 87% (95% CI, 79–93%), respectively. The pooled DOR was 32.93 (95% CI, 13.52–80.19) and the SROC curve revealed an AUC of 0.93 (95% CI, 0.91–0.95). Meta-regression analysis showed that no covariate had a significant correlation with relative DOR (RDOR). Publication bias was not detected in this meta-analysis. This meta-analysis indicates that the concentration of cfDNA has potential first diagnostic value for breast cancer and plasma may be a better source of cfDNA for detection of breast cancer.
Introduction
Breast cancer is one of the most common malignancies in women. According to an estimation from the WHO, more than 508,000 women worldwide died from breast cancer in 2011 (1). In China, breast cancer is the fourth most common cancer, with an estimated 150,000 cancer cases in 2012 (2). Early detection and diagnosis of breast cancer has been shown to reduce mortality (3). Currently, mammography is considered the gold standard in breast cancer early detection, which was also proven to be the only screening method to reduce mortality (4). However, mammography may fail to identify patients due to the overlapping dense fibroglandular tissue which reduce the visibility of tumor tissue or even entirely conceal the malignant lesions (5). It was reported that 15–30% of breast cancer was not detected while using full-field digital mammography (6). In addition, mammography may lead to over-diagnosis and radiation-induced disease. Therefore, in consideration of the limitation of mammography, it is necessary to develop a new non-invasive method to distinguish breast cancer patients from healthy individuals.
Cells can release DNA into the bloodstream, which is described as circulating cell-free DNA (cfDNA) (7). The cell-free DNA released from tumor cells, in particular, is called circulating tumor DNA (ctDNA) (7). Although cfDNA is also present in healthy individuals, it is significantly increased in cancer subjects (8). cfDNA is recognized as a novel biomarker in the diagnosis of cancer, such as gastric cancer (9), non-small lung cancer (10), and hepatocellular carcinoma (11). There are several detection strategies for breast cancer by cfDNA, such as the concentration of cfDNA, cfDNA integrity, microsatellite alteration, gene mutations, DNA methylation, and so on (12). The concentration of cfDNA is recognized as a quantitative way to detect cfDNA amounts and the initial detection strategy of breast cancer by cfDNA (12). So far, a number of studies have evaluated the diagnostic value of the concentration of cfDNA for breast cancer, but the results are inconsistent. For instance, Agostini et al. (13) reported a high sensitivity of 94.8% and a high specificity of 100%, while a study by Tang et al. (14) showed a low sensitivity of 65.0% and a low specificity of 70.0%. Hence, we conducted this meta-analysis to evaluate the first diagnostic value of the concentration of cfDNA for breast cancer.
Materials and Methods
Search Strategy
The following databases were searched to identify all potentially relevant studies published before June 2018: PubMed, Cochrane Library, and Web of Science. The retrieving query formulation used for the search were (“cell free DNA” OR “circulating DNA”OR “plasma DNA” OR “serum DNA”) AND (“breast cancer” OR “breast carcinoma” OR “breast tumor”). Article language was limited to English. All the reference lists of the identified articles and relevant reviews were also manually screened.
Inclusion and Exclusion Criteria
The inclusion criteria of eligible studies were as follows: (1) studies about the first diagnosis not the recurrent diagnosis of the concentration of cfDNA for breast cancer; (2) studies with sufficient data for describing or calculating the sensitivity and specificity values; and (3) studies that were case-control studies, prospective, and retrospective cohort studies. The exclusion criteria included: (1) studies that were reviews, case-only studies, conference letters, or editorials and (2) studies with duplicate data reported.
Data Extraction and Quality Assessment
Two reviewers (Dandan Yu and Yan Tong) screened titles, abstracts, and full texts independently according to the above criteria. The following data were extracted from enrolled studies in structured forms: first author's name, publication year, country, sample size, study type, source of cfDNA, time of sample collection, test method, reference gene, cut-off value, sensitivity, and specificity. Subsequently, two reviewers independently evaluated the quality of selected studies according to Quality Assessment of Diagnostic Accuracy Studies-2 (QUADAS-2) (15).
Statistical Analysis
The pooled statistics with 95% confidence intervals (95% CIs) of sensitivity, specificity, and diagnostic odds ratio (DOR) were calculated. The summary receiver operating characteristic (SROC) curve and the area under curve (AUC) were used to summarize overall diagnostic performance. Additionally, we used the χ2 test and inconsistency index (I2) to quantify the statistical heterogeneity between studies. A P < 0.1 by χ2 test and I2 statistic >50% indicated substantial heterogeneity (16). A fixed-effects model was used to calculate the pooled statistics if there was no statistical heterogeneity; otherwise, a random-effects model was conducted. Furthermore, subgroup analysis and meta-regression analysis were carried out to detect the source of heterogeneity. Publication bias was evaluated with Deeks' funnel plot asymmetry test (17). P < 0.05 indicated potential publication bias.
All statistical analysis was performed with STATA (version 14.0; Stata Corp, College Station, TX). A P < 0.05 was considered statistically significant, and all P-values were two-sided.
Results
Study Characteristics and Quality Assessment
The flowchart of literature search and selection were shown in Figure 1. A total of 1,025 records were initially identified by our search strategy. Ultimately, 13 studies (13, 14, 18–28) were eligible for this meta-analysis according to the inclusion criteria and the exclusion criteria. A total of 1,807 subjects including 1,087 breast cancer patients and 720 healthy controls were recruited for analysis. The sensitivity and specificity of cfDNA for breast cancer detection in selected studies ranged from 37.5 to 100% and from 57.1 to 100%, respectively. Characteristics of these studies are summarized in Table 1.
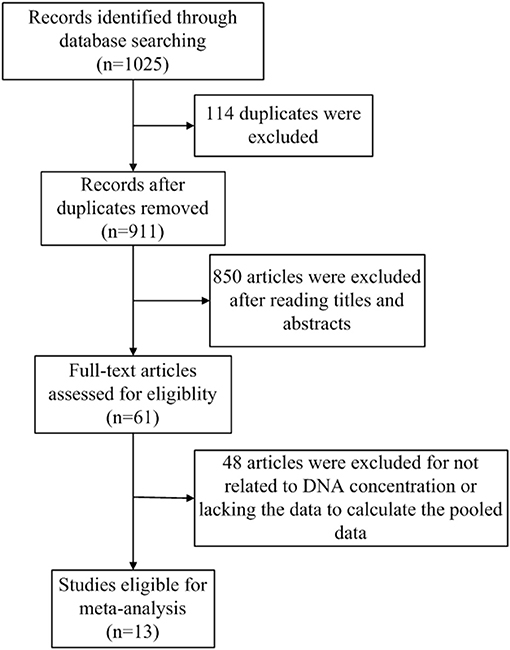
Figure 1. Flow diagram of the study selection process.
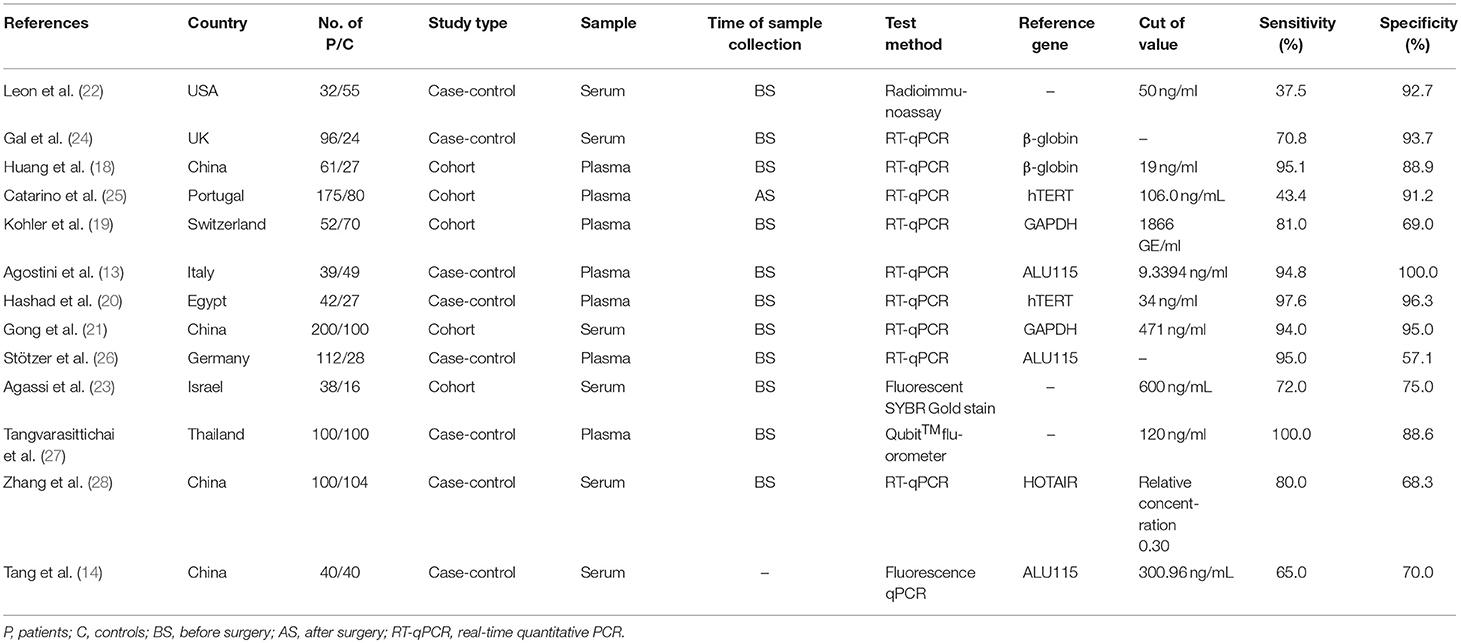
Table 1. Characteristics of studies included in this meta-analysis of concentration of circulating cell-free DNA in the diagnosis of breast cancer.
The quality of selected studies by QUADAS-2 is shown in Table 2. To some extent, most studies had a moderate-high quality, the overall quality of these included studies were generally robust.
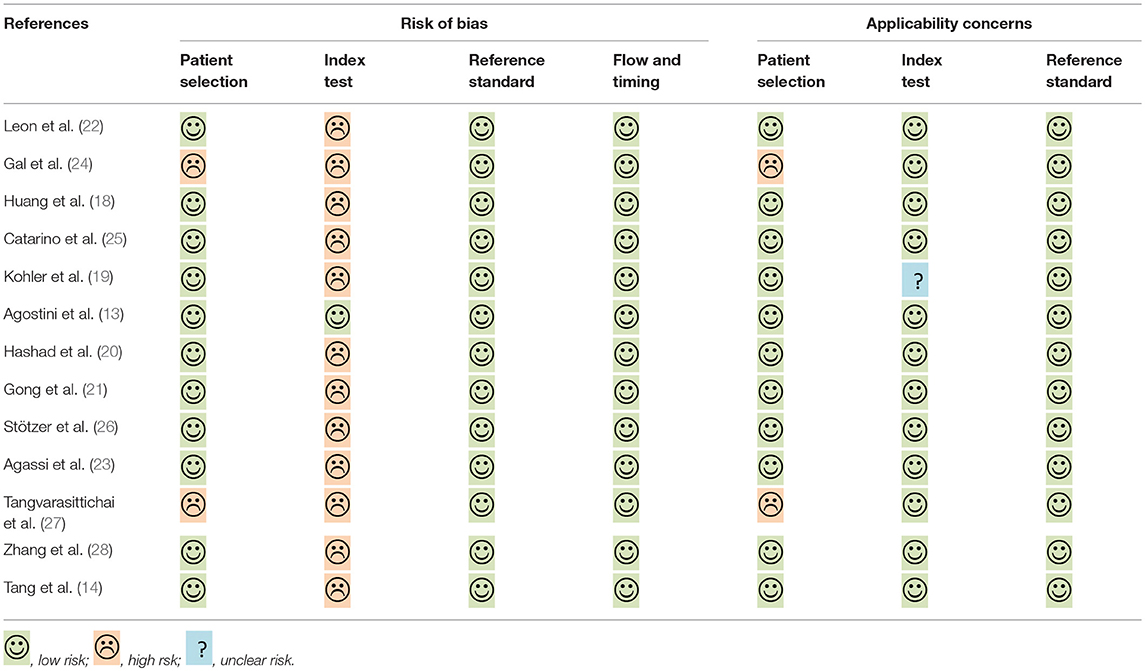
Table 2. Assessment of the methodological quality by QUADAS-2.
Diagnostic Value of Concentration of cfDNA for Breast Cancer
The pooled sensitivity and specificity of concentration of cfDNA for breast cancer were 87% (95% CI, 73–94%) and 87% (95% CI, 79–93%), respectively (Figure 2, Table 3). The pooled DOR was 32.93 (95% CI, 13.52–80.19) (Figure 3, Table 3). The SROC curve revealed an AUC of 0.93 (95% CI, 0.91–0.95) (Figure 4, Table 3).
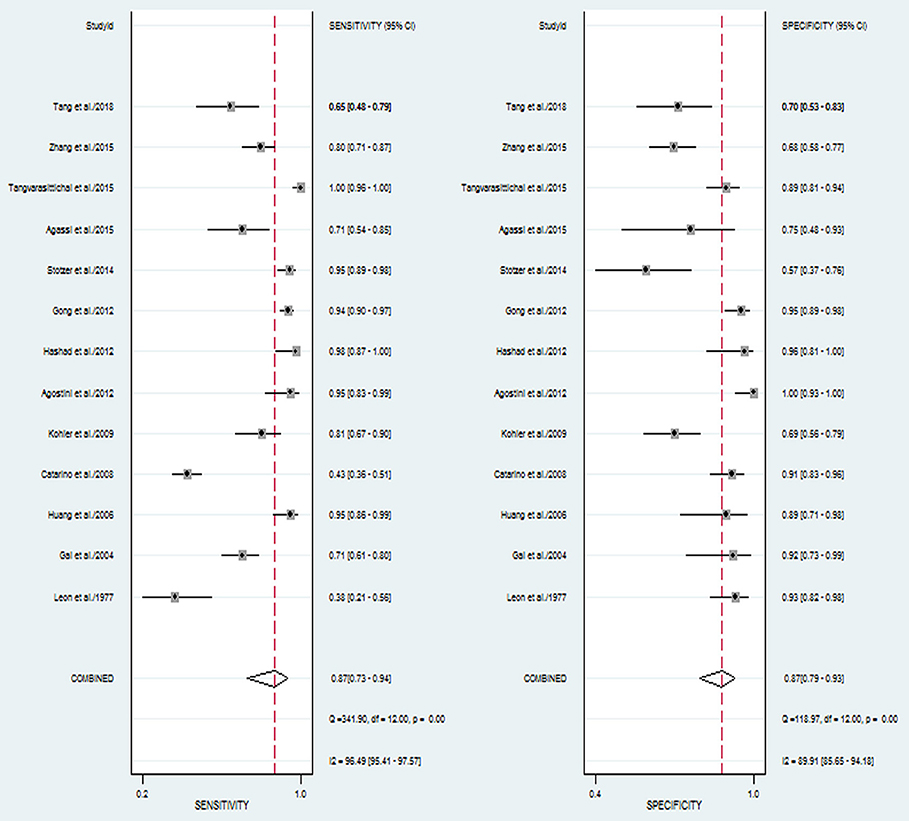
Figure 2. Forest plots of sensitivity and specificity for diagnostic value of concentration of circulating cell-free DNA for breast cancer.
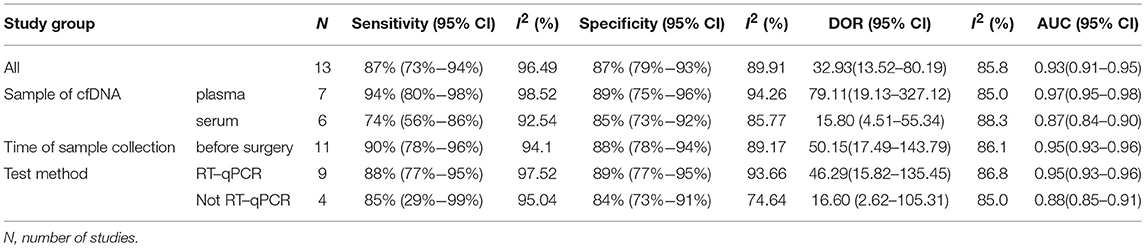
Table 3. Summary of main results of diagnostic value of concentration of cfDNA for breast cancer.
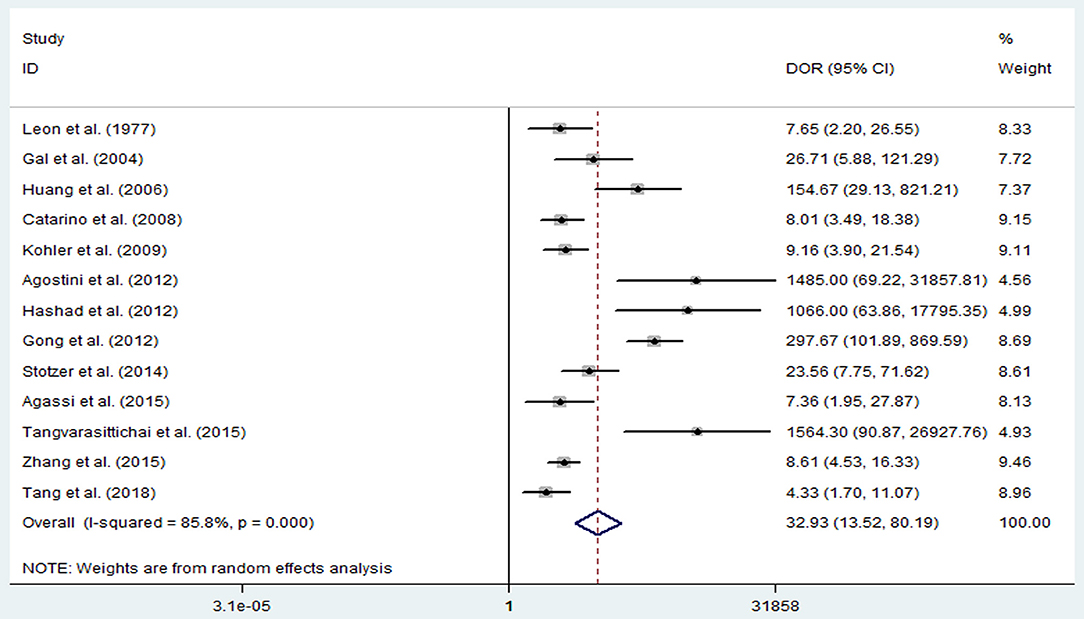
Figure 3. Diagnostic odds ratio of sensitivity and specificity for diagnostic value of concentration of circulating cell-free DNA for breast cancer.
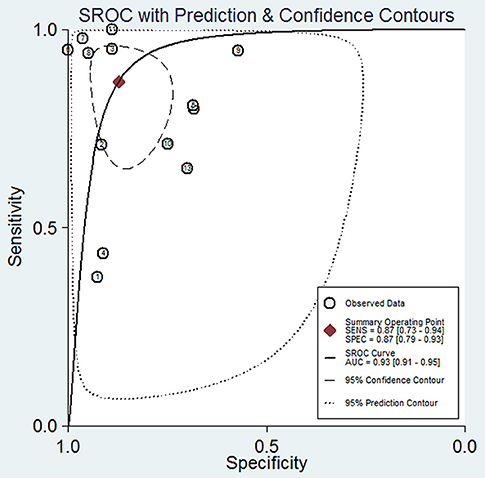
Figure 4. Summary receiver operating characteristic of sensitivity and specificity for diagnostic value of concentration of circulating cell-free DNA for breast cancer.
Sample of cfDNA, the time of sample collection, and test method were taken into consideration for subgroup analysis. With consideration of the sample of cfDNA, studies with cfDNA isolated from plasma revealed that the pooled sensitivity and specificity were 94% (95% CI, 80–98%) and 89% (95% CI, 75–96%), respectively (Table 3). The pooled DOR was 79.11 (95% CI, 19.13–327.12), and the SROC curve revealed an AUC of 0.97 (95%CI, 0.95–0.98) (Table 3). Studies with cfDNA isolated from serum revealed that the pooled sensitivity and specificity were 74% (95% CI, 56–86%) and 85% (95% CI, 73–92%), respectively (Table 3). The pooled DOR was 15.80 (95% CI, 4.51–55.34), and the SROC curve revealed an AUC of 0.87 (95%CI, 0.84–0.90) (Table 3).
With consideration of the time of sample collection, studies with samples collected before surgery revealed that the pooled sensitivity and specificity were 90% (95% CI, 78–96%) and 88% (95% CI, 78–94%), respectively (Table 3). The pooled DOR was 50.15 (95% CI, 17.49–143.79), and the SROC curve revealed an AUC of 0.95 (95% CI, 0.93–0.96) (Table 3).
With consideration of the test method, studies with the test method of real-time qPCR revealed that the pooled sensitivity and specificity were 88% (95% CI, 77–95%) and 89% (95% CI, 77–95%), respectively (Table 3). The pooled DOR was 46.29 (95% CI, 15.82–135.45), and the SROC curve revealed an AUC of 0.95 (95% CI, 0.93–0.96) (Table 3). Studies without the test method of real-time qPCR showed that the pooled sensitivity and specificity were 85% (95% CI, 29–99%) and 84% (95% CI, 73–91%), respectively (Table 3). The pooled DOR was 16.60 (95% CI, 2.62–105.31), and the SROC curve revealed an AUC of 0.88 (95% CI, 0.85–0.91) (Table 3).
Meta-Regression Analysis and Publication Bias
To reveal the sources of heterogeneity, we conducted a meta-regression analysis. Covariates including “publication year (recent 5 years),” “region (Asian),” “sample (plasma),” “time of sample collection (before surgery),” and “method (real-time quantitative PCR)” were assessed. We used these covariates to assess their effects on the RDOR. None of them showed any definite influence on heterogeneity and the details of the calculation were showed in Table 4. Deeks' funnel plot asymmetry test was used to assess publication bias. The P-value was 0.65, which showed there was no significant evidence of publication bias (Figure 5).
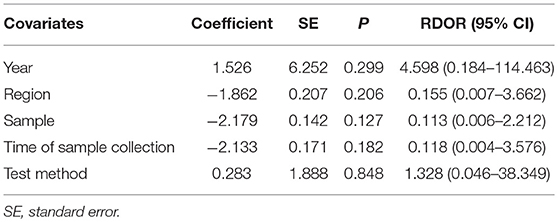
Table 4. Meta-regression of effects of study characteristics on diagnostic accuracy of concentration of cfDNA.
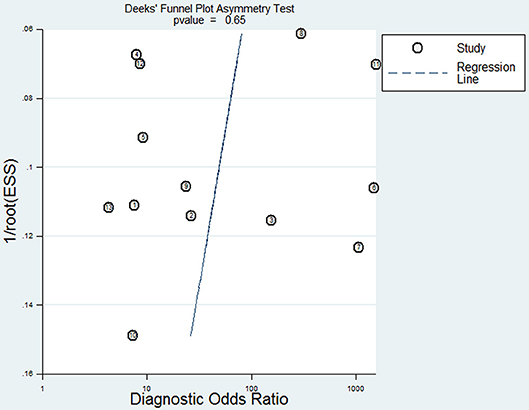
Figure 5. Deeks' funnel plot for the assessment of potential publication bias in this meta-analysis.
Discussion
As is known, mammography as a screening method for breast cancer has the limitation of having low sensitivity. Hence, the circulating biomarkers, which can be easily collected and measured, have attracted the attention of more researchers. A correlation between increased levels of cfDNA and cancer has been widely studied (29, 30). Nowadays, it has been widely accepted that a solid tumor will obviously increase cfDNA concentrations (31). It was also demonstrated that the circulating cfDNA concentrations of breast cancer patients were significantly higher than healthy controls (25).
During the past decades, biomarkers of breast cancer have been widely discovered, such as CEA, CA15-3, HER2, and so on. CEA, which exists in the breast ductal secretions, showed a lower sensitivity of 58%, a lower AUC of 0.8750, and a lower DOR of 7.70 for breast cancer diagnosis (32). One study combined four biomarkers, including M-CSF, MMP-9, TIMP-1, and CA 15-3, drew a lower sensitivity, specificity, and AUC for breast cancer. The sensitivity, specificity, and AUC were 84%, 83%, and 0.9125, respectively (33).
In this study, we found a high diagnostic value of concentration of cfDNA, of which the sensitivity and specificity reached 87 and 87%, respectively. Additionally, AUC is considered as an indicator of good diagnostic performance when the value is >0.90 (34). Therefore, the value of 0.93 in our study indicated that concentration of cfDNA had a good diagnostic accuracy for breast cancer. According to the above results, we can see that compared with other biomarkers of breast cancer, whether they are novel or classical, cfDNA may have better performance on detection of breast cancer.
We also conducted subgroup analyses. The results showed there were no obvious differences among the subgroup analyses for the sensitivity, specificity, and AUC. But the DORs varied from 15.80 to 79.11. When we only incorporated the studies using plasma samples, the highest sensitivity, specificity, and AUC of cfDNA on breast cancer detection were obtained, and they were also higher than pooled sensitivity, specificity, and AUC, respectively. These results indicated that plasma may be a better source for cfDNA in detection of breast cancer.
The original studies included in our analysis showed obvious differences in sensitivity and specificity. It is widely accepted that malignancy will increase the bloodstream concentration of cfDNA. However, in some abnormal condition, such as inflammation (35), arthritis (36), trauma (37), and even after exhaustive exercise (38), the concentration of cfDNA increases too. It reminds us that benign breast lesions and other illness should be firstly excluded when we use cfDNA to detect breast cancer. Also, the diagnostic efficiency of cfDNA on breast cancer detection can be much improved in combination with other known biomarkers (CA15-3, CEA, HER2, and so on) for breast cancer.
This study also contains several limitations. Firstly, as only 13 studies were included in this meta-analysis, compounded by the small number of included studies, it may be insufficient to yield a robust result. Secondly, heterogeneity existed between the selected studies, although it was impossible to determine all sources of heterogeneity. We did not include some covariates due to the unavailable data. These probable covariates included tumor stage, metastasis condition, tumor size, the risk of breast cancer, and so on. Thirdly, subgroup analyses on several covariates were unable to perform due to the various data, such as reference gene and cut-off value. Moreover, language bias might exist due to the references being restricted to English. Even so, to our knowledge, this study is the first to systematically evaluate the diagnostic value of the concentration of cfDNA in breast cancer in the whole population and various subgroups.
This meta-analysis suggests that the concentration of cfDNA has potential first diagnostic value for breast cancer due to the high sensitivity, specificity and AUC, and it may be a potential screening tool for breast cancer. In particular, plasma may be a better source of cfDNA in detection of breast cancer. Further large-scaled, well-designed studies are required to confirm our findings, and to provide a basis for future clinical practice. Moreover, the first diagnostic value of concentration of cfDNA for breast cancer could be validated by clinical trials.
Data Availability
All datasets generated for this study are included in the manuscript.
Author Contributions
DY and YT made substantial contributions to conception and design, acquisition of data, analysis of data, and drafting the manuscript. XG was involved in design and drafting the manuscript. LF, ZJ, and SY were involved in drafting the manuscript and statistical analysis. JJ and YF provided support in statistical analysis. MY and HX were involved in data interpretation. LS participated in the preparation of the manuscript and provided general support. JL designed, coordinated, and supervised the study and he was involved in data analysis and interpretation and drafted the manuscript. All authors read and approved the final manuscript.
Funding
This work was supported by grants from the Zhejiang Committee of Science and Technology (2014C03030), Zhejiang Provincial Program for the Cultivation of High-Level Innovative Health Talents (2014).
Conflict of Interest Statement
The authors declare that the research was conducted in the absence of any commercial or financial relationships that could be construed as a potential conflict of interest.
References
1. World Health Organization. Breast Cancer: Prevention and Control (2013). Available online at: http://www.who.int/cancer/detection/breastcancer/en/index1.html
2. China's Health and Family Planning Commission. China Health Statistical Yearbook (2012). Available online at: http://www.nhfpc.gov.cn/htmlfiles/zwgkzt/ptjnj/year2012/index2012.html
3. Bohm D, Keller K, Wehrwein N, Lebrecht A, Schmidt M, Kolbl H, et al. Serum proteome profiling of primary breast cancer indicates a specific biomarker profile. Oncol Rep. (2011) 26:1051–6. doi: 10.3892/or.2011.1420
4. Lacombe J, Mange A, Solassol J. Use of autoantibodies to detect the onset of breast cancer. J Immunol Res. (2014) 2014:574981. doi: 10.1155/2014/574981
5. Gilbert FJ, Tucker L, Young KC. Digital breast tomosynthesis (DBT): a review of the evidence for use as a screening tool. Clin Radiol. (2016) 71:141–50. doi: 10.1016/j.crad.2015.11.008
6. Duncan KA, Needham G, Gilbert FJ, Deans HE. Incident round cancers: what lessons can we learn? Clin Radiol. (1998) 53:29–32. doi: 10.1016/S0009-9260(98)80030-5
7. Volckmar AL, Sultmann H, Riediger A, Fioretos T, Schirmacher P, Endris V, et al. A field guide for cancer diagnostics using cell-free DNA: from principles to practice and clinical applications. Genes Chromosomes Cancer. (2018) 57:123–39. doi: 10.1002/gcc.22517
8. Mouliere F, El Messaoudi S, Pang D, Dritschilo A, Thierry AR. Multi-marker analysis of circulating cell-free DNA toward personalized medicine for colorectal cancer. Mol Oncol. (2014) 8:927–41. doi: 10.1016/j.molonc.2014.02.005
9. Gao Y, Zhang K, Xi H, Cai A, Wu X, Cui J, et al. Diagnostic and prognostic value of circulating tumor DNA in gastric cancer: a meta-analysis. Oncotarget. (2017) 8:6330–40. doi: 10.18632/oncotarget.14064
10. Jiang T, Zhai C, Su C, Ren S, Zhou C. The diagnostic value of circulating cell free DNA quantification in non-small cell lung cancer: a systematic review with meta-analysis. Lung Cancer. (2016) 100:63–70. doi: 10.1016/j.lungcan.2016.06.013
11. Liao W, Mao Y, Ge P, Yang H, Xu H, Lu X, et al. Value of quantitative and qualitative analyses of circulating cell-free DNA as diagnostic tools for hepatocellular carcinoma: a meta-analysis. Medicine. (2015) 94:e722. doi: 10.1097/MD.0000000000000722
12. Wang R, Li X, Zhang H, Wang K, He J. Cell-free circulating tumor DNA analysis for breast cancer and its clinical utilization as a biomarker. Oncotarget. (2017) 8:75742–55. doi: 10.18632/oncotarget.20608
13. Agostini M, Enzo MV, Bedin C, Belardinelli V, Goldin E, Del Bianco P, et al. Circulating cell-free DNA: a promising marker of regional lymphonode metastasis in breast cancer patients. Cancer Biomark. (2012) 11:89–98. doi: 10.3233/CBM-2012-0263
14. Tang Z, Li L, Shen L, Shen X, Ju S, Cong H. Diagnostic value of serum concentration and integrity of circulating cell-free DNA in breast cancer: a comparative study with CEA and CA15-3. Lab Med. (2018) 49:323–8. doi: 10.1093/labmed/lmy019
15. Whiting PF, Rutjes AW, Westwood ME, Mallett S, Deeks JJ, Reitsma JB, et al. QUADAS-2: a revised tool for the quality assessment of diagnostic accuracy studies. Ann Intern Med. (2011) 155:529–36. doi: 10.7326/0003-4819-155-8-201110180-00009
16. Higgins JP, Thompson SG, Deeks JJ, Altman DG. Measuring inconsistency in meta-analyses. BMJ. (2003) 327:557–60. doi: 10.1136/bmj.327.7414.557
17. Deeks JJ, Macaskill P, Irwig L. The performance of tests of publication bias and other sample size effects in systematic reviews of diagnostic test accuracy was assessed. J Clin Epidemiol. (2005) 58:882–93. doi: 10.1016/j.jclinepi.2005.01.016
18. Huang ZH, Li LH, Hua D. Quantitative analysis of plasma circulating DNA at diagnosis and during follow-up of breast cancer patients. Cancer Lett. (2006) 243:64–70. doi: 10.1016/j.canlet.2005.11.027
19. Kohler C, Radpour R, Barekati Z, Asadollahi R, Bitzer J, Wight E, et al. Levels of plasma circulating cell free nuclear and mitochondrial DNA as potential biomarkers for breast tumors. Mol Cancer. (2009) 8:105. doi: 10.1186/1476-4598-8-105
20. Hashad D, Sorour A, Ghazal A, Talaat I. Free circulating tumor DNA as a diagnostic marker for breast cancer. J Clin Lab Anal. (2012) 26:467–72. doi: 10.1002/jcla.21548
21. Gong B, Xue J, Yu J, Li H, Hu H, Yen H, et al. Cell-free DNA in blood is a potential diagnostic biomarker of breast cancer. Oncol Lett. (2012) 3:897–900. doi: 10.3892/ol.2012.576
22. Leon SA, Shapiro B, Sklaroff DM, Yaros MJ. Free DNA in the serum of cancer patients and the effect of therapy. Cancer Res. (1977) 37:646–50.
23. Agassi R, Czeiger D, Shaked G, Avriel A, Sheynin J, Lavrenkov K, et al. Measurement of circulating cell-free DNA levels by a simple fluorescent test in patients with breast cancer. Am J Clin Pathol. (2015) 143:18–24. doi: 10.1309/AJCPI5YHG0OGFAHM
24. Gal S, Fidler C, Lo YM, Taylor M, Han C, Moore J, et al. Quantitation of circulating DNA in the serum of breast cancer patients by real-time PCR. Br J Cancer. (2004) 90:1211–5. doi: 10.1038/sj.bjc.6601609
25. Catarino R, Ferreira MM, Rodrigues H, Coelho A, Nogal A, Sousa A, et al. Quantification of free circulating tumor DNA as a diagnostic marker for breast cancer. DNA Cell Biol. (2008) 27:415–21. doi: 10.1089/dna.2008.0744
26. Stotzer OJ, Lehner J, Fersching-Gierlich D, Nagel D, Holdenrieder S. Diagnostic relevance of plasma DNA and DNA integrity for breast cancer. Tumour Biol. (2014) 35:1183–91. doi: 10.1007/s13277-013-1158-4
27. Tangvarasittichai O, Jaiwang W, Tangvarasittichai S. The plasma DNA concentration as a potential breast cancer screening marker. Indian J Clin Biochem. (2015) 30:55–8. doi: 10.1007/s12291-013-0407-z
28. Zhang L, Song X, Wang X, Xie Y, Wang Z, Xu Y, et al. Circulating DNA of HOTAIR in serum is a novel biomarker for breast cancer. Breast Cancer Res Treat. (2015) 152:199–208. doi: 10.1007/s10549-015-3431-2
29. Gordevicius J, Krisciunas A. Cell-free DNA modification dynamics in abiraterone acetate-treated prostate cancer patients. Clin Cancer Res. (2018) 24:3317–24. doi: 10.1158/1078-0432.CCR-18-0101
30. Park YR, Kim YM, Lee SW, Lee HY, Lee GE, Lee JE, et al. Optimization to detect TP53 mutations in circulating cell-free tumor DNA from patients with serous epithelial ovarian cancer. Obstet Gynecol Sci. (2018) 61:328–36. doi: 10.5468/ogs.2018.61.3.328
31. Ravelli A, Reuben JM, Lanza F, Anfossi S, Cappelletti MR, Zanotti L, et al. Breast cancer circulating biomarkers: advantages, drawbacks, and new insights. Tumour Biol. (2015) 36:6653–65. doi: 10.1007/s13277-015-3944-7
32. Tang S, Zhou F, Sun Y, Wei L, Zhu S, Yang R, et al. CEA in breast ductal secretions as a promising biomarker for the diagnosis of breast cancer: a systematic review and meta-analysis. Breast Cancer. (2016) 23:813–9. doi: 10.1007/s12282-016-0680-9
33. Lawicki S, Glazewska EK, Sobolewska M, Bedkowska GE, Szmitkowski M. Plasma levels and diagnostic utility of macrophage colony-stimulating factor, matrix metalloproteinase-9, and tissue inhibitor of metalloproteinases-1 as new biomarkers of breast cancer. Ann Lab Med. (2016) 36:223–9. doi: 10.3343/alm.2016.36.3.223
34. Swets JA. Measuring the accuracy of diagnostic systems. Science. (1988) 240:1285–93. doi: 10.1126/science.3287615
35. Herrera CA, Stoerker J, Carlquist J, Stoddard GJ, Jackson M, Esplin S, et al. Cell-free DNA, inflammation, and the initiation of spontaneous term labor. Am J Obstet Gynecol. (2017) 217:583.e1–8. doi: 10.1016/j.ajog.2017.05.027
36. Leon SA, Revach M, Ehrlich GE, Adler R, Petersen V, Shapiro B. DNA in synovial fluid and the circulation of patients with arthritis. Arthritis Rheum. (1981) 24:1142–50. doi: 10.1002/art.1780240905
37. Lo YM, Rainer TH, Chan LY, Hjelm NM, Cocks RA. Plasma DNA as a prognostic marker in trauma patients. Clin Chem. (2000) 46:319–23.
Keywords: circulating cell-free DNA, concentration, breast cancer, diagnostic value, meta-analysis
Citation: Yu D, Tong Y, Guo X, Feng L, Jiang Z, Ying S, Jia J, Fang Y, Yu M, Xia H, Shi L and Lou J (2019) Diagnostic Value of Concentration of Circulating Cell-Free DNA in Breast Cancer: A Meta-Analysis. Front. Oncol. 9:95. doi: 10.3389/fonc.2019.00095
Received: 14 September 2018; Accepted: 01 February 2019;
Published: 01 March 2019.
Edited by:
José Bines, Brazilian National Cancer Institute (INCA), BrazilReviewed by:
Marcio Debiasi, Latin American Cooperative Oncology Group (LACOG), BrazilLuigi Formisano, Vanderbilt University Medical Center, United States
Copyright © 2019 Yu, Tong, Guo, Feng, Jiang, Ying, Jia, Fang, Yu, Xia, Shi and Lou. This is an open-access article distributed under the terms of the Creative Commons Attribution License (CC BY). The use, distribution or reproduction in other forums is permitted, provided the original author(s) and the copyright owner(s) are credited and that the original publication in this journal is cited, in accordance with accepted academic practice. No use, distribution or reproduction is permitted which does not comply with these terms.
*Correspondence: Jianlin Lou, amlhbmxpbmxvdUAxNjMuY29t
†These authors have contributed equally to this work