 Meiliang Liu1†Xia Liu2†Shun Liu1Feifei Xiao3Erna Guo1,4Xiaoling Qin1Liuyu Wu1Qiuli Liang1Zerui Liang1Kehua Li1Di Zhang1Yu Yang1Xingxi Luo1Lei Lei1Jennifer Hui Juan Tan5
 Fuqiang Yin6,7*
 Xiaoyun Zeng1,7*
- 1School of Public Health, Guangxi Medical University, Nanning, China
- 2Key Laboratory of Longevity and Ageing-Related Disease of Chinese Ministry of Education, Centre for Translational Medicine and School of Preclinical Medicine, Guangxi Medical University, Nanning, China
- 3Department of Epidemiology and Biostatistics, University of South Carolina, Columbia, SC, United States
- 4School of International Education, Guangxi Medical University, Nanning, China
- 5School of Life Sciences and Chemical Technology, Ngee Ann Polytechnic, Singapore, Singapore
- 6Life Sciences Institute, Guangxi Medical University, Nanning, China
- 7Key Laboratory of High-Incidence-Tumor Prevention and Treatment, Guangxi Medical University, Ministry of Education, Nanning, China
Simultaneous identification of multiple single genes and multi-gene prognostic signatures with higher efficacy in liver cancer has rarely been reported. Here, 1,173 genes potentially related to the liver cancer prognosis were mined with Coremine, and the gene expression and survival data in 370 samples for overall survival (OS) and 319 samples for disease-free survival (DFS) were retrieved from The Cancer Genome Atlas. Numerous survival analyses results revealed that 39 genes and 28 genes significantly associated with DFS and OS in liver cancer, including 18 and 12 novel genes that have not been systematically reported in relation to the liver cancer prognosis, respectively. Next, totally 9,139 three-gene combinations (including 816 constructed by 18 novel genes) for predicting DFS and 3,276 three-gene combinations (including 220 constructed by 12 novel genes) for predicting OS were constructed based on the above genes, and the top 15 of these four parts three-gene combinations were selected and shown. Moreover, a huge difference between high and low expression group of these three-gene combination was detected, with median survival difference of DFS up to 65.01 months, and of OS up to 83.57 months. The high or low expression group of these three-gene combinations can predict the longest prognosis of DFS and OS is 71.91 months and 102.66 months, and the shortest is 6.24 months and 13.96 months. Quantitative real-time polymerase chain reaction and immunohistochemistry reconfirmed that three genes F2, GOT2, and TRPV1 contained in one of the above combinations, are significantly dysregulated in liver cancer tissues, low expression of F2, GOT2, and TRPV1 is associated with poor prognosis in liver cancer. Overall, we discovered a few novel single genes and multi-gene combinations biomarkers that are closely related to the long-term prognosis of liver cancer, and they can be potential therapeutic targets for liver cancer.
Introduction
Liver cancer is the sixth most common cancer and the fourth leading cause of cancer-related deaths (1). Specifically, hepatocellular carcinoma (HCC) accounts for more than 90% of liver cancer cases from a histopathological perspective. According to the GLOBOCAN 2018 database, there are about 841,000 new HCC cases and 782,000 related deaths worldwide each year, with China accounting for nearly half of the total number of global HCC cases and deaths (2, 3). In China, the Guangxi province has higher morbidity and mortality rates than the national average (4). The high mortality and poor prognosis of HCC poses a global challenge. Despite the slight increase in the 5-year survival rate of liver cancer in China from 10.1 to 12.1% over the periods of 2003–2015, it still remains at a low level (5). A survival analysis of 2, 887 liver cancer patients in 14 years showed that the 1-year, 3-year, and 5-year survival rates were 49.3, 26.6, and 19.5%, respectively (6).
Although there are many existing therapies for HCC including surgical resection, transplantation, ablation, and transcatheter chemoembolization, etc., the long-term survival of HCC patients remains poor due to their limited indications and different effects on prognosis (7–10). A 20-year prospective cohort analysis reported that the 5-year survival rates of TNM stage I, II, IIIA, and IVA patients after hepatectomy were 81.7, 77.2, 44, and 28.2%, respectively (11). Therefore, it is of crucial importance to explore new prognostic biomarkers and investigate treatment strategies to improve the overall prognosis of HCC patients.
Currently, the research on prognostic molecular markers of HCC is still ongoing, and many single-gene or multi-gene combination molecular markers related to HCC invasion, metastasis and prognosis are being gradually discovered. For example, the expression of HMGA1 in HCC is associated with poor prognosis and is found to promote tumor growth and migration in vitro (12). The overexpression of SYPL1 is associated with epithelial-mesenchymal transition (EMT) of HCC cells and can predict the prognosis of HCC (13). RBM8A and SIRT5 promote the migration and invasion of HCC cells by activating the EMT signaling pathway and targeting E2F1 (14, 15), respectively (16, 17). The EpCAM (18), a liver X receptor (LXR) (19), SPAG5 (20), and KOR (21) have been shown to be strongly correlated with HCC metastasis, invasion, or prognosis. Arginase-1, FTCD, and MOC-31 have a good performance in the diagnosis of HCC (22). TMEM88, CCL14, and CLEC3B can serve as potential prognostic markers of HCC (23). At the same time, some multi-gene combined prognostic studies on HCC have also been reported. For example, three genes (UPB1, SOCS2, RTN3) combination markers (24) and four genes (CENPA, SPP1, MAGEB6, HOXD9) combination models can predict the overall survival in patients with HCC prognosis (25).
However, due to the sample size limitation and the heterogeneity of the samples in different studies, the efficiency of the identified prognostic markers for liver cancer still has ample space to improve. In addition, because of the myriad of gene interaction capabilities and the possibility of synergistic promotion of disease progression, it is of great significance to find some multi-gene combinations that may have better prognostic efficacy than single genes for prognostic targets of liver cancer. Therefore, the leverage of the large sample sizes of the public data platforms, integrating new and effective mining and screening methods, as well as reliable experimental verification is a very promising direction for the discovery of multiple effective single genes and multi-gene combination prognostic markers of liver cancer.
High-throughput profiling technologies and bioinformatics methods are now being applied to all fields of biomedical research. A mass of cancer data, such as the mRNA expression, copy number variation, single nucleotide polymorphism (SNP), and microRNA expression generated by those tools are collected in public archives such as The Cancer Genome Atlas (TCGA) (http://cancergenome.nih.gov/), Coremine (http://www.coremine.com/medical/), Oncomine (https://www.oncomine.org/resource/login.html), Gene Expression Omnibus database (GEO, https://www.ncbi.nlm.nih.gov/geo/), etc. Making full use of the public data from these databases is meaningful for exploring and discovering effective HCC prognostic biomarkers. For instance, Li et al. (24) developed a three-gene prognostic signature composing of three genes UPB1, SOCS2, and RTN3, which was revealed to have prognostic value for HCC patients based on TCGA data. Our previous study used data retrieved from the Coremine, TCGA, and GEO database and discovered that high-expressed E2F transcription factor 3 is associated with poor prognosis of HCC (26).
In this study, we used text mining approach to find the medial related candidate gene list for liver cancer prognosis, and a total of 1,173 genes that might be related to the prognosis of liver cancer were finally obtained. The association of the 1,173 genes with overall survival (OS) and disease-free survival (DFS) was accessed in a large sample of TCGA cohort, in which the subgroups of 319 patients with DFS and 370 with OS were available. The survival analyses are carried out for each of these genes to identify single prognostic markers. Moreover, we performed survival analyses of the gene combinations and performed multiple screening for these HCC prognostic molecular markers, revealing the association between the expression of numerous genes or gene combinations and the survival in HCC patients. We then compared the ability of single genes and multiple gene combinations to predict the prognosis of HCC. Moreover, a huge difference between high and low expression group of these three-gene combinations was detected, with median survival difference of DFS up to 65.01 months, and of OS up to 83.57 months. The high or low expression group of these three-gene combinations can predict the longest prognosis of DFS and OS is 71.91 months and 102.66 months, and the shortest is 6.24 months and 13.96 months. Among the above genes that may be strongly correlated with the prognosis of HCC identified in large sample data, it was found that the combination of the three genes F2, GOT2, and TRPV1 that have not been systematically reported has a strong ability to predict the prognosis of HCC. We further verified F2, GOT2, and TRPV1 by three independent expression profile microarray data for liver cancer acquired from the Oncomine database, and conducted the quantitative real-time polymerase chain reaction (qRT-PCR) in 20 pairs of HCC and adjacent tissues, and immunohistochemistry (IHC) staining in 90 pairs of HCC and its precancerous tissues. These results validated that the low expression of F2, GOT2, and TRPV1 in liver cancer was associated with the poor prognosis of liver cancer.
Materials and Methods
Data Sources
We combined 3 corresponding concepts of the key word “liver cancer” with 2 concepts of the key word “prognosis” and 10 concepts of the key word “outcome,” respectively, (Supplementary Table S1), and searched for their corresponding genes or proteins in the Coremine database (http://www.coremine.com/medical/). After deleting duplicates, we selected 1,173 gene entries with p-values < 0.05 that might be associated with the prognosis of liver cancer for further analyses (Supplementary Table S2).
The above genes mined in the Coremine database include some genes obtained from other gene-mining reports; however, the number of samples and data standards in each report is different. Therefore, we selected the cohort of The Cancer Genome Atlas (TCGA) (http://cancergenome.nih.gov/), a database with consistent sample size and data standards, to conduct unified batch verification of these genes and conduct three-gene combinations survival analyses.
We studied the relationship between each of the selected 1,173 genes and the prognosis of liver cancer patients in TCGA cohort which downloaded from cBioPortal for Cancer Genomics (https://www.cbioportal.org/) in September 2018 (27, 28), and a subgroup of 319 liver cancer samples with HCC DFS corresponding follow-up data and a subgroup of 370 liver cancer samples with HCC OS corresponding follow-up data were chosen.
Survival Analysis and Gene Selection
Kaplan-Meier estimation of survival functions and Log-rank tests were used to evaluate effect of genes on DFS and OS. The Cox proportional hazard model was performed for multivariate analyses of HCC prognosis. Survival analyses were performed using the R survival package in R (version 3.3.1). The Kaplan-Meier survival curves and Cox proportional hazards regression model for DFS and OS were generated by IBM SPSS (version 23.0). The median expression level of a gene was used as a cutoff value for the classification of patients into high and low expression groups (29).
Human Tissue Samples
For the validation studies, we used 20 patients who underwent primary and curative hepatectomy from Apr 2016 to Apr 2018 at the First Affiliated Hospital of Guangxi Medical University. Those patients who have distinctive pathologic diagnosis of HCC without preoperative anticancer treatment were eligible for inclusion in this study. The paraffin-embedded pathologic specimens were collected during surgery and stored in a liquid nitrogen tank until the step of mRNA isolation. All patients received an explanation for the purpose of the study and signed informed consent. The Ethics Committee of Guangxi Medical University granted approval for this study. For IHC, a commercial biological tissue microarray containing 90 pairs of HCC and adjacent normal liver tissues was constructed by the Biological sample library of Shanghai Outdo Biotech Company, and the survival information of each case was usable. (Microarray: HLivH180Su14).
Quantitative Real-Time Polymerase Chain Reaction (qRT-PCR)
QRT-PCR was performed to evaluate the mRNA expression of selected genes in 20 HCC and their matched precancerous tissues. Total RNA was isolated using Trizol reagent (Life Technologies, Inc., NY, USA) according to the manufacturer's instructions. The concentration and purity of the total RNA were detected using Microplate reader (Bioteck Instruments, Inc., VT, USA). RNA reverse transcription was then performed with the PrimeScript™ RT reagent Kit (Takara Biomedical Technology (Beijing) Co., Ltd.) with gDNA Eraser (Perfect Real Time), and qRT-PCR was performed using the TB GreenTM Premix Ex TaqTM II (Tli RNaseH Plus) kit (Takara Biomedical Technology (Beijing) Co., Ltd.) protocol in a StepOnePlus system (Applied Biosystems. Life Technologies Holdings Pte Ltd, Singapore).
The sequences of the primers are as follows: F2: forward primer, 5′-CTGAGGGTCTGGGTACGAACT-3′, reverse primer, 5′-TGGGTAGCGACTCCTCCATAG-3′; GOT2: forward primer, 5′-AAGAGTGGCCGGTTTGTCAC-3′, reverse primer, 5′-AGAAAGACATCTCGGCTGAACT-3′; TRPV1: forward primer, 5′-TGCACGACGGACAGAACAC-3′, reverse primer, 5′-GCGTTGACAAGCTCCTTCAG-3′. The cycle conditions are as follows: after an initial incubation at 95°C for 30 s, the samples were cycled 40 times at 95°C for 5 s and 60°C for 30 s. The relative expression level of each gene in the individual samples was calculated using the 2−ΔΔCt method and normalized using GAPDH as an endogenous control.
Immunohistochemistry (IHC)
EnVision™ FLEX+, Mouse, High pH, (Link) (K8002, Dako) was used for the immunohistochemistry. After the tissue chips were baked and placed in LEICAST5010 (LEICA), PT Link (Dako North America, Inc.) was used for antigen retrieval. Primary antibodies were diluted (F2, 1:3000; GOT2, 1:80000; TRPV1, 1:1500) and incubated overnight at 4°C. The secondary antibody reactions were carried out using the Autostainer Link 48 (Dako North America, Inc.), the sections were subjected to color development with the DAB chromogenic kit, and finally counterstained with Hematoxylin (SLBT4555, Sigma Aldrich). The following antibodies were used: F2, 1: Anti-Thrombin (ab83981; Abcam), GOT2, 1: Anti-FABP-1 (ab171739; Abcam), TRPV1, 1: Anti-VR1 (ab3487; Abcam). All slides were evaluated by two independent pathologists who were blind about the clinicopathologic data.
The expression levels were scored as the staining intensity (0, negative; 1+, weak; 2+, moderate; 3+, strong) multiplied by the proportion of immunopositive staining area (0, < 25%; 1+, 25–50%; 2+, 50–75%; 3+, >75%) intensity of staining. Expression scores <5 were considered as “low expression,” and scores ≥5 were considered as “high expression.”
Statistics
Statistical analyses were conducted using R 3.3.1 (Auckland, NZ) and IBM SPSS 23.0 (Chicago, USA). McNemar test was used to test the paired 4-fold table experimental data of IHC. The paired t-test was used to analyze the qRT-PCR experimental data. Except for single-gene survival analyses and three-gene prognosis survival analyses with p-value < 0.01 as statistically significant, other statistical analyses were considered statistically significant with two-sided p-value < 0.05.
Results
Selection of Genes Related to Liver Cancer Prognosis and Liver Cancer Samples
We combined 3 corresponding concepts of the key word “liver cancer” [Liver neoplasms (alias Liver Cancer) (disease) (60,666 connections); Liver carcinoma (alias liver cell cancer) (disease) (55,739 connections); Carcinoma, Hepatocellular (alias Adult Liver Cancer) (mesh) (57,034 connections)] with 2 corresponding concepts of the key word “prognosis” [Prognosis (mesh) (77,312 connections); Prognostic Marker (alias Prognosis Marker) (chemical) (22,056 connections)] and 10 corresponding concepts of the key word “outcome” [Fatal Outcome (mesh) (34,016 connections); Outcome Assessment (Health Care) (alias Outcome Study) (mesh) (48,296 connections); Outcome studies (procedure) (9,545 connections); Treatment Outcome (mesh) (77,246 connections); Outcomes research (procedure) (5,540 connections); Outcome monitoring (procedure) (2,030 connections); Patient-focused outcomes (procedure) (3,830 connections); Treatment outcome in HSR (procedure) (998 connections); Patient Reported Outcome Measures (alias Patient Reported Outcome) (mesh) (2,301 connections); Patient Outcome Assessment (mesh) (9,066 connections)], respectively, (Supplementary Table S1), and searched for their corresponding genes or proteins in the Coremine database (http://www.coremine.com/medical/). With p-values < 0.05 as the criteria, a total of 1,173 genes that might be related to the prognosis of liver cancer were finally obtained after screening and elimination of duplicates. As the samples of liver cancer in the Coremine database were not uniform enough, we selected 319 samples for DFS and 370 samples for OS of liver cancer from the TCGA database and obtained the corresponding survival data as well as the expression information of the above 1,173 genes in these samples. This was necessary to carry out the subsequent survival analyses of these genes for liver cancer.
The Single Genes Prognostic Analyses
To clearly describe our process of screening genes, a flowchart of the analysis procedure was developed (Figure 1). First, we performed the Kaplan-Meier analysis of each of the 1,173 genes. It was found that the mRNA expression of 276 genes and 283 genes was significantly associated with DFS in 319 patients (p < 0.05) and OS in 370 patients (p < 0.05), respectively. Additionally, the mRNA expression of 166 of these genes was significantly associated with both DFS and OS (p < 0.05).
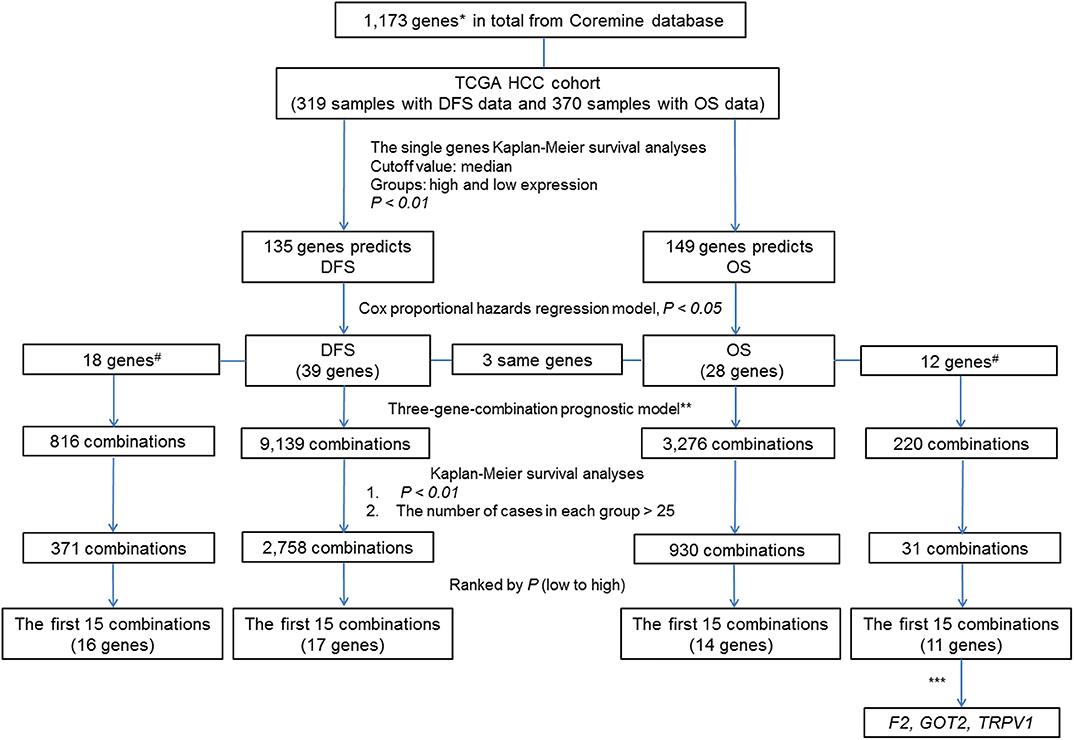
Figure 1. Flow Chart. #The associations of the genes with liver cancer prognosis that were not previously reported. *By text mining of searching for key words related to the markers of liver cancer prognosis and screening, a total of 1,173 genes containing both previously reported and unreported associations with liver cancer prognosis were obtained. **In each sample, the simultaneous high expression of all three genes was considered as high expression group in new combination. Similarly, the simultaneous low expression of all three genes was considered as low expression group in new combination. ***By comparing the prognostic value of individual genes and their combinations, we selected genes of combination F2- GOT2-TRPV1 for subsequent verification.
To further investigate the value of the genes in the prognosis of liver cancer, we chose 135 genes and 149 genes with p-values < 0.01 for DFS and OS, respectively. Next, we used the Cox proportional hazards regression model to employ multivariate analyses on the above genes, respectively to determine the DFS and OS prediction potential of these genes.
The DFS-related multivariate analysis results showed that the expression of 39 genes (ALDOB, APOB, AURKB, C5, CCNF, CD4, CENPJ, CETP, COL18A1, CPT2, DAND5, DNASE1, EBPL, F7, FLT3, G6PD, GNMT, ITGB2, KLRK1, KNG1, LMOD1, NEK2, PCLAF, PER1, PKM, POU2F1, PPAT, PPIA, PRF1, PTPN6, RUNX3, SELP, SLCO1B1, SPPL2A, STAT5A, TCF21, TRPV1, TUSC1, and TYMS) was significantly associated with DFS in HCC patients (p < 0.05, Table 1). The highly significant results of both the DFS-related single-gene survival analyses for each of these 39 genes and multivariate analysis confirmed that the above 39 genes have a strong association with the DFS of liver cancer, especially the 5-year disease free survival rate of liver cancer.
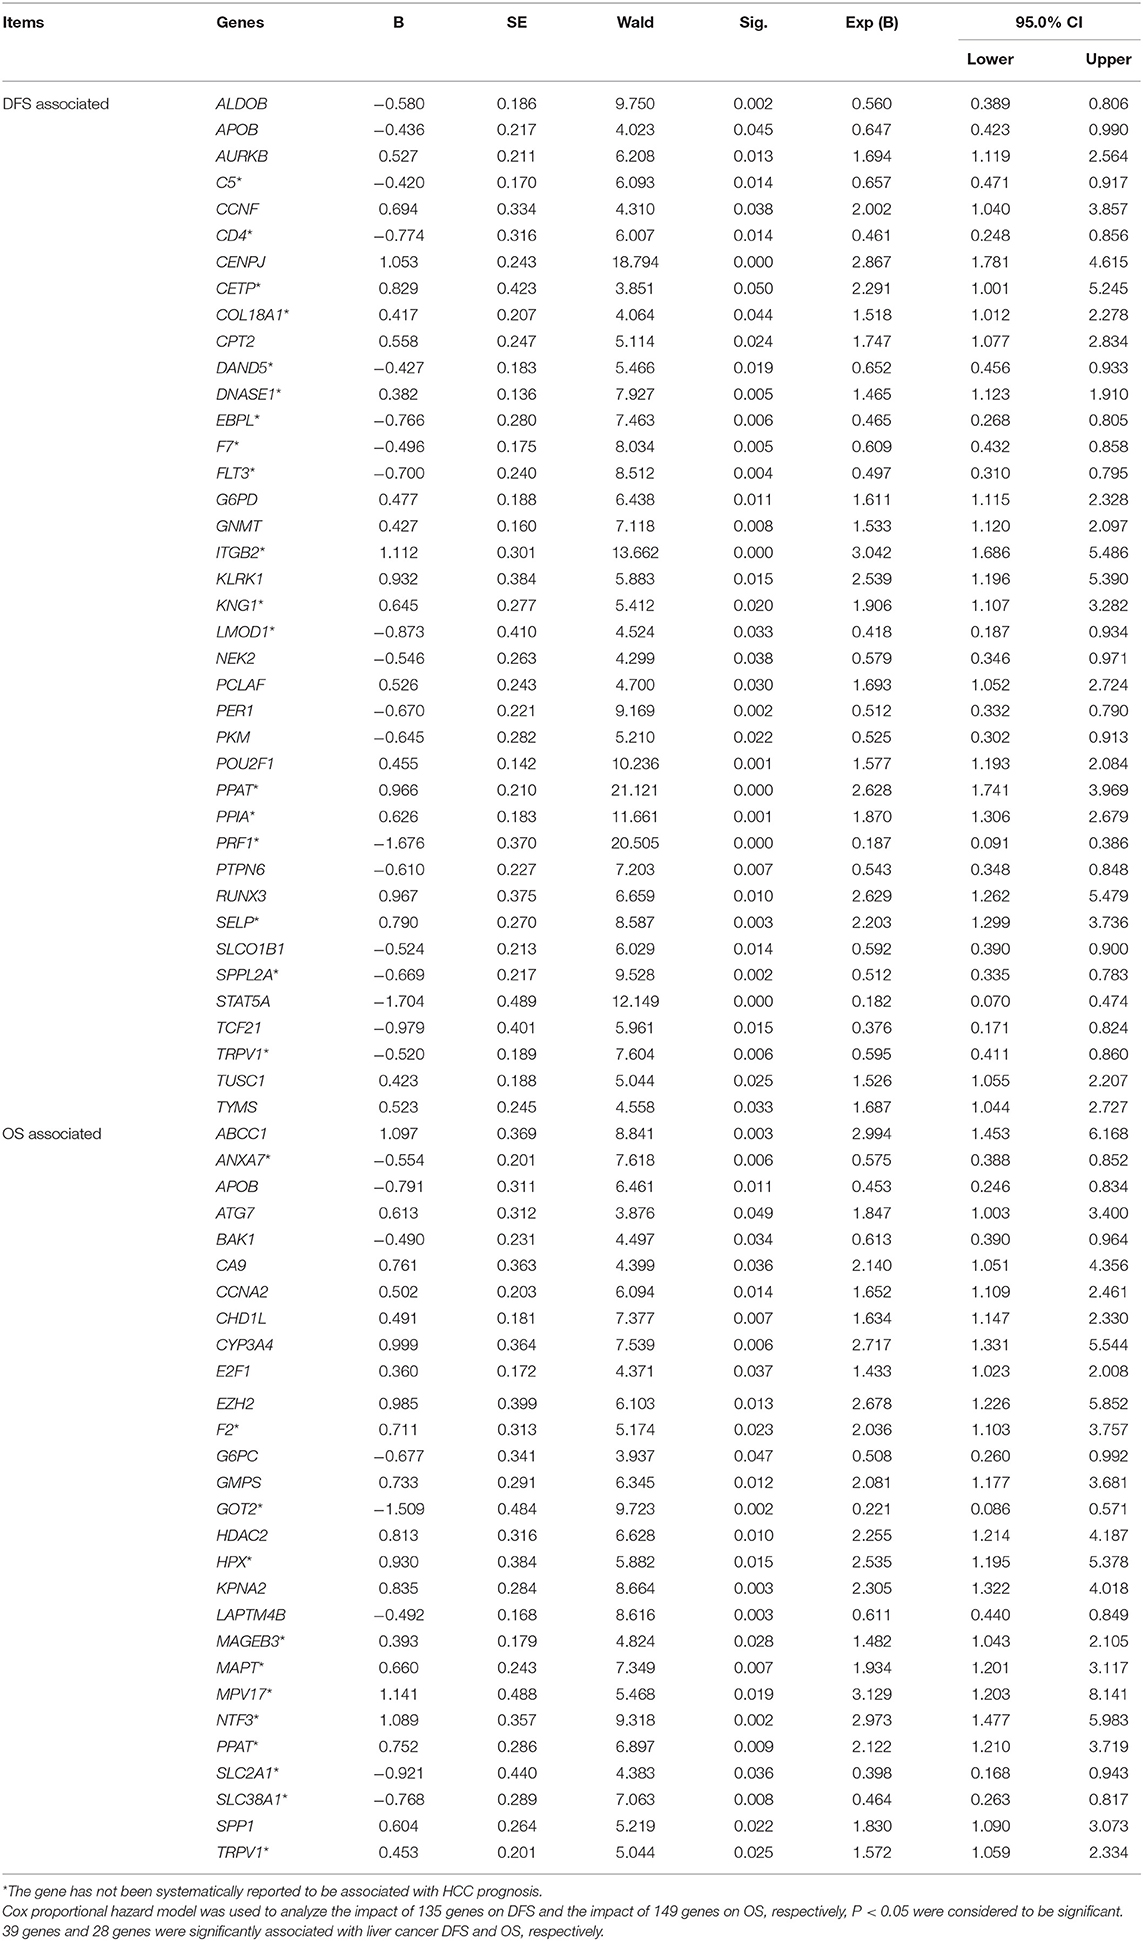
Table 1. Multivariate analyses of prognosis of DFS of 319 HCC patients and OS of 370 HCC patients in a TCGA cohort.
The OS-related multivariate analysis results showed that the expression of 28 genes (ABCC1, ANXA7, APOB, ATG7, BAK1, CA9, CCNA2, CHD1L, CYP3A4, E2F1, EZH2, F2, G6PC, GMPS, GOT2, HDAC2, HPX, KPNA2, LAPTM4B, MAGEB3, MAPT, MPV17, NTF3, PPAT, SLC2A1, SLC38A1, SPP1, and TRPV1) was significantly associated with OS in HCC patients. (p < 0.05, Table 1). The strongly significant results of both the OS-related single-gene survival analyses and multivariate analysis confirmed that these 28 genes are significantly associated with the OS of liver cancer, especially the 5-year survival rate of liver cancer.
Additionally, among the above-mentioned genes selected after single-gene survival analyses and multivariate analyses, 3 genes (APOB, PPAT, and TRPV1) were significantly associated with both DFS and OS in HCC patients.
Heat maps of the expression of the above 39 DFS-related genes and 28 OS-related genes in 1173 TCGA liver cancer samples, respectively, which grouped by prognosis status, were shown in Supplementary Figure S1.
Three-Gene-Combination Prognostic Model
To reflect the association of the expression of the combined genes with the prognosis of HCC, three-gene-combinations of the above 39 and 28 single genes that are significantly associated with DFS and OS, respectively, were formed, resulting in 9,139 and 3,276 three-gene-combinations for DFS and OS, respectively. In each combination, simultaneous high expression of the three genes in the same case was defined as the co-high expression group. Similarly, simultaneous low expression of the three genes in the same case was considered to be the co-low expression group. In order to ensure the comparability between the high and the low expression group, we deleted combinations which had < 25 cases in the co-high or co-low expression group.
Three-Gene-Combination of Prediction for DFS in Liver Cancer
K-M survival analysis of each of the above 9,139 combinations constituted by 39 DFS-related single genes was first performed. Then, we selected a total of 2,758 combinations with p-values < 0.01, excluding the combinations with no more than 25 cases in the co-high expression or co-low expression groups. Apparently, these selected 2,758 combinations have significant prognostic implications for DFS in liver cancer.
In addition, 18 of the above 39 single genes have not yet been systematically reported to be associated with HCC prognosis, and these 18 genes can combine into 816 three-gene-combinations. The results of the K-M survival analyses showed that 317 combinations had significant association with DFS of liver cancer (p < 0.01).
The top 15 combinations of the above 2,758 and 317 combinations with the smallest p-values were chosen. The DFS-related survival analyses diagrams and tables of these combinations and the single genes they contain are as follows (Figures 2, 3; Tables 2, 3).
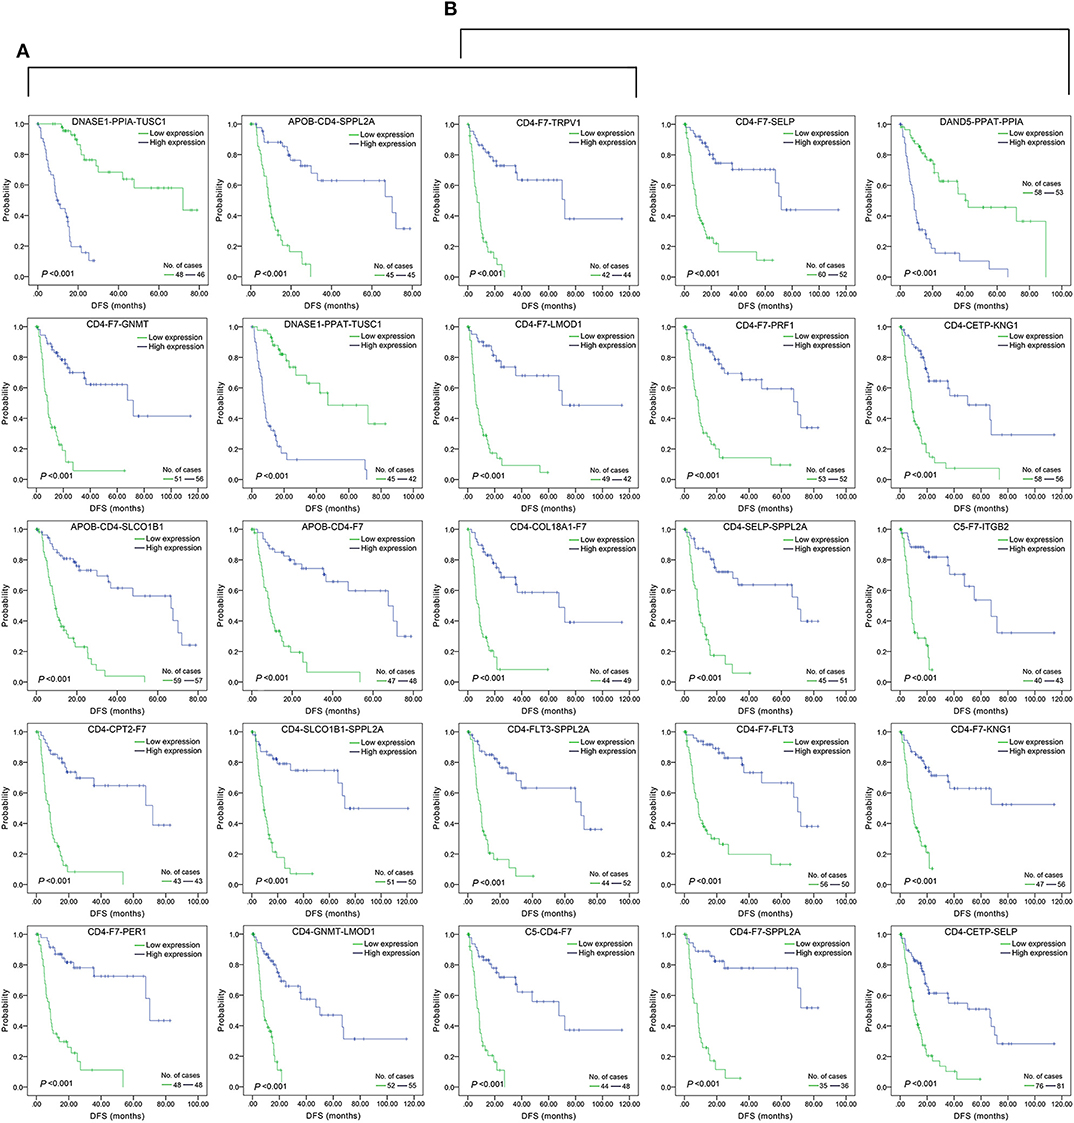
Figure 2. Association of DFS and the top 15 three-gene-combinations with smallest p-values, using the data of HCC samples in a TCGA cohort and assessed by Kaplan-Meier analyses. The high expression group (blue line) of the combination consisted of samples with high expression of all three genes, and the low expression group (green line) of the combination consisted of samples with low expression of all three genes. The number of high and low expression groups in each combination was >25. (A) Association of DFS and the top 15 combinations of the overall genes combinations. (B) Association of DFS and the top 15 combinations of the unreported genes combinations.
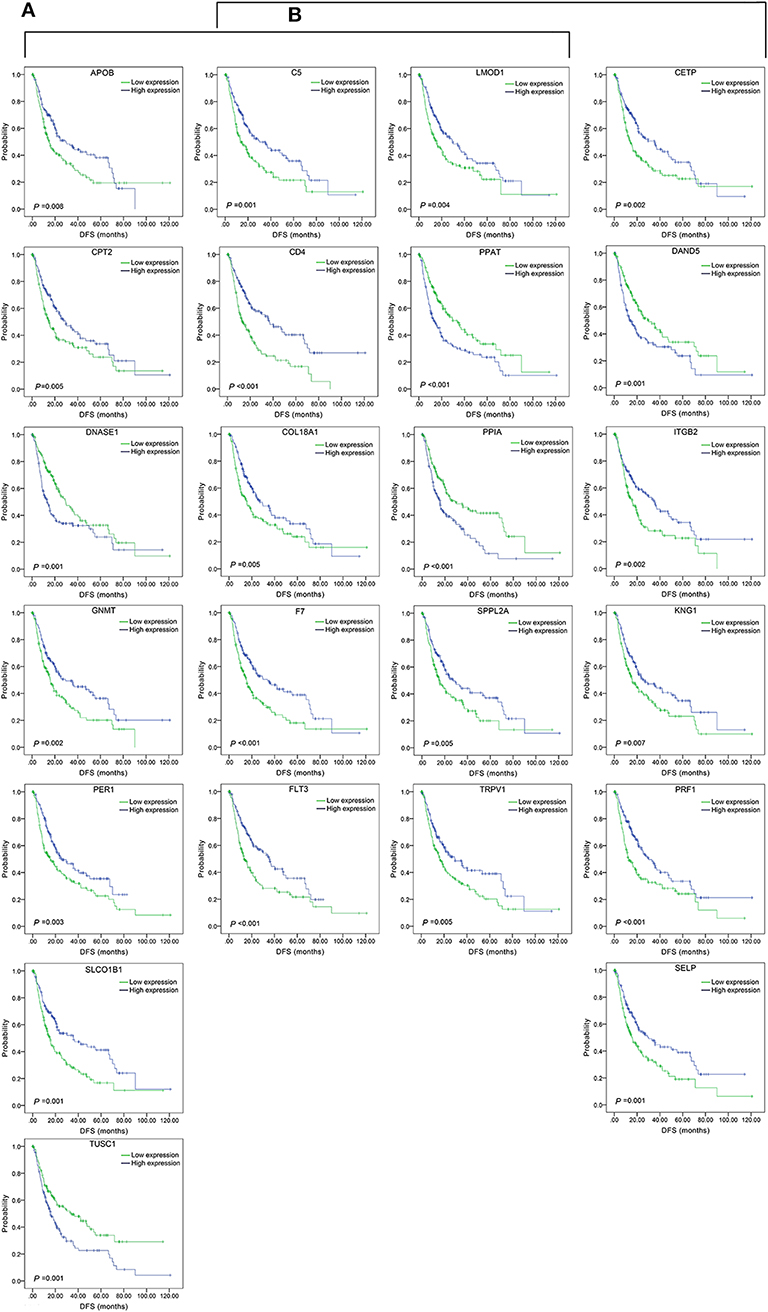
Figure 3. Association of DFS and the individual genes contained in the top 15 combinations with the lowest P-values, using the data of HCC samples in a TCGA cohort and assessed by Kaplan-Meier analyses. (A) Association of DFS and the 17 single genes contained in the first 15 total-gene combinations. (B) Association of DFS and the 16 single genes contained in the first 15 unreported-gene combinations.
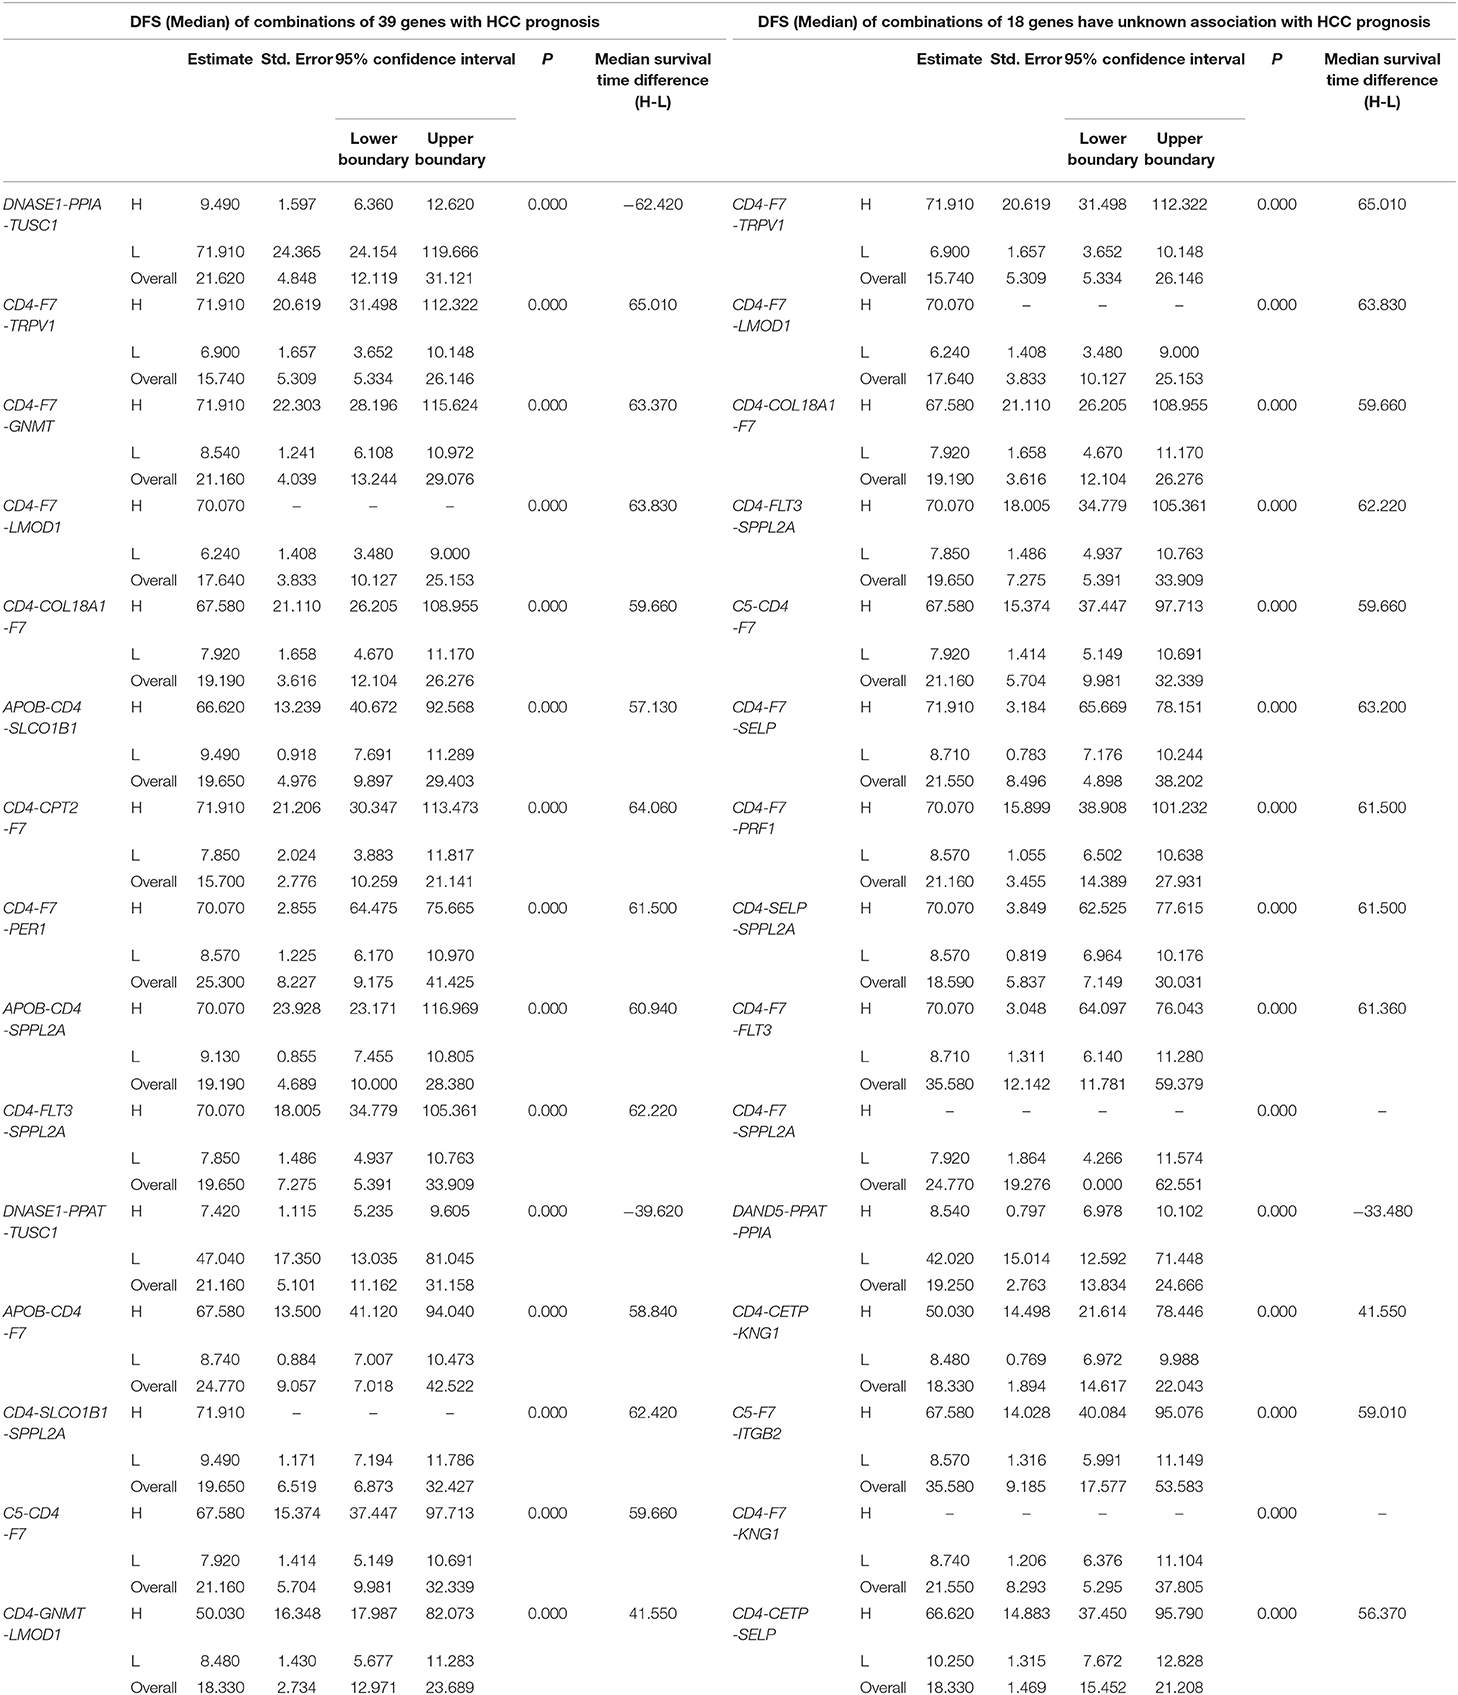
Table 2. The associations of three-gene combinations with disease-free survival (DFS) of HCC patients in a TCGA cohort, analyzed by Kaplan-Meier method.
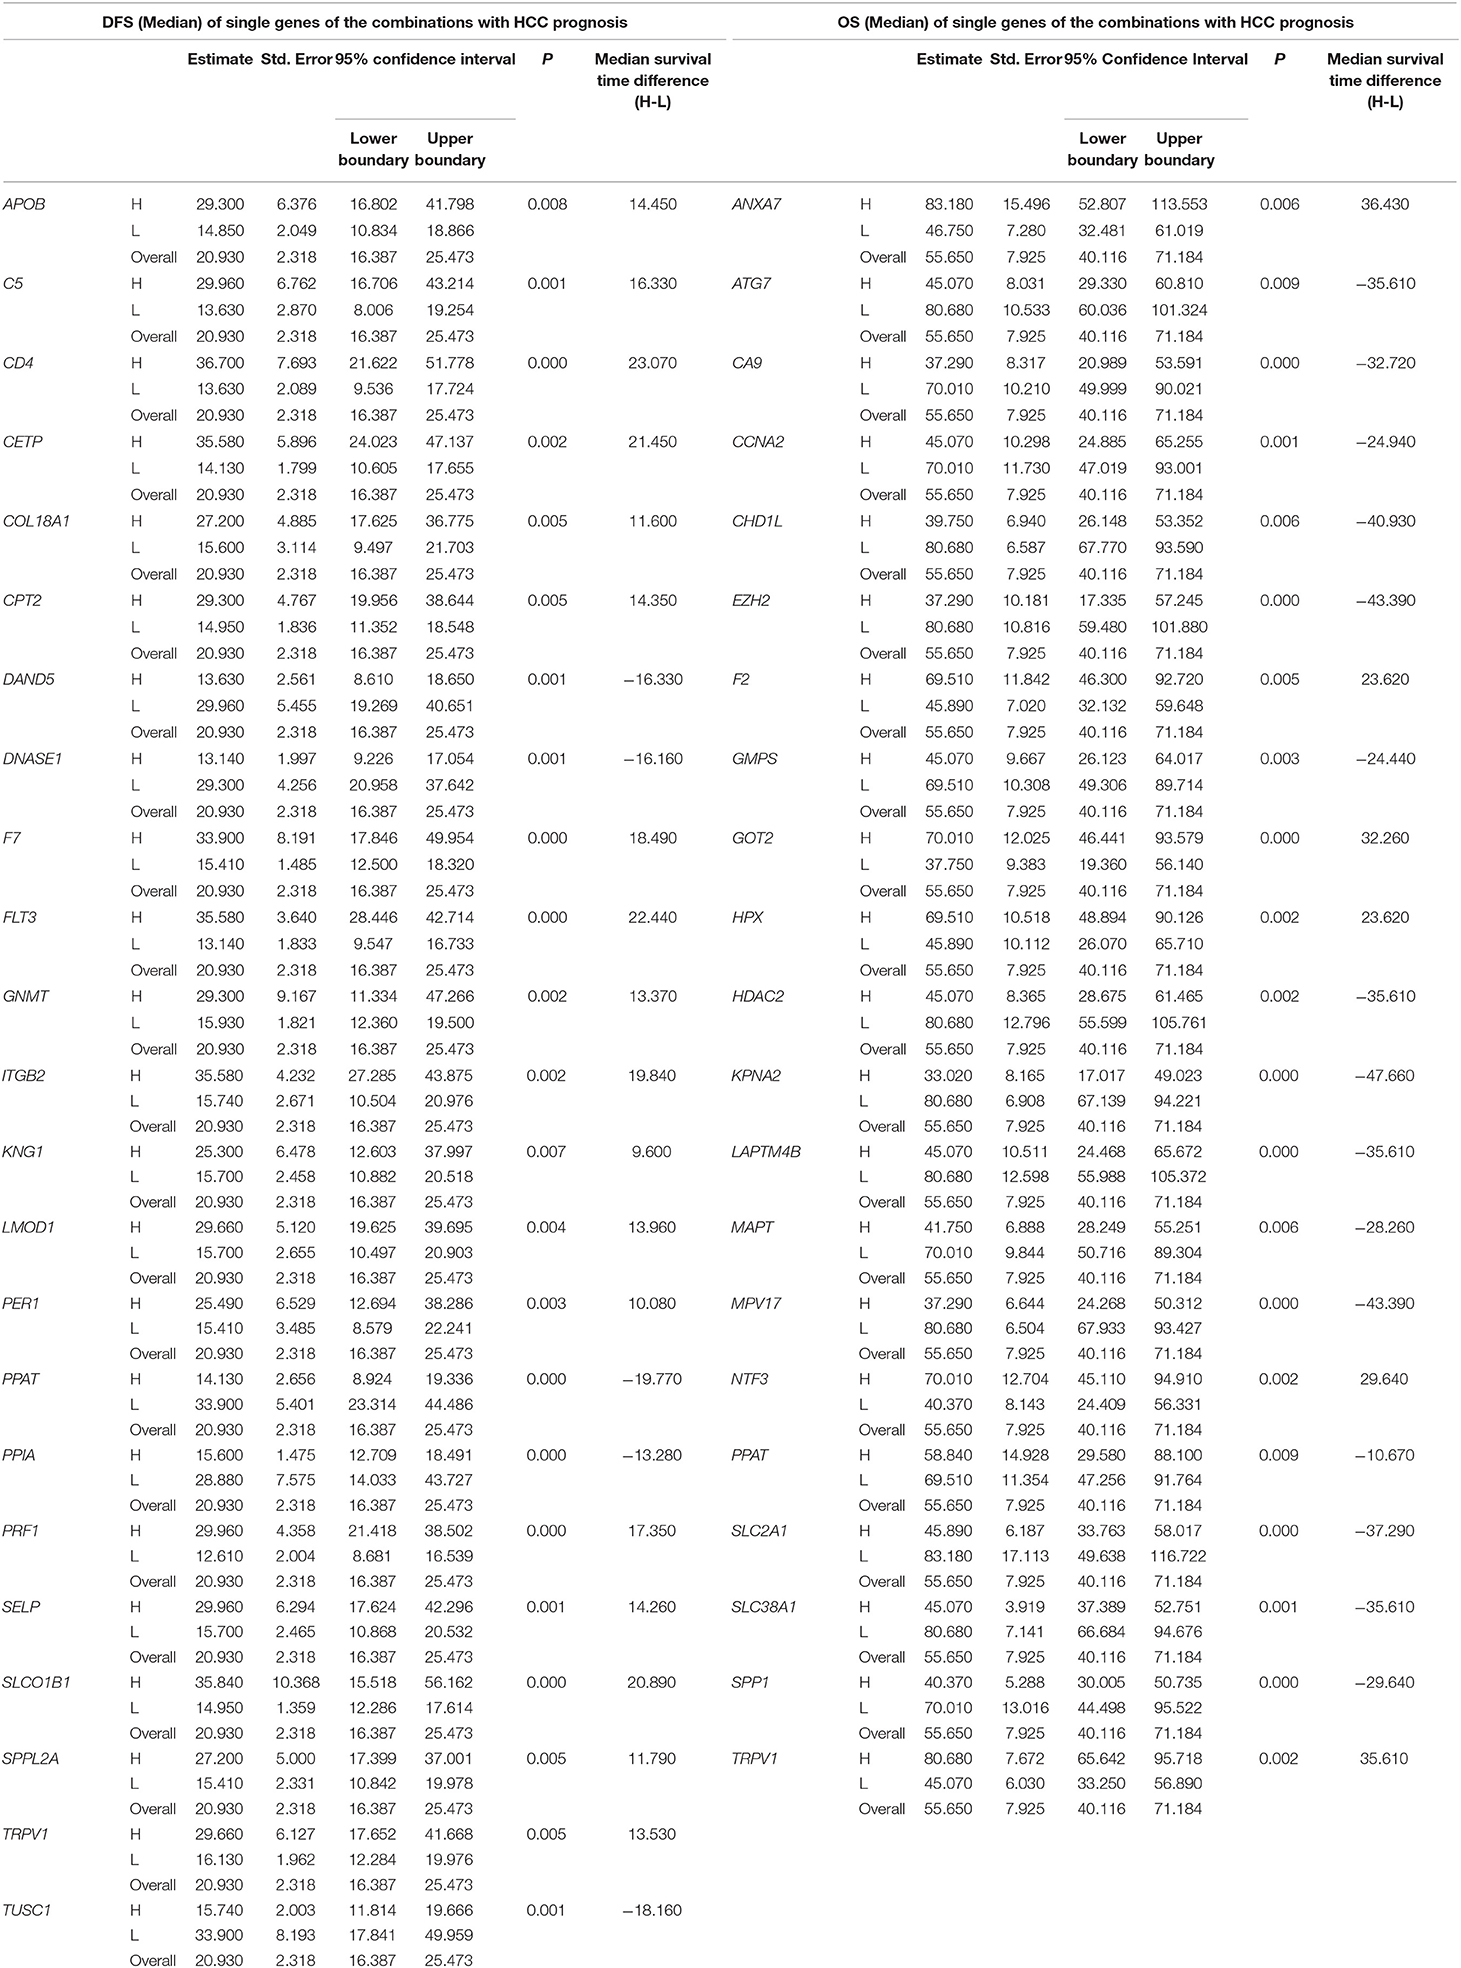
Table 3. The associations of single genes contained in the multi-gene combinations with disease-free survival (DFS) and overall survival (OS) of HCC patients in a TCGA cohort, analyzed by Kaplan-Meier method.
Three-Gene-Combination of Prediction for OS in Liver Cancer
Similarly, three-gene-combinations of the 28 single genes significantly associated with OS confirmed by the single gene survival analyses and the multivariate analysis were formed, resulting in 3,276 three-gene-combinations. 930 of these 3,276 combinations were screened out on the conditions that the number of cases in both the co-high and co-low expression groups was > 25, and the p-values were < 0.01 according to the OS-related K-M analyses results.
Furthermore, 12 of the above 28 single genes that were noted to have an unknown association with liver cancer prognosis formed 220 three-gene-combinations. Out of the 220 combinations, there were 31 combinations in which the number of cases in both the co-high and co-low expression groups was > 25 and the OS-related survival analyses results showed p < 0.01.
We found 930 of above 3,276 combinations and 31 of above 220 unreported-gene combinations were significant association with OS related survival of liver cancer patients. Among the 930 combinations and 31 combinations mentioned above, the diagrams and tables of the OS-related survival analyses of the top 15 combinations with the smallest p-values and the single genes they contain are as follows (Figures 4, 5; Tables 3, 4) Among the 12 genes that have an unknown association with HCC prognosis, F2, GOT2, TRPV1, and their combination F2-GOT2-TRPV1 were all significantly associated with OS in 370 liver cancer samples from the TCGA data (F2: p = 0.005; GOT2: p < 0.001; TRPV1: p = 0.002; F2-GOT2-TRPV1: p < 0.001). The overall survival rate in HCC patients with low expression of F2, GOT2, TRPV1, and the three-gene-combination F2-GOT2-TRPV1 were all significantly lower than that in liver cancer patients with high expression. In addition, the median survival time difference between the high expression group and the low expression group of F2, GOT2, TRPV1, and the three-gene combination F2-GOT2-TRPV1 was 23.62, 32.26, 35.61, and 55.68 months, respectively. The median survival time difference of this combination was greater than that of a single gene, which was one of the main reasons why we selected these three genes for qRT-PCR and immunohistochemically validation.
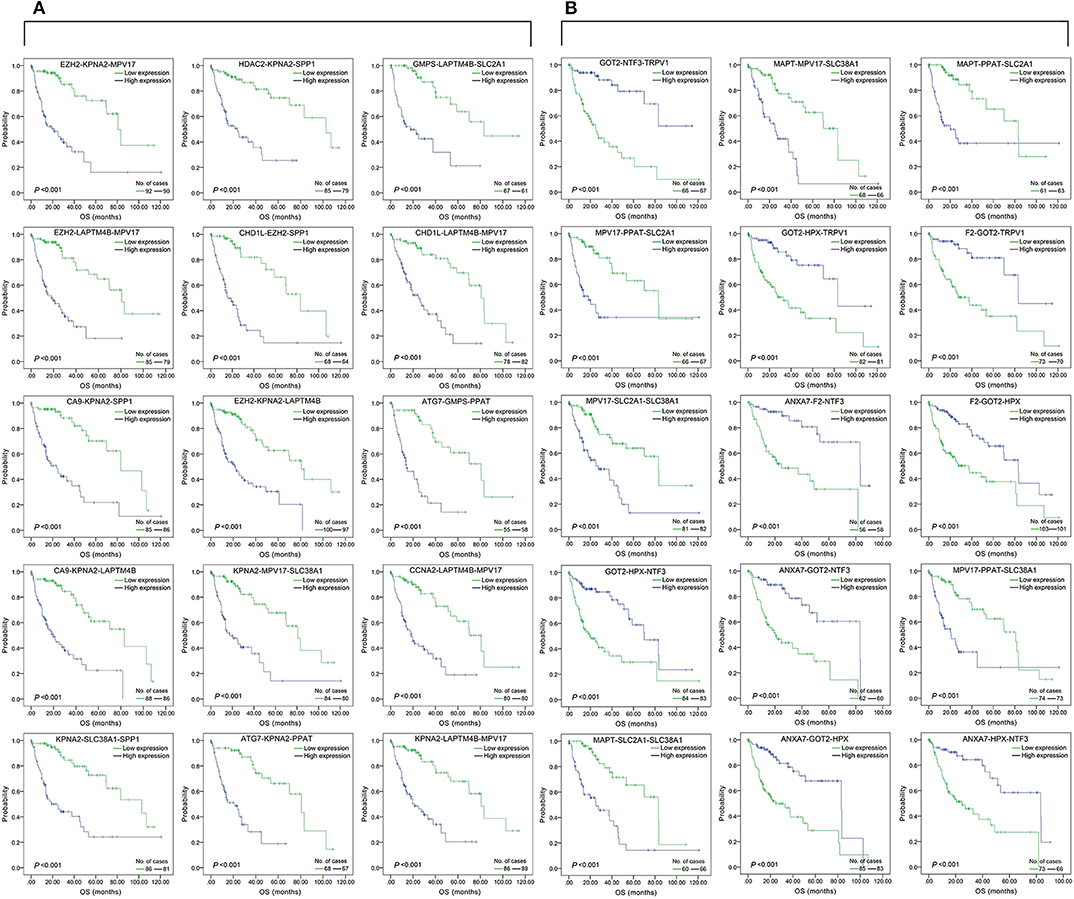
Figure 4. Association of the top 15 three-gene-combinations with smallest p-values with OS, using the data of HCC samples in a TCGA cohort and assessed by Kaplan-Meier analyses. The high expression group (blue line) of the combination consisted of samples with high expression of all three genes, and the low expression group (green line) of the combination consisted of samples with low expression of all three genes. The number of high and low expression groups in each combination was >25. (A) Association of OS and the top 15 combinations with the smallest p-values of the overall genes combinations. (B) Association of OS and the top 15 combinations with the smallest p-values of the unreported genes combinations.
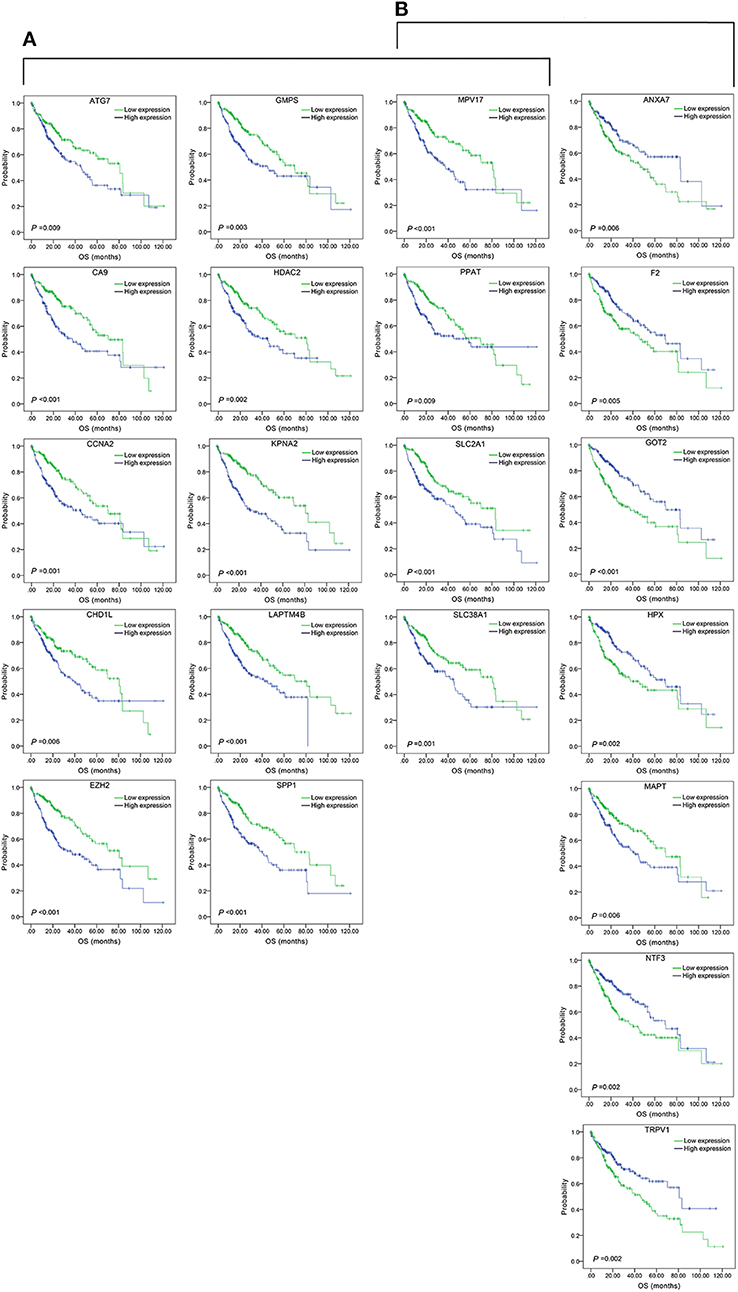
Figure 5. Association of OS and the individual genes contained in the top 15 combinations with the lowest P-values, using the data of HCC samples in a TCGA cohort and assessed by Kaplan-Meier analyses. (A) Association of OS and the 14 single genes contained in the first 15 total-gene combinations. (B) Association of OS and the 11 single genes contained in the first 15 unreported-gene combinations.
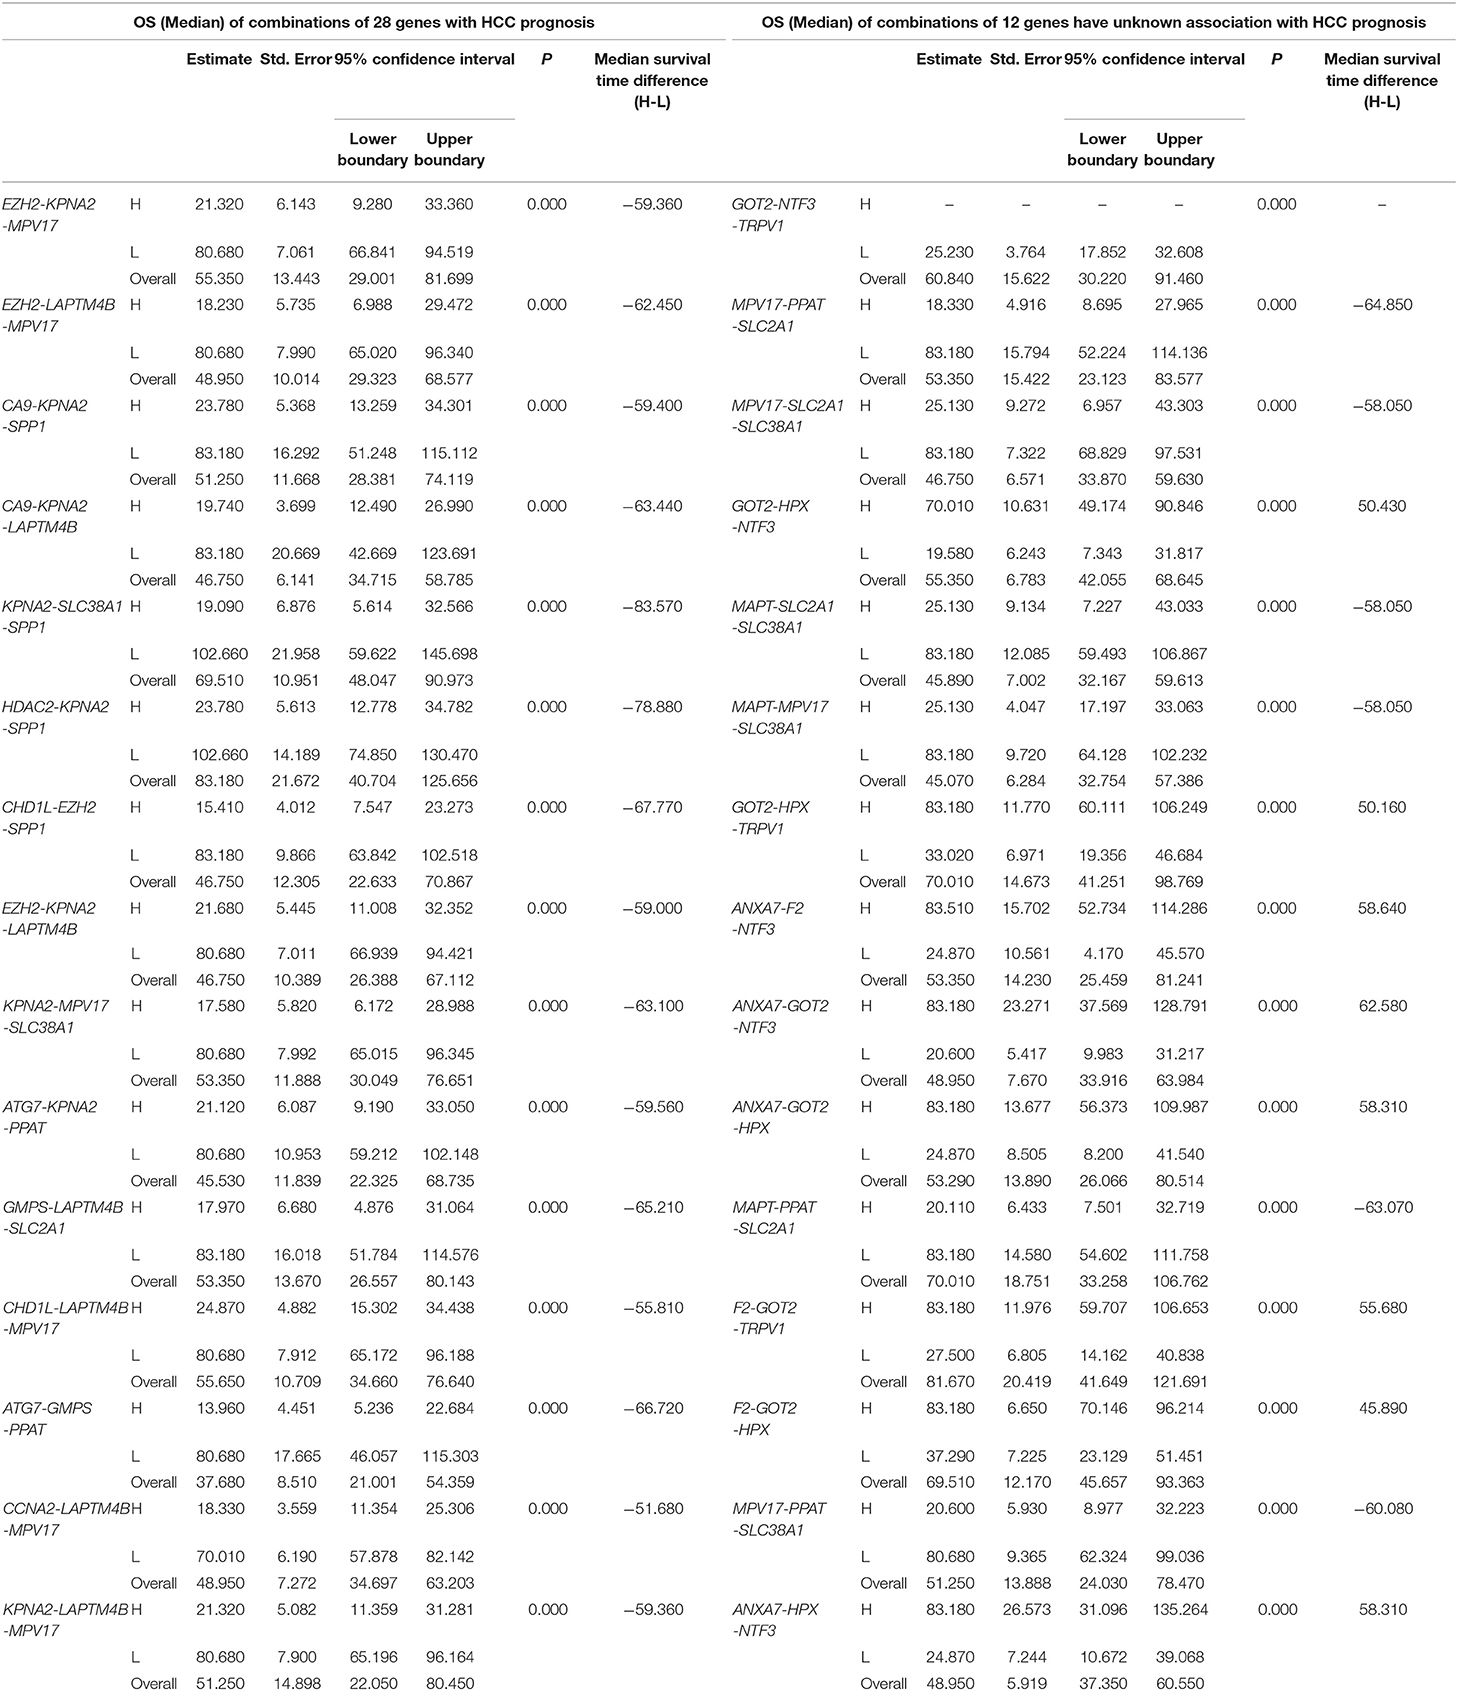
Table 4. The associations of three-gene combinations with overall survival (OS) of HCC patients in a TCGA cohort, analyzed by Kaplan-Meier method.
Low Expression of F2, GOT2, and TRPV1 Predicts Poor Prognosis
Based on the above results of the OS-related survival analyses and multivariate analyses on 28 genes, as well as the results of survival analyses on their three-gene-combinations, we selected three genes F2, GOT2, and TRPV1 with strong liver cancer prognostic potential for subsequent validation.
F2, GOT2, and TRPV1 Were Downregulated in HCC Tissues
The gene expression in HCC was determined based on three independent microarrays which are all collected in Oncomine database (https://www.oncomine.org/resource/login.html). As shown in Roessler Liver 2 Statistics (225 HCC tissues vs. 220 liver tissues), the expression of F2, GOT2, and TRPV1 in HCC tissues were all significantly down-regulated compared with that in normal liver tissues. (p < 0.001; Figure 6) In addition, based on the Mas Liver Statistics (38 HCC tissue vs. 19 liver tissue), both F2 and TRPV1 were significantly down-regulated in HCC tissues. Based on the Chen Liver Statistics (104 HCC tissues vs. 76 liver tissues), both F2 and GOT2 were significantly down-regulated in HCC tissues.
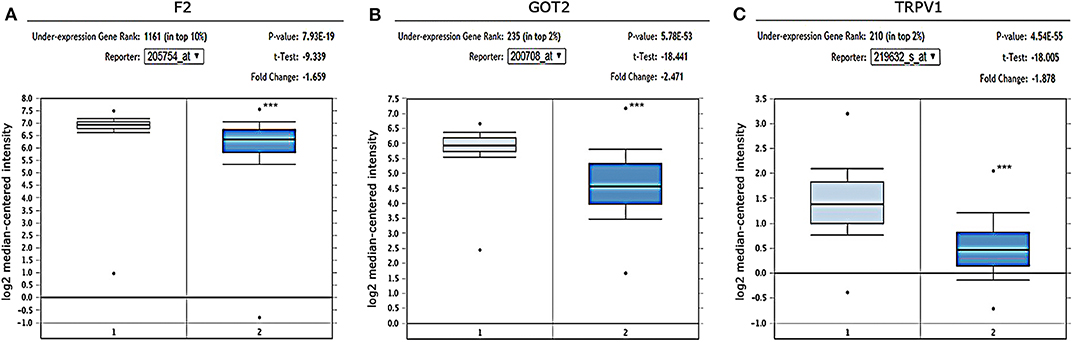
Figure 6. Expression of F2, GOT2, and TRPV1 in HCC and adjacent normal liver tissues confirmed by independent microarrays from the Oncomine database. The expression of (A) F2, (B) GOT2, and (C) TRPV1 were all significantly reduced in HCC tissues by the Roessler Liver 2 Statistics [225 HCC tissues (dark blue) vs. 220 normal liver tissues (light blue)]. ***p < 0.001.
The qRT-PCR results of F2, GOT2 and TRPV1 showed that 20/20, 19/20, and 16/19 of the HCC tissues exhibited significantly lower expression of F2 (p < 0.001; Figure 7A), GOT2 (p < 0.001; Figure 7B), and TRPV1 (p = 0.006; Figure 7C), respectively, when compared with their corresponding non-tumorous tissues.
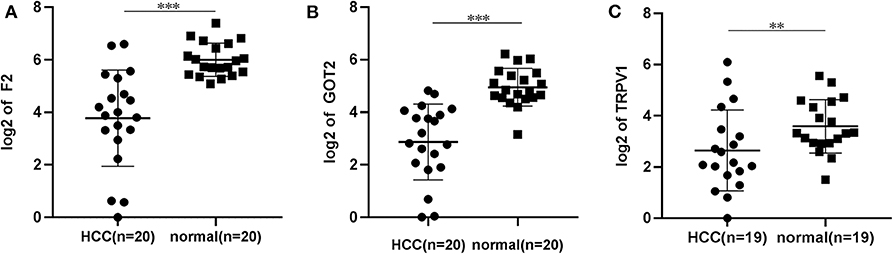
Figure 7. The relative expression levels of F2, GOT2, and TRPV1 were assessed by qRT-PCR in HCC tissues and adjacent liver tissues. (A) The expression levels of F2 were assessed by qRT-PCR in 20 pairs of HCC tissues and peritumoral tissues. Paired t-test, ***p < 0.001. (B) The relative expression levels of GOT2 were assessed by qRT-PCR in 19 pairs of HCC tissues and peritumoral tissues. Paired t-test, ***p < 0.001. (C) The relative expression levels of TRPV1 were assessed by qRT-PCR in 19 pairs of HCC tissues and peritumoral tissues. Paired t-test, log, **p < 0.01.
The protein expression of F2, GOT2, and TRPV1 in HCC tissues was evaluated using IHC. Positive staining of F2, GOT2, and TRPV1 was mainly localized in the cytoplasm of HCC cells. The representative staining of F2, GOT2, and TRPV1 negative and positive protein expression in HCC are shown in Figure 8A.
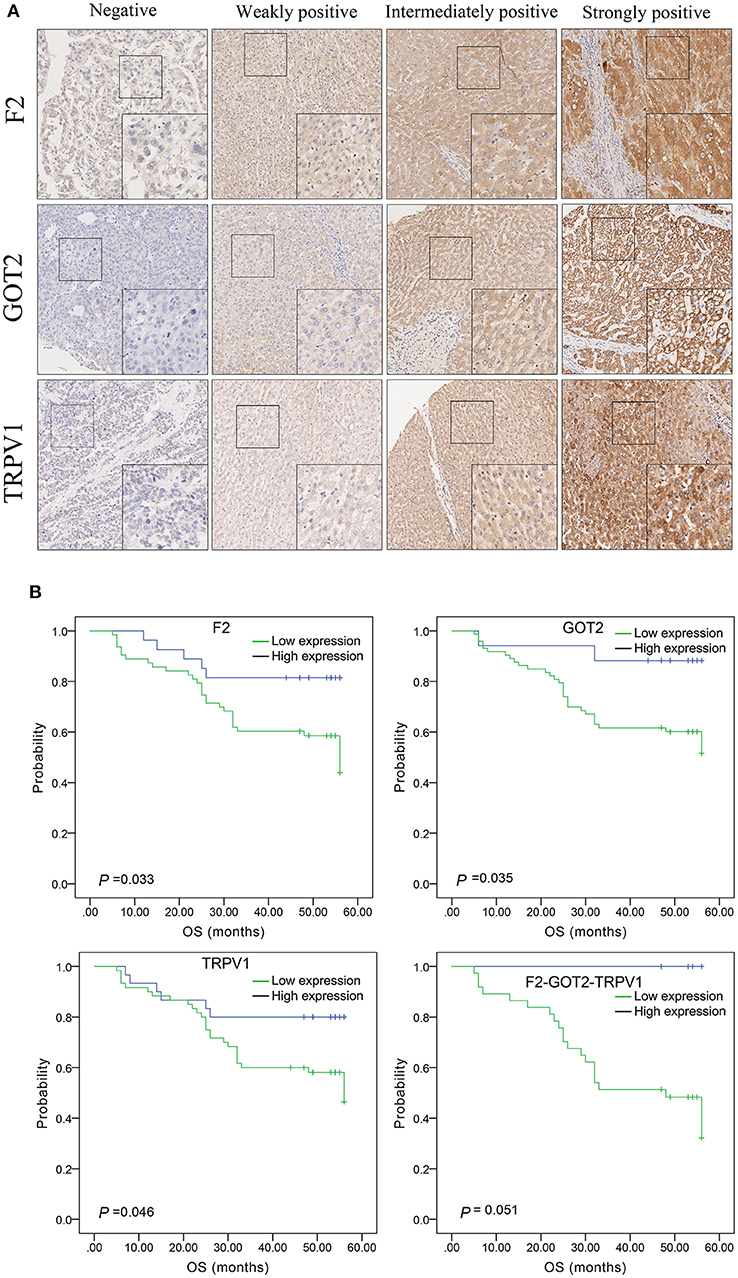
Figure 8. The expression of F2, GOT2, and TRPV1 in 90 pairs of HCC and adjacent normal liver tissues of biological tissue microarray by IHC, and the association with HCC patients prognosis. (A) Negative, weakly positive, intermediately positive, and strongly positive IHC staining of F2, GOT2, and TRPV1. F2, GOT2, and TRPV1 were all low expressed in liver cancer. (B) The lower protein expression levels of F2, GOT2, and TRPV1 were all associated with 5-year OS of 90 HCC patients, examing by Kaplan-Meier analyses and log-rank test. However, there was marginally significant association between the F2-GOT2-TRPV1 combination protein expression levels with the OS of HCC patients. (F2: p = 0.033, GOT2: p = 0.035, TRPV1: p = 0.046, F2-GOT2-TRPV1: p = 0.051).
Among 90 HCC tissues and adjacent non-malignant liver tissues, IHC was employed to measure the protein expression of F2, GOT2, and TRPV1, respectively. Low F2 expression was observed in 62/89 (69.66%) of the HCC tissues, compared to 33/89 (37.08%) in adjacent normal liver tissues (p < 0.001); low GOT2 expression was noted in 72/89 (80.90%) of the HCC tissues, compared to 32/89 (35.96%) in adjacent normal liver tissues (p < 0.001); low TRPV1 expression was also observed in 59/89 (66.29%) of the HCC tissues, compared to 38/89 (42.70%) in adjacent normal liver tissues (p = 0.002).
Expression of F2, GOT2, and TRPV1 and Their Combination F2-GOT2-TRPV1 With OS
Based on the above results of single-genes and three-gene combinations survival analyses of TCGA HCC samples, the low expression of F2, GOT2, TRPV1 and their combination F2-GOT2-TRPV1 was significantly associated with poor OS in HCC. (F2: p = 0.005; GOT2: p < 0.001; TRPV1: p = 0.002; F2-GOT2-TRPV1: p < 0.001). In addition, the median survival time difference between the high expression group and the low expression group of F2-GOT2-TRPV1 was greater than that of any of the three single genes.
The results of IHC for 90 liver cancer cases showed that the low protein expression of F2, GOT2, and TRPV1 was significantly associated with lower 5-year survival in HCC patients (F2: p = 0.033, GOT2: p = 0.035, TRPV1: p = 0.046; K-M survival analyses). However, due to the insufficient number of events in the co-high expression group of the combination F2-GOT2-TRPV1, there was marginally significant difference found in the overall survival rate of HCC patients between the co-high expression group and the co-low expression group of the protein combination F2-GOT2-TRPV1 (p = 0.051) (Figure 8B).
Discussion
Liver cancer is characterized by inconspicuous early symptoms, a high degree of malignancy, recurrence and spread, and unsatisfactory prognosis. With limited treatment options, it is one of the common malignancies that plague the world. Therefore, identification of effective prognostic biomarkers for liver cancer is the key to improving the efficacy of targeted therapy for HCC and reducing the adverse prognostic effects of liver cancer.
In our study, by combining and searching 15 corresponding concepts of the key words “liver cancer,” “prognosis,” and “outcome,” and according to p-values < 0.05, 1,173 genes that may be related to the prognosis of liver cancer were mined from the Coremine platform after merging and removing duplicates. However, due to the insufficient sample size and data related to the prognosis of liver cancer in the Coremine platform as well as the large heterogeneity among the samples, we also selected gene expression data and prognosis data of 319 samples for DFS and 370 samples for OS from the TCGA platform. We then separately conducted DFS-related and OS-related K-M survival analysis for each gene, followed by multivariate analyses, respectively. The large-scale genes mining and a large number of homogenous samples gave us a reliable analytical foundation. By far, this is the first large-scale survival analyses for hundreds of genes for subsequent screening.
In addition, the genes selected by K-M survival analyses with a low p-value (p < 0.01) were further screened by multivariate analyses using the Cox proportional hazards regression model. We found that 39 genes and 28 genes were reliably and significantly associated with DFS and OS, respectively, in liver cancer. Many of the above genes have been confirmed to be associated with the prognosis of HCC by previous reports. For example, of the 39 DFS-related genes, ALDOB inhibits metastasis in HCC and can be a valuable novel prognosis predicting marker (30); APOB was found to be a prognostic biomarker for patients with radical resection of HCC (31, 32); CCNF is downregulated in HCC and is a promising prognostic marker (33). In addition, CPT2 (34), G6PD (35), GNMT (36), NEK2 (37), etc. have also been reported to be prognostic markers of HCC by affecting the occurrence or invasion of HCC. The above findings are consistent with what we identified. Other genes, such as C5, CD4, CETP, COL18A1, DAND5, DNASE1, EBPL, F7, FLT3, ITGB2, KNG1, LMOD1, PPAT, PPIA, PRF1, SELP, SPPL2A, and TRPV1 that have not been systematically reported in relation to the prognosis of liver cancer, are our newly discovered prognostic markers for DFS in liver cancer. Similarly, of the 28 OS-related genes, CA9 regulates the epithelial-mesenchymal transition and is a novel prognostic marker in HCC (38), E2F1 expression has an impact on tumor aggressiveness and affects the prognosis of HCC (14, 15), CYP3A4 (39), HDAC2 (40), and KPNA2 (41) have also been identified as prognostic markers of HCC and are reflected in our findings. The other genes, such as ANXA7, F2, GOT2, HPX, MAGEB3, MAPT, MPV17, NTF3, PPAT, SLC2A1, SLC38A1, and TRPV1 are all novel prognostic markers associated with liver cancer OS found by our reliable and large-scale screening studies. Three genes (APOB, PPAT, and TRPV1) were associated with both DFS and OS of HCC, suggesting that APOB, PPAT, and TRPV1 may be significant and effective in predicting both the progress and the adverse outcomes of HCC.
Moreover, there may be connections among the above selected genes and they can work together to influence the development and prognosis of liver cancer to some extent. Although there are some genes that had been reported as prognostic molecular markers of liver cancer, most reports focused on the impact of a single gene on the prognosis of liver cancer, few studies performed such a large-scale survival analysis. Studies of multiple gene combinations are more effective than the analysis of single genes in predicting the prognosis of liver cancer.
In our study, we performed three-gene combinations of the 39 DFS-related genes and 28 OS-related genes screened from the above survival analyses. In order to further study the predictive effect of the combinations constituted by the selected genes on the prognosis of liver cancer, and to compare the predictive power of single genes and corresponding gene combinations, we carried out thousands of K-M survival analyses on these combinations. To ensure the comparability and credibility, we removed the combinations of which the co-high or co-low expression group cases were fewer than 26, and screened 2,758 DFS-related combinations and 930 OS-related combinations with p-values < 0.01. Moreover, we also performed three-gene-combination models and K-M survival analyses on the 18 DFS-related genes and 12 OS-related genes we found but have not been systematically reported to be related to the prognosis of HCC. 317 unreported-gene combinations and 31 unreported-gene combinations significantly associated with DFS and OS, respectively, were screened out.
For the above four types of three-gene-combinations (the overall genes combinations associated with DFS, the unreported genes combinations associated with DFS, the overall genes combinations associated with OS, and the unreported genes combinations associated with OS), the top 15 combinations with the lowest p-values of the survival analyses and the genes they contained were, respectively, selected for comparison (Tables 2, 3, 4).
For example, for the overall gene combinations associated with OS, KPNA2-SLC38A1-SPP1, the median survival time difference between the co-high and the co-low expression group was 83.57 months. In contrast, that of the single genes KPNA2, SLC38A1, and SPP1, was 47.66, 35.61, and 29.64 months, respectively. After combining KPNA2, SLC38A1, and SPP1, the median survival time difference between the high and low expression groups was larger than that of any of the three single genes by at least 36 months. This shows that these three genes KPNA2, SLC38A1, and SPP1, after combination, may be better predictive values for liver cancer prognosis and may be more clinically useful for future treatment target selection.
We also selected genes that have not been previously reported for liver cancer prognosis and compared their prognostic efficacy with the corresponding three-gene combinations (the chart only shows the top 15 groups with the lowest p-values of the three-gene combinations prognostic models). The expression of one of the combinations F2-GOT2-TRPV1 had a greater effect on the median survival time of OS than any of the three individual genes (The median survival time difference: F2-GOT2-TRPV1: 55.68 months; F2: 23.62 months; GOT2: 32.26 months; TRPV1: 35.61 months).
Coagulation factor II (F2) plays a major role in proteolysis to form thrombin in the first step of the coagulation cascade and eventually generates hemostasis. An enrichment analysis of genetic changes during the development of HCC identified several hub genes, including F2, which interacts in several groups of conditional specific PPI networks (42). Additionally, it was reported that F2 is associated with invasion in neuroendocrine prostate cancer (43). Glutamic-oxaloacetic transaminase 2 (GOT2) plays an important role in amino acid metabolism and the tricarboxylic acid cycle, and it affects the malate-aspartic acid shuttle activity and glycolysis in the liver under the stimulation of liver inflammation. (44, 45) TRPV1 is a regulator of cell homeostasis, previous studies have revealed that the expression of TRPV1 is significantly decreased in renal cell carcinoma, colorectal cancer, and melanoma. In addition, TRPV1 can affect P53 and TRPV1-dependent pathways to inhibit the growth of colorectal cancer and melanoma (46–48), and can cause apoptosis in human osteosarcoma MG63 cells (49).
At present, there are few studies on the above three genes F2, GOT2, TRPV1 and particular their combinations in the prognosis of HCC. In our study, the results of the 20 pairs of HCC and paracancerous tissues for qRT-PCR, as well as 90 pairs HCC biochips for IHC confirmed that all of the F2, GOT2, and TRPV1 genes are significantly and consistently down-expressed in HCC tissues, and this is reconfirmed by three independent microarrays. Moreover, the low expression of F2, GOT2, and TRPV1 were all significantly associated with poor prognosis of HCC. However, due to the number of death events in the F2-GOT2-TRPV1 high expression group of in the HCC biochips being 0, the survival analysis of the F2-GOT2-TRPV1 high and the expression group was marginally significant (p = 0.051), but this is still consistent with our above-mentioned big data-based multi-gene combination survival analysis results.
As there may be certain relationships between the genes we screened that are significantly associated with the prognosis of liver cancer, they can work together in the form of multi-gene combinations in the development of liver cancer. However, the predictive potency of different gene combinations varies. Some combinations are better predictors than individual genes, and therefore these combinations may be more valuable than individual genes in determining the target site for liver cancer prognosis. Due to limitations in human and material resources, it still remains unclear how these genes and gene combinations specifically affect the HCC survival. Further investigation and experimentations are needed to elucidate the biological mechanisms of the selected genes, particularly for the significant multi-gene combinations, in the development and progression of HCC.
Our findings cover a large gene level, and we have also explored the predictive efficacy of a number of gene combinations for the prognosis of liver cancer. We believe that these highly significant prognostic-related genes and gene combinations derived from the above multiple screenings are promising, reliable molecular markers for the prognosis of liver cancer, and our screening methods can be extended to other tumor types.
In conclusion, based on a large sample size of public data platform, novel and effective data mining and multiple screening methods, large-scale survival analyses, as well as supplemental reliable experimental verification, we identified a series of novel genes and multi-gene combinations that are significantly associated with DFS or OS in liver cancer. Moreover, a huge difference between high and low expression group of these three-gene combination was detected. Some of the three-gene combinations can predict much longer or shorter survival time for liver cancer patients than the single genes. QRT-PCR, immunohistochemistry, and three independent microarray results confirmed our findings that three of the selected novel genes F2, GOT2, and TRPV1, as well as the corresponding combination F2-GOT2-TRPV1, showed significantly lower expression in HCC and are associated with OS in HCC. Some gene combinations may be more predictors of prognosis than single genes and can be used as potential effective therapeutic targets for liver cancer.
Data Availability Statement
The datasets generated for this study are available on request to the corresponding author.
Ethics Statement
The studies involving human participants were reviewed and approved by The Ethics Committee of Guangxi Medical University. The patients/participants provided their written informed consent to participate in this study.
Author Contributions
ML and XLi performed most analysis. ML led the writing of the manuscript. SL provided the clinical samples and participated in revising the manuscript. FX and JT participated in drafting and reviewing the manuscript. EG conducted a search for genes and preliminary screening work by keyword. XQ obtained and matched the TCGA samples data. ML, LW, and QL performed the single-gene and multi-gene-combination survival analyses. ZL and LL conducted an inquiry about the relevant information of the selected genes. XLu performed validation of the selected genes in three microarrays. KL and DZ performed the mRNA isolation and qRT-qPCR, and collected and analyzed experimental data. YY and XLi were subjected to immunohistochemistry and experimental data processing. FY and XZ participated in designing and reviewing the study. All the authors reviewed the manuscript and all the authors read and approved the final manuscript.
Funding
This study was supported by the National Natural Science Foundation of China (Grant No. 81760611) and the Key Laboratory of High-Incidence-Tumor Prevention and Treatment (Guangxi Medical University), Ministry of Education (No. GKE 2019–01).
Conflict of Interest
The authors declare that the research was conducted in the absence of any commercial or financial relationships that could be construed as a potential conflict of interest.
Supplementary Material
The Supplementary Material for this article can be found online at: https://www.frontiersin.org/articles/10.3389/fonc.2020.00847/full#supplementary-material
References
1. IARC. Fact sheets by Population-Globocan-IARC. (2019). Retrieved from: http://gco.iarc.fr/today/fact-sheets-cancers (accessed September 14, 2019).
2. Bray F, Ferlay J, Soerjomataram I, Siegel RL, Torre LA, Jemal A. Global cancer statistics 2018: GLOBOCAN estimates of incidence and mortality worldwide for 36 cancers in 185 countries. CA Cancer J Clin. (2018) 68:394–424. doi: 10.3322/caac.21492
3. Qiu WQ, Shi JF, Guo LW, Mao AY, Huang HY, Hu GY, et al. Medical expenditure for liver cancer in urban China: A 10-year multicenter retrospective survey (2002-2011). J Cancer Res Ther. (2018) 14:163–70. doi: 10.4103/jcrt.JCRT_709_16
4. Deng W, Long L, Li JL, Zheng D, Yu JH, Zhang CY, et al. Mortality of major cancers in Guangxi, China: sex, age and geographical differences from 1971 and 2005. Asian Pac J Cancer Prev. (2014) 15:1567–74. doi: 10.7314/APJCP.2014.15.4.1567
5. Zeng H, Chen W, Zheng R, Zhang S, Ji JS, Zou X, et al. Changing cancer survival in China during 2003-15: a pooled analysis of 17 population-based cancer registries. Lancet Glob Health. (2018) 6:e555–67. doi: 10.1016/S2214-109X(18)30127-X
6. Wang CY, Li S. Clinical characteristics and prognosis of 2887 patients with hepatocellular carcinoma: A single center 14 years experience from China. Medicine. (2019) 98:e14070. doi: 10.1097/MD.0000000000014070
7. Zhu J, Yin T, Xu Y, Lu XJ. Therapeutics for advanced hepatocellular carcinoma: Recent advances, current dilemma, and future directions. J Cell Physiol. (2019) 234:12122–32. doi: 10.1002/jcp.28048
8. Finn RS, Zhu AX, Farah W, Almasri J, Zaiem F, Prokop LJ, et al. Therapies for advanced stage hepatocellular carcinoma with macrovascular invasion or metastatic disease: a systematic review and meta-analysis. Hepatology. (2018) 67:422–35. doi: 10.1002/hep.29486
9. Cai W, Wang Z, Wei C, Wu M, Zheng W, Zhang H, et al. Prognostic evaluation of NANOG and OCT4 expression for posttransplantation hepatocellular carcinoma recurrence. J Cell Biochem. (2019) 120:8419–29. doi: 10.1002/jcb.28128
10. Forner A, Reig M, Bruix J. Hepatocellular carcinoma. Lancet. (2018) 391:1301–14. doi: 10.1016/S0140-6736(18)30010-2
11. Fan ST, Mau Lo C, Poon RT, Yeung C, Leung Liu C, Yuen WK, et al. Continuous improvement of survival outcomes of resection of hepatocellular carcinoma: a 20-year experience. Ann Surg. (2011) 253:745–58. doi: 10.1097/SLA.0b013e3182111195
12. Andreozzi M, Quintavalle C, Benz D, Quagliata L, Matter M, Calabrese D, et al. HMGA1 expression in human hepatocellular carcinoma correlates with poor prognosis and promotes tumor growth and migration in in vitro models. Neoplasia. (2016) 18:724–31. doi: 10.1016/j.neo.2016.10.002
13. Chen DH, Wu QW, Li XD, Wang SJ, Zhang ZM. SYPL1 overexpression predicts poor prognosis of hepatocellular carcinoma and associates with epithelial-mesenchymal transition. Oncol Rep. (2017) 38:1533–42. doi: 10.3892/or.2017.5843
14. Huang YL, Ning G, Chen LB, Lian YF, Gu YR, Wang JL, et al. Promising diagnostic and prognostic value of E2Fs in human hepatocellular carcinoma. Cancer Manag Res. (2019) 11:1725–40. doi: 10.2147/CMAR.S182001
15. Han R, Chen X, Li Y, Zhang S, Li R, Lu L. MicroRNA-34a suppresses aggressiveness of hepatocellular carcinoma by modulating E2F1, E2F3, and Caspase-3. Cancer Manag Res. (2019) 11:2963–76. doi: 10.2147/CMAR.S202664
16. Liang R, Lin Y, Ye JZ, Yan XX, Liu ZH, Li YQ, et al. High expression of RBM8A predicts poor patient prognosis and promotes tumor progression in hepatocellular carcinoma. Oncol Rep. (2017) 37:2167–76. doi: 10.3892/or.2017.5457
17. Chang L, Xi L, Liu Y, Liu R, Wu Z, Jian Z. SIRT5 promotes cell proliferation and invasion in hepatocellular carcinoma by targeting E2F1. Mol Med Rep. (2018) 17:342–9. doi: 10.3892/mmr.2017.7875
18. Zhou L, Zhu Y. The EpCAM overexpression is associated with clinicopathological significance and prognosis in hepatocellular carcinoma patients: A systematic review and meta-analysis. Int J Surg. (2018) 56:274–80. doi: 10.1016/j.ijsu.2018.06.025
19. Long H, Guo X, Qiao S, Huang Q. Tumor LXR expression is a prognostic marker for patients with hepatocellular carcinoma. Pathol Oncol Res. (2018) 24:339–44. doi: 10.1007/s12253-017-0249-8
20. Zhou H, Wang SC, Ma JM, Yu LQ, Jing JS. Sperm-Associated Antigen 5 expression is increased in hepatocellular carcinoma and indicates poor prognosis. Med Sci Monit. (2018) 24:6021–8. doi: 10.12659/MSM.911434
21. Chen D, Chen Y, Yan Y, Pan J, Xing W, Li Q, et al. Down-regulation of the tumour suppressor kappa-opioid receptor predicts poor prognosis in hepatocellular carcinoma patients. BMC Cancer. (2017) 17:553. doi: 10.1186/s12885-017-3541-9
22. Labib OH, Harb OA, Khalil OH, Baiomy TA, Gertallah LM, Ahmed RZ. The Diagnostic Value of Arginase-1, FTCD, and MOC-31 expression in early detection of hepatocellular carcinoma (HCC) and in differentiation between HCC and metastatic adenocarcinoma to the liver. J Gastrointest Cancer. (2020) 51:88–101. doi: 10.1007/s12029-019-00211-2
23. Zhang X, Wan JX, Ke ZP, Wang F, Chai HX, Liu JQ. TMEM88, CCL14 and CLEC3B as prognostic biomarkers for prognosis and palindromia of human hepatocellular carcinoma. Tumour Biol. (2017) 39:1010428317708900. doi: 10.1177/1010428317708900
24. Li B, Feng W, Luo O, Xu T, Cao Y, Wu H, et al. Development and validation of a three-gene prognostic signature for patients with hepatocellular carcinoma. Sci Rep. (2017) 7:5517. doi: 10.1038/s41598-017-04811-5
25. Long J, Zhang L, Wan X, Lin J, Bai Y, Xu W, et al. A four-gene-based prognostic model predicts overall survival in patients with hepatocellular carcinoma. J Cell Mol Med. (2018) 22:5928–38. doi: 10.1111/jcmm.13863
26. Zeng X, Yin F, Liu X, Xu J, Xu Y, Huang J, et al. Upregulation of E2F transcription factor 3 is associated with poor prognosis in hepatocellular carcinoma. Oncol Rep. (2014) 31:1139–46. doi: 10.3892/or.2014.2968
27. Cerami E, Gao J, Dogrusoz U, Gross BE, Sumer SO, Aksoy BA, et al. The cBio cancer genomics portal: an open platform for exploring multidimensional cancer genomics data. Cancer Discov. (2012) 2:401–4. doi: 10.1158/2159-8290.CD-12-0095
28. Gao J, Aksoy BA, Dogrusoz U, Dresdner G, Gross B, Sumer SO, et al. Integrative analysis of complex cancer genomics and clinical profiles using the cBioPortal. Sci Signal. (2013) 6:pl1. doi: 10.1126/scisignal.2004088
29. Hedditch EL, Gao B, Russell AJ, Lu Y, Emmanuel C, Beesley J, et al. ABCA transporter gene expression and poor outcome in epithelial ovarian cancer. J Natl Cancer Inst. (2014) 106:dju149. doi: 10.1093/jnci/dju149
30. Tao QF, Yuan SX, Yang F, Yang S, Yang Y, Yuan JH, et al. Aldolase B inhibits metastasis through Ten-Eleven Translocation 1 and serves as a prognostic biomarker in hepatocellular carcinoma. Mol Cancer. (2015) 14:170. doi: 10.1186/s12943-015-0437-7
31. Yan X, Yao M, Wen X, Zhu Y, Zhao E, Qian X, et al. Elevated apolipoprotein B predicts poor postsurgery prognosis in patients with hepatocellular carcinoma. Onco Targets Ther. (2019) 12:1957–64. doi: 10.2147/OTT.S192631
32. Lee G, Jeong YS, Kim DW, Kwak MJ, Koh J, Joo EW, et al. Clinical significance of APOB inactivation in hepatocellular carcinoma. Exp Mol Med. (2018) 50:147. doi: 10.1038/s12276-018-0174-2
33. Fu J, Qiu H, Cai M, Pan Y, Cao Y, Liu L, et al. Low cyclin F expression in hepatocellular carcinoma associates with poor differentiation and unfavorable prognosis. Cancer Sci. (2013) 104:508–15. doi: 10.1111/cas.12100
34. Fujiwara N, Nakagawa H, Enooku K, Kudo Y, Hayata Y, Nakatsuka T, et al. CPT2 downregulation adapts HCC to lipid-rich environment and promotes carcinogenesis via acylcarnitine accumulation in obesity. Gut. (2018) 67:1493–504. doi: 10.1136/gutjnl-2017-315193
35. Lu M, Lu L, Dong Q, Yu G, Chen J, Qin L, et al. Elevated G6PD expression contributes to migration and invasion of hepatocellular carcinoma cells by inducing epithelial-mesenchymal transition. Acta Biochim Biophys Sin. (2018) 50:370–80. doi: 10.1093/abbs/gmy009
36. Huang YC, Chen M, Shyr YM, Su CH, Chen CK, Li AF, et al. Glycine N-methyltransferase is a favorable prognostic marker for human cholangiocarcinoma. J Gastroenterol Hepatol. (2008) 23:1384–9. doi: 10.1111/j.1440-1746.2008.05488.x
37. Chang YY, Yen CJ, Chan SH, Chou YW, Lee YP, Bao CY, et al. NEK2 Promotes hepatoma metastasis and serves as biomarker for high recurrence risk after hepatic resection. Ann Hepatol. (2018) 17:843–56. doi: 10.5604/01.3001.0012.3146
38. Hyuga S, Wada H, Eguchi H, Otsuru T, Iwgami Y, Yamada D, et al. Expression of carbonic anhydrase IX is associated with poor prognosis through regulation of the epithelialmesenchymal transition in hepatocellular carcinoma. Int J Oncol. (2017) 51:1179–90. doi: 10.3892/ijo.2017.4098
39. Ashida R, Okamura Y, Ohshima K, Kakuda Y, Uesaka K, Sugiura T, et al. CYP3A4 Gene is a novel biomarker for predicting a poor prognosis in hepatocellular carcinoma. Cancer Genomics Proteomics. (2017) 14:445–53. doi: 10.21873/cgp.20054
40. Quint K, Agaimy A, Di Fazio P, Montalbano R, Steindorf C, Jung R, et al. Clinical significance of histone deacetylases 1, 2, 3, and 7: HDAC2 is an independent predictor of survival in HCC. Virchows Arch. (2011) 459:129–39. doi: 10.1007/s00428-011-1103-0
41. Jiang P, Tang Y, He L, Tang H, Liang M, Mai C, et al. Aberrant expression of nuclear KPNA2 is correlated with early recurrence and poor prognosis in patients with small hepatocellular carcinoma after hepatectomy. Med Oncol. (2014) 31:131. doi: 10.1007/s12032-014-0131-4
42. Xue H, Luo L, Yao YT, Wei LL, Deng SP, Huang XL. Integrated analysis of the RNA-Seq data of liver hepatocellular carcinoma. Neoplasma. (2018) 65:97–103. doi: 10.4149/neo_2018_170212N98
43. Choe H, Sboner A, Beltran H, Nanus D, Tagawa ST. PO-43 - Differential coagulation factor expression in neuroendocrine prostate cancer (PC), metastatic castrate-resistant PC, and localized prostatic adenocarcinoma. Thromb Res. (2016) 140(Suppl. 1):S192. doi: 10.1016/S0049-3848(16)30176-1
44. Wang T, Yao W, Li J, He Q, Shao Y, Huang F. Acetyl-CoA from inflammation-induced fatty acids oxidation promotes hepatic malate-aspartate shuttle activity and glycolysis. Am J Physiol Endocrinol Metab. (2018) 315:E496–510. doi: 10.1152/ajpendo.00061.2018
45. Yang H, Zhou L, Shi Q, Zhao Y, Lin H, Zhang M, et al. SIRT3-dependent GOT2 acetylation status affects the malate-aspartate NADH shuttle activity and pancreatic tumor growth. Embo J. (2015) 34:1110–25. doi: 10.15252/embj.201591041
46. Wu YY, Liu XY, Zhuo DX, Huang HB, Zhang FB, Liao SF. Decreased expression of TRPV1 in renal cell carcinoma: association with tumor Fuhrman grades and histopathological subtypes. Cancer Manag Res. (2018) 10:1647–55. doi: 10.2147/CMAR.S166390
47. Hou N, He X, Yang Y, Fu J, Zhang W, Guo Z, et al. TRPV1 Induced apoptosis of colorectal cancer cells by activating calcineurin-NFAT2-p53 signaling pathway. Biomed Res Int. (2019) 2019:6712536. doi: 10.1155/2019/6712536
48. Yang Y, Guo W, Ma J, Xu P, Zhang W, Guo S, et al. Downregulated TRPV1 expression contributes to melanoma growth via the calcineurin-ATF3-p53 pathway. J Invest Dermatol. (2018) 138:2205–15. doi: 10.1016/j.jid.2018.03.1510
Keywords: liver cancer, gene combinations, data mining, disease-free survival (DFS), overall survival (OS)
Citation: Liu M, Liu X, Liu S, Xiao F, Guo E, Qin X, Wu L, Liang Q, Liang Z, Li K, Zhang D, Yang Y, Luo X, Lei L, Tan JHJ, Yin F and Zeng X (2020) Big Data-Based Identification of Multi-Gene Prognostic Signatures in Liver Cancer. Front. Oncol. 10:847. doi: 10.3389/fonc.2020.00847
Received: 02 January 2020; Accepted: 29 April 2020;
Published: 28 May 2020.
Edited by:
Chiara Romualdi, University of Padova, ItalyReviewed by:
Yanqiang Li, Houston Methodist Research Institute, United StatesFang Wang, University of Texas MD Anderson Cancer Center, United States
Copyright © 2020 Liu, Liu, Liu, Xiao, Guo, Qin, Wu, Liang, Liang, Li, Zhang, Yang, Luo, Lei, Tan, Yin and Zeng. This is an open-access article distributed under the terms of the Creative Commons Attribution License (CC BY). The use, distribution or reproduction in other forums is permitted, provided the original author(s) and the copyright owner(s) are credited and that the original publication in this journal is cited, in accordance with accepted academic practice. No use, distribution or reproduction is permitted which does not comply with these terms.
*Correspondence: Fuqiang Yin, eWluZnFAbWFpbDIuc3lzdS5lZHUuY24=; Xiaoyun Zeng, emVuZ3hpYW95dW5AZ3htdS5lZHUuY24=
†These authors have contributed equally to this work