 Lijuan Lyu1,2†Jia Yao1†Meng Wang2†Yi Zheng1,2Peng Xu1,2Shuqian Wang1Dai Zhang1,2
 Yujiao Deng1,2Ying Wu1,2
 Si Yang1,2
 Jun Lyu3
 Feng Guan4*
 Zhijun Dai1*
- 1Department of Breast Surgery, The First Affiliated Hospital, College of Medicine, Zhejiang University, Hangzhou, China
- 2Department of Oncology, The Second Affiliated Hospital of Xi'an Jiaotong University, Xi'an, China
- 3Department of Clinical Research, The First Affiliated Hospital of Jinan University, Guangzhou, China
- 4Provincial Key Laboratory of Biotechnology, Joint International Research Laboratory of Glycobiology and Medicinal Chemistry, College of Life Science, Northwest University, Xi'an, China
Immune checkpoint inhibitors (ICIs) have been successfully used for treating melanoma and non-small cell lung cancer. However, many patients with breast cancer (BC) show low response to ICIs due to the paucity of infiltrating immune cells. Pseudogenes, as a particular kind of long-chain noncoding RNA, play vital roles in tumorigenesis, but their potential roles in tumor immunology remain unclear. In this study that used data from online databases, the novel pseudogene HLA-DPB2 and its parental gene HLA-DPB1 were overexpressed and correlated with better prognosis in BC. Mechanistically, our results revealed that HLA-DPB2 might serve as an endogenous RNA to increase HLA-DPB1 expression by competitively binding with has-miR-370-3p. Functionally, gene ontology (GO) and Kyoto Encyclopedia of Genes and Genomes enrichment analysis indicated that the HLA-DPB2/HLA-DPB1 axis was strongly relevant to immune-related biological functions. Further analysis demonstrated that high expression levels of the HLA-DPB2 and HLA-DPB1 were significantly associated with high immune infiltration abundance of CD8+ T cells, CD4+ T cells, Tfh, Th1, and NK cells and with high expression of majority biomarkers of monocytes, NK cell, T cell, CD8+ T cell, and Th1 in BC and its subtype, indicating that HLA-DPB2 can increase the abundance of tumor-infiltrating lymphocytes in the BC microenvironment. Also, the HLA-DPB2 and HLA-DPB1 expression levels positively correlated with the expression levels of programmed cell death protein 1, programmed cell death ligand 1, and cytotoxic T-lymphocyte-associated antigen-4. Our findings suggest that pseudogene HLA-DPB2 can upregulate HLA-DPB1 through sponging has-miR-370-3p, thus exerting its antitumor effect by recruiting tumor-infiltrating immune cells into the breast tumor microenvironment, and that targeting the HLA-DPB2/HLA-DPB1 axis with ICIs may optimize the current immunotherapy for BC.
Introduction
Breast cancer (BC) is the leading cancer that affects women, and its incidence rate is clearly increasing in recent years (1). Despite huge advances in the early detection and early diagnosis and the combination of multiple treatments, the mortality rate of BC is still increasing significantly worldwide, and BC remains a global burden (2–4). Recently, tumor immunity and immunotherapy have attracted extensive attention in the treatment of multiple solid cancers and have been successful in the clinical field as a treatment for melanoma and non-small cell lung cancer (5). Immunotherapy is gradually becoming the future development direction of cancer treatment and is called the fourth major treatment technology for BC after surgery, radiotherapy, and chemotherapy (6).
Tumor immunotherapy is to overcome the mechanism of tumor immune escape, thereby reawakening immune cells to clear cancer cells, including immune system modulators, tumor antigen vaccines, adoptive cellular therapy, and immune checkpoint inhibitors (ICIs) (7). A recent research study has revealed the better therapeutic effect of programmed cell death protein 1/programmed cell death ligand 1 (PD-1/PD-L1) antagonists in combination with nab-paclitaxel in metastatic triple-negative BC (TNBC) (8). Unfortunately, most patients with BC, such as hormone-positive BCs, showed low response rates to the current immunotherapies such as PD-1 and PD-L1 inhibitors due to the paucity of infiltrating immune cells, which is called the “cold” immunological nature of BC (9). Consequently, to observe the dramatic response to immunotherapy in BC as has been observed in melanoma, finding ways to turn immunologically “cold” tumors to “hot” tumors by, such as increasing the abundances of tumor-infiltrating lymphocytes (TILs) in the microenvironment is imperative (10). TILs are predictive markers of the tumor-immune microenvironment and the response to ICIs therapy (11). Emerging studies have shown that the greater number of TILs, the stronger response to ICIs therapy (12, 13). The future of immunotherapy in BC lies in the combination of ICIs with strategies that activate the immune system to pursue maximal antitumor efficacy (14).
Pseudogenes, traditionally regarded as “junk genes” or “genomic fossils” owing to their lack of protein-coding ability, are a class of long noncoding RNAs (lncRNAs) that control the expressions of their homologous protein-coding genes (parent genes) or irrelevant genes by binding with various DNAs, RNAs, or proteins (15). Recently, mounting evidence has suggested that pseudogenes are often dysregulated in diverse human tumors, which can lead to the onset and progression of cancers (16, 17). For instance, the pseudogene PTENP1 acts as a competing endogenous RNA (ceRNA) to control PTEN expression, which mediates malignant behaviors of multiple cancers, including BC (18–22). Besides, high PTTG3P expression level promoted tumor cell proliferation, migration, and invasion and indicated bad prognosis in BC (23), cervical cancer (24), gastric cancer (25), and esophageal squamous cell carcinoma (26). Specially, Yang et al. (27) found that the pseudogene RP11-424C20.2 acted as a ceRNA to increase its parental gene UHRF1 expression, which obviously associated with immune infiltration in hepatocellular carcinoma and thymoma. However, evidence on the function of pseudogenes in tumor immunity remains sparse.
In the present study, we first identified a novel BC prognosis-associated pseudogene HLA-DPB2, of which the expression, prognosis, role, and corresponding regulatory mechanisms of HLA-DPB2 in BC have not been illuminated. HLA-DPB1, the parental gene of HLA-DPB2, is part of human leukocyte antigen (HLA) complex and generally expressed in antigen-presenting cells (28). Previous research studies reported that its parental gene, HLA-DPB1, can promote immunity and is essential for immunotherapy in leukemia (29, 30). Nevertheless, the expression and potential roles of HLA-DPB1 in solid tumors have not been reported, and the regulatory relationship between HLA-DPB2 and HLA-DPB1 in BC also has not been elucidated. Therefore, we conducted this study to analyze the expression and prognostic values of the pseudogene HLA-DPB2 and its parental gene HLA-DPB1 in BC by mining a series of databases. Then, we examined several potential mechanisms of HLA-DPB2 in BC, including the regulatory mechanism between HLA-DPB2 and its parental gene HLA-DPB1, performed functional enrichment analysis, and constructed a protein–protein interaction (PPI) network of the top 100 correlated genes. Finally, we investigated the correlation of HLA-DPB2/HLA-DPB1 expression with immune infiltration in BC.
Materials and Methods
Identification of Differentially Expressed Pseudogenes Related to Prognosis
The high-throughput sequencing data of pseudogenes in BC were directly obtained from dreamBase (http://rna.sysu.edu.cn/dreamBase/) (31). The thresholds for differential expression was set at |fold change| ≥ 2.0. Subsequently, the UALCAN (http://ualcan.path.uab.edu/analysis.html) (32) database was used to analyze the prognostic significance of these differentially expressed pseudogenes in BC. Finally, the screened pseudogenes related to prognosis were used in a follow-up analysis.
Gene Expression Analysis Using a Series of Databases
We first determined the HLA-DPB2 and HLA-DPB1 expression profiles using ONCOMINE (https://www.oncomine.org/resource/main) (33). We conducted the ONCOMINE analysis of tumor samples of 20 cancer types and normal samples and also performed a meta-analysis of datasets in BC. The cutoff was defined as: P-values of <0.0001, a fold change of >2.0, and the gene rank >10%. Then, the HLA-DPB2 and HLA-DPB1 expression levels were validated using data from the TIMER (https://cistrome.shinyapps.io/timer/) (34) and starBase (http://starbase.sysu.edu.cn/) (35) databases. Also, we investigated the association of HLA-DPB2 and HLA-DPB1 messenger RNA (mRNA) levels with the clinicopathological features of BC by using bc-GenExMiner v4.4 (http://bcgenex.centregauducheau.fr/) (36). Finally, the correlation of pseudogene HLA-DPB2 and its parental gene HLA-DPB1 was analyzed by using data from the starBase (35), UALCAN (32), bc-GenExMiner (36), and TIMER (34) databases. P-values of <0.05 were considered statistically significant.
Prognostic Analysis Using Data From the OncoLnc and Kaplan–Meier Plotter Databases
OncoLnc (http://www.oncolnc.org/) (37) was applied to evaluate the relationship between the gene expression of HLA-DPB2 or HLA-DPB1 and the overall survival (OS) of patients with BC. Kaplan–Meier Plotter (http://kmplot.com/analysis/) (38) was introduced to assess the associations of HLA-DPB2 or HLA-DPB1 expression with OS and relapse-free survival (RFS) in BC by using pan-cancer RNA-seq data and those of HLA-DPB1 expression with OS, RFS, distant metastases-free survival (DMFS), and post-progression survival (PPS) by using microarray data of BC. We then downloaded clinical data and RNA-seq data of HLA-DPB2 and HLA-DPB1 of BC patients from The Cancer Genome Atlas (39) database by the Genomic Data Commons website (https://portal.gdc.cancer.gov/) and performed Cox survival regression analysis to evaluate the dependent prognostic value of mRNA expression of HLA-DPB2 and HLA-DPB1 in terms of OS in BC patients. Log-rank P-values of <0.05 were considered statistically significant.
Pseudogene HLA-DPB2 Subcellular Localization Prediction
The sequence of HLA-DPB2 was extracted from the National Center for Biotechnology Information, and its subcellular localization was explored by its sequence using IncLocator (http://www.csbio.sjtu.edu.cn/bioinf/lncLocator/) (40), which can predict five subcellular localizations of lncRNAs, namely the cytoplasm, nucleus, cytosol, ribosome, and exosome.
Prediction of Candidate MicroRNAs of HLA-DPB2 and HLA-DPB1
First, we applied miRanda (http://www.microrna.org/) (41) to determine potential microRNAs (miRNAs) binding to the pseudogene HLA-DPB2 3′ untranslated region. Subsequently, potential binding miRNAs of HLA-DPB1 3′ untranslated region were predicted using TargetScanHuman7.2 (http://www.targetscan.org/) (42) and miRWalk (43). Then, we analyzed the potential miRNAs using Venn's diagram. The expression level of the candidate miRNA in BC was detected using dbDEMC2 (https://www.picb.ac.cn/dbDEMC/) (44). P-value < 0.05 was considered statistically significant.
Protein–Protein Interaction Network and Gene Ontology and Kyoto Encyclopedia of Genes and Genomes Enrichment Analysis
The top 100 correlated genes with the HLA-DPB2 and HLA-DPB1 were downloaded from UALCAN (32). The PPI network for these correlated genes was built using STRING v11.0 (https://string-db.org/) (45) and visualized by Cytoscape v3.8. Metascape (http://metascape.org/) (46) was introduced to conduct gene ontology (GO) and Kyoto Encyclopedia of Genes and Genomes pathway enrichment analysis of the top 100 genes from UALCAN that correlated with the HLA-DPB2 and HLA-DPB1 in BC. Only terms with p-values of <0.01, minimum count of 3, and enrichment factor of >1.5 were considered significant.
Correlation Analysis Between HLA-DPB2/HLA-DPB1 Expression and Immune Infiltration
The Spearman correlation of HLA-DPB2 or HLA-DPB1 expression with the immune infiltration levels of B cells, CD4+ T cells, CD8+ T cells, neutrophils, macrophages, and DCs in BC and its subtype was visualized using the “Gene” module in TIMER (34). The Spearman correlation of HLA-DPB2/HLA-DPB1 expression with the immune marker sets of tumor-infiltrating immune cells and expressions of PD-1, PD-L1, and cytotoxic T-lymphocyte-associated antigen-4 (CTLA-4) was visualized using the “Correlation” module. The gene markers of a tumor-infiltrating immune cell are referenced in prior studies (47, 48). The correlation was adjusted by tumor purity. Moreover, we used TISIDB (http://cis.hku.hk/TISIDB/) (49) to verify the correlation of HLA-DPB1 expression with the abundance of 28 TILs and expressions of PD-1, PD-L1, and CTLA-4 and to analyze the distribution of HLA-DPB1 expression across immune subtypes of BC.
Results
Screening for Differentially Expressed Pseudogenes Related With Prognosis in Breast Cancer
Firstly, we screened differentially expressed pseudogenes in BC using dreamBase. Based on the cutoff criteria, 264 upregulated and 368 downregulated pseudogenes were finally confirmed in BC (Supplementary Table 1). Subsequently, we determined the expression profiles and prognostic significance of these dysregulated pseudogenes in BC using UALCAN. Except that most gene symbols were not identified in UALCAN, 21 of 22 upregulated pseudogenes and 29 of 34 downregulated pseudogenes were lined with the analytical results from the dreamBase, as listed in Supplementary Table 2. Among these pseudogenes, only HLA-DPB2 expression was associated with the patient prognosis in BC (Supplementary Figure 1, P < 0.05). Therefore, HLA-DPB2 was selected as a candidate pseudogene for further analysis.
Overexpressions of HLA-DPB2 and HLA-DPB1 Predict Better Survival in Breast Cancer
The microarray data from the ONCOMINE database were applied to analyze the expression pattern of the pseudogene HLA-DPB2 and its parental gene HLA-DPB1 (Figure 1A). We further applied the ONCOMINE meta-analysis to evaluate the comprehensive expression level of HLA-DPB2 and HLA-DPB1 across three datasets (Figure 1B). The details were shown in Supplementary Figure 2; compared with normal breast tissues, the expression level of the pseudogene HLA-DPB2 significantly increased in invasive breast carcinoma (BRCA), invasive lobular breast carcinoma, and BRCA stroma (Supplementary Figures 2A–C, P < 0.0001), whereas mRNA expression of HLA-DPB1 obviously enhanced in BRCA, invasive ductal breast carcinoma, and medullary breast carcinoma (Supplementary Figures 2D–F, P < 0.0001). Next, the mRNA expression level of HLA-DPB2 and HLA-DPB1 was further measured using the TIMER (Figure 1C) and starBase (Figure 1D) databases, whose resources were based on The Cancer Genome Atlas database, consistent with the ONCOMINE analysis. Compared with normal tissues, HLA-DPB2 and HLA-DPB1 mRNA expressions were upregulated in the BC group (P < 0.01). We further explored the relationship between the pseudogene HLA-DPB2 and HLA-DPB1 expression and some clinicopathological features of BC using bc-GenExMiner. We discovered that high mRNA level of HLA-DPB2 was related to estrogen receptor-negative (ER-negative) (Figure 2A1, P < 0.0001), progesterone receptor-negative (Figure 2B1, P < 0.0001), P53-mutated (Figure 2D1, P < 0.0001), high Scarff–Bloom–Richardson (SBR) grade (Figure 2E1, P < 0.0001), and basal-like BC (Figures 2F1–H1, P < 0.0001), and that increased mRNA expression of HLA-DPB1 was associated with ER-negative and basal-like BC (Figure 2A2, P < 0.0001 and Figures 2F2–H2, P < 0.05). However, there was no significant correlation of HLA-DPB2 with human epidermal growth factor receptor-2 (HER2) status (Figure 2C1, P > 0.05) and HLA-DPB1 with PR status, HER2 status, P53 status, and SBR grade (Figures 2B2–E2, P > 0.05).
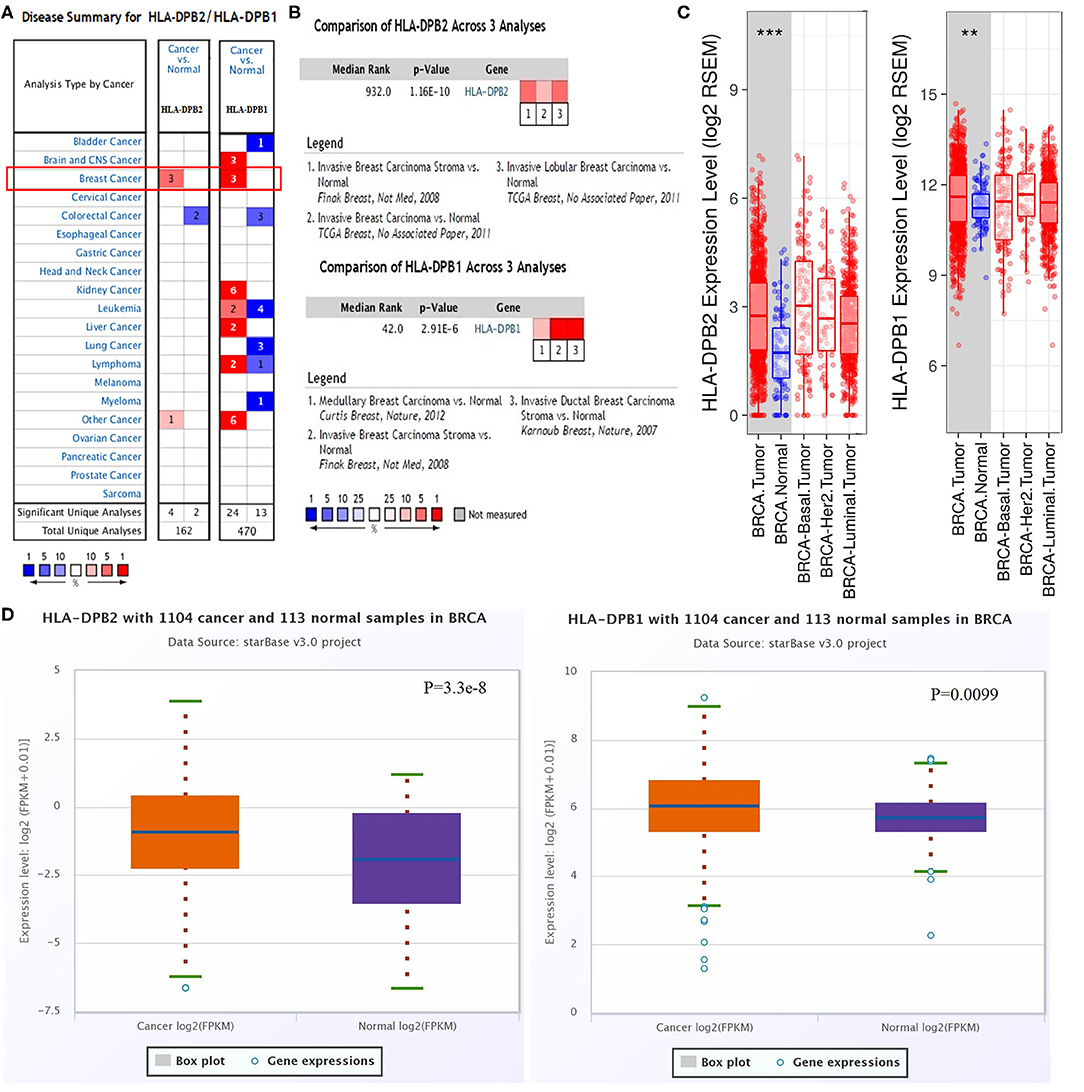
Figure 1. Pseudogene HLA-DPB2 and its parental gene HLA-DPB1 are upregulated in BC tissues. (A) Expression of HLA-DPB2 and HLA-DPB1 in different types of cancers by ONCOMINE analysis of cancer vs. normal samples; (B) meta-analysis of HLA-DPB2 and HLA-DPB1 expression in BC using ONCOMINE database; (C,D) the messenger RNA expression level of HLA-DPB2 and HLA-DPB1 in BC samples compared with normal tissues using TIMER and starBase databases, respectively. BC, breast cancer; **P < 0.01, ***P < 0.001.
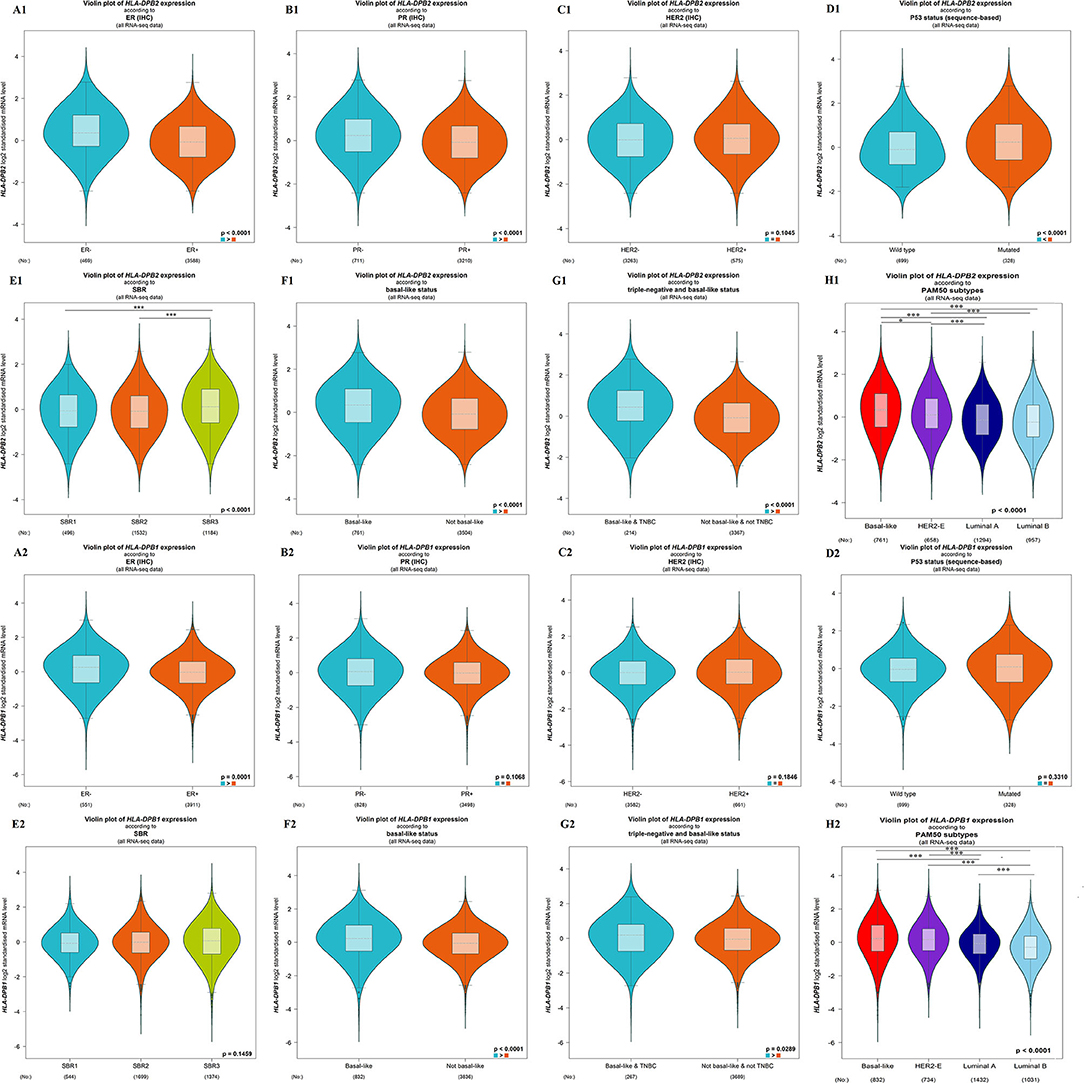
Figure 2. Association of mRNA expression of HLA-DPB2 and HLA-DPB1 with clinicopathological characteristics in BC patients using bc-GenExMiner database. (A1,A2) Association of HLA-DPB2 and HLA-DPB1 expression with estrogen receptor status; (B1,B2) Association of HLA-DPB2 and HLA-DPB1 expression with progesterone receptor status; (C1,C2) Association of HLA-DPB2 and HLA-DPB1 expression with human epidermal growth factor receptor-2 (HER2) status; (D1,D2) Association of HLA-DPB2 and HLA-DPB1 expression with P53 status; (E1,E2) Association of HLA-DPB2 and HLA-DPB1 expression with SBR grade; (F1,F2) Association of HLA-DPB2 and HLA-DPB1 expression with basal-like status; (G1,G2) Association of HLA-DPB2 and HLA-DPB1 expression with triple negative and basal-like status; (H1,H2) Association of HLA-DPB2 and HLA-DPB1 expression with PAM50 subtypes. Difference of mRNA expression was compared by Welch's tests and Dunnett-Tukey-Kramer's test. BC, breast cancer; *P < 0.05, ***P < 0.001.
Pseudogenes have been demonstrated to control their parental genes in several ways (50, 51). HLA-DPB1 is the parental gene of HLA-DPB2. The correlation of pseudogene HLA-DPB2 with HLA-DPB1 was first analyzed using data from several databases. As shown in Figure 3A, the dreamBase correlation analysis suggested a strongly positive relationship between HLA-DPB2 and HLA-DPB1 in BC (Figure 3A, Pearson's r = 0.4778, P < 0.001). Similar results were acquired using analytical data from the UALCAN (Figure 3B, Pearson's r = 0.56, P < 0.001), bc-GenExMiner (Figure 3C, Pearson's r = 0.60, P < 0.001), and TIMER databases (Figure 3D, Spearman's r = 0.634, P < 0.001).
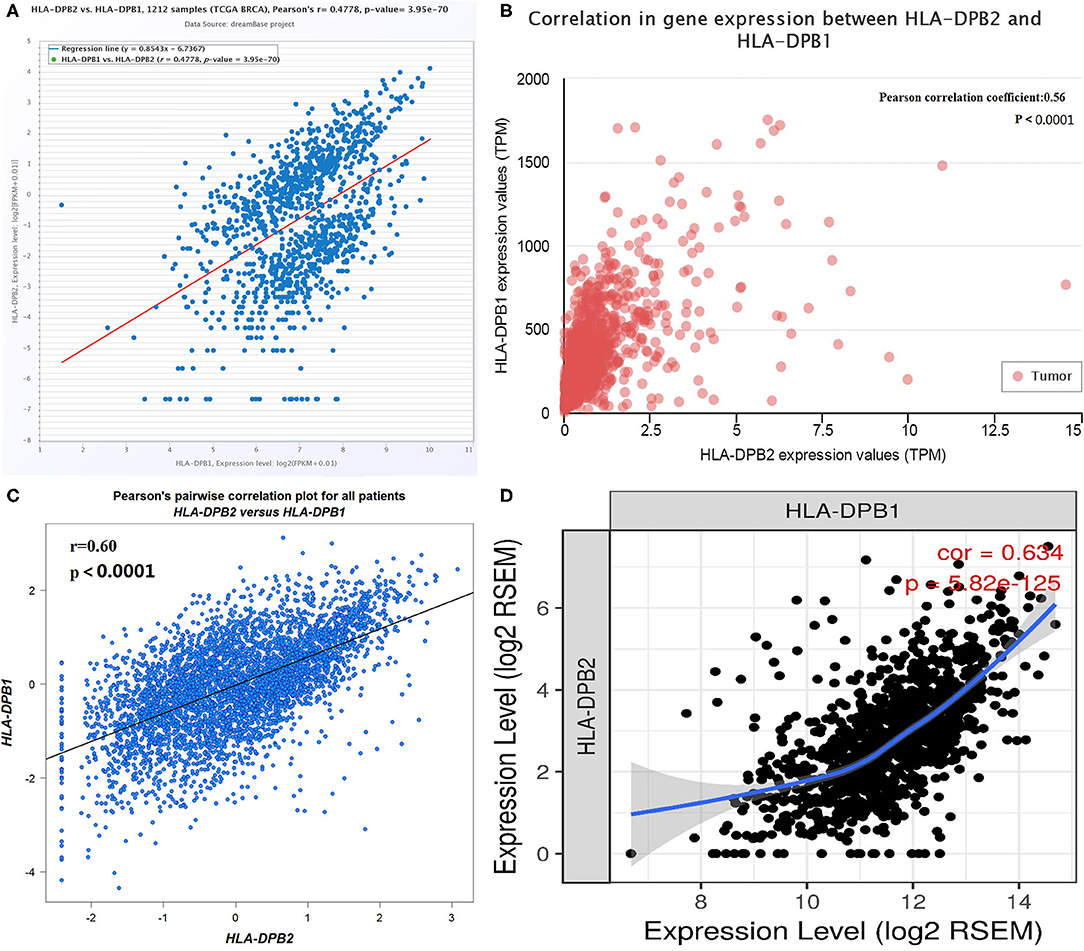
Figure 3. Correlation of HLA-DPB2 with its parental gene HLA-DPB1 in BC. (A–D) Expression association between HLA-DPB2 and HLA-DPB1 in BC analyzed using dreamBase, UALCAN, bc-GenExMiner, and TIMER database. BC, breast cancer.
Subsequently, the effect of HLA-DPB2 and HLA-DPB1 expression on patient survival of BC was evaluated using OncoLnc and Kaplan–Meier Plotter databases. The results suggested that high HLA-DPB2 and HLA-DPB1 expression levels were associated with better OS (HLA-DPB2, Figures 4A,B, P < 0.05; HLA-DPB1, Figures 4D,E and Supplementary Figures 3A1,A2, P < 0.05) in patients with BC. Moreover, high HLA-DPB1 expression also indicated longer RFS (Figure 4F and Supplementary Figures 3B1,B2, P < 0.01) and DMFS (Supplementary Figures 3C1,C2, P < 0.05). However, high HLA-DPB2 expression was not associated with RFS (Figure 4C, P > 0.05) of patients with BC. We then assess the independent prognostic value of mRNA expression of HLA-DPB2 and HLA-DPB1 in terms of OS in BC patients. In univariate analysis, we found that high mRNA expressions of HLA-DPB2 [hazard ratio (HR) = 0.74, 95% CI: 0.60–0.92, and P = 0.006] and HLA-DPB1 (HR = 0.995, 95% CI: 0.9918–0.9988, and P = 0.009) were related to longer OS of BC patients (Supplementary Table 3). Multivariate analysis also showed that increased mRNA expression expressions of HLA-DPB2 (HR = 0.66, 95% CI: 0.51–0.86, and P = 0.002) and HLA-DPB1 (HR = 0.996, 95% CI: 0.9928–0.9995, and P = 0.025) were independently associated with better OS of BC patients (Supplementary Table 3 and Supplementary Figure 4). Interestingly, the combination of HLA-DPB2 with HLA-DPB1 expressions was not associated with OS of BC patients (Supplementary Figure 7). These results suggested that mRNA expressions of HLA-DPB2 and HLA-DPB1 were independent prognostic factors for OS of BC patients and that HLA-DPB2 expression in BC may have an anticancer effect in BC by regulating the expression of its parental gene, HLA-DPB1.
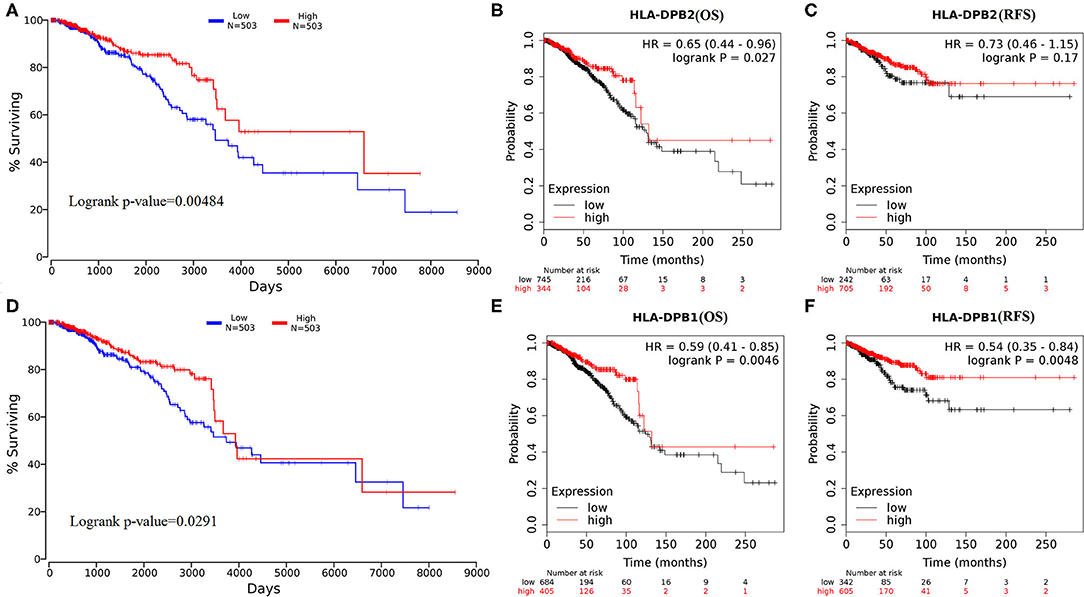
Figure 4. Overexpression of HLA-DPB2 and HLA-DPB1 is significantly associated with better prognosis in BC patients. (A,D) High expression of HLA-DPB2 or HLA-DPB1 indicates a better prognosis of BC by using OncoLnc database; (B,E) high expression of HLA-DPB2 or HLA-DPB1 indicates better OS in BC patients by Kaplan–Meier Plotter database; (C) high expression of HLA-DPB2 is not related with RFS of BC patients by Kaplan–Meier Plotter database; (F) high expression of HLA-DPB1 is related with RFS of BC patients by Kaplan–Meier Plotter database. BC, breast cancer; OS, overall survival; RFS, relapse-free survival.
HLA-DPB2 Acts as a Sponge of has-miR-370-3p to Control HLA-DPB1 Expression
Due to the high degree of sequence similarity between pseudogenes and their parent genes, pseudogenes are the “perfect bait” of their ancestral genes, crucially influencing on their parent genes by functioning as ceRNA for miRNAs or interacting with RNA-binding proteins (52), which depend on the subcellular localization of pseudogenes. To find out the underlying mechanisms of HLA-DPB2 in BC, we predicted the distribution of HLA-DPB2 using the IncLocator database and found that HLA-DPB2 was mainly distributed in the cytoplasm (Figure 5A), indicating that HLA-DPB2 regulates HLA-DPB1 expression more likely in the ceRNA manner. As depicted in Figure 5B, after taking the intersection of the prediction results from three databases (49 miRNAs of HLA-DPB2 from miRanda, 400 miRNAs of HLA-DPB1 from miRWalk, and 936 miRNAs of HLA-DPB1 from TargetScan), there were four miRNAs (has-miR-138-5p, has-miR-370-3p, has-miR-15b-5p, and has-miR-330-5p) as candidate miRNAs. We further analyzed their expression levels using the dbDEMC database. Compared with normal tissues, only has-miR-370-3p was downregulated (Figure 5C and Supplementary Table 4, P < 0.01), whereas the expressions of has-miR-138-5p, has-miR-15b-5p, and has-miR-330-5p were upregulated in BC tissues (Figure 5C). These results demonstrated that HLA-DPB2 might serve as ceRNA to improve HLA-DPB2 expression by sponging has-miR-370-3p (Figure 5D).
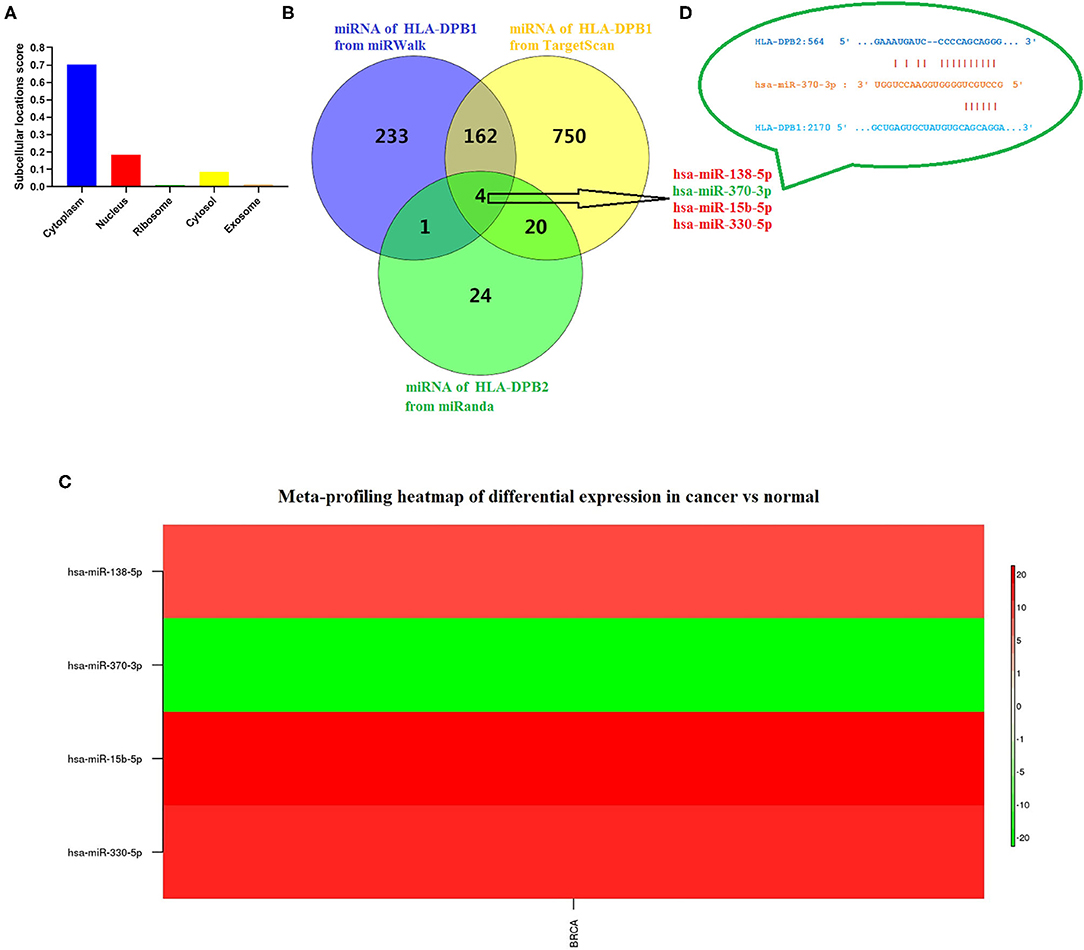
Figure 5. Has-miR-370-3p is identified as candidate miRNA for HLA-DPB2 and HLA-DPB1 in BC. (A) Prediction of subcellular localization of HLA-DPB2 using lncLocator; (B) bioinformatics analysis of four candidate miRNAs for HLA-DPB2 and HLA-DPB1; (C) meta-profiling of differential expression of four candidate miRNAs in BC tissues and normal tissues determined by dbDEMC 2; (D) base pairing between has-miR-370-3p and the putative target site in the HLA-DPB2 and HLA-DPB1 3′ untranslated region predicted by miRanda and TargetScanHuman 7.2, respectively. BC, breast cancer; miRNA, microRNA.
HLA-DPB2/HLA-DPB1 Axis Is Positively Associated With Immune Infiltration in Breast Cancer
Co-expression analysis can give us some important clues for studying the function of HLA-DPB2. To determine the underlying roles of the HLA-DPB2/HLA-DPB1 axis in BC, we obtained the top 100 co-expressed genes of HLA-DPB2 and HLA-DPB1 using the UALCAN database, as shown in Supplementary Table 5 and Supplementary Figure 5. There was a lot of overlap between the top 100 related genes of HLA-DPB2 and HLA-DPB1 (Figure 6B). Then, the STRING database was applied to build a PPI network for the top 100 correlated genes of HLA-DPB2 and HLA-DPB1 (Figure 6A). Moreover, we performed GO and Kyoto Encyclopedia of Genes and Genomes pathway enrichment analysis of these genes and observed that HLA-DPB2 and HLA-DPB1 were closely concerned with immune-related biological functions (Figure 6C). Thus, the HLA-DPB2/HLA-DPB1 axis may have something to do with the immune response against tumors. Therefore, we further investigated the association of HLA-DPB2 and HLA-DPB1 expression with immune infiltration abundances in BC and its subtype by using TIMER. The results showed that HLA-DPB2 and HLA-DPB1 expression levels have significantly positive associations with infiltrating abundances of B cells, CD8+ T cells, CD4+ T cells, neutrophils, and DCs in BRCA and its subtype (Figures 7A,B). Moreover, we further validated the relationship between the abundance of 28 TILs and HLA-DPB1 expression in BRCA using data from the TISIDB database (Figure 7C and Supplementary Figure 6). Following the TIMER data, high HLA-DPB1 expression strongly correlated with high infiltration abundances of activated CD8 T cells (Act CD8), effector memory CD8 T cells (Tem CD8), T-follicular helper cells (Tfh), type 1 T helper cells (Th 1), regulatory T cells (Treg), activated B cells (Act B), immature B cells (Imm B), natural killer (NK) cells, myeloid-derived suppressor cells, and macrophages in BRCA. Specially, we discovered that the mRNA level of HLA-DPB1 was obviously lower in the lymphocyte-depleted BC immune subtype (Figure 7D). These findings demonstrate that the HLA-DPB2/HLA-DPB1 axis may be involved in recruiting tumor-infiltrating immune cells into the tumor microenvironment.
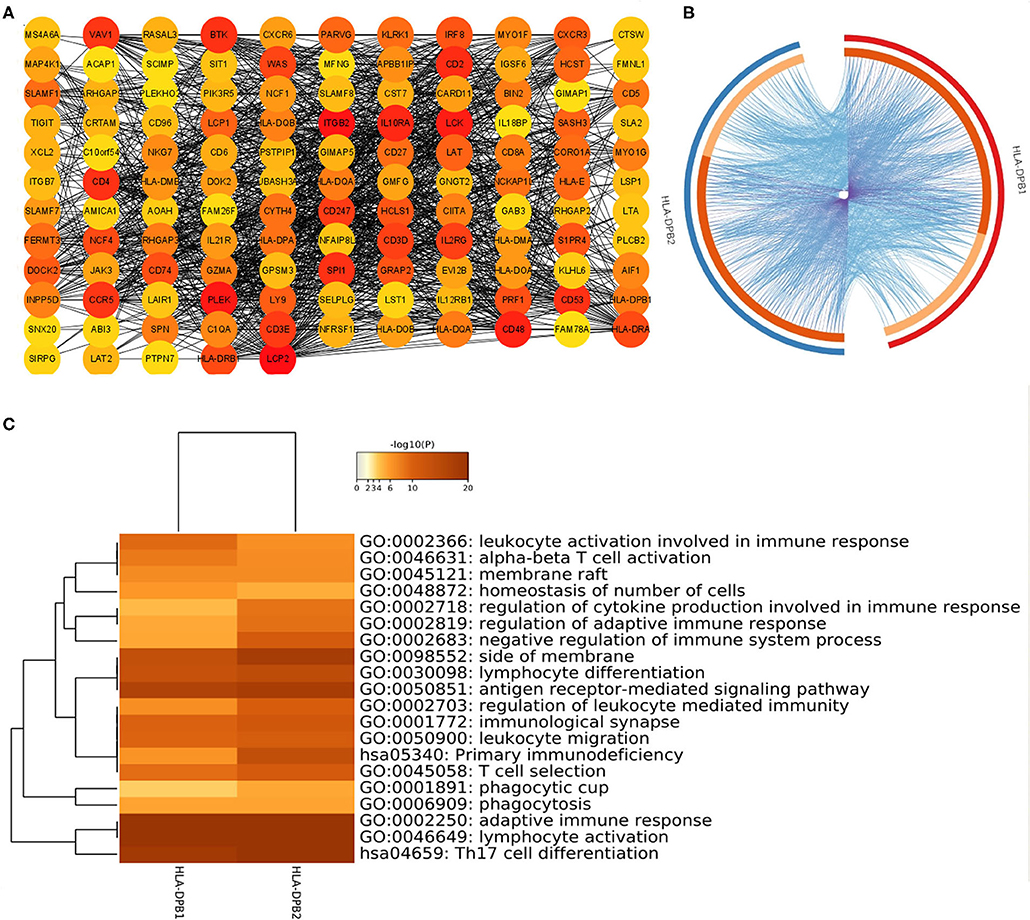
Figure 6. Construction of PPI network and GO enrichment analysis for top 100 co-expressed genes of HLA-DPB2/HLA-DPB1 in BC. (A) The PPI network of the top 100 co-expressed genes of HLA-DPB2 and HLA-DPB1 visualized by Cytoscape v3.8; (B) Circos overlap of HLA-DPB2 and HLA-DPB1 co-expression genes in BC. Purple lines link the same gene that is shared by two gene lists; blue lines link the different genes where they fall into the same ontology term; (C) the top 20 enrichment terms of the top 100 correlated genes of HLA-DPB2 and HLA-DPB1. BC, breast cancer; PPI, protein–protein interaction; GO, gene ontology.
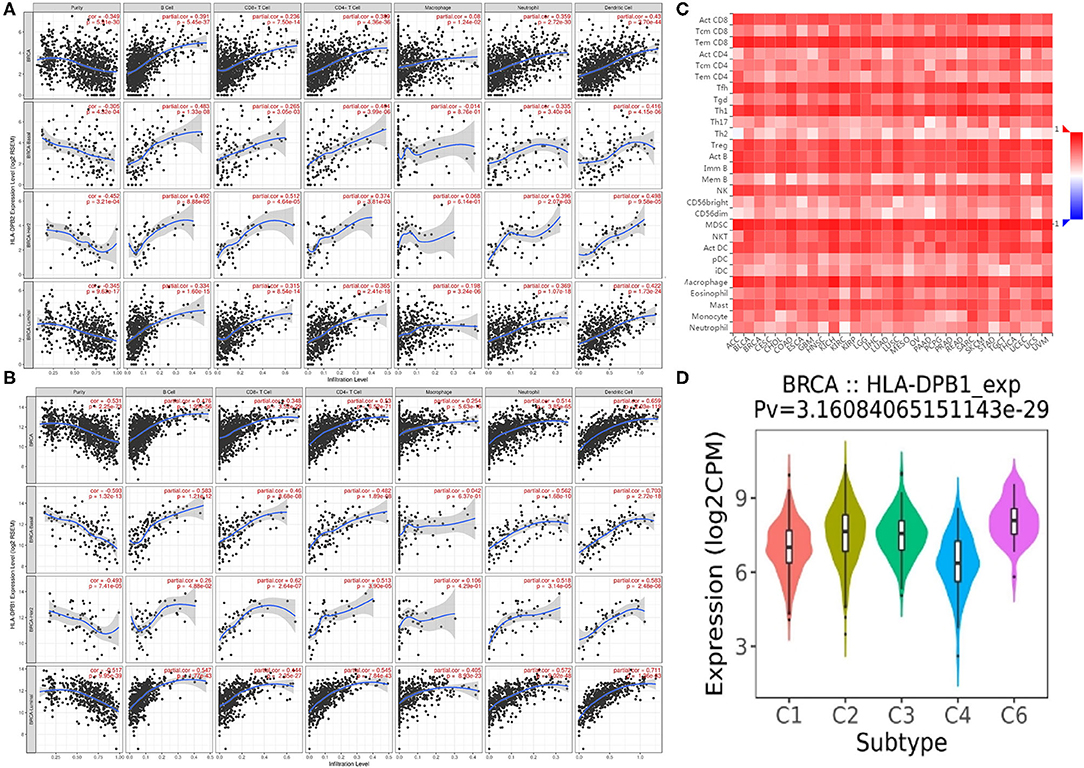
Figure 7. Correlation of HLA-DPB2/HLA-DPB1 expression with immune infiltration level in BC. (A,B) Spearman correlation of immune infiltration level with HLA-DPB2 and HLA-DPB1 in BC and its subtype using TIMER database; (C) the heatmap of correlation between the abundance of tumor-infiltrating lymphocytes (TILs) and HLA-DPB1 expression in BC using TISIDB database; (D) the distribution of HLA-DPB1 expression across immune subtypes using TISIDB database, the statistical significance of differential expression evaluated using Kruskal–Wallis test. BC, breast cancer; C1 (wound healing); C2 (IFN-gamma dominant); C3 (inflammatory); C4 (lymphocyte depleted); C6 (TGF-b dominant).
Correlation Analysis Between HLA-DPB1/HLA-DPB1 Expression and the Immune Biomarkers
To ascertain the relationship between HLA-DPB1/HLA-DPB1 and the various immune infiltrating cells, we further evaluated the associations between HLA-DPB1/HLA-DPB1 and biomarkers of tumor-infiltrating immune cells in BC and its subtype using data from the TIMER database. It was found that the expression levels of HLA-DPB2 and HLA-DPB1 were obviously associated with most immune biomarkers of diverse immune cells in BRCA, BRCA-luminal, and BRCA-basal (Table 1). Moreover, we discovered that the expression levels of most biomarkers of B cell, monocytes, NK cells, dendritic cells, T cells, CD8+ T cells, Th1, T-cell exhaustion, and TAMs have strong correlations with HLA-DPB2 and HLA-DPB1 expressions in BRCA and its subtype (Table 1). Specifically, we showed that IRF5 of M1 macrophage, CD11b and CCR7 of neutrophils, and IL21 of Tfh significantly correlated with the HLA-DPB2 and HLA-DPB1 expressions in BRCA and its subtype. The correlations of the HLA-DPB2 and HLA-DPB1 expressions with the markers of M2 macrophage, Th2, Th17, and Treg differed among the various BC subtypes. These results showed strong relationships between HLA-DPB2/ HLA-DPB1 and B cells, monocytes, NK cells, dendritic cells, T cells, CD8+ T cells, Th1, T-cell exhaustion, and TAM infiltration.
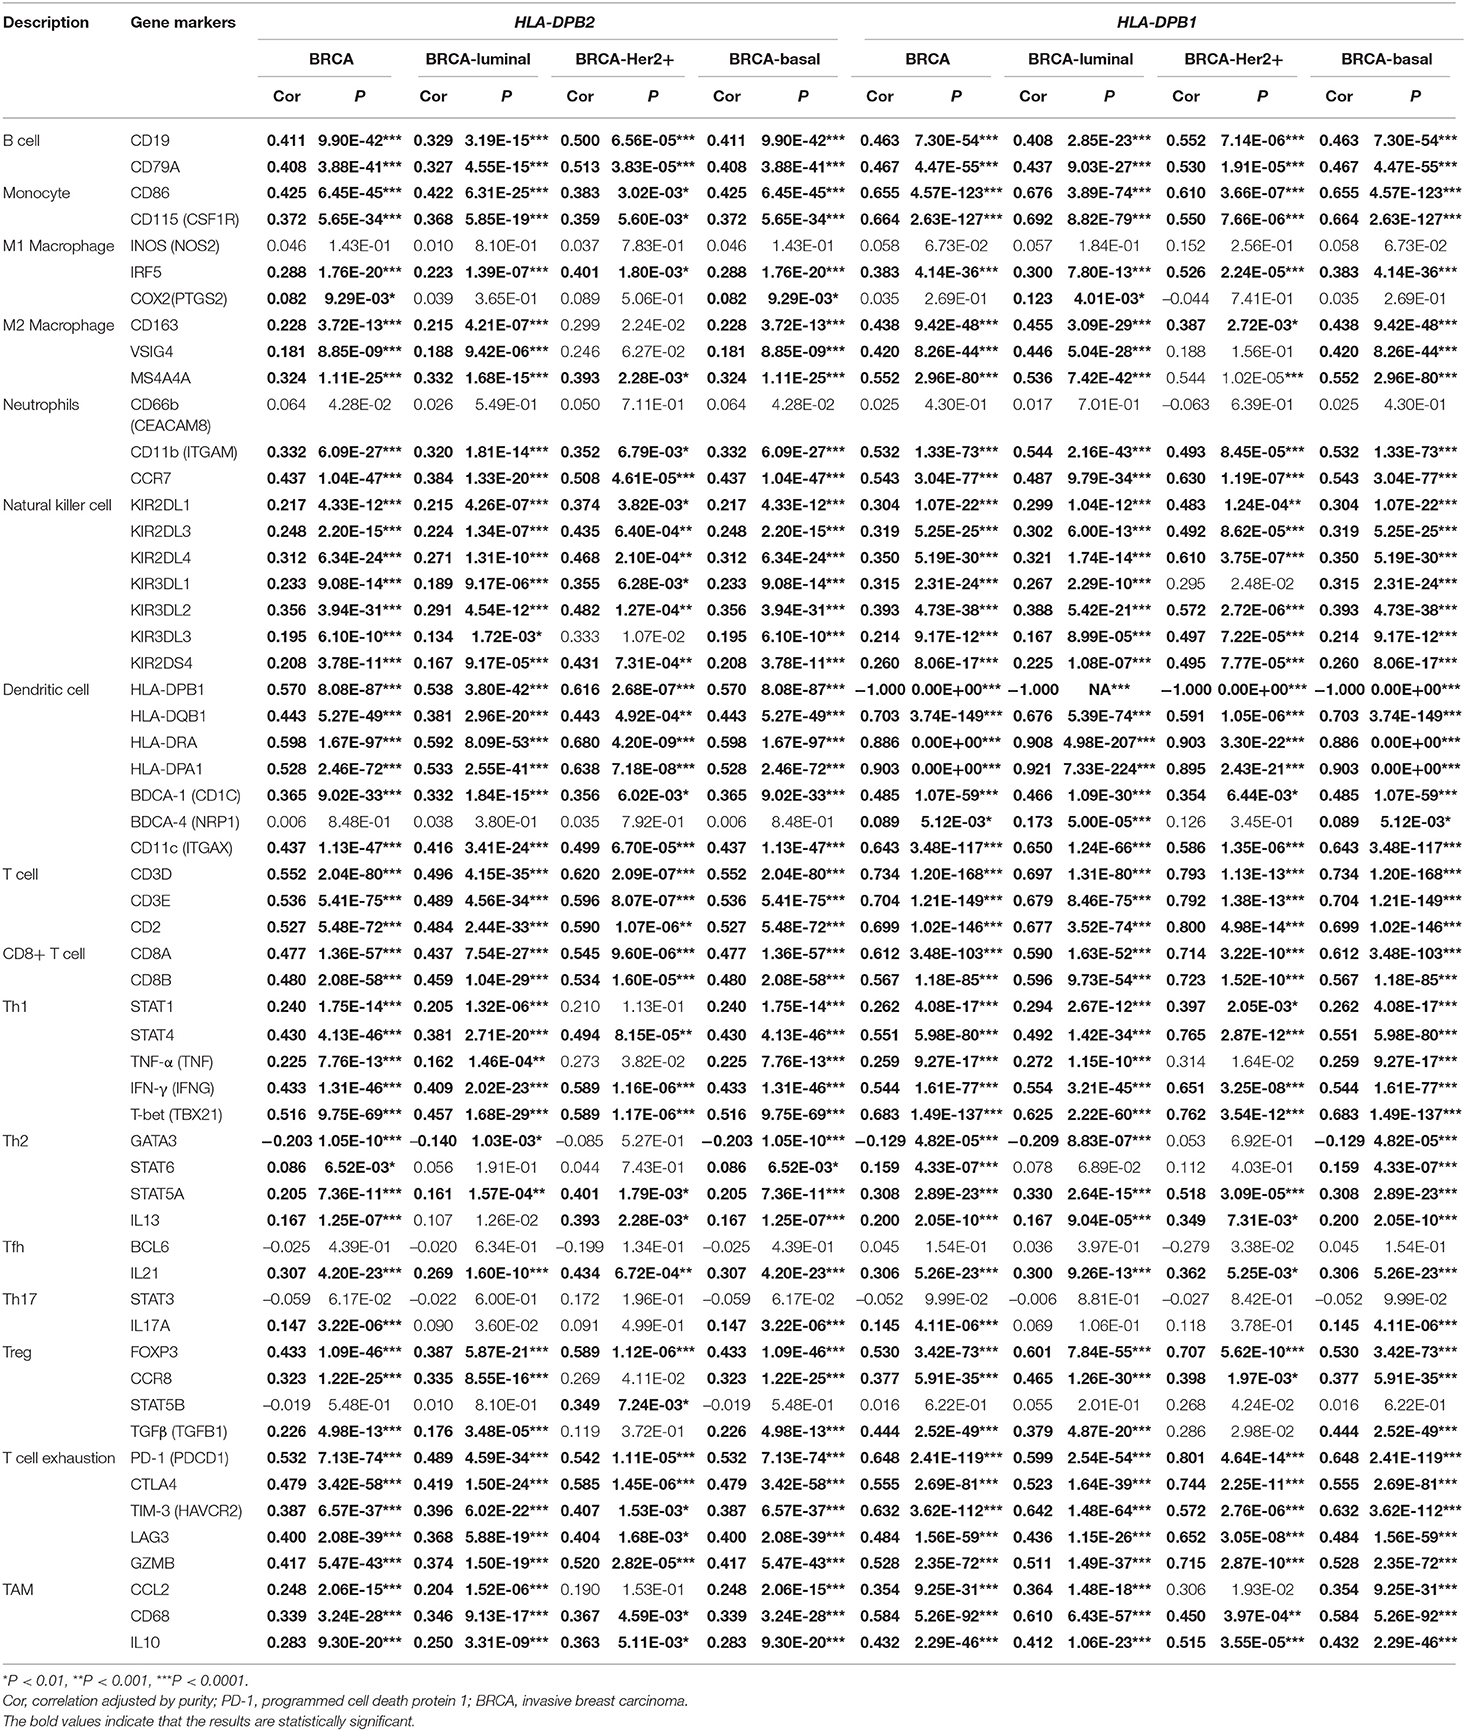
Table 1. Correlation analysis between HLA-DPB2/HLA-DPB1 and biomarkers of immune cells in BC and its subtype (TIMER).
Relationship Between HLA-DPB1/HLA-DPB1 and the Immune Checkpoints in Breast Cancer
PD-1/PD-L1 and CTLA-4 are essential molecules for tumors to escape from the immune system. Thus, we examined their relationships with HLA-DPB1/HLA-DPB1 expression in BRCA and its molecular subtypes using data from TIMER and found that increased HLA-DPB2 and HLA-DPB1 expressions were strongly related with high PD-1 and CTLA-4 expressions levels and weakly associated with high PD-L1 expression levels in BRCA and its subtypes (Figures 8A–D). Similarly to TIMER data analysis, the TISIDB data analysis also revealed that HLA-DPB1 expression positively correlated with the PD-1, PD-L1, and CTLA-4 expressions in BRCA (Figure 8E). Therefore, these results suggest that the HLA-DPB2/HLA-DPB1 axis might serve as a useful adjunct to ICIs in the treatment of BC.
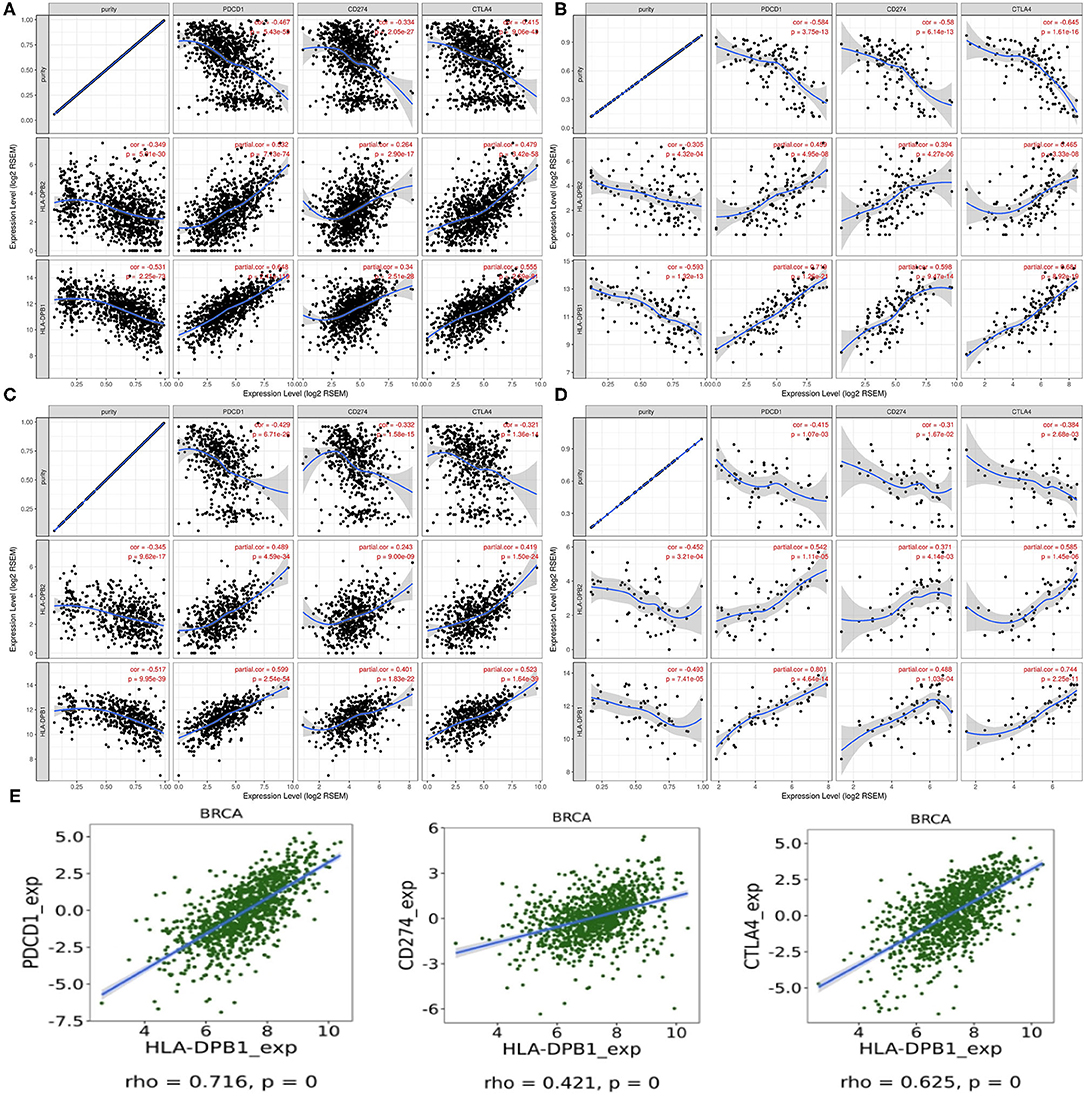
Figure 8. Correlation of HLA-DPB2/HLA-DPB1 expression with PD-1, PD-L1, and CTLA-4 expression in BC. (A–D) Spearman correlation of HLA-DPB2 and HLA-DPB1 expression with expression of PD-1, PD-L1, and CTLA-4 in BRCA, BRCA-basal, BRCA-luminal, and BRCA-HER2 using TIMER, respectively. The correlation adjusted by purity. (E) Spearman correlation of HLA-DPB1 expression with expression of PD-1, PD-L1, and CTLA-4 in BC using TISIDB database. BC, breast cancer; PD-1, programmed cell death protein 1; PD-L1, programmed cell death ligand 1; CTLA-4, cytotoxic T-lymphocyte-associated antigen-4; BRCA, invasive breast carcinoma.
Discussion
Previously, pseudogenes were deemed nonfunctional genes or junk genes. Nevertheless, an increasing number of research have demonstrated that pseudogenes can control functional genes through various mechanisms, thus regulating diverse physiological and pathological processes, including carcinogenesis (16, 51). Previous studies reported many tumor-related pseudogenes such as PTENP1 (53, 54), DUXAP10 (55), SUMO1P3 (56), PDIA3P (57), PTTG3P (24), and DUXAP8 (58). In the present study, we first identified 632 differentially expressed pseudogenes in BC based on data from the dreamBase database. Then, the UALCAN database was used to screen for differentially expressed pseudogenes associated with prognosis in BC for further explorations. HLA-DPB2 was selected because it had good prognostic value and unknown biological functions in BC based on our comprehensive analysis and literature review.
Firstly, it was found that the mRNA expression of HLA-DPB2 in BC tissues was obviously higher than that in normal breast tissues. Besides, we observed that high HLA-DPB2 expression level was associated with ER-negative, progesterone receptor-negative, p53-mutated status, higher Scarff–Bloom–Richardson grade, basal-like, and TNBC status, and better OS. Subsequently, we ascertained the relationship between the pseudogene HLA-DPB2 and its parent gene HLA-DPB1 and found that HLA-DPB1 expression strongly positively correlated with HLA-DPB2 expression. Compared with that in normal breast samples, the mRNA expression of HLA-DPB1 also increased in BC tissues, especially in the ER-negative, basal-like, and TNBC status. The survival analysis revealed that high HLA-DPB1 expression levels predicted better OS, RFS, and DMFS. Moreover, multivariate analysis indicated HLA-DPB2 and HLA-DPB1 were independent prognostic factors for longer OS of BC patients. The earlier discussed findings indicate that HLA-DPB2 and HLA-DPB1 take part in the tumor suppression processes of BC and that overexpression of HLA-DPB2 may predict a favorable prognosis by regulating the parent gene HLA-DPB1 expression. However, the mechanism thereby HLA-DPB2 regulates HLA-DPB1 expression remains unknown.
Previous studies demonstrated that as lncRNAs, pseudogenes could play their roles in DNA, RNA, and protein levels through various mechanisms involving antisense RNAs, interference RNAs, and ceRNAs or a combination with RNA-binding protein, to affect their parental genes or other gene expressions (17, 50). The subcellular localization of pseudogenes determines their regulatory mechanisms. We next predicted the subcellular localization of HLA-DPB2 using the IncLocator database and found that HLA-DPB2 was mainly distributed in the cytoplasm. Therefore, we speculated that HLA-DPB2 might be likely to regulate the expression of its parental gene through the ceRNA mechanism, and the prediction result suggested that HLA-DPB2 may act as an endogenous sponge for has-miR-370-3p to prevent it from binding to HLA-DPB1. We also observed that the has-miR-370-3p expression was clearly downregulated in the BC samples as compared with the normal samples. Functional enrichment analysis revealed that the top 100 correlated genes of HLA-DPB2 and HLA-DPB1 were mainly enriched in adaptive immune response (GO: 0002250), lymphocyte activation (GO: 0046649), Th17 cell differentiation (hsa04659), alpha-beta T cell activation (GO: 0046631), leukocyte activation involved in immune response (GO: 0002366), and regulation of leukocyte mediated immunity (GO: 0002703). Therefore, we supposed that the HLA-DPB2/HLA-DPB1 axis might exert its roles in BC by involving an immune response in the tumor microenvironment.
Some researchers have established that tumor-infiltrating immune cells can affect prognosis and the efficacies of chemoradiotherapy or immunotherapy (59–61). Thus, we examined the correlation of the HLA-DPB2/HLA-DPB1 axis with the immune infiltration levels in BC and its subtype using data from the TIMER and TISIDB databases. The results showed that the HLA-DPB2 and HLA-DPB1 expression levels have obviously positive associations with the infiltrating abundances of B cells, CD8+ T cells, CD4+ T cells, neutrophils, DCs, Tfh, Th1, macrophages, and NK cells, and with the expression of most biomarkers of B cells, monocytes, NK cells, DCs, T cells, CD8+ T cells, Th1, T-cell exhaustion, and TAMs in BC and its subtype. Specially, we observed the HLA-DPB1 expression obviously decreased in lymphocytes depleted of the BC immune subtype. Previous researchers found that the HLA-DPB1 protein binds with HLA-DPA1 and forms an antigen-binding complex, which can display foreign peptides to the immune system and initiate the body's immune response to attack the invading viruses or bacteria (62). HLA-DPB1 is generally expressed in B lymphocytes, DCs, and macrophages, which can explain the strong correlation of HLA-DPB1 expression with infiltrating levels of B cells, DCs, and macrophages in our results (63). It has been reported that HLA-DPB1-specific CD4+ T-cell clones can identify and dissolve myeloid and lymphoid malignanT cells expressing HLA-DP, which is following our results (29). Based on literature reports and our findings, we speculate that the HLA-DPB2/HLA-DPB1 axis may convert immunologically “cold” tumors to “hot” tumors and thus exert an anticancer role in BC by recruiting T lymphocytes and NK cells into the tumor microenvironment.
Also, the continuous anti-tumor effect of ICIs not only requires sufficient lymphocytes infiltrating in the tumor microenvironment but also depends on the high immune checkpoint expression levels of tumor cells (5, 13). Hence, we also analyzed the relationship between HLA-DPB2/HLA-DPB1 expression and immune checkpoints. Our results suggested that increased HLA-DPB1 and HLA-DPB1 expression levels strongly correlated with high PD-1 and CTLA-4 expression levels and weakly correlated with high PD-L1 expression levels in BC and its subtypes. These findings indicate that targeting the HLA-DPB2/HLA-DPB1 axis might serve as a useful adjunct to ICIs in the treatment of BC.
In summary, our results suggest that the pseudogene HLA-DPB2 may act as an endogenous RNA to adsorb has-miR-370-3p and upregulating its parental gene HLA-DPB1, thereby recruiting more TILs into the tumor microenvironment and increasing the expression of PD-1, PD-L1, and CTLA-4 in BC tissues, ultimately improving the prognosis of BC patients. More importantly, the present study may also provide a new clue to the direction of future immunotherapy for patients with BC and optimize the current immunotherapy. More laboratory research and animal trials are needed in the future to validate the findings of this study.
Data Availability Statement
All datasets generated for this study are included in the article/Supplementary Material.
Author Contributions
ZD and LL conceived and designed the study. LL, YZ, YW, PX, SY, YD, and DZ collected and analyzed the data. LL, YZ, JY, and MW wrote the original draft. SW, JL, FG, and ZD reviewed and edited the manuscript. All authors contributed to the article and approved the submitted version.
Funding
The authors would like to acknowledge the financial support for this work from the National Natural Science Foundation of China, grant/award number: 81471670.
Conflict of Interest
The authors declare that the research was conducted in the absence of any commercial or financial relationships that could be construed as a potential conflict of interest.
Acknowledgments
We thank all members of our study team for their whole-hearted cooperation.
Supplementary Material
The Supplementary Material for this article can be found online at: https://www.frontiersin.org/articles/10.3389/fonc.2020.01245/full#supplementary-material
Supplementary Figure 1. The mRNA expression level and prognostic value of HLA-DPB2 in TCGA samples of BC using UALCAN database. BC, breast cancer.
Supplementary Figure 2. Pseudogene HLA-DPB2 and its parental gene HLA-DPB1 expression in three datasets of ONCOMINE databases. (A–C) Compared to normal breast samples, the expression level of HLA-DPB2 is higher in Finak BC and two TCGA BC, respectively; (D–F) Compared to normal breast samples, the expression level of HLA-DPB1 is higher in Finak BC, Karnoub BC, and Curtis BC, respectively. BC, breast cancer.
Supplementary Figure 3. The prognostic value of HLA-DPB1 in BC patients using microarray data of Kaplan–Meier Plotter database. (A1–D1) The association of HLA-DPB1 (probe: 244485_at) with OS, RFS, DMFS, and PPS in BC patients, respectively; (A2–D2) High expression of HLA-DPB1 (probe: 201137_s_at) indicate better OS, RFS, DMFS, and PPS in BC patients, respectively. BC, breast cancer; OS, overall survival; RFS, relapse-free survival; DMFS, distant metastases-free survival; PPS, post-progression survival.
Supplementary Figure 4. The Forest plots of multivariate analysis of the correlation of expression of HLA-DPB2 and HLA-DPB1 with overall survival among BC patients. BC, breast cancer.
Supplementary Figure 5. The heatmap of top 100 correlated genes of HLA-DPB2 and HLA-DPB1 in BC obtained from UALCAN database. BC, breast cancer.
Supplementary Figure 6. Spearman correlation between abundance of 28 TILs and HLA-DPB1 expression in BC using TISIDB database. BC, breast cancer.
Supplementary Figure 7. The effect of combing HLA-DPB2 with HLA-DPB1 expression on patient overall survival of BC using RNA-seq data downloaded from TCGA. BC, breast cancer.
Supplementary Table 1. Dysregulated pseudogenes in BC downloaded from dreamBase.
Supplementary Table 2. Dysregulated pseudogenes in BC using UALCAN database.
Supplementary Table 3. Univariate analysis and multivariate analysis of the correlation of expression of HLA-DPB2 and HLA-DPB1 with overall survival among breast cancer patients. Bold values indicate P < 0.05,HR, hazard ratio; CI, confidence interval.
Supplementary Table 4. Significant changes of has-miR-370-3p expression between breast cancer and normal tissues (dbDEMC 2.0). adj, adjust.
Supplementary Table 5. The top 100 correlated genes of HLA-DPB2 and HLA-DPB1 obtained from UALCAN database. CC, correlation coefficient.
References
1. Ahmad A. Breast cancer statistics: recent trends. Adv Exp Med Biol. (2019) 1152:1–7. doi: 10.1007/978-3-030-20301-6_1
2. Azamjah N, Soltan-Zadeh Y, Zayeri F. Global trend of breast cancer mortality rate: a 25-year study. Asian Pac J Cancer Prev. (2019) 20:2015–20. doi: 10.31557/APJCP.2019.20.7.2015
3. Li N, Deng Y, Zhou L, Tian T, Yang S, Wu Y, et al. Global burden of breast cancer and attributable risk factors in 195 countries and territories, from 1990 to 2017: results from the Global Burden of Disease Study 2017. J Hematol Oncol. (2019) 12:140. doi: 10.1186/s13045-019-0828-0
4. Yang J, Li Y, Liu Q, Li L, Feng A, Wang T, et al. Brief introduction of medical database and data mining technology in big data era. J Evid Based Med. (2020) 13:57–69. doi: 10.1111/jebm.12373
5. Chae YK, Arya A, Iams W, Cruz MR, Chandra S, Choi J, et al. Current landscape and future of dual anti-CTLA4 and PD-1/PD-L1 blockade immunotherapy in cancer; lessons learned from clinical trials with melanoma and non-small cell lung cancer. (NSCLC). J Immunother Cancer. (2018) 6:39. doi: 10.1186/s40425-018-0349-3
6. Emens LA. Breast cancer immunotherapy: facts and hopes. Clin Cancer Res. (2018) 24:511–20. doi: 10.1158/1078-0432.CCR-16-3001
7. Ernst B, Anderson KS. Immunotherapy for the treatment of breast cancer. Curr Oncol Rep. (2015) 17:5. doi: 10.1007/s11912-014-0426-9
8. Schmid P, Adams S, Rugo HS, Schneeweiss A, Barrios CH, Iwata H, et al. Atezolizumab and Nab-Paclitaxel in advanced triple-negative breast cancer. N Engl J Med. (2018) 379:2108–21. doi: 10.1056/NEJMoa1809615
9. Tokumaru Y, Joyce D, Takabe K. Current status and limitations of immunotherapy for breast cancer. Surgery. (2019) 167:628–30. doi: 10.1016/j.surg.2019.09.018
10. Luen SJ, Savas P, Fox SB, Salgado R, Loi S. Tumour-infiltrating lymphocytes and the emerging role of immunotherapy in breast cancer. Pathology. (2017) 49:141–55. doi: 10.1016/j.pathol.2016.10.010
11. Badalamenti G, Fanale D, Incorvaia L, Barraco N, Listi A, Maragliano R, et al. Role of tumor-infiltrating lymphocytes in patients with solid tumors: can a drop dig a stone? Cell Immunol. (2019) 343:103753. doi: 10.1016/j.cellimm.2018.01.013
12. Lee N, Zakka LR, Mihm MCJr, Schatton T. Tumour-infiltrating lymphocytes in melanoma prognosis and cancer immunotherapy. Pathology. (2016) 48:177–87. doi: 10.1016/j.pathol.2015.12.006
13. Bence C, Hofman V, Chamorey E, Long-Mira E, Lassalle S, Albertini AF, et al. Association of combined PD-L1 expression and tumour-infiltrating lymphocyte features with survival and treatment outcomes in patients with metastatic melanoma. J Eur Acad Dermatol Venereol. (2019) 34:984–94. doi: 10.1111/jdv.16016
14. Spellman A, Tang SC. Immunotherapy for breast cancer: past, present, and future. Cancer Metastasis Rev. (2016) 35:525–46. doi: 10.1007/s10555-016-9654-9
15. Pink RC, Wicks K, Caley DP, Punch EK, Jacobs L, Carter DR. Pseudogenes: pseudo-functional or key regulators in health and disease? RNA. (2011) 17:792–8. doi: 10.1261/rna.2658311
16. Poliseno L, Marranci A, Pandolfi PP. Pseudogenes in human cancer. Front Med. (2015) 2:68. doi: 10.3389/fmed.2015.00068
17. Xiao-Jie L, Ai-Mei G, Li-Juan J, Jiang X. Pseudogene in cancer: real functions and promising signature. J Med Genet. (2015) 52:17–24. doi: 10.1136/jmedgenet-2014-102785
18. Yu G, Yao W, Gumireddy K, Li A, Wang J, Xiao W, et al. Pseudogene PTENP1 functions as a competing endogenous RNA to suppress clear-cell renal cell carcinoma progression. Mol Cancer Ther. (2014) 13:3086–97. doi: 10.1158/1535-7163.MCT-14-0245
19. Liu J, Xing Y, Xu L, Chen W, Cao W, Zhang C. Decreased expression of pseudogene PTENP1 promotes malignant behaviours and is associated with the poor survival of patients with HNSCC. Sci Rep. (2017) 7:41179. doi: 10.1038/srep41179
20. Qian YY, Li K, Liu QY, Liu ZS. Long non-coding RNA PTENP1 interacts with miR-193a-3p to suppress cell migration and invasion through the PTEN pathway in hepatocellular carcinoma. Oncotarget. (2017) 8:107859–69. doi: 10.18632/oncotarget.22305
21. Zhang R, Guo Y, Ma Z, Ma G, Xue Q, Li F, et al. Long non-coding RNA PTENP1 functions as a ceRNA to modulate PTEN level by decoying miR-106b and miR-93 in gastric cancer. Oncotarget. (2017) 8:26079–89. doi: 10.18632/oncotarget.15317
22. Gao X, Qin T, Mao J, Zhang J, Fan S, Lu Y, et al. PTENP1/miR-20a/PTEN axis contributes to breast cancer progression by regulating PTEN via PI3K/AKT pathway. J Exp Clin Cancer Res. (2019) 38:256. doi: 10.1186/s13046-019-1260-6
23. Lou W, Ding B, Fan W. High expression of pseudogene PTTG3P indicates a poor prognosis in human breast cancer. Mol Ther Oncolytics. (2019) 14:15–26. doi: 10.1016/j.omto.2019.03.006
24. Guo XC, Li L, Gao ZH, Zhou HW, Li J, Wang QQ. The long non-coding RNA PTTG3P promotes growth and metastasis of cervical cancer through PTTG1. Aging. (2019) 11:1333–41. doi: 10.18632/aging.101830
25. Weng W, Ni S, Wang Y, Xu M, Zhang Q, Yang Y, et al. PTTG3P promotes gastric tumour cell proliferation and invasion and is an indicator of poor prognosis. J Cell Mol Med. (2017) 21:3360–71. doi: 10.1111/jcmm.13239
26. Zhang Z, Shi Z. The pseudogene PTTG3P promotes cell migration and invasion in esophageal squamous cell carcinoma. Open Med. (2019) 14:516–22. doi: 10.1515/med-2019-0057
27. Yang J, Zhang Y, Song H. A disparate role of RP11-424C20.2/UHRF1 axis through control of tumor immune escape in liver hepatocellular carcinoma and thymoma. Aging. (2019) 11:6422–39. doi: 10.18632/aging.102197
28. Dijkstra JM, Yamaguchi T. Ancient features of the MHC class II presentation pathway, and a model for the possible origin of MHC molecules. Immunogenetics. (2019) 71:233–49. doi: 10.1007/s00251-018-1090-2
29. Rutten CE, van Luxemburg-Heijs SA, Griffioen M, Marijt EW, Jedema I, Heemskerk MH, et al. HLA-DP as specific target for cellular immunotherapy in HLA class II-expressing B-cell leukemia. Leukemia. (2008) 22:1387–94. doi: 10.1038/leu.2008.90
30. Herr W, Eichinger Y, Beshay J, Bloetz A, Vatter S, Mirbeth C, et al. HLA-DPB1 mismatch alleles represent powerful leukemia rejection antigens in CD4 T-cell immunotherapy after allogeneic stem-cell transplantation. Leukemia. (2017) 31:434–45. doi: 10.1038/leu.2016.210
31. Zheng LL, Zhou KR, Liu S, Zhang DY, Wang ZL, Chen ZR, et al. dreamBase: DNA modification, RNA regulation and protein binding of expressed pseudogenes in human health and disease. Nucleic Acids Res. (2018) 46:D85–91. doi: 10.1093/nar/gkx972
32. Chandrashekar DS, Bashel B, Balasubramanya SAH, Creighton CJ, Ponce-Rodriguez I, Chakravarthi B, et al. UALCAN: a portal for facilitating tumor subgroup gene expression and survival analyses. Neoplasia. (2017) 19:649–58. doi: 10.1016/j.neo.2017.05.002
33. Rhodes DR, Yu J, Shanker K, Deshpande N, Varambally R, Ghosh D, et al. ONCOMINE: a cancer microarray database and integrated data-mining platform. Neoplasia. (2004) 6:1–6. doi: 10.1016/S1476-5586(04)80047-2
34. Li T, Fan J, Wang B, Traugh N, Chen Q, Liu JS, et al. TIMER: a web server for comprehensive analysis of tumor-infiltrating immune cells. Cancer Res. (2017) 77:e108–10. doi: 10.1158/0008-5472.CAN-17-0307
35. Li JH, Liu S, Zhou H, Qu LH, Yang JH. starBase v2.0: decoding miRNA-ceRNA, miRNA-ncRNA and protein-RNA interaction networks from large-scale CLIP-Seq data. Nucleic Acids Res. (2014) 42:D92–7. doi: 10.1093/nar/gkt1248
36. Jezequel P, Frenel JS, Campion L, Guerin-Charbonnel C, Gouraud W, Ricolleau G, et al. bc-GenExMiner 3.0: new mining module computes breast cancer gene expression correlation analyses. Database. (2013) 2013:bas060. doi: 10.1093/database/bas060
37. Anaya J. OncoLnc: linking TCGA survival data to mRNAs, miRNAs, and lncRNAs. PeerJ Comp Sci. (2016) 2:e67. doi: 10.7717/peerj-cs.67
38. Gyorffy B, Surowiak P, Budczies J, Lanczky A. Online survival analysis software to assess the prognostic value of biomarkers using transcriptomic data in non-small-cell lung cancer. PLoS ONE. (2013) 8:e82241. doi: 10.1371/journal.pone.0082241
39. Tomczak K, Czerwinska P, Wiznerowicz M. The Cancer Genome Atlas. (TCGA): an immeasurable source of knowledge. Contemp Oncol. (2015) 19:A68–77. doi: 10.5114/wo.2014.47136
40. Cao Z, Pan X, Yang Y, Huang Y, Shen HB. The lncLocator: a subcellular localization predictor for long non-coding RNAs based on a stacked ensemble classifier. Bioinformatics. (2018) 34:2185–94. doi: 10.1093/bioinformatics/bty085
41. Betel D, Wilson M, Gabow A, Marks DS, Sander C. The microRNA.org resource: targets and expression. Nucleic Acids Res. (2008) 36:D149–53. doi: 10.1093/nar/gkm995
42. Agarwal V, Bell GW, Nam JW, Bartel DP. Predicting effective microRNA target sites in mammalian mRNAs. Elife. (2015) 4. doi: 10.7554/eLife.05005.028
43. Sticht C, De La Torre C, Parveen A, Gretz N. miRWalk: an online resource for prediction of microRNA binding sites. PLoS ONE. (2018) 13:e0206239. doi: 10.1371/journal.pone.0206239
44. Yang Z, Wu L, Wang A, Tang W, Zhao Y, Zhao H, et al. dbDEMC 2.0: updated database of differentially expressed miRNAs in human cancers. Nucleic Acids Res. (2017) 45:D812–8. doi: 10.1093/nar/gkw1079
45. Szklarczyk D, Gable AL, Lyon D, Junge A, Wyder S, Huerta-Cepas J, et al. STRING v11: protein-protein association networks with increased coverage, supporting functional discovery in genome-wide experimental datasets. Nucleic Acids Res. (2019) 47:D607–13. doi: 10.1093/nar/gky1131
46. Zhou Y, Zhou B, Pache L, Chang M, Khodabakhshi AH, Tanaseichuk O, et al. Metascape provides a biologist-oriented resource for the analysis of systems-level datasets. Nat Commun. (2019) 10:1523. doi: 10.1038/s41467-019-09234-6
47. Danaher P, Warren S, Dennis L, D'Amico L, White A, Disis ML, et al. Gene expression markers of tumor infiltrating leukocytes. J Immunother Cancer. (2017) 5:18. doi: 10.1186/s40425-017-0215-8
48. Siemers NO, Holloway JL, Chang H, Chasalow SD, Ross-MacDonald PB, Voliva CF, et al. Genome-wide association analysis identifies genetic correlates of immune infiltrates in solid tumors. PLoS ONE. (2017) 12:e0179726. doi: 10.1371/journal.pone.0179726
49. Ru B, Wong CN, Tong Y, Zhong JY, Zhong SSW, Wu WC, et al. TISIDB: an integrated repository portal for tumor–immune system interactions. Bioinformatics. (2019) 35:4200–2. doi: 10.1093/bioinformatics/btz210
50. An Y, Furber KL, Ji S. Pseudogenes regulate parental gene expression via ceRNA network. J Cell Mol Med. (2017) 21:185–92. doi: 10.1111/jcmm.12952
51. Hu X, Yang L, Mo YY. Role of pseudogenes in tumorigenesis. Cancers. (2018) 10:E256. doi: 10.3390/cancers10080256
52. Poliseno L, Salmena L, Zhang J, Carver B, Haveman WJ, Pandolfi PP. A coding-independent function of gene and pseudogene mRNAs regulates tumour biology. Nature. (2010) 465:1033–8. doi: 10.1038/nature09144
53. Haddadi N, Lin Y, Travis G, Simpson AM, Nassif NT, McGowan EM. PTEN/PTENP1: 'regulating the regulator of RTK-dependent PI3K/Akt signalling', new targets for cancer therapy. Mol Cancer. (2018) 17:37. doi: 10.1186/s12943-018-0803-3
54. Yndestad S, Austreid E, Skaftnesmo KO, Lonning PE, Eikesdal HP. Divergent activity of the pseudogene PTENP1 in ER-positive and negative breast cancer. Mol Cancer Res. (2018) 16:78–89. doi: 10.1158/1541-7786.MCR-17-0207
55. Wei CC, Nie FQ, Jiang LL, Chen QN, Chen ZY, Chen X, et al. The pseudogene DUXAP10 promotes an aggressive phenotype through binding with LSD1 and repressing LATS2 and RRAD in non small cell lung cancer. Oncotarget. (2017) 8:5233–46. doi: 10.18632/oncotarget.14125
56. Zhan Y, Liu Y, Wang C, Lin J, Chen M, Chen X, et al. Increased expression of SUMO1P3 predicts poor prognosis and promotes tumor growth and metastasis in bladder cancer. Oncotarget. (2016) 7:16038–48. doi: 10.18632/oncotarget.6946
57. Yang X, Yang B. lncRNA PDIA3P regulates cell proliferation and invasion in non-small cell lung cancer. Exp Ther Med. (2019) 18:3184–90. doi: 10.3892/etm.2019.7882
58. Sun M, Nie FQ, Zang C, Wang Y, Hou J, Wei C, et al. The pseudogene DUXAP8 promotes non-small-cell lung cancer cell proliferation and invasion by epigenetically silencing EGR1 and RHOB. Mol Ther. (2017) 25:739–51. doi: 10.1016/j.ymthe.2016.12.018
59. Fridman WH, Pages F, Sautes-Fridman C, Galon J. The immune contexture in human tumours: impact on clinical outcome. Nat Rev Cancer. (2012) 12:298–306. doi: 10.1038/nrc3245
60. Waniczek D, Lorenc Z, Snietura M, Wesecki M, Kopec A, Muc-Wierzgon M. Tumor-associated macrophages and regulatory T cells infiltration and the clinical outcome in colorectal cancer. Arch Immunol Ther Exp. (2017) 65:445–54. doi: 10.1007/s00005-017-0463-9
61. Zhang H, Liu H, Shen Z, Lin C, Wang X, Qin J, et al. Tumor-infiltrating neutrophils is prognostic and predictive for postoperative adjuvant chemotherapy benefit in patients with gastric cancer. Ann Surg. (2018) 267:311–8. doi: 10.1097/SLA.0000000000002058
62. Neefjes J, Jongsma ML, Paul P, Bakke O. Towards a systems understanding of MHC class I and MHC class II antigen presentation. Nat Rev Immunol. (2011) 11:823–36. doi: 10.1038/nri3084
Keywords: pseudogene, HLA-DPB2, HLA-DPB1, breast cancer, prognosis, immune infiltration
Citation: Lyu L, Yao J, Wang M, Zheng Y, Xu P, Wang S, Zhang D, Deng Y, Wu Y, Yang S, Lyu J, Guan F and Dai Z (2020) Overexpressed Pseudogene HLA-DPB2 Promotes Tumor Immune Infiltrates by Regulating HLA-DPB1 and Indicates a Better Prognosis in Breast Cancer. Front. Oncol. 10:1245. doi: 10.3389/fonc.2020.01245
Received: 22 March 2020; Accepted: 17 June 2020;
Published: 07 August 2020.
Edited by:
Xian-Tao Zeng, Zhongnan Hospital, Wuhan University, ChinaCopyright © 2020 Lyu, Yao, Wang, Zheng, Xu, Wang, Zhang, Deng, Wu, Yang, Lyu, Guan and Dai. This is an open-access article distributed under the terms of the Creative Commons Attribution License (CC BY). The use, distribution or reproduction in other forums is permitted, provided the original author(s) and the copyright owner(s) are credited and that the original publication in this journal is cited, in accordance with accepted academic practice. No use, distribution or reproduction is permitted which does not comply with these terms.
*Correspondence: Feng Guan, Z3VhbmZlbmdAbnd1LmVkdS5jbg==; Zhijun Dai, ZHpqMDkxMUAxMjYuY29t
†These authors have contributed equally to this work