 Rui Li
 Xiao Liu
 Xi-Jia Zhou
 Xiao Chen
 Jian-Ping Li
 Yun-Hong Yin
 Yi-Qing Qu
- 1Department of Pulmonary and Critical Care Medicine, Cheeloo College of Medicine, Qilu Hospital, Shandong University, Jinan, China
- 2Department of Respiratory Medicine, Tai'an City Central Hospital, Tai'an, China
- 3Department of Pulmonary and Critical Care Medicine, Qilu Hospital of Shandong University, Jinan, China
Immune-related genes (IRGs) play considerable roles in tumor immune microenvironment (IME). This research aimed to discover the differentially expressed immune-related genes (DEIRGs) based on the Cox predictive model to predict survival for lung squamous cell carcinoma (LUSC) through bioinformatics analysis. First of all, the differentially expressed genes (DEGs) were acquired based on The Cancer Genome Atlas (TCGA) using the limma R package, the DEIRGs were obtained from the ImmPort database, whereas the differentially expressed transcription factors (DETFs) were acquired from the Cistrome database. Thereafter, a TFs-mediated IRGs network was constructed to identify the candidate mechanisms for those DEIRGs in LUSC at molecular level. Moreover, Gene Ontology (GO), together with Kyoto Encyclopedia of Genes and Genomes (KEGG) pathway enrichment analysis, was conducted for exploring those functional enrichments for DEIRGs. Besides, univariate as well as multivariate Cox regression analysis was conducted for establishing a prediction model for DEIRGs biomarkers. In addition, the relationship between the prognostic model and immunocytes was further explored through immunocyte correlation analysis. In total, 3,599 DEGs, 223 DEIRGs, and 46 DETFs were obtained from LUSC tissues and adjacent non-carcinoma tissues. According to multivariate Cox regression analysis, 10 DEIRGs (including CALCB, GCGR, HTR3A, AMH, VGF, SEMA3B, NRTN, ENG, ACVRL1, and NR4A1) were retrieved to establish a prognostic model for LUSC. Immunocyte infiltration analysis showed that dendritic cells and neutrophils were positively correlated with IRGs, which possibly exerted an important part within the IME of LUSC. Our study identifies a prognostic model based on IRGs, which is then used to predict LUSC prognosis and analyze immunocyte infiltration. This may provide a novel insight for exploring the potential IRGs in the IME of LUSC.
Introduction
Lung cancer remains a leading factor leading to cancer-related deaths worldwide (1). Lung cancer is associated with a high mortality compared with that of breast cancer (BC), prostate cancer (PCa), colorectal cancer (CRC), and leukemia (1, 2). Lung squamous cell carcinoma (LUSC) occupies about 20–30% non-small cell lung cancer (NSCLC) cases, which causes an annual of 400,000 deaths around the world (3, 4). For TNM stage II LUSC cases, the survival at 5 years is 40%, while that for LUSC cases at pathological TNM stage IV is <5% (5). Moreover, the prognostic biomarkers that can be used in a prediction model for LUSC patients are still lacking (6, 7).
Recently, immunotherapy has been widely recognized to be the efficient therapy for many cancer types (8–11). Recently, Fan et al. had identified reliable markers for predicting the immunotherapy effect on non-small cell lung cancer (NSCLC) (12). Currently, immunotherapy has been considered as the potentially efficient therapy in tumor patients (12). Prat et al. estimated the correlations of immune-related genes (IRGs) expression profiles in squamous NSCLC (sqNSCLC) cases with advanced non-squamous NSCLC (non-sqNSCLC) after PD-1 blockade (13). Furthermore, several clinical studies promote tumor immunology development within LUSC (14). Recently, Li et al. used IRGPs to construct the personalized prognostic model to predict the prognosis for early non-sqNSCLC patients (15). However, the prognostic significance of IRGs and clinical relevance in LUSC have not been illustrated so far.
This study aimed to obtain the differentially expressed genes (DEGs), differentially expressed IRGs (DEIRGs), and differentially expressed TFs (DETFs) in LUSC, so as to establish a Cox prediction model based on the DEIRGs to predict the prognosis for LUSC. The regulatory network between DEIRGs and DETFs possibly exerts an important part in exploring the underlying mechanisms at molecular level. Meanwhile, correlation analysis of immunocytes and risk score also sheds new light on the tumor immune microenvironment (IME) status.
Materials and Methods
Clinical Patients and Data Acquisition
Transcriptome RNA-sequencing gene expression profiles were downloaded from TCGA GDC data portal (https://portal.gdc.cancer.gov/), including 502 LUSC as well as 49 non-LUSC tissue specimens. Additionally, FPKM data were downloaded for differential analysis. Meanwhile, IRGs were obtained using the Immunology Database and Analysis Portal (ImmPort) (http://www.immport.org/) (16). Besides, the cancer TF targets were downloaded from Cistrome Project (http://www.cistrome.org/) (17).
Differential Expression Analysis in LUSC
All transcriptome RNA-Seq data, IRGs, and cancer TF targets were differentially analyzed using the “limma R” package (http://www.bioconductor.org/packages/release/bioc/html/limma.html) (18), according to the thresholds of adjusted false discovery rate (FDR) P-value of <0.01 and absolute fold change (log2) of >2. DEIRGs were obtained from DEGs based on the ImmPort database, whereas DETFs were extracted from DEGs using the Cistrome database.
Functional Analyses for DEIRGs in the Context of LUSC
For exploring the functions among those DEIRGs in terms of their expression profiles, Gene Ontology (GO), together with Kyoto Encyclopedia of Genes and Genomes (KEGG) pathway enrichment analysis, was conducted on DEIRGs using the Database for Annotation, Visualization, and Integrated Discovery (DAVID: https://david.ncifcrf.gov/) (19). Upon GO analysis, a difference of P < 0.05 indicated statistical significance. Furthermore, the GOCircle as well as GOChord plotting was obtained using GOplot R package (https://cran.r-project.org/web/packages/GOplot/citation.html) (20). In addition, KEGG pathway enrichment analysis was performed using the “cluster profile R” package (http://www.bioconductor.org/packages/release/bioc/html/clusterProfiler.html) (21), and a difference of P < 0.05 indicated statistical significance. For additionally exploring the associations of DEIRGs with KEGG pathways, the Cytoscape software (version 3.6.1) was employed to construct the pathway-IRGs network for visual analysis.
Prognosis-Related DEIRGs and TFs Mediated IRGs Regulatory Network
We used the “survival R” package to perform the univariate Cox regression analysis to obtain prognosis-related DEIRGs in LUSC (P < 0.05). TFs stand for the significant molecules that can regulate gene expression level directly. Therefore, exploring the mechanism of TFs in the regulation of prognosis-related DEIRGs is of great necessity. The Cistrome Cancer database provides the regulatory interactions between TFs and transcriptomes from TCGA profiles (http://cistrome.org/CistromeCancer/CancerTarget/) (17). To further examine the molecular regulatory mechanisms of prognosis-related DEIRGs, a co-expression network between prognosis-related DEIRGs and DETFs was constructed, according to the thresholds of p-value filter of < 0.001 and standard coefficient filter of >0.4.
Construction of the DEIRGs-Based Prediction Model in LUSC
Univariate Cox regression analysis was carried out for obtaining those prognosis-related DEIRGs as the prognostic biomarkers for multivariate Cox regression analysis (P < 0.05). Then, LUSC cases were classified into low or high-risk group according to the median risk score value. The receiver operating characteristics (ROC) curve is based on the specificity and sensitivity of various critical values of continuous diagnostic tests judged according to the binary gold standard (22). To evaluate the specificity and sensitivity of the prognostic model, the ROC curve was performed to examine the signature of DEIRGs (low vs. high risk) on overall survival (OS). Moreover, the area under the ROC curve (AUC) values were determined for evaluating the prognostic model to reveal the prognostic biomarkers in LUSC, with values of 0.5–0.7 representing moderate, 0.7–0.9 representing better, and more than 0.9 representing superior values.
Correlation Analysis Between Clinical Features and DEIRGs in Prediction Model of LUSC
In order to further explore the correlations between DEIRGs in prediction model and clinical characteristics of LUSC, we used the “beeswarm” R package to analyze the correlations between clinical features (age, gender, pathological T stage, pathological N stage, pathological M stage, and pathological TNM stage) and the expression levels of 10 DEIRGs in the prediction model.
Infiltration of Immunocytes
Tumor Immune Estimation Resource (TIMER), an online database, is able to analyze and visualize the tumor-infiltrating immunocyte levels (23). It reanalyzes gene expression data of 10,897 TCGA samples from 32 types of cancers for identifying correlation between immunocyte infiltration and other characteristics, incorporating dendritic cells, neutrophils, macrophages, CD4 T cells, CD8 T cells, and B cells (https://zenodo.org/record/57669#.Xeezu9V5uMo).
Statistical Analysis
The “limma R” package in R software was used for differential analysis, whereas the “GOplot R” and “cluster profile R” packages were adopted for functional enrichment analysis. The prediction model was constructed and applied in univariate as well as multivariate Cox regression analysis. Besides, the “survival ROC R,” “survival R,” “risk Plot R,” and “beeswarm R” packages were adopted to validate the prognostic model in LUSC. The independent t-test was performed to validate the heterogeneities in clinical characteristics. A difference of P < 0.05 indicated statistical significance.
Results
DEGs, DEIRGs, and DETFs
In the present study, a total of 551 tissues were analyzed, which included 502 LUSC as well as 49 normal tissue specimens. According to the set thresholds (P < 0.01 and fold change of >2), 3,599 DEGs, 223 DEIRGs, and 46 DETFs were screened in LUSC as well as non-LUSC tissue specimens. In line with these criteria, we screened 2,598 up-regulated DEGs and 995 down-regulated ones, 110 up-regulated DEIRGs and 113 down-regulated ones, 31 up-regulated DETFs and 15 down-regulated ones. Among them, the top 50 DEGs, DEIRGs, and DETFs are shown in Tables 1–3, respectively. For exhibiting the distributions of all DEGs, DEIRGs, and DETFs at logFC and -log (FDR) dimensions, the volcano plots and heat maps were drawn (Figures 1A–F). Figure 2 presents the flow diagram of this research.
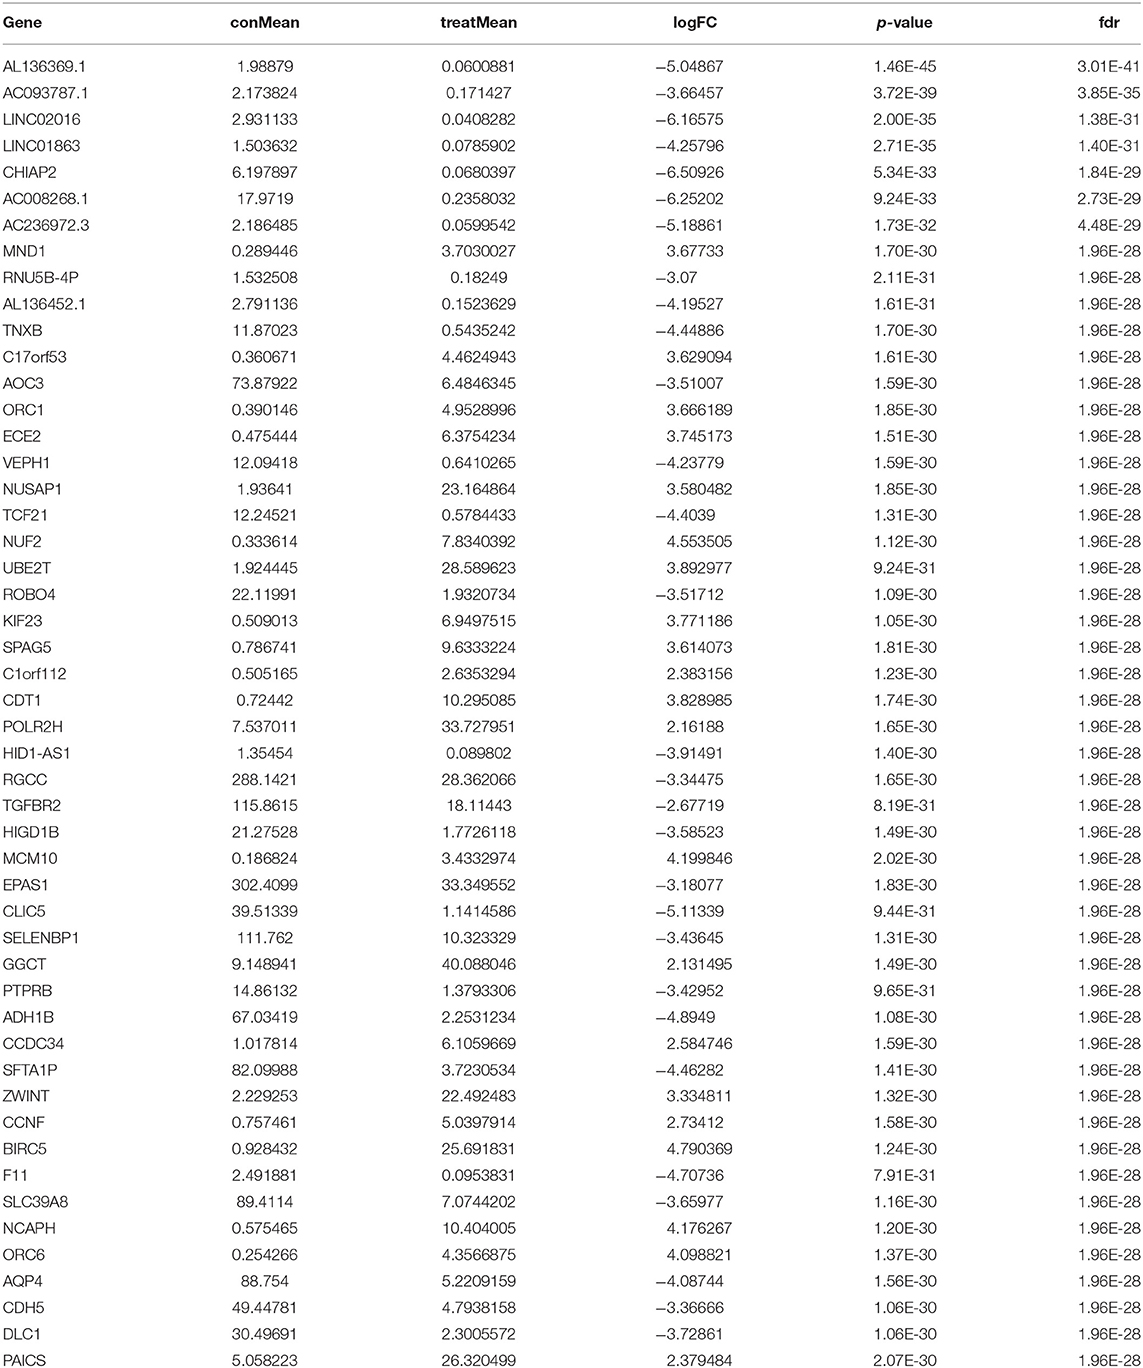
Table 1. The top 50 differentially expressed genes in LUSC.
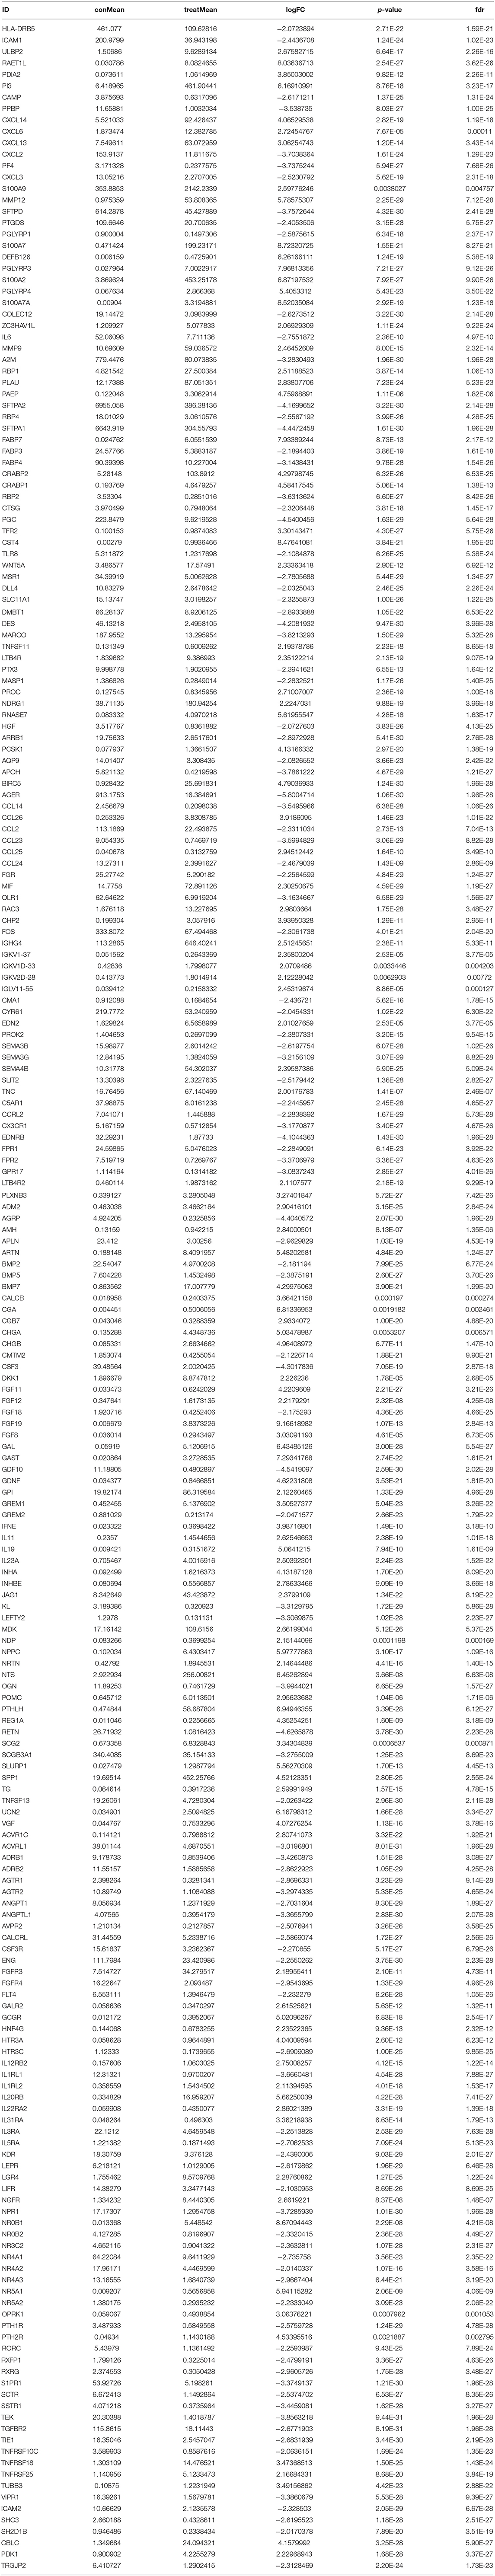
Table 2. Differentially expressed LUSC-specific IRGs.
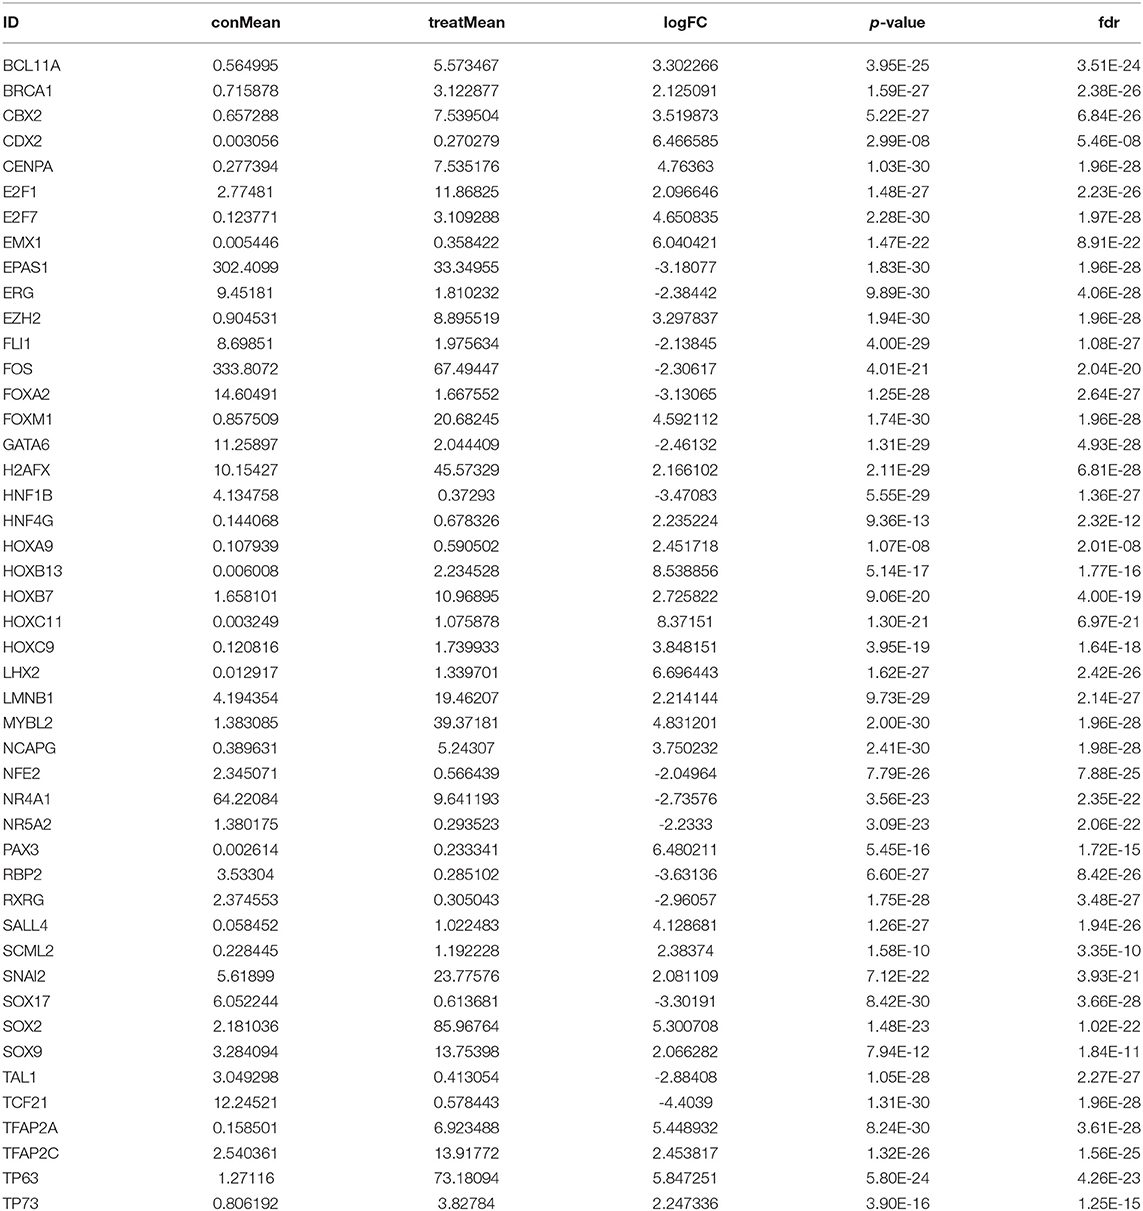
Table 3. Differentially expressed TFs.
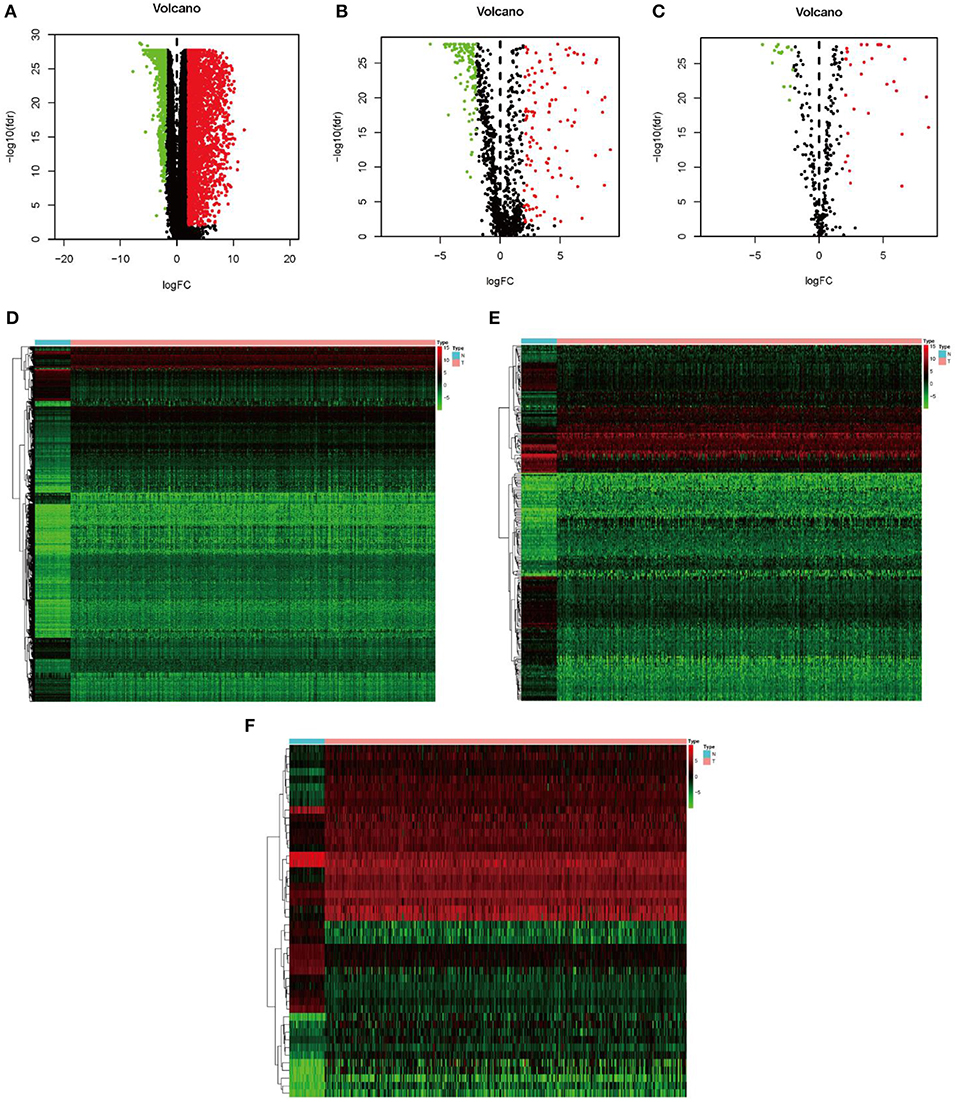
Figure 1. Identification of differential expression genes, IRGs and TFs in LUSC vs. normal tissues. (A–C) The volcano plot of differential expression genes, IRGs and TFs in LUSC vs. normal tissues. (D–F) The hierarchical clustering heat maps of differential expression genes, IRGs and TFs in LUSC vs. normal tissues.
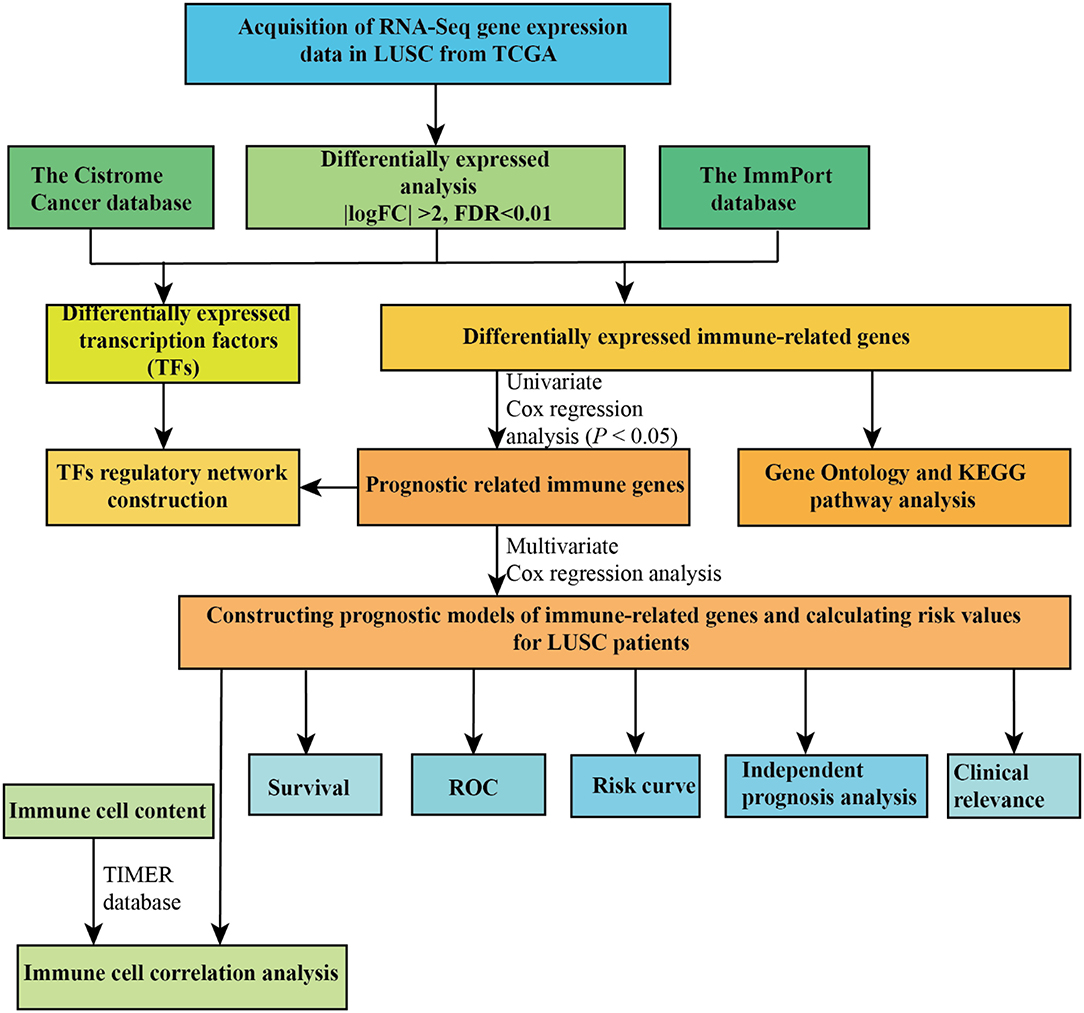
Figure 2. The flow diagram of the whole study.
Functional Analyses for DEIRGs
For explaining biological functions of DEIRGs in LUSC patients, functional enrichment analyses were conducted. According to GO analysis results, 5 GOs displayed significant difference (P < 0.05), among which, “GO: 0005576 extracellular region” was the most significant GO term (Figures 3A,C). Figure 3B shows the correlations between the top 30 statistically significant DEIRGs and corresponding GO terms. Furthermore, the “cluster profile R” package was used for KEGG pathway enrichment analyses. The dot plot shows the 10 most significant pathways with the highest enrichment levels of DERGs within the KEGG database (Figure 3D). In addition, the bar plot indicates the 12 most significant pathways with the highest enrichment levels of DEIRGs within the KEGG database (Figure 3E). Those 21 statistically significant pathways in the KEGG database were selected to construct the “pathway-DEIRGs” network (Figure 3F). The 21 statistically significant pathways in the KEGG database are shown in Table 4. A difference of P < 0.05 indicated statistical significance.
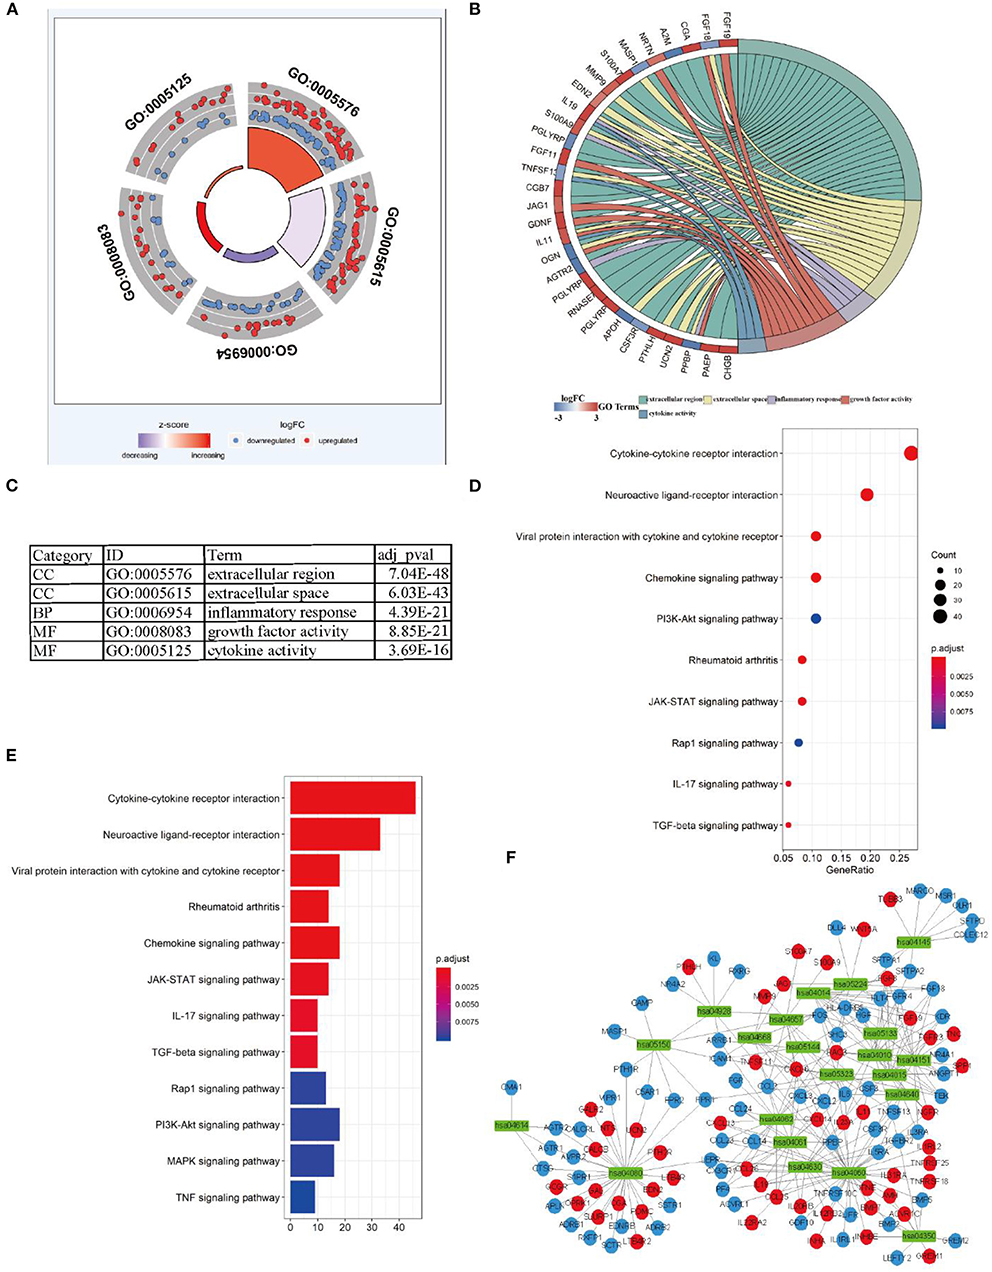
Figure 3. Functional enrichment analysis of differential expression IRGs in LUSC. (A) The outer circle shows the expression (logFC) of differential expression IRGs in each enriched GO terms: red dots which were on each Go terms indicated the up-regulation differential expression IRGs. Blue dots indicated the down-regulation differential expression IRGs. The inner-circle shows the prominence of GO terms (log10-adjusted P-values). (B) The circle represents the relationship between statistically top 30 differential expression IRGs and their GO terms. (C) The top five most significant GO terms and their annotations. (D) The top 10 pathways which were enriched in differential expression IRGs were showed in the dot plot. (E) The top 12 pathways which were enriched in differential expression IRGs were showed in the barplot. (F) the significantly statistically different 21 pathways were used Cytoscape software for constructing a pathway-IRG network with differential expression IRGs. The green rectangles indicate the pathways, the red circles indicate the up-regulation differential expression IRGs, the blue circles indicate the down-regulation differential expression IRGs.
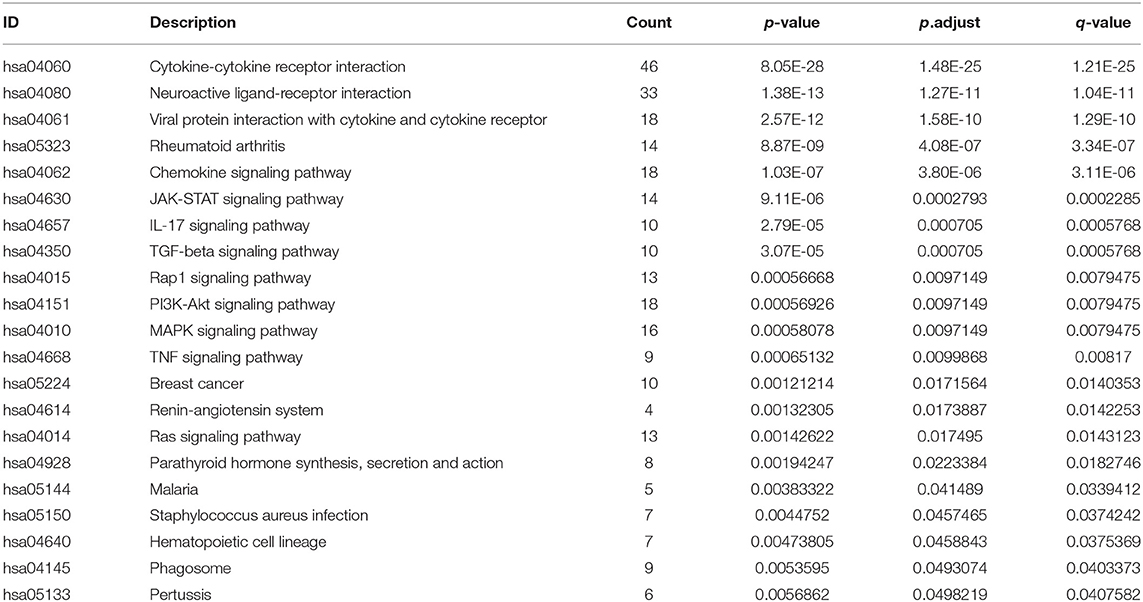
Table 4. KEGG Pathway analysis of differential expression IRGs in LUSC.
Univariate Cox Regression Analysis and Regulatory Network of Prognosis-Related DEIRGs and DETFs
Univariate Cox regression analysis was analyzed to identify prognosis-related DEIRGs in LUSC (P < 0.05). Then, 37 OS-related DEIRGs were identified, incorporating 31 high-risk DEIRGs and 6 low-risk DEIRGs (Figure 4A). For exploring the molecular mechanism of prognosis-related DEIRGs, we constructed the TFs-IRGs regulatory network. A total of 26 prognosis-related DEIRGs and 13 DETFs were shown in the network (Figure 4B). As shown in Figure 4B, CENPA had a negatively relationship with A2M, TIE1, ENG, and ACVRL1. ARRB1 had a negatively relationship with TP63, SNAI2. SOX2 had a negatively relationship with ICAM1 and TNFRSF10C. The coefficient filter >0.4 and the p-value filter < 0.001 were set as the threshold to indicate statistical significance. Table 5 shows the regulatory network between DETFs and prognosis-related DEIRGs in LUSC.
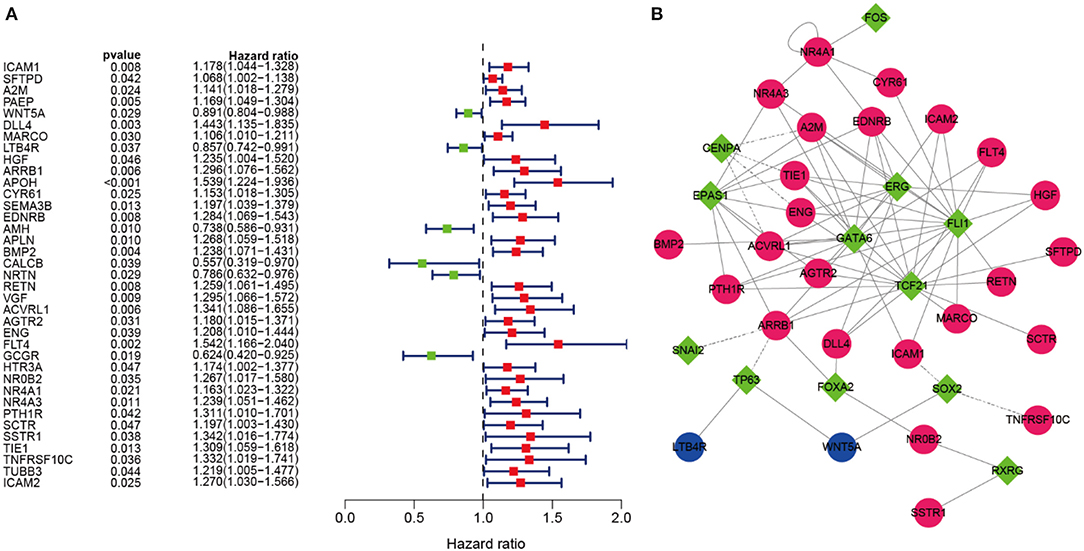
Figure 4. OS-related DEIRGs and TFs-IRGs regulatory network. (A) The forest map of OS-related DEIRGs in LUSC. Red and green dots indicate the high and low-risk, respectively. (B) Regulatory network between prognosis-related DEIRGs and DETFs in LUSC. The red and blue circles indicate the high and low-risk DEIRGs, respectively. The green diamonds indicate DETFs. Solid and dashed lines in the network showed that there is a positive and negative correlation between prognosis-related DEIRGs and DETFs.

Table 5. Correlation analysis between TFs and IRGs in LUSC.
Establishment of the 10 DEIRGs-Based Prediction Model in LUSC
The prognostic DEIRGs were screened through univariate Cox regression analyses in LUSC, including 37 OS-related DEIRGs (P < 0.05) (Figure 4A). Then, the 37 DEIRGs were selected to incorporate into multivariate Cox regression analysis, which suggested that 10 DEIRGs might serve to be the prognostic factors to independently predict LUSC prognosis. These 10 DEIRGs were finally screened for constructing the prediction model (Table 6). Besides, expression profiles of these 10 DEIRGs were then linearly combined to build up the prediction model in LUSC. The weighted relative coefficients in multiple Cox regression were shown below: survival riskscore value = (0.2141 × SEMA3B expression + (−0.2698) × AMH expression + (−0.6777) × CALCB expression + 0.1896 × NRTN expression + 0.3628 × VGF expression + 0.4248 × ACVRL1 expression + (−0.3538) × ENG expression + (−0.4009) × GCGR expression + 0.1985 × HTR3A expression + 0.1339 × NR4A1 expression). Multivariate Cox regression analyses are shown in Table 6. Based on the median riskscore value, 431 cases who had intact survival time and status data were classified as high-(n = 215) or low- (n = 216) risk group. According to survival analysis based on the prediction model with the 10 DEIRGs, LUSC cases of high-risk group were associated with notably poor prognosis compared with those of low-risk group (P = 0) (Figure 5A). To evaluate the specificity and sensitivity of the prognostic model, we performed the ROC curve, for which the AUC value was 0.709, illustrating that the DEIRGs-based prediction model achieved better accuracy in survival monitoring (Figure 5B). The riskscore curve and survival status data of both groups of patients are exhibited in Figures 5C,D, respectively. As shown in Figure 5E, the expression of 10 DEIRGs was profiled.
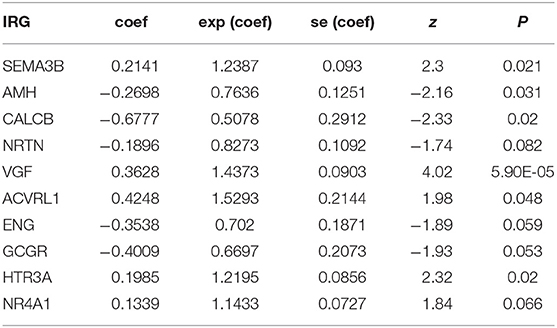
Table 6. Multivariate Cox regression analyses of 10 DEIRGs in risk models in LUSC.
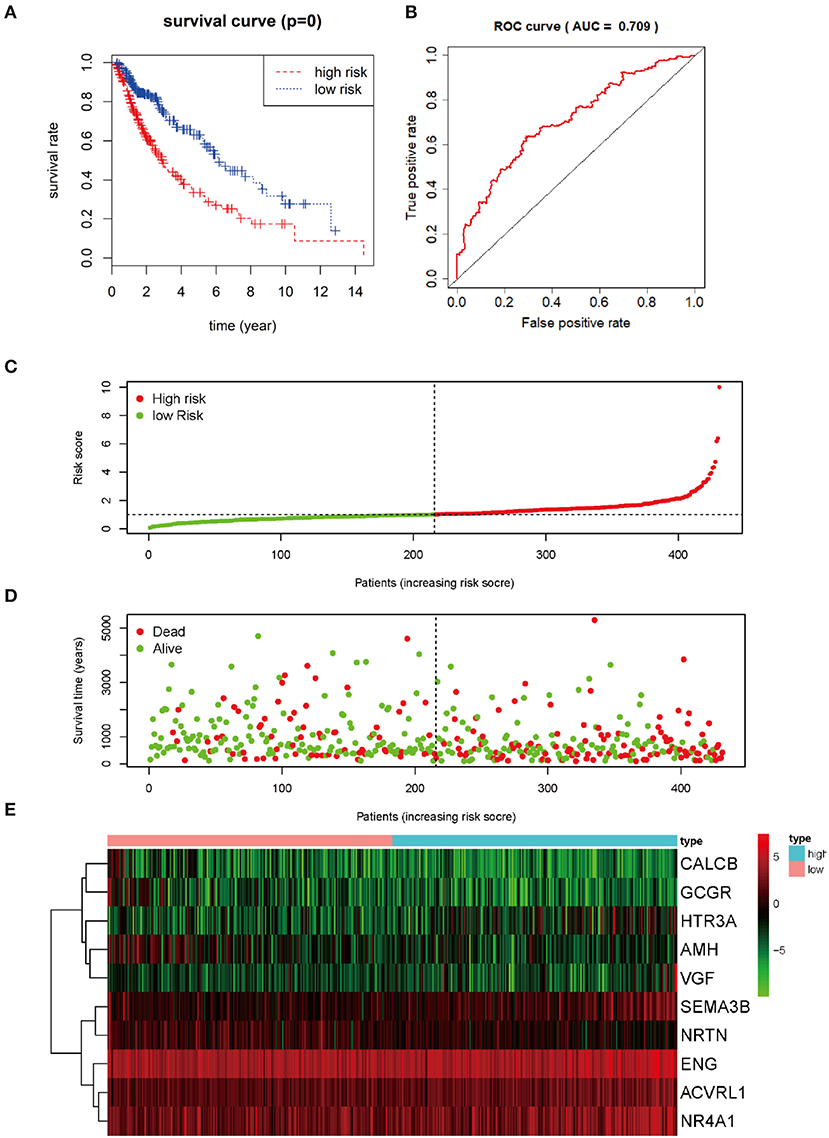
Figure 5. Prognosis value of 10 differential expression IRGs in LUSC patients. (A) Kaplan-Meier curve analysis for OS (overall survival) in LUSC patients using the 10 differential expression IRGs signature. (B) ROC curve analysis of the prognostic 10 differential expressions IRGs signature. (C) The risk score analysis of prognostic 10 differential expressions IRGs signature in LUSC high-risk group and low-risk group. (D) The survival status analysis of prognostic 10 differential expressions IRGs signature in LUSC high-risk group and low-risk group. (E) A risk heat-map constructed from 10 differential expression IRGs from 431 LUSC patients.
Independent Prognosis Analysis
The prognostic IRGs were screened for predicting the prognosis for LUSC cases. Eventually, altogether 37 DEIRGs showed significant correlation with overall survival (OS) (P < 0.05) (Figure 6A). Meanwhile, univariate independent prognostic analysis showed that, pathological M stage and the riskscore were related to OS, and the difference was of statistical significance (P < 0.001). Moreover, the multivariate independent prognostic analysis showed that, pathological M stage and the riskscore might serve as the independent prognostic factors to predict the survival for LUSC (Table 7; Figure 6B).
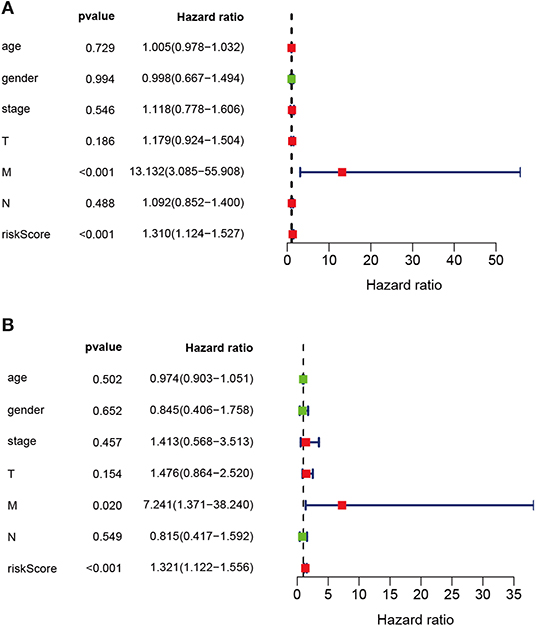
Figure 6. Univariate and multivariate independent prognostic analysis in LUSC. (A) Univariate independent prognostic analysis forest map of the prognostic immune-related genes model and LUSC clinicopathological characteristics. (B) Multivariate independent prognostic analysis forest map of prognostic immune-related genes model and LUSC clinicopathological characteristics. The red dots in the forest map shows that the clinical characteristic is a high-risk factor. The green dots in the forest map shows that the clinical characteristic is a low-risk factor.
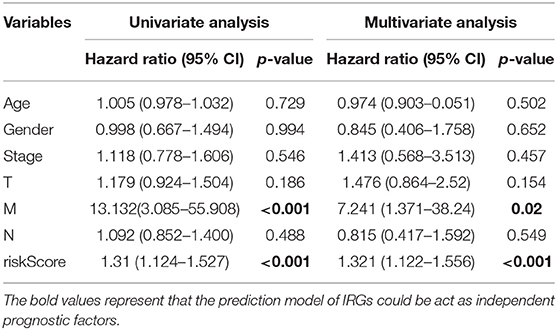
Table 7. Univariate and multivariate independent prognostic analysis of LUSC clinical characteristics based on prediction model.
Relationships Between Differential IRGs in Prediction Models and Clinical Features in LUSC
Relationships between DEIRGs in risk model and clinical characteristics, including gender, age, pathological classification, pathological T stage, pathological N stage, and pathological M stage, were analyzed (Table 8). As observed from Figure 7, the expression levels of AMH, CALCB, ACVRL1 and NR4A1 were significantly different in LUSC at pathological I-II stage compared with those at III-IV stage (P < 0.05) (Figures 7A–D). The expression levels of AMH, CALCB, GCGR, and NR4A1 were significantly different in LUSC at pathological T1-T2 stage compared with those at T3-T4 stage (P < 0.05) (Figures 7E–H). The expression levels of SEMA3B, AMH, CALCB, and GCGR were significantly different in LUSC at pathological M0 stage relative to those at M1 stage (P < 0.05) (Figures 7I–L). The expression of VGF was conspicuously different in LUSC at pathological N0 stage relative to that at N1-N3 stage (P = 0.005) (Figure 7M).
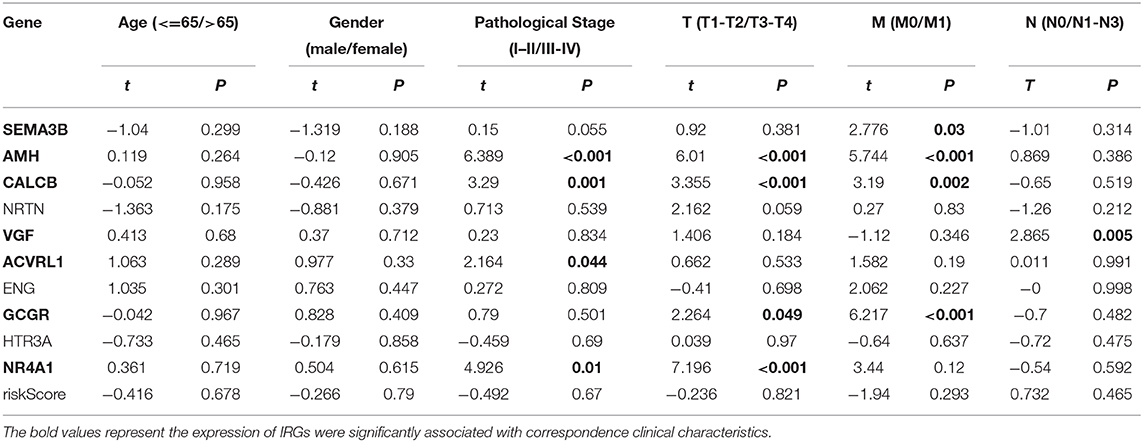
Table 8. Relationships between the expression of IRGs in risk models and the clinical characteristics in LUSC.
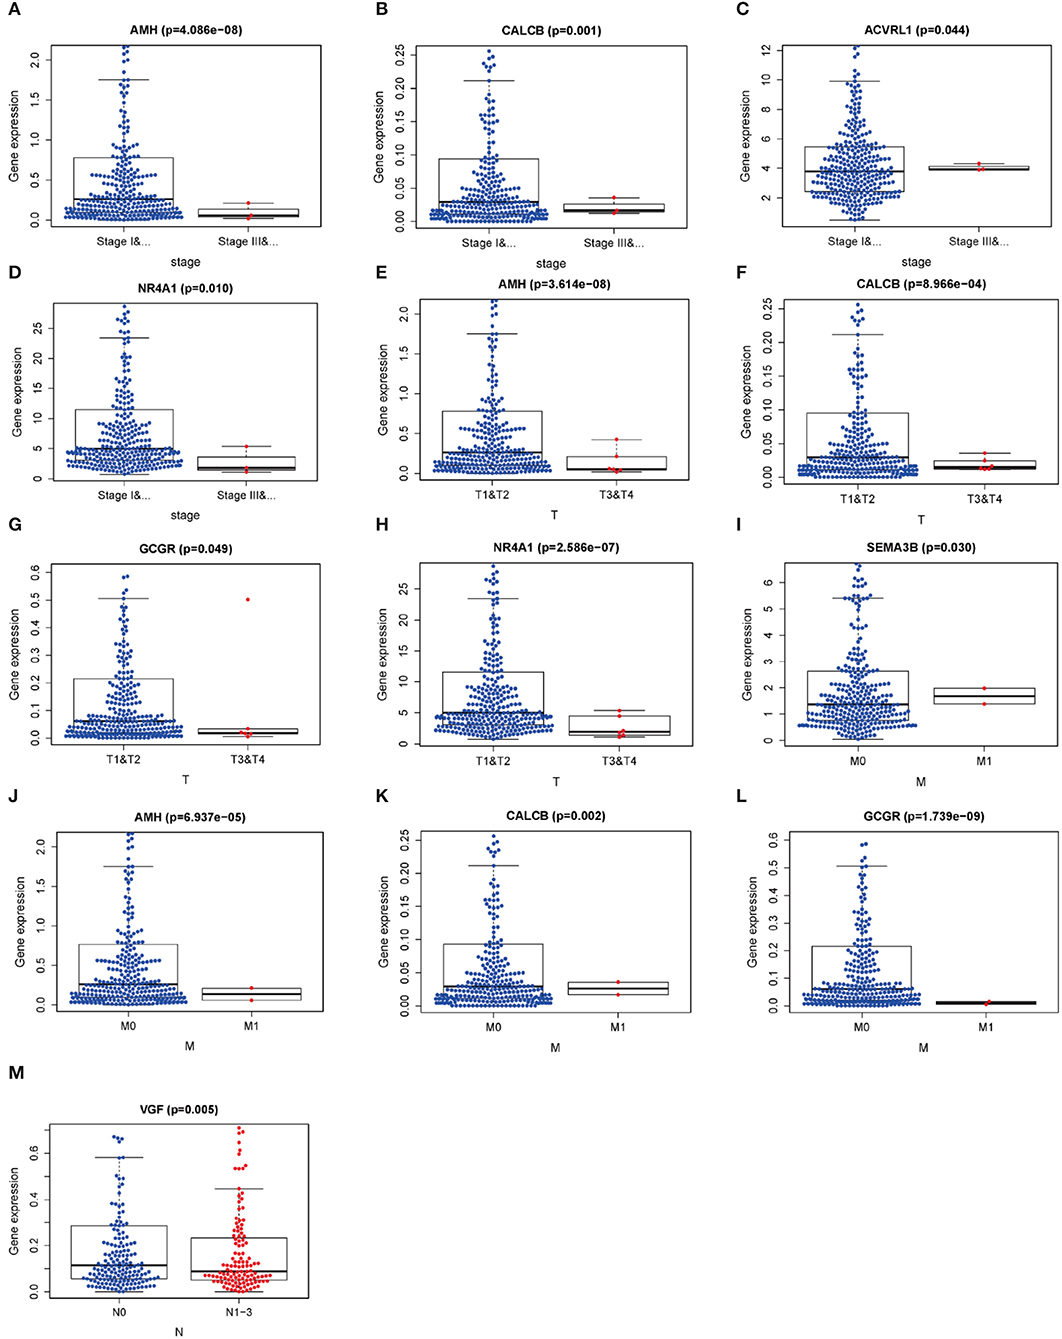
Figure 7. Relationships between the clinical-pathological characteristics and the expressions of differential expression IRGs in LUSC. (A–D) Differences in the expression of DEIRGs between the pathological TNM stages I-II/III-IV in LUSC. (E–H) Differences in the expression of DEIRGs between the pathological T1-T2/T3-T4 stages in LUSC. (I–L) Differences in the expression of DEIRGs between the pathological M0/M1 stages in LUSC. (M) Differences in the expression of DEIRGs between the pathological N0/N1-N3 stages in LUSC.
Correlation Analysis Between DEIRGs in Prediction Model and Immunocyte Infiltration in LUSC
To figure out whether DEIRGs precisely reflected the status of LUSC IME, correlation analysis was carried out to examine the relationship between DEIRGs in the LUSC prediction model and immunocyte infiltration (Figure 8). As shown in Figure 8, B cells, CD4-T cells, CD8-Tcells, Macrophages were not associated with the riskScore of the prediction model (P > 0.05) (Figures 8A–E). Dendritic cells and neutrophils had a positively relationship with DEIRGs in prediction model (P < 0.05) (Figures 8D,F).
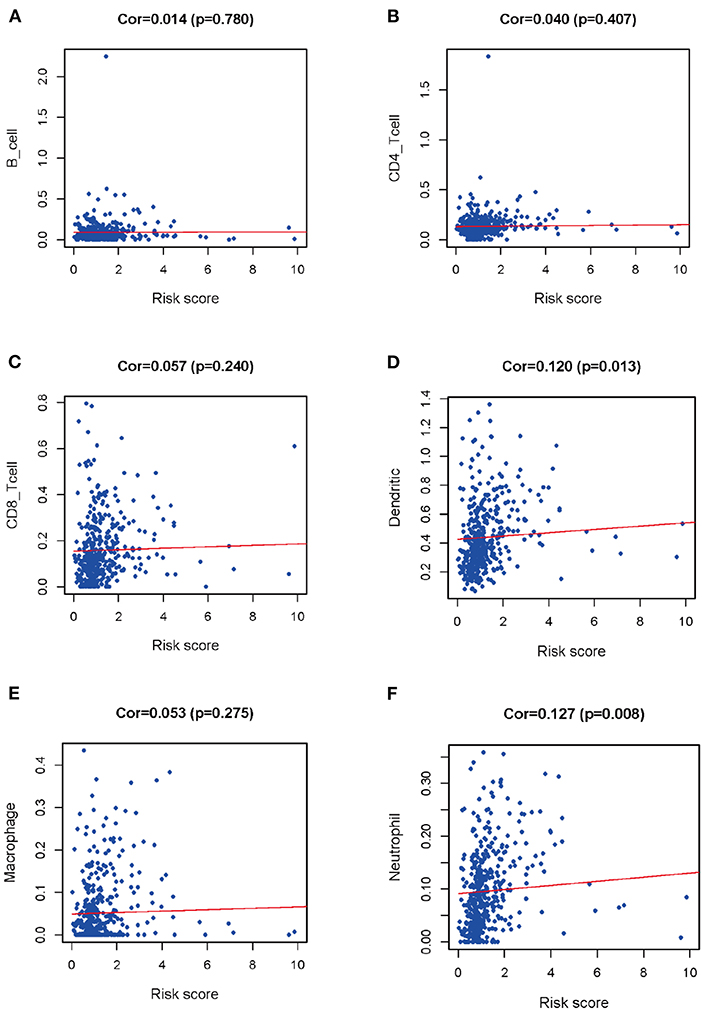
Figure 8. Relationships between prognostic value and degree of infiltration of six types of immune cells. (A) B cells; (B) CD4 T cells; (C) CD8 T cells; (D) Dendritic cells; (E) Macrophages; (F) Neutrophils.
Discussion
In recent years, IRGs show increasing importance to cancer development and immunotherapies (24–27). However, transcriptome studies on IRGs, the relationships of IRGs with clinical characteristics, and the molecular mechanisms have not been performed yet. In the present work, the Cox prediction model was established for revealing IRGs specific to LUSC, so as to predict LUSC prognosis. The regulatory network between IRGs and TFs revealed the potential novel molecular mechanisms in LUSC. In this study, the DEIRGs obtained in LUSC might play a vital role in predicting the prognosis for LUSC. More importantly, an individualized Cox prediction model with DEIRGs was adopted for measuring immunocyte infiltration and evaluating the clinical prognosis.
In recent years, the prognostic or predictive biomarkers associated with the tumor IME are promising to identify new molecular targets and to enhance the treatment for patients during immunotherapy development (28–34). Several recent studies reveal the prognostic biomarkers in tumor IME for predicting tumor prognosis. Li et al. found that four IRGs were identified as the biomarkers to predict the prognosis for breast cancer (35). Pan et al. discovered that 149 immune genes were identified as the prognostic genes in tumor IME to predict ESCC prognosis (36). Yang et al. suggested that the diagnostic immune score (DIS) and prognostic immune score (PIS) showed diagnostic and prognostic significance for cancers in the digestive system (37). Nowadays, prognostic biomarkers related to the tumor IME in lung cancer are still lacking.
A study demonstrates that the NSCLC IME may be adopted to be the potential prognostic biomarkers to predict patient prognosis after receiving immune checkpoint inhibitor treatments (37). However, the molecular mechanism of prognosis-related DEIRGs associated with DETFs in LUSC tumor IME is not examined yet. The present study was carried out to explore DEIRGs and establish the IRGs-based prognostic model in LUSC IME to reveal the prognostic biomarkers to predict LUSC diagnosis and prognosis.
According to functional enrichment analysis in this work, DEIRGs showed the highest enrichment levels within tumor-related typical pathways, including the JAK-STAT signal transduction pathway, the TGF-β signal transduction pathway, the PI3K-Akt signal transduction pathway, the MAPK signal transduction pathway, and the TNF signal transduction pathway. According to recent research, alterations in MET-activation and JAK2-inactivation are the independent factors that affect the response to immune checkpoint inhibitors like PD-L1 in lung cancer (25). As suggested in one study, the combination of MEK and PD-L1 inhibitors in pre-clinical and ex-vivo NSCLC models exerts an important part in predicting patient sensitivity to such therapies (38).
For further exploring the underlying mechanisms of DEIRGs at molecular level, the TF-mediated IRGs network was constructed in the present study, so as to reveal the significant TFs regulating DEIRGs in this network. FOXA2, TP63, FLI1, TCF21, EPAS1, ERG, GATA6, FOS, CENPA, SOX2, RXRG, NR4A1, and SNAI2 were the DETFs that might regulate the DEIRGs in LUSC. Tang et al. discovered that curcumin inhibited the growth of human NCI-H292 LUSCs by up-regulating FOXA2 expression (39). FLI1 acts as a novel oncogenic diver to promote the metastasis of small cell lung cancer (SCLC). LncRNA LINC00163 serves as the tumor suppressor through transcriptionally up-regulating TCF21 expression in inhibiting the development of lung cancer (40). In addition, the hypoxic-stabilized EPAS1 proteins transactivate DNMT1, which further promotes the hypermethylation of EPAS1 promoter and down-regulates EPAS1 mRNA expression in NSCLC (41). A recent study showed that CENPA could act as a novel diagnostic biomarker in lung adenocarcinoma (42). Compared with previous studies, our study had first constructed the co-expression DETFs-prognosis-related DEIRGs regulatory network in LUSC using bioinformatics analysis. From the network in our study, the DETFs positively and negatively regulated the DEIRGs, which shed new light on exploring the DEIRGs mechanisms in LUSC at molecular level.
In our study, univariate as well as multivariate Cox regression analysis was carried out to constructed the DEIRGs-based Cox prediction model. Eventually, the 10 DEIRGs in prediction model played critical parts in predicting LUSC prognosis. In addition, the AUC was 0.709, while the P-value between high and low risk groups was 0, which indicated that the Cox prediction model might be able to accurately estimate LUSC prognosis. Univariate as well as multivariate independent prognosis analysis in our study indicated that, the pathological M stage and the riskScore of the Cox prediction model might serve as the independent prognostic factors to predict LUSC prognosis. Furthermore, 10 DEIRGs were applied for correlation analysis between the expression profiles of IRGs and clinical characteristics. Semaphorin 3B (SEMA3B) can be used to be the tumor suppressor gene to suppress the Akt signal transduction pathway, which is achieved via the neuropilin-1 receptor in lung cancer cells (43). The AMH/AMHR2 axis provides a novel insight to illustrate the TGF-β/BMP resistance-associated signaling in NSCLC (44). Epigenetic modifications facilitate the expression of VGF, up-regulate its protein expression, and promote epithelial-mesenchymal transition (EMT) progression as well as kinase inhibitor resistance within NSCLC (45). GCGR acts as a member of the prognostic model, which can exert an important part in predicting LUSC survival (46). In addition, NR4A1 exerts an important part in the regulation of TGFβ-induced invasion and migration of lung cancer cells (47).
Our study first used bioinformatic analysis to integrate the clinical characteristics of LUSC with the expression profiles of 10 DEIRGs to explore the statistically significant DEIRGs for forecasting LUSC diagnosis and prognosis. Finally, immunocyte correlation analysis was conducted using the contents of the TIMER database of six types of immunocytes. According to our results, dendritic cells and neutrophils exhibited a significantly positive regulatory relationship with the riskscore of the Cox prediction model. Compared with previous studies, the present study presented the new signature in which DEIRGs were selected as the center, which might be used to predict LUSC prognosis. Furthermore, the DEIRGs might act as the prognostic biomarkers and immune status monitor for predicting LUSC prognosis. We explored the relationships between DEIRGs in prediction model and immunocyte infiltration to reflect the status of IME in LUSC. Dendritic cells and neutrophils were positively correlated with DEIRGs in prediction model, which indicated that the high infiltration levels of dendritic cells as well as neutrophils might be identified in high-risk LUSC patients. These results showed that DEIRGs in prediction model could act as predictor for predicting immunocyte infiltration in LUSC. A study demonstrated that STAT3 and NF-κB signaling pathways were simultaneously attenuated in dendritic cells of lung cancer (48). A study showed that the tumor-associated CD66b neutrophils were correlated with adverse prognostic factors of NSCLC (49). The number of mature dendritic cells were positively correlated with survival time in NSCLC patients (50), While our findings showed that dendritic cells had a positively relationship with the riskScore of the prediction model. These results demonstrated that the prediction model based on DEIRGs could predict the status of immunocyte infiltration in LUSC.
Our prognostic model, which was constructed based on 10 DEIRGs in LUSC, indicated favorable clinical viability. It showed that DEIRGs performed moderately in the ROC curve, and were associated with age, gender, pathological TNM stage, and metastasis. This predictive model may provide a treatment plan based on the immunocyte infiltration degree revealed by DEIRGs.
In conclusion, our study identifies the DEGs, DEIRGs, and DETFs by bioinformatics analysis from TCGA, ImmPort and Cistrome databases. A TFs-IRGs network is performed to reveal the possible mechanism for DEIRGs in LUSC at molecular level. Additionally, the Cox prediction model is constructed for identifying the prognostic independent factors to predict LUSC prognosis. Immunocyte correlation analysis is also performed to identify the relationships between the immune status and the clinical outcomes for LUSC patients.
Data Availability Statement
The datasets presented in this study can be found in online repositories. The names of the repository/repositories and accession number(s) can be found in the article/supplementary material.
Author Contributions
Y-QQ and RL designed the research. J-PL, Y-HY, and XL analyzed the data. X-JZ and XC collected the literature. RL drafted the manuscript. Y-QQ revised the manuscript. All authors read and approved the final manuscript.
Funding
This work was supported by grants from the Major Scientific and Technological Innovation Project of Shandong Province (Grant No. 2018CXGC1212), the Science and Technology Foundation of Shandong Province (Grant No. 2014GSF118084), the CSCO-Qilu Cancer Research Fund (Grant No. Y-Q201802-014), the Medical and Health Technology Innovation Plan of Jinan City (Grant No. 201805002), and the National Natural Science Foundation of China (Grant No. 81372333).
Conflict of Interest
The authors declare that the research was conducted in the absence of any commercial or financial relationships that could be construed as a potential conflict of interest.
Abbreviations
AUC, Area under the curves; BC, breast cancer; CRC, colorectal cancer; DAVID, The Database for Annotation, Visualization and Integrated Discovery; DEGs, Differentially expressed genes; DEIRGs, Differentially expressed immune-related genes; DETFs, Differentially expressed transcription factors; EMT, epithelial-mesenchymal transition; FDR, False discovery rate; GO, Gene ontology; IMMPORT, Immunology Database and Analysis Portal; IME, immune microenvironment; IRGs, Immune-related genes; KEGG, Kyoto Encyclopedia of Genes and Genomes; LUSC, Lung squamous cell carcinoma; NSCLC, Non-small-cell lung cancer; OS, overall survival; PCa, prostate cancer; ROC, Receiver operating characteristic; TCGA, The Cancer Genome Atlas Project; TIMER, Tumor Immune Estimation Resource; TFs, Transcription factors.
References
1. Torre LA, Bray F, Siegel RL, Ferlay J, Lortet-Tieulent J, Jemal A. Global cancer statistics, 2012. CA Cancer J Clin. (2015) 65:87–108. doi: 10.3322/caac.21262
2. Siegel RL, Miller KD, Jemal A. Cancer statistics, 2019. CA Cancer J Clin. (2019) 69:7–34. doi: 10.3322/caac.21551
3. Zhang P, Kang B, Xie G, Li S, Gu Y, Shen Y, et al. Genomic sequencing and editing revealed the GRM8 signaling pathway as potential therapeutic targets of squamous cell lung cancer. Cancer Lett. (2019) 442:53–67. doi: 10.1016/j.canlet.2018.10.035
4. Shum E, Wang F, Kim S, Perez-Soler R, Cheng H. Investigational therapies for squamous cell lung cancer: from animal studies to phase II trials. Expert Opin Investig Drugs. (2017) 26:415–26. doi: 10.1080/13543784.2017.1302425
5. Hattori A, Takamochi K, Oh S, Suzuki K. New revisions and current issues in the eighth edition of the TNM classification for non-small cell lung cancer. Jpn J Clin Oncol. (2019) 49:3–11. doi: 10.1093/jjco/hyy142
6. Wang C, Tan S, Liu W-R, Lei Q, Qiao W, Wu Y, et al. RNA-Seq profiling of circular RNA in human lung adenocarcinoma and squamous cell carcinoma. Mol Cancer. (2019) 18:134. doi: 10.1186/s12943-019-1061-8
7. Hoang LT, Domingo-Sabugo C, Starren ES, Willis-Owen SAG, Morris-Rosendahl DJ, Nicholson AG, et al. Metabolomic, transcriptomic and genetic integrative analysis reveals important roles of adenosine diphosphate in haemostasis and platelet activation in non-small-cell lung cancer. Mol Oncol. (2019) 13:2406–21. doi: 10.1002/1878-0261.12568
8. Ascierto PA, Bifulco C, Buonaguro L, Emens LA, Ferris RL, Fox BA, et al. Perspectives in immunotherapy: meeting report from the “Immunotherapy Bridge 2018” (28–29 November, 2018, Naples, Italy). J ImmunoTher Cancer. (2019) 7:332. doi: 10.1186/s40425-019-0798-3
9. Wu Y-L, Mok TSK, Kudaba I, Kowalski DM, Cho BC, Turna HZ, et al. Pembrolizumab versus chemotherapy for previously untreated, PD-L1-expressing, locally advanced or metastatic non-small-cell lung cancer (KEYNOTE-042): a randomised, open-label, controlled, phase3 trial. Lancet. (2019) 393:1819–30. doi: 10.1016/S0140-6736(18)32409-7
10. Cohen R, Rousseau B, Vidal J, Colle R, Diaz LA, André T. Immune checkpoint inhibition in colorectal cancer: microsatellite instability and beyond. Target Oncol. (2019) 15:11–24. doi: 10.1007/s11523-019-00690-0
11. Acs B, Ahmed FS, Gupta S, Fai Wong P, Gartrell RD, Sarin Pradhan J, et al. An open source automated tumor infiltrating lymphocyte algorithm for prognosis in melanoma. Nat Commun. (2019) 10:5440. doi: 10.1038/s41467-019-13043-2
12. Fan J, Yin Z, Xu J, Wu F, Huang Q, Yang L, et al. Circulating microRNAs predict the response to anti-PD-1 therapy in non-small cell lung cancer. Genomics. (2019) 112:2063–71. doi: 10.1016/j.ygeno.2019.11.019
13. Prat A, Navarro A, Paré L, Reguart N, Galván P, Pascual T, et al. Immune-related gene expression profiling after PD-1 blockade in non–small cell lung carcinoma, head and neck squamous cell carcinoma, and melanoma. Cancer Res. (2017) 77:3540–50. doi: 10.1158/0008-5472.CAN-16-3556
14. Stein JE, Lipson EJ, Cottrell TR, Forde PM, Anders RA, Cimino-Mathews A, et al. Pan-tumor pathologic scoring of response to PD-(L)1 blockade. Clin Cancer Res. (2019) 26:545–51. doi: 10.1158/1078-0432.CCR-19-2379
15. Li B, Cui Y, Diehn M, Li R. Development and validation of an individualized immune prognostic signature in early-stage nonsquamous non-small cell lung cancer. JAMA Oncol. (2017) 3:1529. doi: 10.1001/jamaoncol.2017.1609
16. Bhattacharya S, Andorf S, Gomes L, Dunn P, Schaefer H, Pontius J, et al. ImmPort: disseminating data to the public for the future of immunology. Immunol Res. (2014) 58:234–9. doi: 10.1007/s12026-014-8516-1
17. Mei S, Meyer CA, Zheng R, Qin Q, Wu Q, Jiang P, et al. Cistrome cancer: a web resource for integrative gene regulation modeling in cancer. Cancer Res. (2017) 77:e19–22. doi: 10.1158/0008-5472.CAN-17-0327
18. Ritchie ME, Phipson B, Wu D, Hu Y, Law CW, Shi W, et al. limma powers differential expression analyses for RNA-sequencing and microarray studies. Nucl Acids Res. (2015) 43:e47. doi: 10.1093/nar/gkv007
19. Dennis G, Sherman BT, Hosack DA, Yang J, Gao W, Lane HC, et al. DAVID: database for annotation, visualization, and integrated discovery. Genome Biol. (2003) 4:P3. doi: 10.1186/gb-2003-4-5-p3
20. Sánchez-Cabo F, Walter W, Ricote M. GOplot: an R package for visually combining expression data with functional analysis. Bioinformatics. (2015) 31:2912–4. doi: 10.1093/bioinformatics/btv300
21. Kanehisa M, Furumichi M, Tanabe M, Sato Y, Morishima K. KEGG: new perspectives on genomes, pathways, diseases and drugs. Nucl Acids Res. (2017) 45:D353–61. doi: 10.1093/nar/gkw1092
22. McNeil BJ, Hanley JA. The meaning and use of the area under a receiver operating characteristic (ROC) curve. Radiology. (1982) 143:29–36. doi: 10.1148/radiology.143.1.7063747
23. Li T, Fan J, Wang B, Traugh N, Chen Q, Liu JS, et al. TIMER: a web server for comprehensive analysis of tumor-infiltrating immune cells. Cancer Res. (2017) 77:e108–10. doi: 10.1158/0008-5472.CAN-17-0307
24. Ge P, Wang W, Li L, Zhang G, Gao Z, Tang Z, et al. Profiles of immune cell infiltration and immune-related genes in the tumor microenvironment of colorectal cancer. Biomed Pharmacother. (2019) 118:109228. doi: 10.1016/j.biopha.2019.109228
25. Saigi M, Alburquerque-Bejar JJ, Mc Leer-Florin A, Pereira C, Pros E, Romero OA, et al. MET-oncogenic and JAK2-inactivating alterations are independent factors that affect regulation of PD-L1 expression in lung cancer. Clin Cancer Res. (2018) 24:4579–87. doi: 10.1158/1078-0432.CCR-18-0267
26. Verdeil G, Lawrence T, Schmitt V, Auphan A. Targeting STAT3 and STAT5 in tumor-associated immune cells to improve immunotherapy. Cancers. (2019) 11:1832. doi: 10.3390/cancers11121832
27. Berglund A, Mills M, Putney RM, Hamaidi I, Mulé J, Kim S. Methylation of immune synapse genes modulates tumor immunogenicity. J Clin Invest. (2019) 130:974–80. doi: 10.1172/JCI131234
28. Vargas AJ, Harris CC. Biomarker development in the precision medicine era: lung cancer as a case study. Nat Rev Cancer. (2016) 16:525–37. doi: 10.1038/nrc.2016.56
29. Taube JM, Sholl LM, Rodig SJ, Cottrell TR, Giraldo NA, Baras AS, et al. Implications of the tumor immune microenvironment for staging and therapeutics. Mod Pathol. (2018) 31:214–34. doi: 10.1038/modpathol.2017.156
30. Lara OD, Krishnan S, Wang Z, Corvigno S, Zhong Y, Lyons Y, et al. Tumor core biopsies adequately represent immune microenvironment of high-grade serous carcinoma. Sci Rep. (2019) 9:17589. doi: 10.1038/s41598-019-53872-1
31. Liao W-Y, Yang C-Y, Ho C-C, Chen K-Y, Tsai T-H, Hsu C-L, et al. Association between programmed death-ligand 1 expression, immune microenvironments, and clinical outcomes in epidermal growth factor receptor mutant lung adenocarcinoma patients treated with tyrosine kinase inhibitors. Eur J Cancer. (2019) 124:110–22. doi: 10.1016/j.ejca.2019.10.019
32. Kwon MJ. Emerging immune gene signatures as prognostic or predictive biomarkers in breast cancer. Arch Pharm Res. (2019) 42:947–61. doi: 10.1007/s12272-019-01189-y
33. Zhao Y, Ge X, Xu X, Yu S, Wang J, Sun L. Prognostic value and clinicopathological roles of phenotypes of tumour-associated macrophages in colorectal cancer. J Cancer Res Clin Oncol. (2019) 145:3005–19. doi: 10.1007/s00432-019-03041-8
34. Jiang Y, Xie J, Huang W, Chen H, Xi S, Han Z, et al. Tumor immune microenvironment and chemosensitivity signature for predicting response to chemotherapy in gastric cancer. Cancer Immunol Res. (2019) 7:2065–73. doi: 10.1158/2326-6066.CIR-19-0311
35. Li J, Liu C, Chen Y, Gao C, Wang M, Ma X, et al. Tumor characterization in breast cancer identifies immune-relevant gene signatures associated with prognosis. Front Genet. (2019) 10:1119. doi: 10.3389/fgene.2019.01119
36. Lu Y, Pan X-B, Huang J-L, Long Y, Yao D-S. Prognostic genes in the tumor microenvironment in cervical squamous cell carcinoma. Aging. (2019) 11:10154–66. doi: 10.18632/aging.102429
37. Yang S, Liu T, Cheng Y, Bai Y, Liang G. Immune cell infiltration as a biomarker for the diagnosis and prognosis of digestive system cancer. Cancer Sci. (2019) 110:3639–49. doi: 10.1111/cas.14216
38. Della Corte CM, Barra G, Ciaramella V, Di Liello R, Vicidomini G, Zappavigna S, et al. Antitumor activity of dual blockade of PD-L1 and MEK in NSCLC patients derived three-dimensional spheroid cultures. J Exp Clin Cancer Res. (2019) 38:253. doi: 10.1186/s13046-019-1257-1
39. Tang L, Liu J, Zhu L, Chen Q, Meng Z, Sun L, et al. Curcumin inhibits growth of human NCI-H292 lung squamous cell carcinoma cells by increasing FOXA2 expression. Front Pharmacol. (2018) 9:60. doi: 10.3389/fphar.2018.00060
40. Wei Y, Guo X, Wang Z, Liu W, Yang Y, Yu X. LncRNA LINC00163 upregulation suppresses lung cancer development though transcriptionally increasing TCF21 expression. Am J Cancer Res. (2018) 8:2494–506.
41. Xu X-H, Bao Y, Wang X, Yan F, Guo S, Ma Y, et al. Hypoxic-stabilized EPAS1 proteins transactivate DNMT1 and cause promoter hypermethylation and transcription inhibition of EPAS1 in non-small cell lung cancer. FASEB J. (2018) 32:6694–705. doi: 10.1096/fj.201700715
42. Liu WT, Wang Y, Zhang J, Ye F, Huang XH, Li B, et al. A novel strategy of integrated microarray analysis identifies CENPA, CDK1 and CDC20 as a cluster of diagnostic biomarkers in lung adenocarcinoma. Cancer Lett. (2018) 425:43–53. doi: 10.1016/j.canlet.2018.03.043
43. Castro-Rivera E, Ran S, Brekken RA, Minna JD. Semaphorin 3B inhibits the phosphatidylinositol 3-Kinase/Akt pathway through neuropilin-1 in lung and breast cancer cells. Cancer Res. (2008) 68:8295–303. doi: 10.1158/0008-5472.CAN-07-6601
44. Beck TN, Korobeynikov VA, Kudinov AE, Georgopoulos R, Solanki NR, Andrews-Hoke M, et al. Anti-müllerian hormone signaling regulates epithelial plasticity and chemoresistance in lung cancer. Cell Rep. (2016) 16:657–71. doi: 10.1016/j.celrep.2016.06.043
45. Heinbockel L, Marwitz S, Scheufele S, Nitsch D, Kugler C, Perner S, et al. Epigenetic modifications of the VGF gene in human non-small cell lung cancer tissues pave the way towards enhanced expression. Clin Epigenetics. (2017) 9:123. doi: 10.1186/s13148-017-0423-6
46. Li J, Wang J, Chen Y, Yang L, Chen S. A prognostic 4-gene expression signature for squamous cell lung carcinoma. J Cell Physiol. (2017) 232:3702–13. doi: 10.1002/jcp.25846
47. Hedrick E, Mohankumar K, Safe S. TGFβ-induced lung cancer cell migration is NR4A1-dependent. Mol Cancer Res. (2018) 16:1991–2002. doi: 10.1158/1541-7786.MCR-18-0366
48. Li R, Fang F, Jiang M, Wang C, Ma J, Kang W, et al. STAT3 and NF-kappaB are simultaneously suppressed in dendritic cells in lung cancer. Sci Rep. (2017) 7:45395. doi: 10.1038/srep45395
49. Carus A, Ladekarl M, Hager H, Pilegaard H, Nielsen PS, Donskov F. Tumor-associated neutrophils and macrophages in non-small cell lung cancer: no immediate impact on patient outcome. Lung Cancer. (2013) 81:130–7. doi: 10.1016/j.lungcan.2013.03.003
Keywords: lung squamous cell carcinoma, immune-related genes (IRGs), transcription factors (TFs) mediated IRGs network, a Cox prediction model, prognostic biomarkers
Citation: Li R, Liu X, Zhou X-J, Chen X, Li J-P, Yin Y-H and Qu Y-Q (2020) Identification of a Prognostic Model Based on Immune-Related Genes of Lung Squamous Cell Carcinoma. Front. Oncol. 10:1588. doi: 10.3389/fonc.2020.01588
Received: 24 March 2020; Accepted: 23 July 2020;
Published: 02 September 2020.
Edited by:
Hui Zhu, Shandong Cancer Hospital, ChinaReviewed by:
Min Zhou, School of Medicine, Shanghai Jiao Tong University, ChinaKeqing Shi, Wenzhou Medical University, China
Copyright © 2020 Li, Liu, Zhou, Chen, Li, Yin and Qu. This is an open-access article distributed under the terms of the Creative Commons Attribution License (CC BY). The use, distribution or reproduction in other forums is permitted, provided the original author(s) and the copyright owner(s) are credited and that the original publication in this journal is cited, in accordance with accepted academic practice. No use, distribution or reproduction is permitted which does not comply with these terms.
*Correspondence: Yi-Qing Qu, cXV5aXFpbmdAc2R1LmVkdS5jbg==