 Xuejiao Yin1
 Yu Hu
Yu Hu- 1Institute of Hematology, Union Hospital, Tongji Medical College, Huazhong University of Science and Technology, Wuhan, China
- 2Collaborative Innovation Center of Hematology, Huazhong University of Science and Technology, Wuhan, China
Background: The incidence of Waldenström macroglobulinemia (WM) has increased in certain groups over several decades in the United States. It is unclear whether the increasing incidence is associated with mortality trends.
Methods: The incidence and incidence-based mortality (IBM) rates were obtained from the Surveillance, Epidemiology, and End Results (SEER) database (1980–2016) with SEER*Stat software. The secular trends stratified by demographic characteristics were analyzed by joinpoint regression.
Results: The incidence of WM showed an initial rapid increase from 1980 to 1993 {annual percentage change (APC), 14.1% [95% confidence interval (CI), 10 to 18.4%]}, whereas it began to stabilize from 1993 to 2016 [APC, 0.5% (95% CI, −0.3 to 1.3%)]. The WM IBM trend followed a similar pattern, with a decrease occurring around 1994. The trends in the incidence and mortality significantly differed according to geographic location, race, age, sex, primary site of involvement and subtype, which could help in further investigations into the specific etiology. Moreover, a dramatic increase in the 5-year survival rate from the 1980s to 2010s was observed (47.84 vs. 69.41%).
Conclusions: Although both the incidence and IBM of WM continued to increase during the study period, a reduction in the rate of increase occurred around 1993. We believe that further advances in healthcare delivery and research can ensure a low mortality rate. Future studies can use the findings of this paper to monitor the results of WM therapy.
Introduction
Waldenström macroglobulinemia (WM), a very rare indolent and incurable non-Hodgkin lymphoma (NHL), is characterized by the infiltration of bone marrow and other tissues by lymphoplasmacytic and plasma cells and the presence of circulating immunoglobulin M (IgM) paraproteins in the serum (1). Previous studies based on a large population have shown that the incidence of WM in the United States increased in certain groups from 1988 to 2007 (2). However, it is unclear whether the incidence of this disease had changed over the past 10 years. In addition, it is unknown whether the increased incidence of WM is associated with WM mortality trends. No prior study based on a large population has reported the mortality trend of WM and considered the effects of demographic characteristics on mortality trends.
Castillo et al. (3) suggested that the survival of patients with WM has significantly improved due to the development of novel drugs in recent decades. However, some mixed results have been reported by some studies from Europe (4, 5). If there are indeed notable survival benefits, then they could be detected by a temporal trend analysis of WM incidence and mortality. Nevertheless, to the best of our knowledge, a comparative analysis of these two rates has not been performed in any previous studies.
Therefore, our aim was to explore and compare the trends in incidence and incidence-based mortality (IBM) among patients with WM by age, sex, race, primary site, geographical regions, and subtype using the Surveillance, Epidemiology, and End Results (SEER) cancer registry, including nine registries representing 10% of the US population from 1980 to 2016.
Materials and Methods
Data Sources
Incident cases were obtained from the database of incidence–SEER 9 registries of the US National Cancer Institute from 1980 to 2016.
Mortality cases were obtained from the database of IBM–SEER 9 registries of the US National Cancer Institute from 1990 to 2016. IBM cases were different from traditional mortality cases, which linked mortality records to incident cancer cases. The first 10 years (1980–1989) were not included in our IBM analysis to ensure that most of the deaths occurred after 1980 and that IBM rates were not underestimated in the first few years. We chose this interval because the median survival for patients with WM was 6 years from 1991 to 2000 (6).
Survival cases were obtained from the database of incidence–SEER 18 registries of the US National Cancer Institute from 1980 to 2016.
Study Population Selection
Patients diagnosed with WM as their first malignancy per the International Classification of Diseases for Oncology, third edition, ICD-O-3 histology code 9671/3 [lymphoplasmacytic lymphoma (LPL)] and 9761/3 (WM) were included. The first year of the study period was 1980 because this was the first year in which WM cases were reportable to the SEER database. Patients with WM who were diagnosed only by autopsy or death certificate were excluded. Patients who survived less than a month were excluded from survival analyses since the SEER database recorded their survival time as 0.
Information regarding details of the chemotherapy regimen (e.g., type, dosage, and duration) is limited in SEER. Therefore, the era of diagnosis was divided into the pre-rituximab (1980–2001) and rituximab eras (2002–2016) to explore the effects of novel therapies on survival. Since 2002, 79% of Medicare beneficiaries have received rituximab-based regimens as their initial therapy (7).
Statistical Analysis
Incidence and mortality rates were calculated with SEER*Stat version 8.3.2. All rates were adjusted to the standard population of the US in 2000 and expressed per 100,000 person-years. The joinpoint regression analysis program, version 4.5.0.1, was used to calculate annual percentage changes (APCs), average annual percentage changes (AAPCs), and 95% confidence intervals (CIs) to quantify the incidence and mortality trends according to demographic and tumor characteristics. The program also selected the best-fitting log-linear regression model to ascertain calendar years (i.e., the joinpoints) with significant APCs. All statistical analyses were two-sided, and significance was set at P < 0.05. If no cases were reported during a certain year, then this part of the data was excluded when using the Joinpoint software to analyze the incidence and mortality trends.
The Kaplan–Meier method and the log-rank test were used to calculate the overall survival (OS) rates and compare curves. Chi-square tests were used to compare categorical variables, and ANOVA was used to compare continuous variables between populations.
Ethical Approval
As the SEER database is available to the public, approval from the institutional review board or ethics board was not required.
Results
Patient Characteristics in Incidence and Mortality Analysis
A total of 4,472 patients with WM met the inclusion criteria and were included in the incidence analysis; these patients were from nine SEER registries from 1980 to 2016. The patient characteristics are shown in Table 1. Among them, most patients were diagnosed between ages 70 and 79 [1,326 (29.65%)], male [2,598 (58.09%)], white [3,936 (88.01%)], from the Pacific coast region [1,762 (39.4%)], and had a primary site of bone marrow [3,044 (68.07%)]. Of the eligible patients, 2,420 died of WM during the period from 1990 to 2016 and were included in the IBM analysis. Of these deaths, 33.76% occurred in those diagnosed between ages 70 and 79, 58.76% occurred in male patients, and 88.84% occurred in those in the white race group.
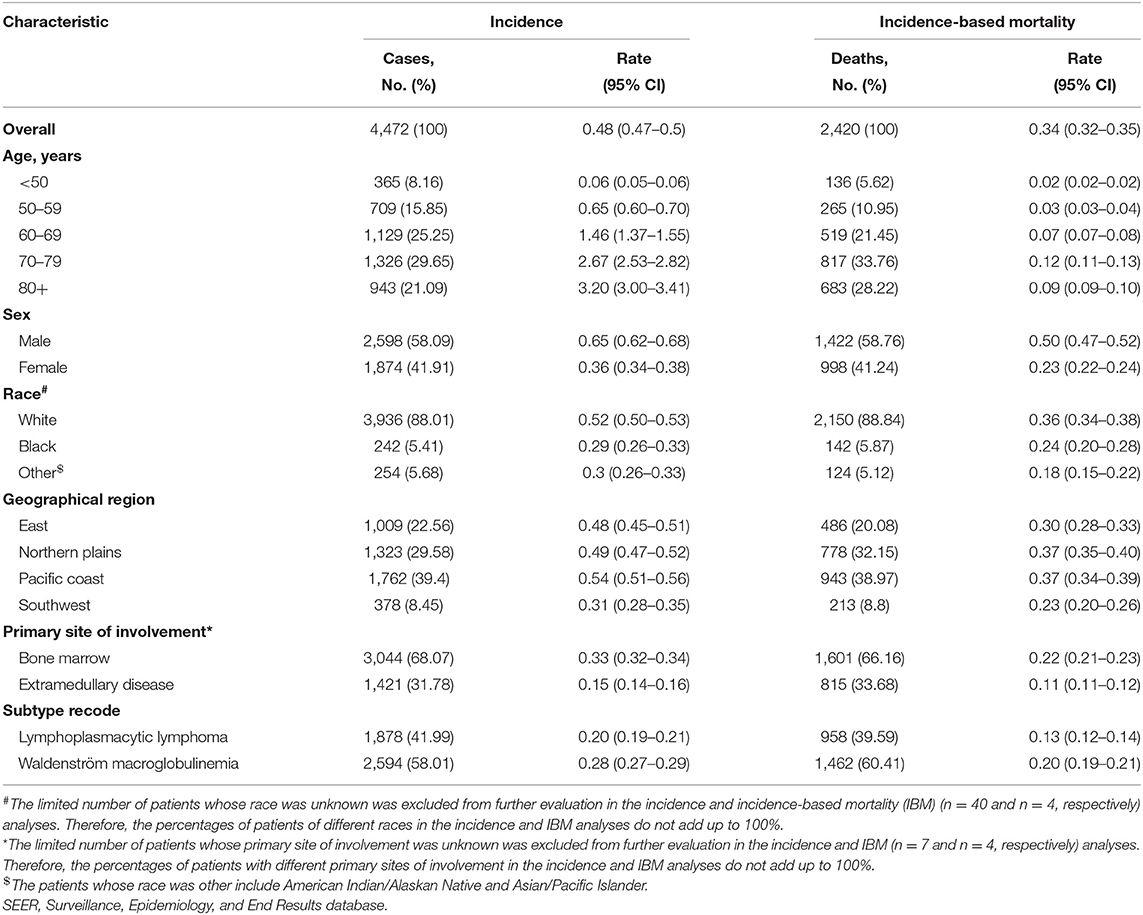
Table 1. Waldenström macroglobulinemia incidence (1980–2016) and incidence-based mortality (1990–2016): the SEER-9 registry database.
Overall Incidence and Mortality Trends
Although both WM incidence and IBM continued to increase during the study period, a reduction in the rate of increase occurred. This change in the incidence rate occurred ~1 year before the decrease in IBM in 1994. The incidence of WM showed an initial rapid increase from 1980 to 1993 [APC, 14.1% (95% CI, 10 to 18.4%)] and began to stabilize from 1993 to 2016 [APC, 0.5% (95% CI, −0.3 to 1.3%)] (Figure 1, Table 2). In terms of IBM, the rate initially increased at an APC of 28.6% (95% CI, 9.2 to 51.5%) from 1990 to 1994 but slowed from 1994 to 2016 [APC, 0.6% (95% CI, −0.2 to 1.4%)] (Figure 2, Table 3).
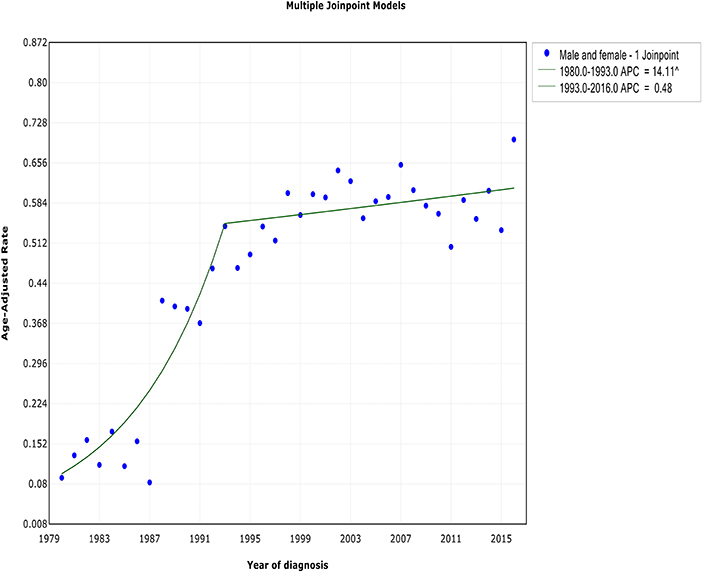
Figure 1. The overall trends in the incidence of Waldenström macroglobulinemia.
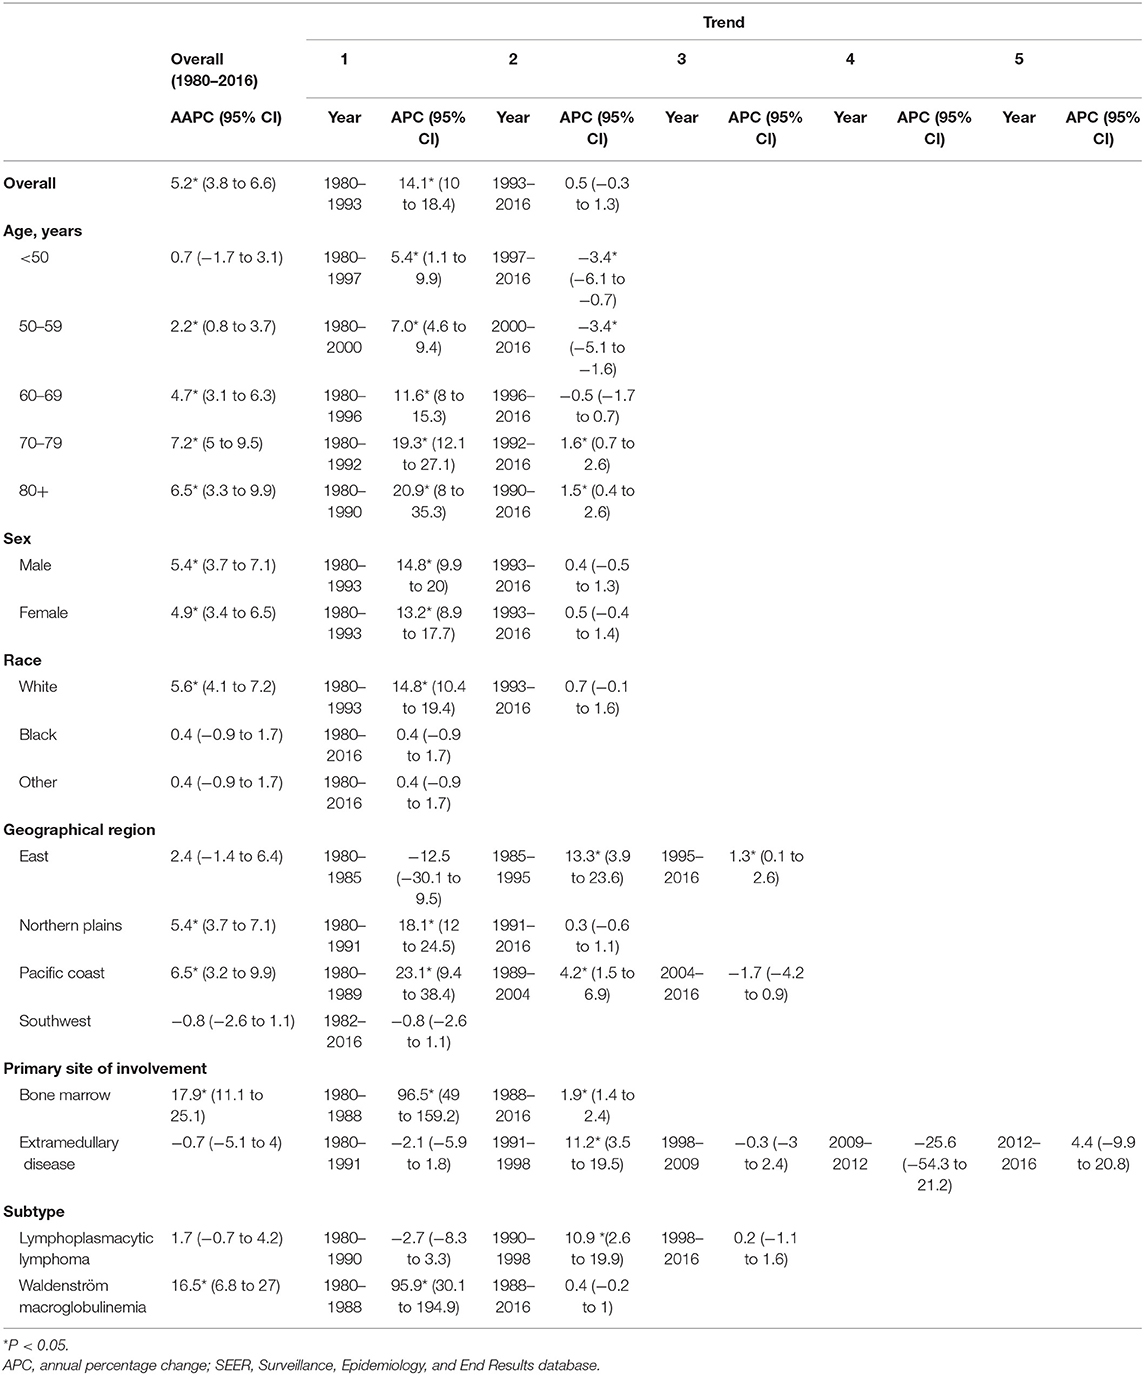
Table 2. Trends in the incidence rates of Waldenström macroglobulinemia (1980–2016): the SEER-9 registry database.
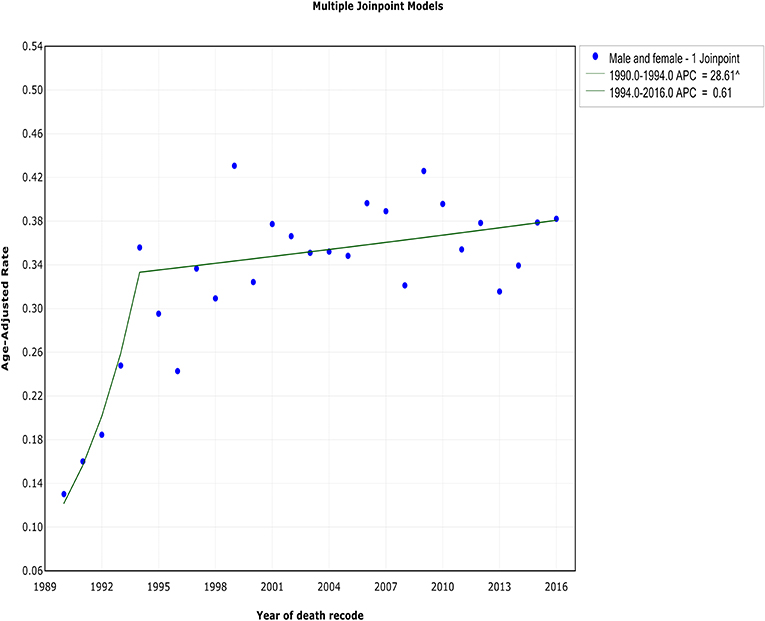
Figure 2. The overall trends in the incidence-based mortality of Waldenström macroglobulinemia.
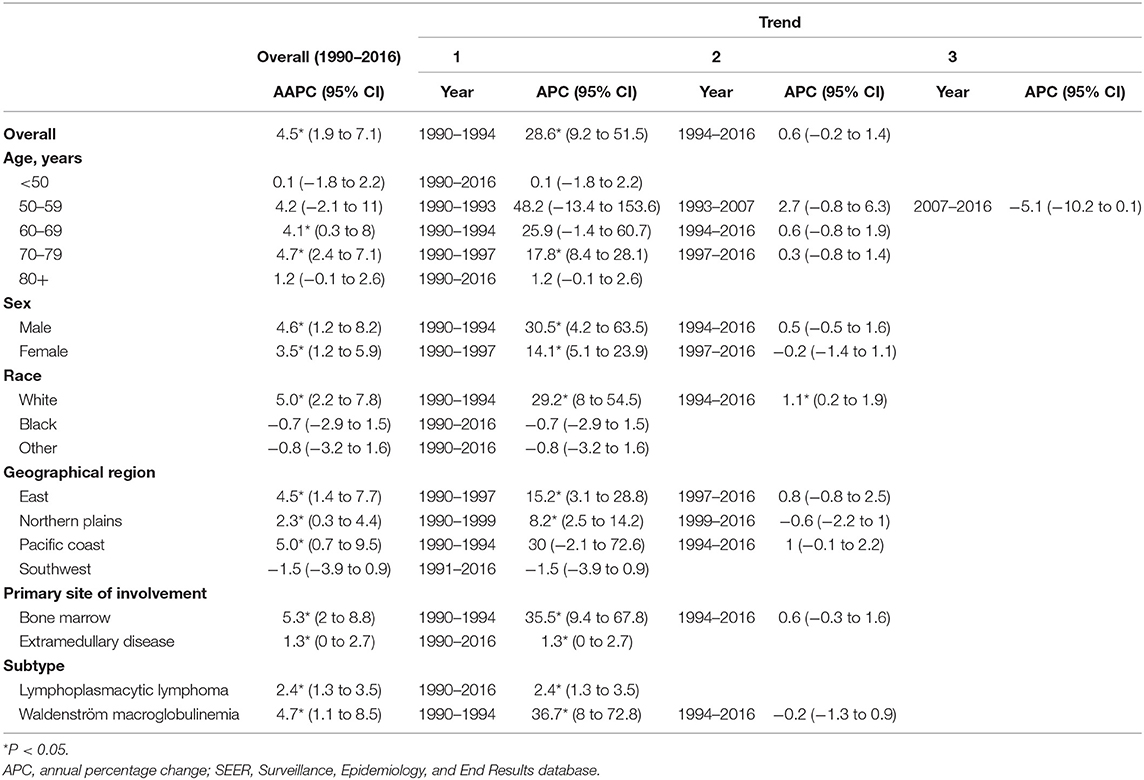
Table 3. Trends in the incidence-based mortality rates of Waldenström Macroglobulinemia (1990–2016): The SEER-9 Registry Database.
Trends by Sex
The incidence rates in both males and females showed an initial significant increase and then slowed starting in 1993 at rates of 0.4% (95% CI, −0.5 to 1.3%) and 0.5% (95% CI, −0.4 to 1.4%), respectively (Figure 3, Table 2). The IBM rates in males and females followed a similar pattern, with deceleration rates of 0.5% (95% CI, −0.5 to 1.6%) and −0.2% (95% CI, −1.4 to 1.1%) in 1994 and 1997, respectively (Figure 4, Table 3). Although the trends have similar slopes, the annual WM incidence and IBM rates in men are approximately two times and three times, respectively, those in women (i.e., 0.75 vs. 0.39 cases per 100,000 in men vs. women in 1993 for incidence; 0.60 vs. 0.19 cases per 100,000 in men vs. women in 1994 for IBM).
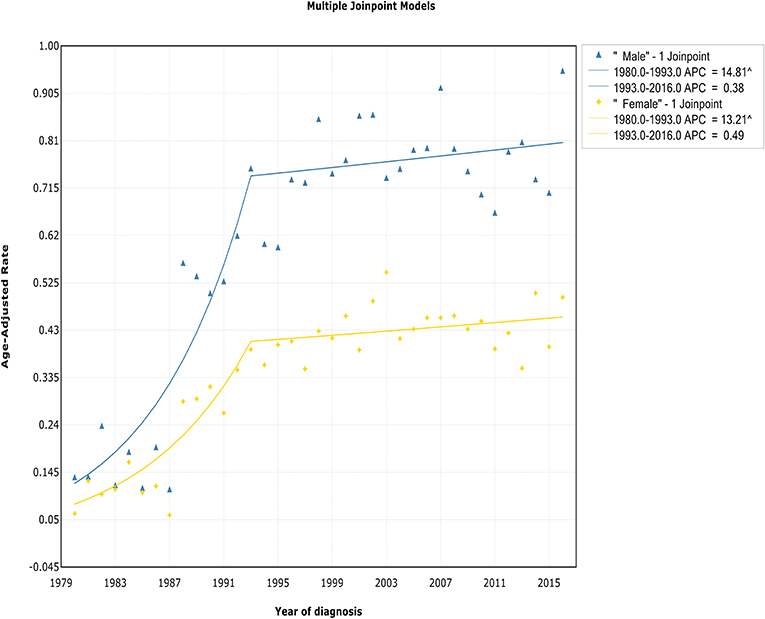
Figure 3. Trends in the annual incidence of Waldenström macroglobulinemia in patients stratified according to sex.
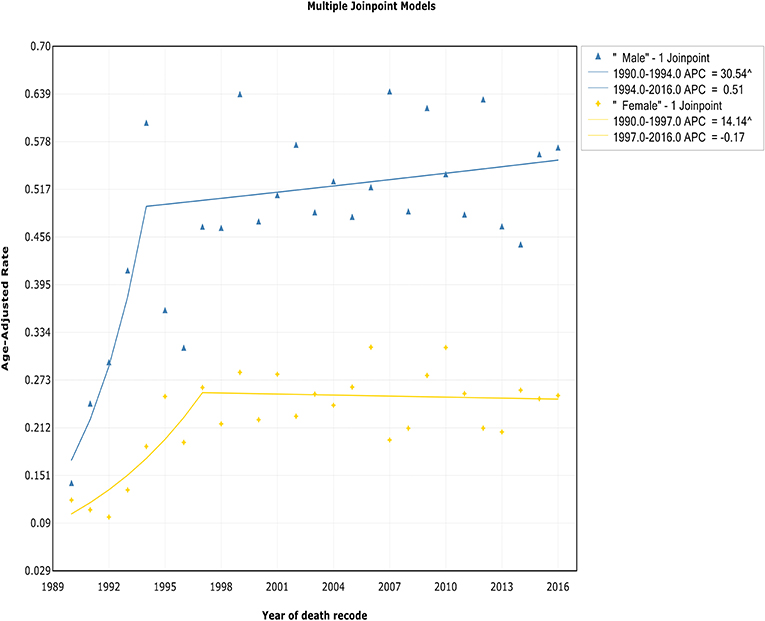
Figure 4. Trends in the annual incidence-based mortality of Waldenström macroglobulinemia in patients stratified according to sex.
Trends by Age
The trend of incidence rates among patients diagnosed at ages <50 years, 50–59 years, and 60–69 years exhibited an initial increase and then decreased at APCs of −3.4% (95% CI, −6.1 to −0.7%), −3.4% (95% CI, −5.1 to −1.6%), and −0.5% (95% CI, −1.7 to 0.7%) in 1997, 2000, and 1996, respectively (Figure 5, Table 2). In contrast, for those diagnosed at 70–79 years and 80+ years of age, the incidence rate continued to increase during the study period, but a decline in the rate of increase occurred around 1992 and 1990, respectively. A steep increase in the incidence rate with advancing age was observed. The incidence rate in those aged <50 years was 0.06 of 100,000 per year, but it increased to 0.65 of 100,000 in those aged 50–59 years (11-fold), 1.46 of 100,000 in those aged 60–69 years (24-fold), 2.67 of 100,000 in those aged 70–79 years (45-fold), and 3.20 of 100,000 in those aged >80 years (53-fold).

Figure 5. Trends in the annual incidence of Waldenström macroglobulinemia in patients stratified according to age.
The trend of IBM rates among patients aged <50 years and >80 years showed a relatively steady level over the study period, and no joinpoint was observed (Figure 6, Table 3). For those aged 50–59 years, 60–69 years, and 70–79 years, the trend of IBM had an initial increase and then stabilized around 2007 [APC, −5.1% (95% CI, −10.2 to 0.1%)], 1994 [APC, 0.6% (95% CI, −0.8 to 1.9%)], and 1997 [APC, 0.3% (95% CI, −0.8 to 1.4%)], respectively.
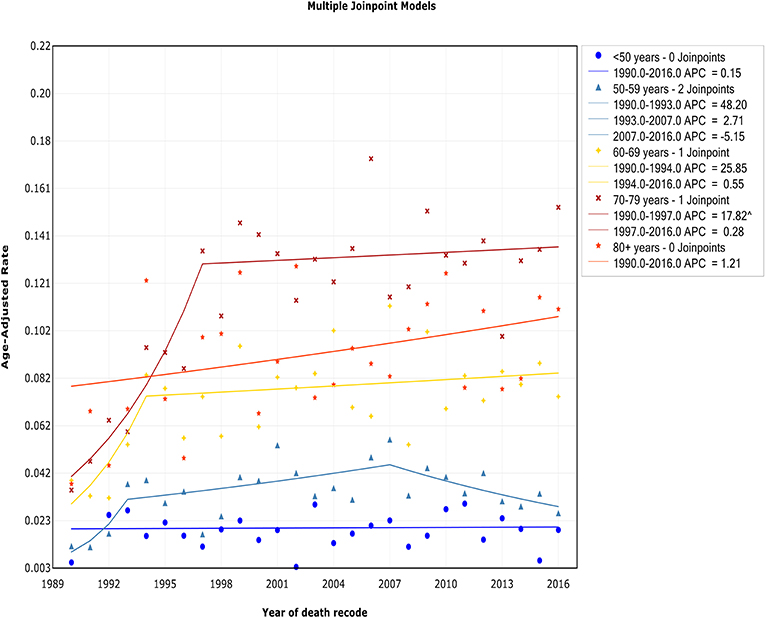
Figure 6. Trends in the annual incidence-based mortality of Waldenström macroglobulinemia in patients stratified according to age.
Trends by Race
Both the incidence and IBM trends in the white race group continued to increase over the study period, but a deceleration was observed during 1993 and 1994. The incidence in white patients increased sharply at a rate of 14.8% (95% CI, 10.4 to 19.4%) from 1980 to 1993 and then more slowly from 1993 to 2016 [APC, 0.7% (95% CI, −0.1 to 1.6%)] (Figure 7, Table 2). The trend of the IBM rate in white patients exhibited a similar pattern, with a decrease in the rate of increase from 1994 to 2016 [APC, 1.1% (95% CI, 0.2 to 1.9%)] (Figure 8, Table 3). No changes in the incidence or IBM trends were observed among black patients or other patients over the study period. The annual WM incidence rate was higher among white patients (0.52 of 100,000) than among black patients (0.29 of 100,000) or patients in other racial groups (0.30 of 100,000).
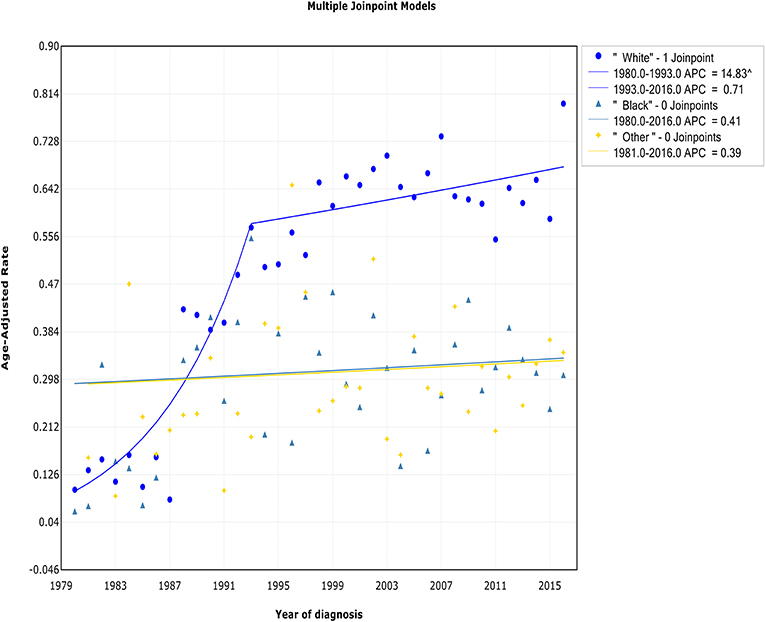
Figure 7. Trends in the annual incidence of Waldenström macroglobulinemia in patients stratified according to race.

Figure 8. Trends in the annual incidence-based mortality of Waldenström macroglobulinemia in patients stratified according to race.
Trends by Primary Site of Involvement
Both the incidence and IBM rate among patients with bone marrow as the primary site of involvement initially rapidly grew, followed by slowing during the periods 1988–2016 [APC, 1.9% (95% CI, 1.4 to 2.4%)] and 1994–2016 [APC, 0.6% (95% CI, −0.3 to 1.6%)]. When trends in primary extramedullary site-specific incidence rates were analyzed, some joinpoints were observed, but they were not readily interpretable (Supplementary Figure 1, Table 2). This may have been due to mistakes in the data collection program or other anomalies. The trend of IBM rates among patients with extramedullary involvement as the primary site of involvement continued to increase at a rate of 1.3% (95% CI, 0 to 2.7%) during the study period (Supplementary Figure 2, Table 3).
Trends by Geographical Region
A concomitant initial period of substantial and sustained growth in incidence (Supplementary Figure 3, Table 2) and IBM rates (Supplementary Figure 4, Table 3) was observed for all patients from the eastern and northern plains and Pacific coastal regions, followed by a promising decrease in the rate of increase in the trends in the incidence and mortality rates. There was no joinpoint in the trends in the incidence and IBM for patients from the southwest region.
Trends by Subtype
For all subtypes, after undergoing a concomitant initial increase in incidence (Supplementary Figure 5, Table 2), all subtypes transitioned to a non-significant increase in the trend of the incidence rate during the same year. For the WM subtype, the incidence increased at an APC of 95.9% (95% CI, 30.1 to 194.9%) during the period from 1980 to 1998 and then exhibited no significant increase thereafter [APC, 0.4% (95% CI, −0.2 to 1%)]. The incidence of the lymphoplasmacytic lymphoma subtype followed a similar pattern, with no significant increase observed from 1998 to 2016 [APC, 0.2% (95% CI, −1.1 to 1.6%)]. In terms of IBM, the IBM rate of patients with the WM subtype continued to increase, showing a deceleration beginning in 1994 (Supplementary Figure 6, Table 3). Therefore, for patients with the WM subtype, the IBM rate was found to decline 4 years earlier than the incidence rate. The trend of IBM among patients with the lymphoplasmacytic lymphoma subtype continued to rise over the study period, with no change observed.
Survival Analysis
Patients with WM have an overall median survival of 96 months, and their 1-, 5-, and 10-year survival rates are 89.4, 64.4, and 42.2%, respectively. The 5-year survival rate significantly increased from the 1980s to the 2010s (47.84 vs. 69.41%) (Figure 9). In addition, survival was compared between the pre-rituximab and rituximab eras to assess the effects of novel therapies on survival. The patients diagnosed in rituximab era had a better OS than patients diagnosed in the pre-rituximab era (Supplementary Figure 7).
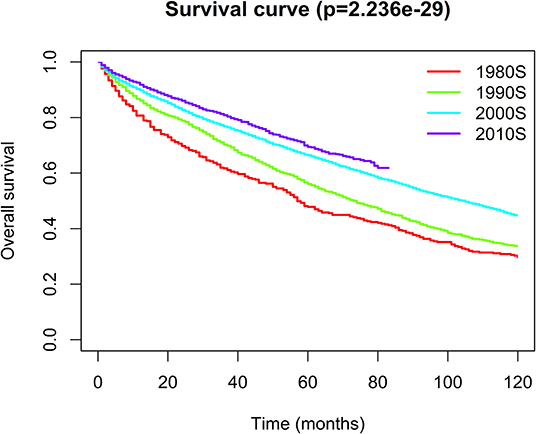
Figure 9. Kaplan–Meier analysis for the overall survival of Waldenström macroglobulinemia. The graph shows increasing survival from the 1980s to 2010s.
Discussion
To the best of our knowledge, the present study is the first to report comprehensive, up-to-date data on the incidence and mortality of WM based on a large population and to evaluate and systematically compare annual trends in the incidence and mortality of WM according to geographic location, race, age, sex, primary site of involvement, and subtype. We found that both the incidence and IBM of WM continued to increase during the study period, and a reduction in the rate of increase occurred around 1993. This finding may be partly supported by 5-year survival analysis, which indicated that there was a dramatic improvement in the 5-year survival rates from the 1980s to 2010s (47.84 vs. 69.41%).
The present projections of the WM incidence trends may play an important role in assessing the risk factors associated with WM incidence and represent a resource for planning and evaluating WM control programs. We observed that the incidence trend of WM showed an initial rapid increase, whereas it began to stabilize from 1993 to 2016, which was consistent with the findings of previous reports (2, 8). The exact mechanism by which a reduction occurred in the WM incidence rate was unclear; however, several reasons may explain this trend. According to an Italian study, hepatitis C virus (HCV) infection is associated with an increased risk of WM (9). However, researchers have not clearly determined whether the decrease in the WM incidence was related to the decrease in HCV prevalence. Additionally, a randomized controlled trial conducted in the USA reported the opposite conclusion that a relationship does not exist between HCV infection and WM (10). Additional studies are needed to explore the relationship and the exact mechanism underlying the correlation between HCV infection and WM incidence. Genetic predisposition is also related to the development of WM. Castillo et al. (11) showed that there was a 20% increased risk of WM in first-degree family members of patients with WM. In addition, McMaster (12) described some studies focused on investigating family clusters of WM, the longest tracking period of which is nearly six decades, which provides the basis and materials for ongoing genetic research to identify genes that predispose an individual to WM. These investigations may help elucidate the host factors underlying WM development and may be helpful for reducing the WM incidence. Another significant cause may be the misdiagnosis of WM. IgM multiple myeloma (MM) is an infrequent subtype of MM, with an estimated prevalence of 0.5% (13, 14). Due to its rarity and similarity to WM, it is difficult to clinically distinguish these two diseases in most cases. Furthermore, the concentration of IgM varies widely in WM, which makes it impossible to distinguish WM from other lymphoproliferative disorders based on a certain concentration (15). However, with advancements in diagnostic techniques, including laboratory examination, bone marrow aspiration, biopsy evaluation, imaging, and real-time allele-specific polymerase chain reaction (AS-PCR) MYD88 L265P-mutated assay (16), more accurate diagnoses of patients with WM can be achieved (17, 18). Specifically, flow immunophenotyping can better distinguish between lymphoid plasma cells and plasma cells (19, 20). More research is needed to fully understand the etiology of WM.
Mortality rates are a less biased measure to reflect the effectiveness of present treatment modalities and quantify improvements in the management of disease. There was a reduction in the rate of increase in IBM from 1994. In line with our results, a previous study from Sweden that included 1,555 patients with WM showed a reduction in mortality in recent years (5). The potential reasons are listed below. (1) Novel agents with high efficiency and low toxicity, such as rituximab, proteasome inhibitors, immunomodulatory drugs, and B-cell receptor inhibitors, might significantly extend progression-free survival (PFS) (21–23). (2) Notable improvements in supportive care, particularly in the management of infections, cardiovascular disease, and WM-related comorbidities (such as hyperviscosity), have significantly reduced treatment-related mortality. (3) The significant improvement in the diagnostic criteria and evolving classification of WM could better distinguish WM from other B-cell tumors (24). (4) A reduction in age-standardized mortality in the United States could be another cause of the decline in WM mortality (25).
The annual WM incidence and IBM rates in men were approximately two times and three times, respectively, those in women in our analysis, which is consistent with previous studies reporting that male sex is related to an increased risk for many hematological malignancies (26). A previous study from Europe reported incidence rates of WM of 0.73 among males and 0.42 among females per 100,000 persons per year (27). Another study from the United States indicated a higher incidence of WM among males (0.34 of 100,000) than among females (0.17 of 100,000) (28). Although the causal etiological mechanisms are unknown, they may include the factors listed below. (1) Environmental and occupational exposure factors, lifestyle, and health awareness may contribute to the difference (29). (2) A higher response rate to rituximab has been observed in females than in males (30–32). (3) Females produce more vigorous humoral and cellular immune responses than males (33) and have stronger resistance to certain infections, thus reducing infection-related mortality.
We observed a steep increase in the incidence rate with advancing age, which is in line with a multistep carcinogenesis model characterized previously (34). A retrospective study also showed a significantly increased risk of WM with age from 1988 to 2007 (2). The reasons might include the following: (1) Immune senescence and increased risk of chronic inflammation with age may be the main reason for this finding (35, 36). (2) Increased age might mean that when patients exposed to immunotherapy and/or chemotherapy, they might have more protracted stimulation by antigenic agents. A higher affinity for self-antigens may exist in some of the clones selected during homeostatic proliferation and could result in older individuals' autoreactivity (37). (3) With age, the genes involved in malignancies and inflammatory and stress responses (38) are upregulated, while genes associated with lymphoid specificity and function are downregulated (39). (4) With age, the bone marrow structure changes significantly, which contributes to the pathogenesis of many blood diseases (40).
The annual WM incidence rate was higher among white patients (0.52 of 100,000) than among black patients (0.29 of 100,000) and patients in other racial groups (0.30 of 100,000), which is consistent with the findings of previous studies (2). There are significantly different incidence rates of monoclonal gammopathy of unknown significance (MGUS) among different races. IgM MGUS has a lower incidence in black patients than in patients of other races, which might explain the decreased incidence of WM seen in these patients (41).
Geographic region-specific incidence and IBM rates could provide important information on the epidemiological features of cancer. We found that the southwest was the only region where no promising downward trend of incidence and IBM was noted in recent years. One possible cause may be poor quality healthcare delivery systems in this region, leading to delays in the diagnosis, misdiagnosis, and a lack of access to novel therapies. Another possible reason for this phenomenon may be the different cultural beliefs, lifestyle, low-income economic status, health awareness, environmental factors, and occupational exposure factors in this region. In addition, the small number of patients in the area may hinder the discovery of a significant decrease in mortality.
Some limitations based on the information available in the SEER database must be noted. First, the information regarding individual-level factors (e.g., alcohol use, occupation, smoking status, environmental exposure, medical history, and family history) is unavailable in SEER, which may be related to incidence and mortality rates. Second, the information about details of the therapy (e.g., the type, dosage, and duration) is limited. Therefore, we could not assess the impact of treatment on the incidence and mortality trends. Third, some results were based on minor numbers of cases or deaths. Monitoring the incidence and mortality rates of WM over time will provide a better understanding of whether the observed trends persist.
Conclusions
We found that WM incidence and IBM continued to increase for decades, but a promising downward trend has occurred in recent years. The trend of incidence and mortality differs significantly according to geographic location, race, age, sex, primary site of involvement, and subtype, which may help in further investigations into the specific etiology. Moreover, a dramatic increase in the 5-year survival rate was observed from the 1980s to 2010s (47.84% vs. 69.41%). These findings could provide significant information for understanding the cause of cancer, identifying high-risk populations and developing cancer prevention and intervention strategies to decrease WM-associated morbidity and mortality.
Data Availability Statement
Publicly available datasets were analyzed in this study. This data can be found here: Surveillance, Epidemiology, and End Results (SEER) database (https://seer.cancer.gov/seerstat/).
Author Contributions
XY collected and analyzed the data and wrote the paper. LC, FF, HY, YZ, and ZH researched the literature and revised the paper. CS and YH conceived and designed the study, analyzed the data, and wrote the paper. All authors reviewed the paper and approved the final manuscript.
Funding
This work was supported by grants from the National Natural Science Foundation of China (Nos. 81670197 and 81974007 for CS) and the Clinical Research Physician Program of Tongji Medical College, HUST (for CS).
Conflict of Interest
The authors declare that the research was conducted in the absence of any commercial or financial relationships that could be construed as a potential conflict of interest.
Acknowledgments
We would like to thank the researchers and study participants for their contributions.
Supplementary Material
The Supplementary Material for this article can be found online at: https://www.frontiersin.org/articles/10.3389/fonc.2020.01712/full#supplementary-material
Supplementary Figure 1. Trends in the annual incidence of Waldenström macroglobulinemia in patients stratified according to the primary site of involvement.
Supplementary Figure 2. Trends in the annual incidence-based mortality of Waldenström macroglobulinemia in patients stratified according to the primary site of involvement.
Supplementary Figure 3. Trends in the annual incidence of Waldenström macroglobulinemia in patients stratified according to the geographical region.
Supplementary Figure 4. Trends in the annual incidence-based mortality of Waldenström macroglobulinemia in patients stratified according to the geographical region.
Supplementary Figure 5. Trends in the annual incidence of Waldenström macroglobulinemia in patients stratified according to the subtype recode.
Supplementary Figure 6. Trends in the annual incidence-based mortality of Waldenström macroglobulinemia in patients stratified according to the subtype recode.
Supplementary Figure 7. Kaplan–Meier analysis for Waldenström macroglobulinemia in patients stratified according to the era in which the diagnosis was recorded.
Abbreviations
WM, Waldenström macroglobulinemia; NHL, non-Hodgkin lymphoma; LPL, lymphoplasmacytic lymphoma; SEER, Surveillance Epidemiology and End Results database; OS, overall survival; CI, confidence interval; APC, annual percentage change; AAPC, average annual percentage change; IBM, incidence-based mortality.
References
1. Sabattini E, Bacci F, Sagramoso C, Pileri SA. WHO classification of tumours of haematopoietic and lymphoid tissues in 2008: an overview. Pathologica. (2010) 102:83–7. Available online at: https://www.crossref.org/guestquery/
2. Wang H, Chen Y, Li F, Delasalle K, Wang J, Alexanian R, et al. Temporal and geographic variations of Waldenstrom macroglobulinemia incidence: a large population-based study. Cancer. (2012) 118:3793–800. doi: 10.1002/cncr.26627
3. Castillo JJ, Olszewski AJ, Cronin AM, Hunter ZR, Treon SP. Survival trends in Waldenstrom macroglobulinemia: an analysis of the surveillance, epidemiology and end results database. Blood. (2014) 123:3999–4000. doi: 10.1182/blood-2014-05-574871
4. Kastritis E, Kyrtsonis MC, Hatjiharissi E, Symeonidis A, Michalis E, Repoussis P, et al. No significant improvement in the outcome of patients with Waldenstrom's macroglobulinemia treated over the last 25 years. Am J Hematol. (2011) 86:479–83. doi: 10.1002/ajh.22027
5. Kristinsson SY, Eloranta S, Dickman PW, Andersson TM, Turesson I, Landgren O, et al. Patterns of survival in lymphoplasmacytic lymphoma/Waldenstrom macroglobulinemia: a population-based study of 1,555 patients diagnosed in Sweden from 1980 to 2005. Am J Hematol. (2013) 88:60–5. doi: 10.1002/ajh.23351
6. Castillo JJ, Olszewski AJ, Kanan S, Meid K, Hunter ZR, Treon SP. Overall survival and competing risks of death in patients with Waldenstrom macroglobulinaemia: an analysis of the Surveillance, Epidemiology and End Results database. Br J Haematol. (2015) 169:81–9. doi: 10.1111/bjh.13264
7. Link BK, Brooks J, Wright K, Pan X, Voelker M, Chrischilles E. Diffuse large B-cell lymphoma in the elderly: diffusion of treatment with rituximab and survival advances with and without anthracyclines. Leuk Lymphoma. (2011) 52:994–1002. doi: 10.3109/10428194.2011.557167
8. Sekhar J, Sanfilippo K, Zhang Q, Trinkaus K, Vij R, Morgensztern D. Waldenstrom macroglobulinemia: a surveillance, epidemiology, and end results database review from 1988 to 2005. Leuk Lymphoma. (2012) 53:1625–6. doi: 10.3109/10428194.2012.656103
9. Mussini C, Ghini M, Mascia MT, Giovanardi P, Zanni G, Lattuada I, et al. Monoclonal gammopathies and hepatitis C virus infection. Blood. (1995) 85:1144–5. doi: 10.1182/blood.V85.4.1144.bloodjournal8541144
10. Leleu X, O'Connor K, Ho AW, Santos DD, Manning R, Xu L, et al. Hepatitis C viral infection is not associated with Waldenström's macroglobulinemia. Am J Hematol. (2007) 82:83–4. doi: 10.1002/ajh.20724
11. Castillo JJ, Olszewski AJ, Hunter ZR, Kanan S, Meid K, Treon SP. Incidence of secondary malignancies among patients with Waldenstrom macroglobulinemia: an analysis of the SEER database. Cancer. (2015) 121:2230–6. doi: 10.1002/cncr.29334
12. McMaster ML. Familial waldenström macroglobulinemia: families informing populations. Hematol Oncol Clin North Am. (2018) 32:787–809. doi: 10.1016/j.hoc.2018.05.006
13. Kyle RA, Gertz MA, Witzig TE, Lust JA, Lacy MQ, Dispenzieri A, et al. Review of 1027 patients with newly diagnosed multiple myeloma. Mayo Clin Proc. (2003) 78:21–33. doi: 10.4065/78.1.21
14. Castillo JJ, Jurczyszyn A, Brozova L, Crusoe E, Czepiel J, Davila J, et al. IgM myeloma: a multicenter retrospective study of 134 patients. Am J Hematol. (2017) 92:746–51. doi: 10.1002/ajh.24753
15. Owen RG, Treon SP, Al-Katib A, Fonseca R, Greipp PR, McMaster ML, et al. Clinicopathological definition of Waldenstrom's macroglobulinemia: consensus panel recommendations from the Second International Workshop on Waldenstrom's Macroglobulinemia. Semin Oncol. (2003) 30:110–5. doi: 10.1053/sonc.2003.50082
16. Xu L, Hunter ZR, Yang G, Zhou Y, Cao Y, Liu X, et al. MYD88 L265P in Waldenstrom macroglobulinemia, immunoglobulin M monoclonal gammopathy, and other B-cell lymphoproliferative disorders using conventional and quantitative allele-specific polymerase chain reaction. Blood. (2013) 121:2051–8. doi: 10.1182/blood-2013-05-502211
17. Castillo JJ, Treon SP. Initial Evaluation of the Patient with Waldenstrom Macroglobulinemia. Hematol Oncol Clin North Am. (2018) 32:811–20. doi: 10.1016/j.hoc.2018.05.008
18. Maqbool MG, Tam CS, Morison IM, Simpson D, Mollee P, Schneider H, et al. A practical guide to laboratory investigations at diagnosis and follow up in Waldenstrom macroglobulinaemia: recommendations from the Medical and Scientific Advisory Group, Myeloma Australia, the Pathology Sub-committee of the Lymphoma and Related Diseases Registry and the Australasian Association of Clinical Biochemists Monoclonal Gammopathy Working Group. Pathology. (2020) 52:167–78. doi: 10.1016/j.pathol.2019.11.002
19. Gascue A, Merino J, Paiva B. Flow cytometry. Hematol Oncol Clin North Am. (2018) 32:765–75. doi: 10.1016/j.hoc.2018.05.004
20. Paulus A, Chitta KS, Wallace PK, Advani PP, Akhtar S, Kuranz-Blake M, et al. Immunophenotyping of Waldenstroms macroglobulinemia cell lines reveals distinct patterns of surface antigen expression: potential biological and therapeutic implications. PLoS ONE. (2015) 10:e0122338. doi: 10.1371/journal.pone.0122338
21. Treon SP. How i treat Waldenstrom macroglobulinemia. Blood. (2009) 114:2375–85. doi: 10.1182/blood-2009-05-174359
22. Treon SP, Ioakimidis L, Soumerai JD, Patterson CJ, Sheehy P, Nelson M, et al. Primary therapy of Waldenstrom macroglobulinemia with bortezomib, dexamethasone, and rituximab: WMCTG clinical trial 05-180. J Clin Oncol. (2009) 27:3830–5. doi: 10.1200/JCO.2008.20.4677
23. Treon SP, Tripsas CK, Meid K, Kanan S, Sheehy P, Chuma S, et al. Carfilzomib, rituximab, and dexamethasone (CaRD) treatment offers a neuropathy-sparing approach for treating Waldenstrom's macroglobulinemia. Blood. (2014) 124:503–10. doi: 10.1182/blood-2014-03-566273
24. Owen RG. Developing diagnostic criteria in Waldenstrom's macroglobulinemia. Semin Oncol. (2003) 30:196–200. doi: 10.1053/sonc.2003.50069
25. Xu J, Murphy SL, Kochanek KD, Bastian BA. Deaths: final data for 2013. Natl Vital Stat Rep. (2016) 64:1–119. Available online at: https://www.crossref.org/guestquery/
26. Cook MB, Dawsey SM, Freedman ND, Inskip PD, Wichner SM, Quraishi SM, et al. Sex disparities in cancer incidence by period and age. Cancer Epidemiol Biomarkers Prev. (2009) 18:1174–82. doi: 10.1158/1055-9965.EPI-08-1118
27. Phekoo KJ, Jack RH, Davies E, Moller H, Schey SA. The incidence and survival of Waldenstrom's Macroglobulinaemia in South East England. Leuk Res. (2008) 32:55–9. doi: 10.1016/j.leukres.2007.02.002
28. Groves FD, Travis LB, Devesa SS, Ries LA, Fraumeni JF Jr. Waldenstrom's macroglobulinemia: incidence patterns in the United States, 1988-1994. Cancer. (1998) 82:1078–81. doi: 10.1002/(SICI)1097-0142(19980315)82:6<1078::AID-CNCR10>3.0.CO;2-3
29. Costas L, de Sanjose S, Infante-Rivard C. Reproductive factors and non-Hodgkin lymphoma: a systematic review. Crit Rev Oncol Hematol. (2014) 92:181–93. doi: 10.1016/j.critrevonc.2014.07.004
30. Ngo L, Hee SW, Lim LC, Tao M, Quek R, Yap SP, et al. Prognostic factors in patients with diffuse large B cell lymphoma: before and after the introduction of rituximab. Leuk Lymphoma. (2008) 49:462–9. doi: 10.1080/10428190701809156
31. Riihijarvi S, Taskinen M, Jerkeman M, Leppa S. Male gender is an adverse prognostic factor in B-cell lymphoma patients treated with immunochemotherapy. Eur J Haematol. (2011) 86:124–8. doi: 10.1111/j.1600-0609.2010.01541.x
32. Pfreundschuh M, Schubert J, Ziepert M, Schmits R, Mohren M, Lengfelder E, et al. Six versus eight cycles of bi-weekly CHOP-14 with or without rituximab in elderly patients with aggressive CD20+ B-cell lymphomas: a randomised controlled trial (RICOVER-60). Lancet Oncol. (2008) 9:105–16. doi: 10.1016/S1470-2045(08)70002-0
33. Bouman A, Heineman MJ, Faas MM. Sex hormones and the immune response in humans. Hum Reprod Update. (2005) 11:411–23. doi: 10.1093/humupd/dmi008
34. Armitage P, Doll R. The age distribution of cancer and a multi-stage theory of carcinogenesis. Br J Cancer. (2004) 91:1983–9. doi: 10.1038/sj.bjc.6602297
35. Boren E, Gershwin ME. Inflamm-aging: autoimmunity, and the immune-risk phenotype. Autoimmun Rev. (2004) 3:401–6. doi: 10.1016/j.autrev.2004.03.004
36. Murata M. Inflammation and cancer. Environ Health Prev Med. (2018) 23:50. doi: 10.1186/s12199-018-0740-1
37. Goronzy JJ, Weyand CM. Immune aging and autoimmunity. Cell Mol Life Sci. (2012) 69:1615–23. doi: 10.1007/s00018-012-0970-0
38. Chambers SM, Shaw CA, Gatza C, Fisk CJ, Donehower LA, Goodell MA. Aging hematopoietic stem cells decline in function and exhibit epigenetic dysregulation. PLoS Biol. (2007) 5:e201. doi: 10.1371/journal.pbio.0050201
39. Pang WW, Price EA, Sahoo D, Beerman I, Maloney WJ, Rossi DJ, et al. Human bone marrow hematopoietic stem cells are increased in frequency and myeloid-biased with age. Proc Natl Acad Sci USA. (2011) 108:20012–7. doi: 10.1073/pnas.1116110108
40. Hellmich C, Moore JA, Bowles KM, Rushworth SA. Bone Marrow Senescence and the Microenvironment of Hematological Malignancies. Front Oncol. (2020) 10:230. doi: 10.3389/fonc.2020.00230
Keywords: waldenström macroglobulinemia, surveillance, epidemiology, and end results (SEER), incidence, incidence-based mortality, epidemiology, survival
Citation: Yin X, Chen L, Fan F, Yan H, Zhang Y, Huang Z, Sun C and Hu Y (2020) Trends in Incidence and Mortality of Waldenström Macroglobulinemia: A Population-Based Study. Front. Oncol. 10:1712. doi: 10.3389/fonc.2020.01712
Received: 08 June 2020; Accepted: 31 July 2020;
Published: 10 September 2020.
Edited by:
María-Victoria Mateos, University Hospital of Salamanca, SpainReviewed by:
Jorge Castillo, Dana–Farber Cancer Institute, United StatesSalomon Manier, Université de Lille, France
Copyright © 2020 Yin, Chen, Fan, Yan, Zhang, Huang, Sun and Hu. This is an open-access article distributed under the terms of the Creative Commons Attribution License (CC BY). The use, distribution or reproduction in other forums is permitted, provided the original author(s) and the copyright owner(s) are credited and that the original publication in this journal is cited, in accordance with accepted academic practice. No use, distribution or reproduction is permitted which does not comply with these terms.
*Correspondence: Chunyan Sun, c3VuY3kwNjE4QDE2My5jb20=; Yu Hu, ZHJfaHV5dUAxMjYuY29t