 Zhiheng Cheng1,2,3†
 Yifeng Dai2†Wenhui Huang1,3Qingfu Zhong1,3Pei Zhu1,3Wenjuan Zhang1,3Zhihua Wu1,3Qing Lin1,3Huoyan Zhu1,3Longzhen Cui4Tingting Qian1,3Cong Deng5
 Lin Fu1,3,6,7*Yan Liu4*Tiansheng Zeng1,3*
- 1Department of Hematology, The Second Affiliated Hospital of Guangzhou Medical University, Guangzhou, China
- 2Department of Pathology and Medical Biology, University of Groningen, University Medical Center Groningen, Groningen, Netherlands
- 3Translational Medicine Center, State Key Laboratory of Respiratory Disease, The Second Affiliated Hospital of Guangzhou Medical University, Guangzhou, China
- 4Translational Medicine Center, Huaihe Hospital of Henan University, Kaifeng, China
- 5Department of Clinical laboratory, The Second Affiliated Hospital of Guangzhou Medical University, Guangzhou, China
- 6Department of Hematology, Huaihe Hospital of Henan University, Kaifeng, China
- 7Guangdong Provincial Education Department Key Laboratory of Nano-Immunoregulation Tumor Microenvironment, The Second Affiliated Hospital, Guangzhou Medical University, Guangzhou, China
Acute myeloid leukemia (AML) is a highly heterogeneous disease that requires fine-grained risk stratification for the best prognosis of patients. As a class of small non-coding RNAs with important biological functions, microRNAs play a crucial role in the pathogenesis of AML. To assess the prognostic impact of miR-20b on AML in the presence of other clinical and molecular factors, we screened 90 AML patients receiving chemotherapy only and 74 also undergoing allogeneic hematopoietic stem cell transplantation (allo-HSCT) from the Cancer Genome Atlas (TCGA) database. In the chemotherapy-only group, high miR-20b expression subgroup had shorter event-free survival (EFS) and overall survival (OS, both P < 0.001); whereas, there were no significant differences in EFS and OS between high and low expression subgroups in the allo-HSCT group. Then we divided all patients into high and low expression groups based on median miR-20b expression level. In the high expression group, patients treated with allo-HSCT had longer EFS and OS than those with chemotherapy alone (both P < 0.01); however, there were no significant differences in EFS and OS between different treatment subgroups in the low expression group. Further analysis showed that miR-20b was negatively correlated with genes in “ribosome,” “myeloid leukocyte mediated immunity,” and “DNA replication” signaling pathways. ORAI2, the gene with the strongest correlation with miR-20b, also had significant prognostic value in patients undergoing chemotherapy but not in the allo-HSCT group. In conclusion, our findings suggest that high miR-20b expression is a poor prognostic indicator for AML, but allo-HSCT may override its prognostic impact.
Introduction
Acute myeloid leukemia (AML) is a clinically and genetically heterogeneous disease characterized by dysplasia and dysdifferentiation of primitive and immature myeloid cells in bone marrow and peripheral blood (1). The treatment and prognosis of AML patients are still very heterogeneous, although the French-American-British (FAB) classification based on cell morphology and immunology and the World Health Organization (WHO) classification based on cytogenetics have continuously refined AML. The development of molecular genetics also provides new prognostic markers for AML, such as NPM1 mutation without FLT3-ITD and double CEBPA mutations are proved to be good prognostic indicators, while FLT3-ITD, ASXL1, RUNX1 and TP53 mutations are poor prognostic factors (2). In addition, altered gene expression is associated with the prognosis and may guide the treatment of AML patients. We found that AML patients with high expression of FHL2, DDIT4, GOT1 and iASPP tend to have shorter survival, while those with high expression of PAK2 and DOK7 have better outcomes (3–7). The role of epigenetics, which does not involve changes in DNA sequence, in leukemogenesis is of increasing concern.
MicroRNAs (miRNAs) is a kind of small noncoding RNAs (about 20–24 nucleotides), which play an important role in post transcriptional gene regulation through inhibiting target messenger RNAs (mRNAs) (8). From exploring the expression patterns of miRNAs in specific AML to gradually clarifying miRNAs as oncomiRNAs or tumor suppressors in many AML subtypes, the roles of miRNAs have become increasingly clear in leukemic processes, including differentiation, proliferation, self-renewal, survival, epigenetic regulation, and chemotherapy resistance (9–11). MiRNAs affect the development and progression of leukemia by directly targeting the mRNAs of known oncogenes or tumor suppressors or by cooperating with these proteins. Especially, miRNA profiles have proved to be a useful complement to AML prognostication. For instance, overexpression of miR-98 is associated with better outcome in AML patients receiving chemotherapy (12); high miR-99a expression and low miR-29 and miR-212 expression are reported as adverse prognostic indicators in AML (13–15). Moreover, it has been demonstrated that some pharmacologic agents can modulate specific miRNAs to achieve antileukemic effects (8), suggesting that miRNA expression signature may help to guide the complex treatment selection of AML.
MiR-20b belongs to the miR-106a-363 cluster, which forms a large and highly similar miRNA family with miR-106b-25 and miR-17-92 clusters, known as the miR-17 family (16). MiR-20b is upregulated and affects disease progression in many kinds of human cancers, such as breast cancer, gastric cancer, prostate cancer and non−small cell lung cancer. For instance, miR-20b can negatively regulate autophagy by targeting RB1CC1/FIP200 in breast cancer cells (17). Another study showed that the survival is significantly poorer in gastric cancer patients with high miR-20b expression than those without (18). Guo J et al. found that miR-20b promotes cellular proliferation and migration through directly regulating PTEN in prostate cancer (19). However, the indicative value of miR-20b in the prognosis and treatment of AML remains unclear. As an effective treatment, allogeneic hematopoietic stem cell transplantation (allo-HSCT) can reduce the recurrence of AML and promote survival by significantly reducing the residual disease of leukemia (20). Here, we analyzed the prognostic value and possible mechanism of miR-20b in AML, and delineated the treatment effect of allo-HSCT in AML patients with high miR-20b expression.
Materials and Methods
Patients
We collected 164 AML patients with miR-20b expression data and complete clinical information from the Cancer Genome Atlas (TCGA) database (https://tcga-data.nci.nih.gov/tcga) (21), of whom 90 patients received chemotherapy only and another 74 also received allo-HSCT. The main chemotherapy regimen for all patients is 7 + 3 (“7” refers to Cytarabine given daily for 7 days, “3” refers to Idarubicin given daily for 3 days). We obtained miR-20b expression data in peripheral blood of all patients at diagnosis. Clinical information at diagnosis, including age, sex, white blood cell (WBC) count, percentages of bone marrow (BM) and peripheral blood (PB) blasts, French-American-British (FAB) subtype, karyotype, risk stratification, and recurrent gene mutations, were described and analyzed. Overall survival (OS) and event-free survival (EFS) were the goal endpoints of this study. OS is defined as the time from diagnosis to death or loss of follow-up. EFS is defined as the time from diagnosis to removal from the study due to no complete remission, relapse, death or loss of follow-up.
Statistical Analysis
Descriptive statistical methods were used to summarize the clinical and molecular characteristics of the patients. Continuous data were expressed by median with range, and categorical data were represented by frequency with percentage. Mann-Whitney U test and chi-square test were used for the comparison of numerical data and categorical data, respectively. Univariate (Kaplan-Meier method and log-rank test) and multivariate (Cox proportional risk model) analyses were used to assess whether miR-20b expression could predict EFS and OS. Spearman correlation analysis was used to screen gene expression profiles related to miR-20b. Then we used miRcode (http://www.mircode.org/index.php) to predict the target genes of miR-20b and intersected them with the related genes. Finally, we used Metascape (http://metascape.org/) to perform pathway enrichment analysis of intersection genes. We also did a survival analysis on the gene with the strongest correlation with miR-20b, and used another independent cohort (GSE12417) for further verification. A two-tailed P < 0.05 was defined as statistically significant. The SPSS 25.0 statistical software and R 3.5.0 software were used for statistical analyses, and the graphics were drawn by GraphPad Prism 8.0 software.
Results
Comparison of Clinical and Molecular Characteristics of High and Low miR-20b Expression Subgroups in Different Treatment Groups
All patients were divided into the chemotherapy-only group and the allo-HSCT group based on treatment modalities. Each group was further divided into high and low expression subgroups according to their respective median miR-20b expression levels. Comparison of clinical and molecular characteristics between the high and low expression subgroups in different treatment groups is shown in Table 1.
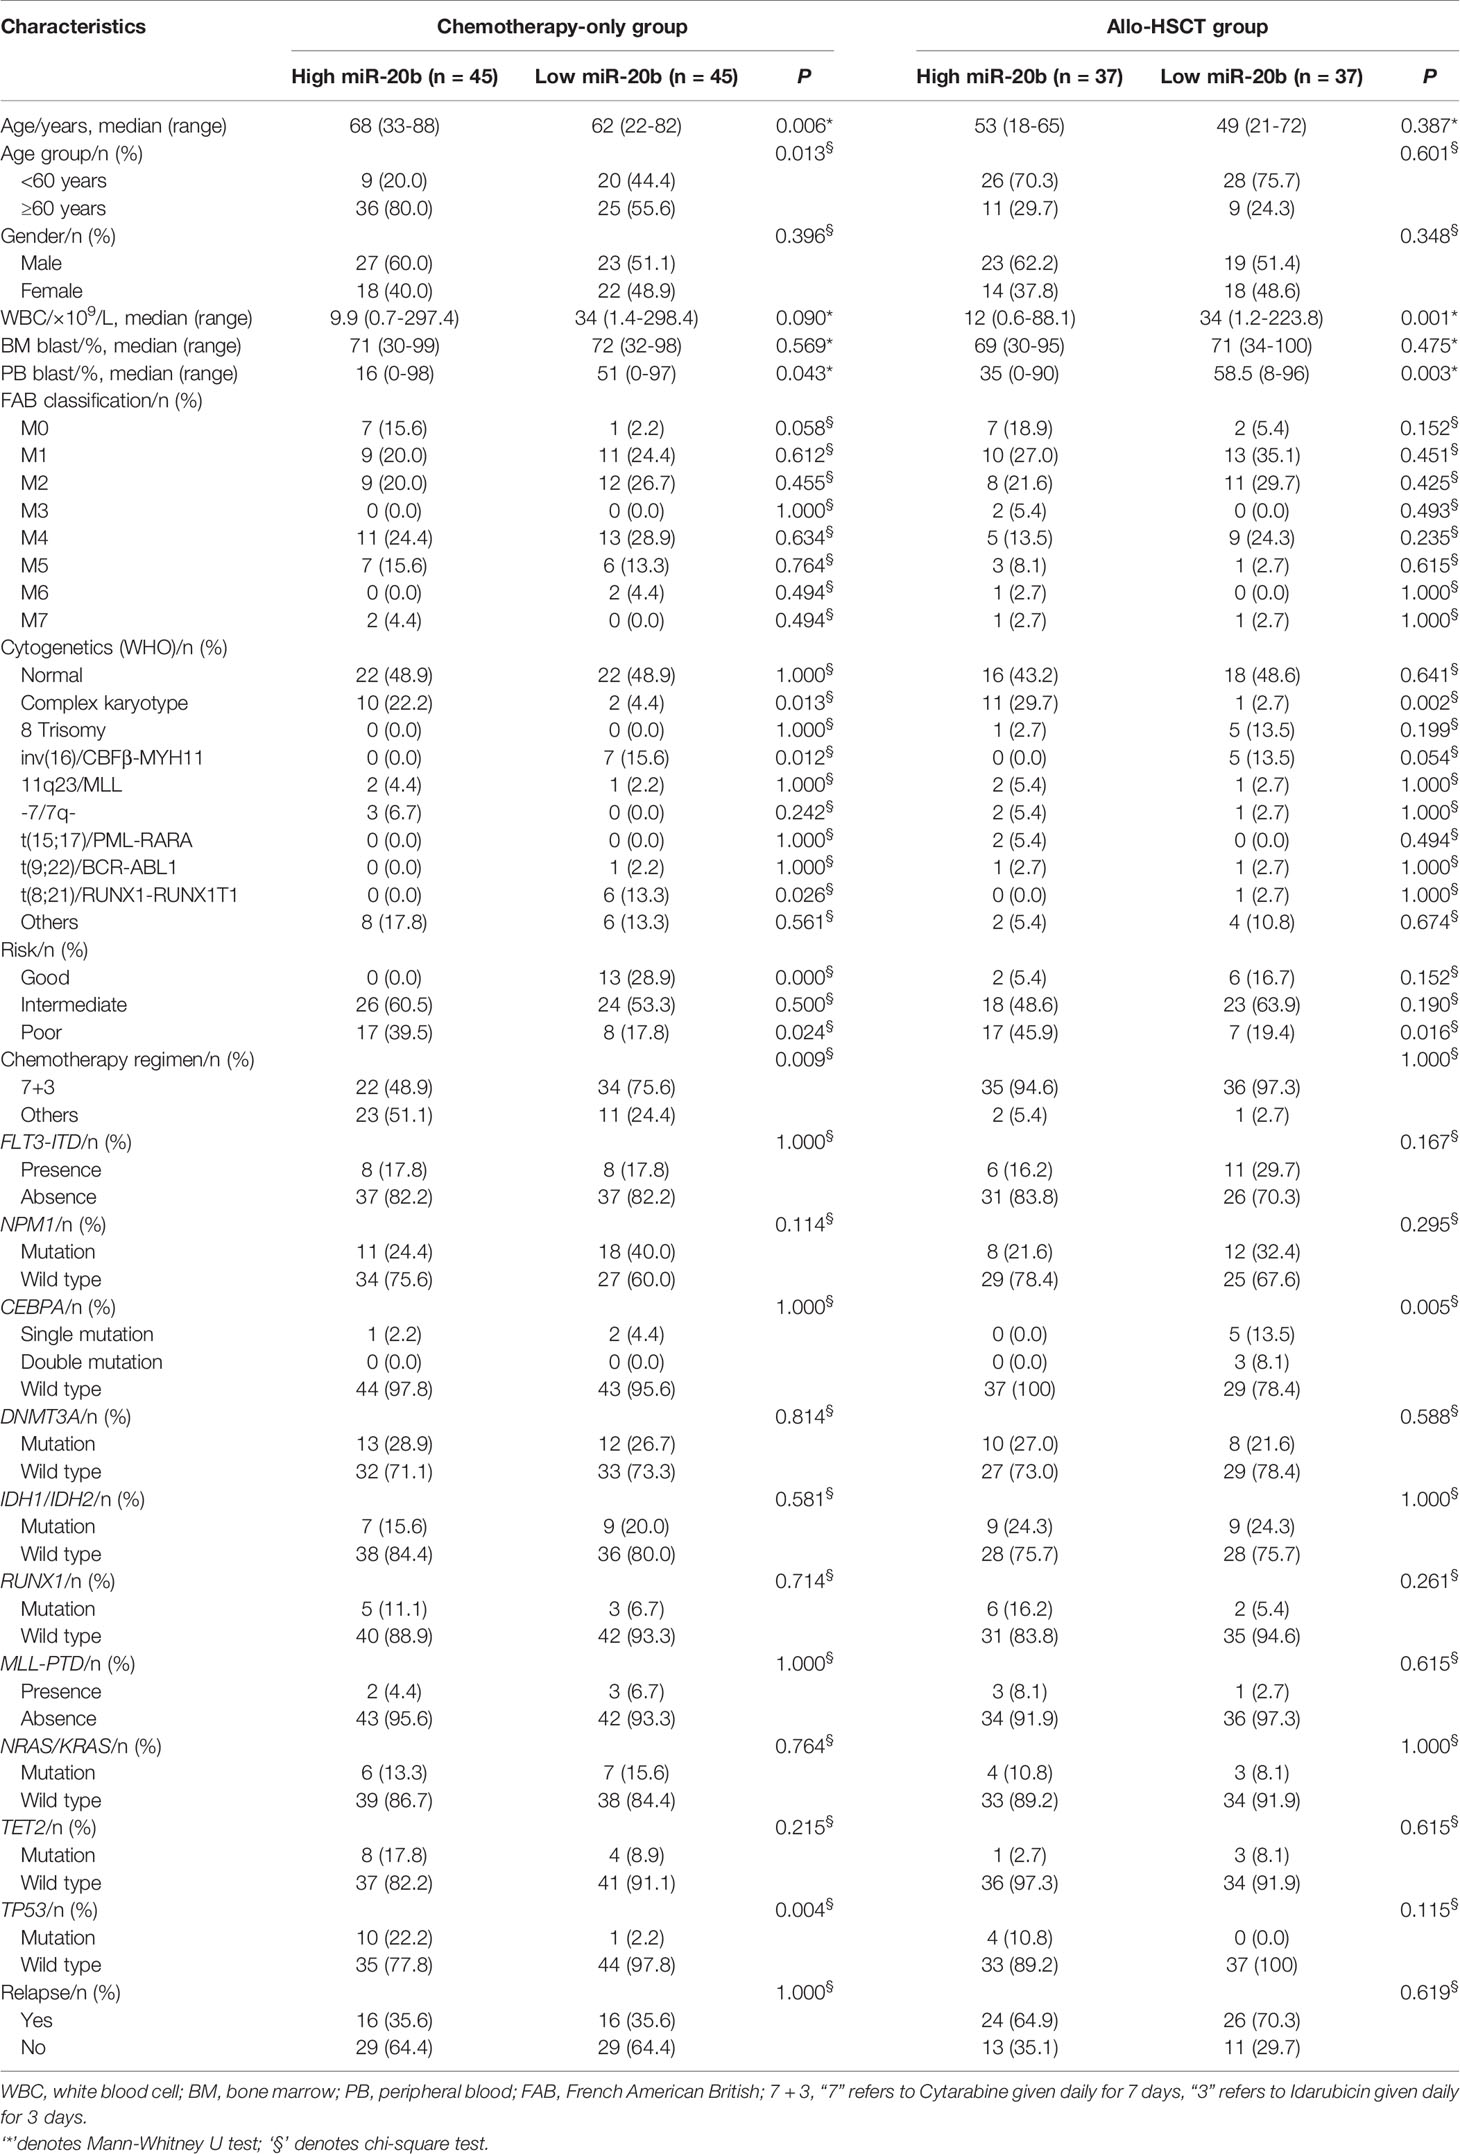
Table 1 Clinical and molecular characteristics of patients in different treatment groups.
In the chemotherapy-only group, high miR-20b expression subgroup had more old patients (≥60 years, P = 0.013), lower percentage of PB blasts (P = 0.043), more patients with complex karyotype (P = 0.013), fewer patients with RUNX1-RUNX1T1 (P = 0.026) and CBFβ-MYH11 (P = 0.012), more poor-risk patients (P = 0.024), fewer good-risk patients (P < 0.001), and more frequent TP53 mutation (P = 0.004) than low expression subgroup. A higher proportion of “7+3” chemotherapy regimen in the low expression subgroup (P = 0.009). There were no significant differences in gender ratio, WBC count, BM blasts, FAB and other WHO classification, relapse rate, and frequency of other common gene mutations (FLT3-ITD, CEBPA, DNMT3A, NPM1, RUNX1, IDH1/IDH2, NRAS/KRAS, TET2 and MLL-PTD) between the two subgroups.
In the allo-HSCT group, high miR-20b expression subgroup had lower WBC count (P = 0.001) and percentage of PB blasts (P = 0.003), more patients with complex karyotype (P = 0.002), more poor-risk patients (P = 0.016), and less frequent CEBPA mutation (P = 0.005) than low expression subgroup. There were no significant differences in age, gender ratio, BM blasts, FAB and other WHO classification, chemotherapy regimen before transplantation (mainly “7+3”), relapse rate, and frequency of other common gene mutations (FLT3-ITD, TP53, NPM1, DNMT3A, RUNX1, IDH1/IDH2, NRAS/KRAS, TET2 and MLL-PTD) between the two subgroups.
Prognostic Significance of miR-20b in AML
We found that patients with high miR-20b expression had shorter EFS and OS than those with low expression in the chemotherapy-only group (both P < 0.001, Figures 1A, B); whereas, there were no significant differences in EFS and OS between high and low expression subgroups in the allo-HSCT group (Figures 1C, D).
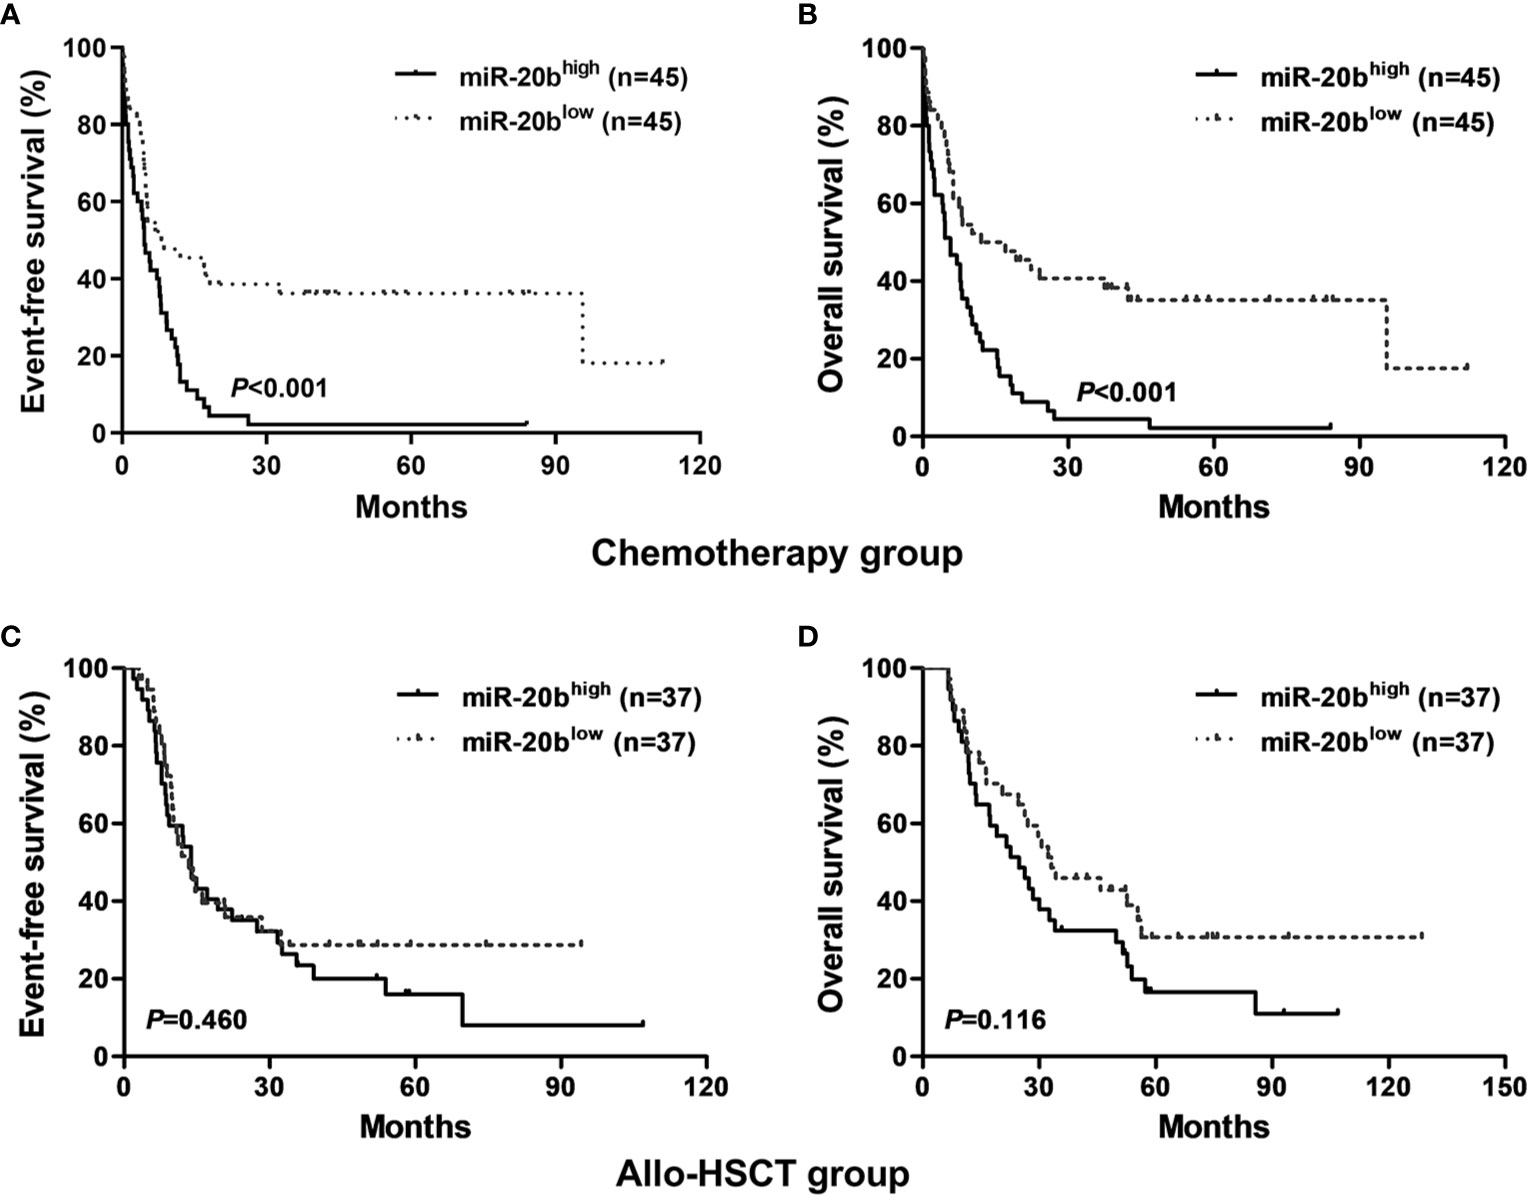
Figure 1 Kaplan-Meier curves of event-free survival (EFS) and overall survival (OS) in the chemotherapy-only and allo-HSCT groups. (A, B) In the chemotherapy-only group, high miR-20b expressers had shorter EFS and OS than low expressers. (C, D) In the allo-HSCT group, EFS and OS were not significantly different between high and low miR-20b expressers.
In the entire cohort, patients treated with allo-HSCT had longer EFS and OS than those with chemotherapy alone in the high expression group (both P < 0.01, Figures 2C, D); however, there were no significant differences in EFS and OS between different treatment subgroups in the low expression group (Figures 2A, B).
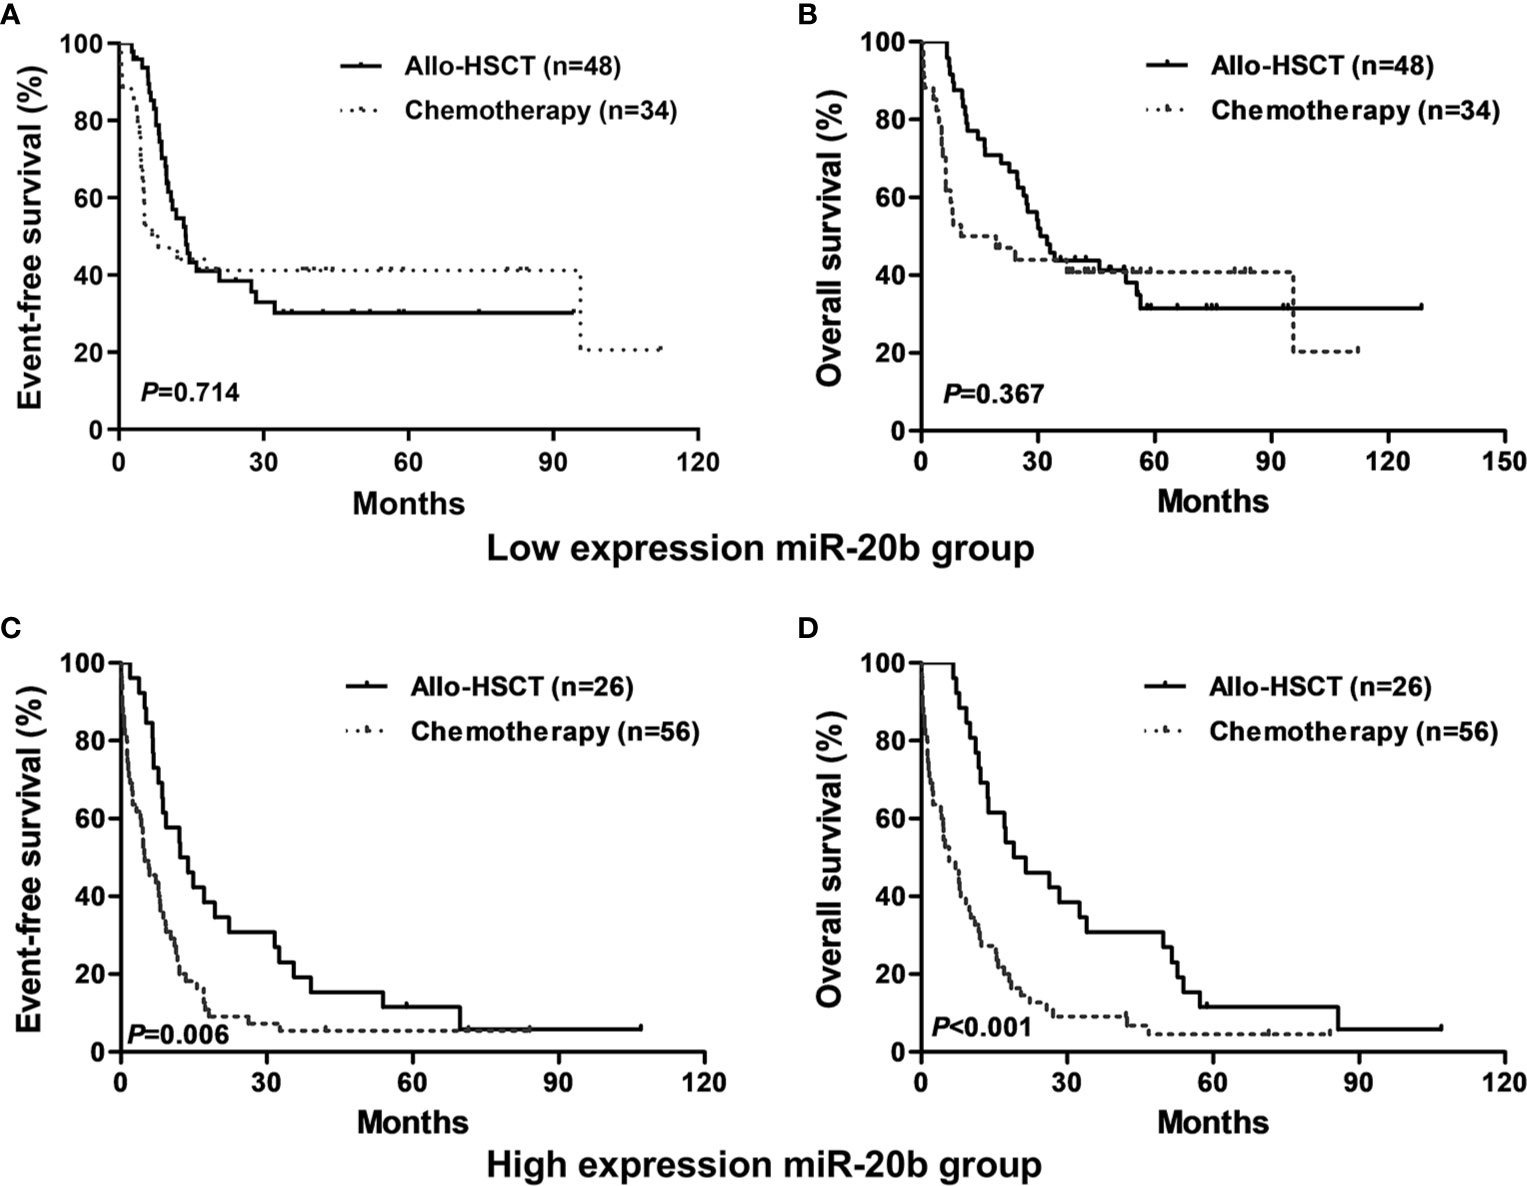
Figure 2 Kaplan-Meier curves of event-free survival (EFS) and overall survival (OS) in high and low miR-20b expression groups. (A, B) In low miR-20b expressers, EFS and OS were not significantly different between patients treated with chemotherapy-only and allo-HSCT. (C, D) In high miR-20b expressers, patients treated with allo-HSCT had longer EFS and OS than those underwent chemotherapy-only.
Univariate and Multivariate Analyses in Different Treatment Groups
To evaluate the prognostic value of miR-20b expression in the presence of other clinical and molecular factors, we included the following dichotomous variables in univariate and multivariate Cox regression analyses: miR-20b expression levels (high vs. low), WBC count (≥20 vs. <20 × 109/L), FLT3-ITD (positive vs. negative), and three common gene mutations (NPM1, DNMT3A and TP53; mutated vs. wild).
In the chemotherapy-only group (Table 2), univariate Cox regression analysis showed that high miR-20b expression had adverse effect on EFS and OS (both P < 0.001), and that TP53 mutation contributed to poor OS and EFS (both P < 0.01); multivariate Cox regression analysis indicated that high miR-20b expression and TP53 mutation were independent risk factors for OS and EFS even in the presence of other covariates (all P < 0.05).
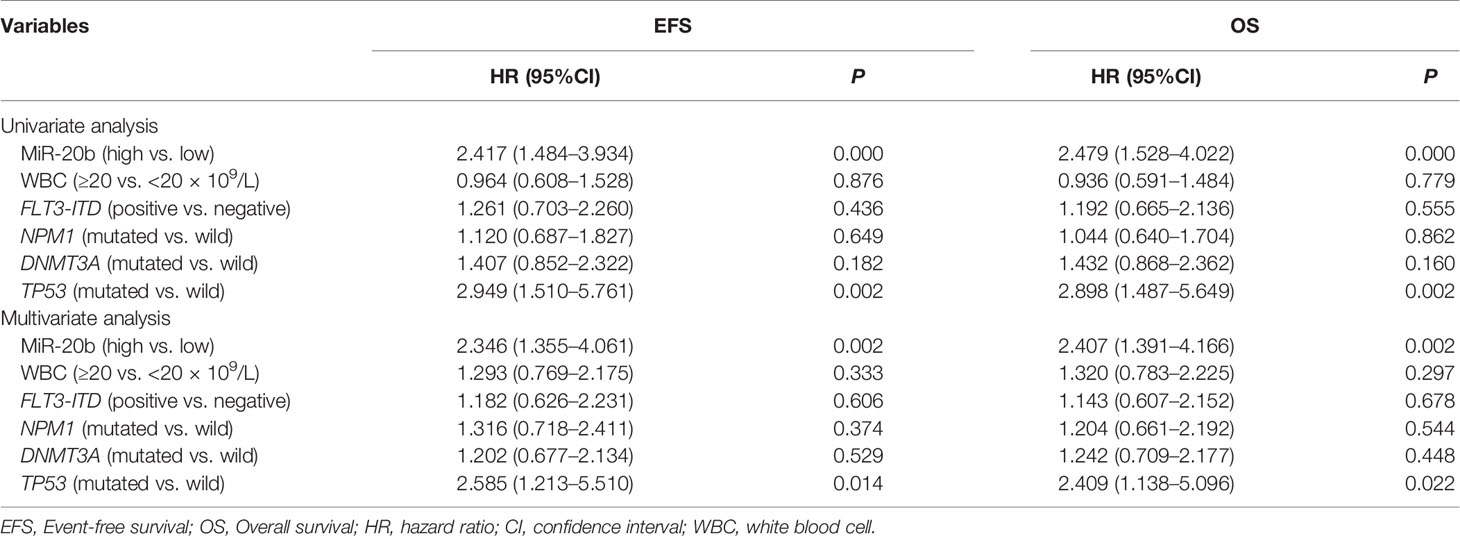
Table 2 Univariate and multivariate analyses of EFS and OS in the chemotherapy-only group.
In the allo-HSCT group (Table 3), univariate Cox regression analysis indicated that TP53 mutation was associated with shorter OS (P = 0.013); multivariate Cox regression analysis showed that TP53 mutation was an independent risk factor for OS (P = 0.011), and that FLT3-ITD was an independent risk fact for EFS (P = 0.044), whereas, miR-20b expression had no independent effect on EFS and OS.
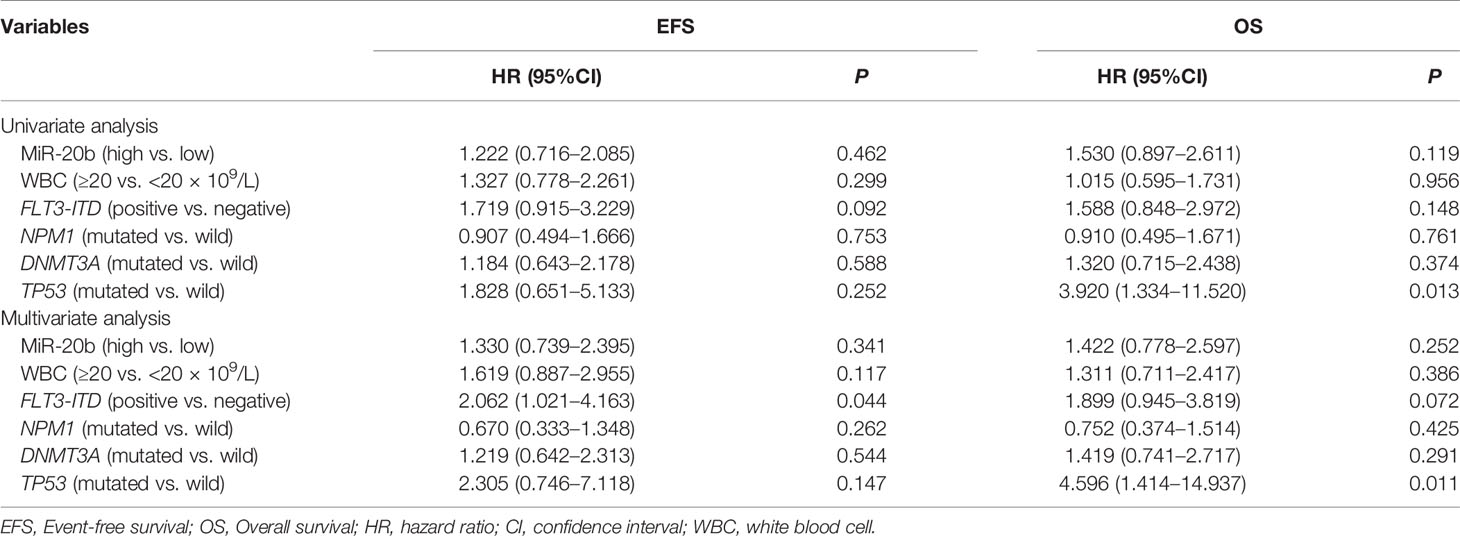
Table 3 Univariate and multivariate analyses of EFS and OS in the allo-HSCT group.
Potential Mechanism of miR-20b in AML
To further explore the mechanism of miR-20b in AML, we first predicted that 1419 genes were potential target genes of miR-20b, and 67 of them had significant negative correlations with miR-20b expression based on Spearman correlation analysis (Figure 3A, details of 67 genes are in Table S1). Pathway enrichment analysis showed that 67 genes related to miR-20b were mainly involved in “ribosome,” “protein K11-linked ubiquitination,” “nucleotide metabolic process,” “myeloid leukocyte mediated immunity,” “DNA replication,” “RNA splicing,” “transcriptional regulation by TP53” signaling pathways (Figure 3B). Among these 67 genes, ORAI2 (ORAI calcium release-activated calcium modulator 2) had the strongest correlation with miR-20b (r=-0.413, P < 0.001, Figure 3C). Survival analysis showed that patients with high ORAI2 expression had longer OS than those with low expression in the chemotherapy group (P = 0.005, Figure 3D); whereas, no similar positive result in the allo-HSCT group (Figure 3E). In another validation dataset (GSE12417), high ORAI2 expression was also accompanied by better survival (P = 0.003, Figure 3F).
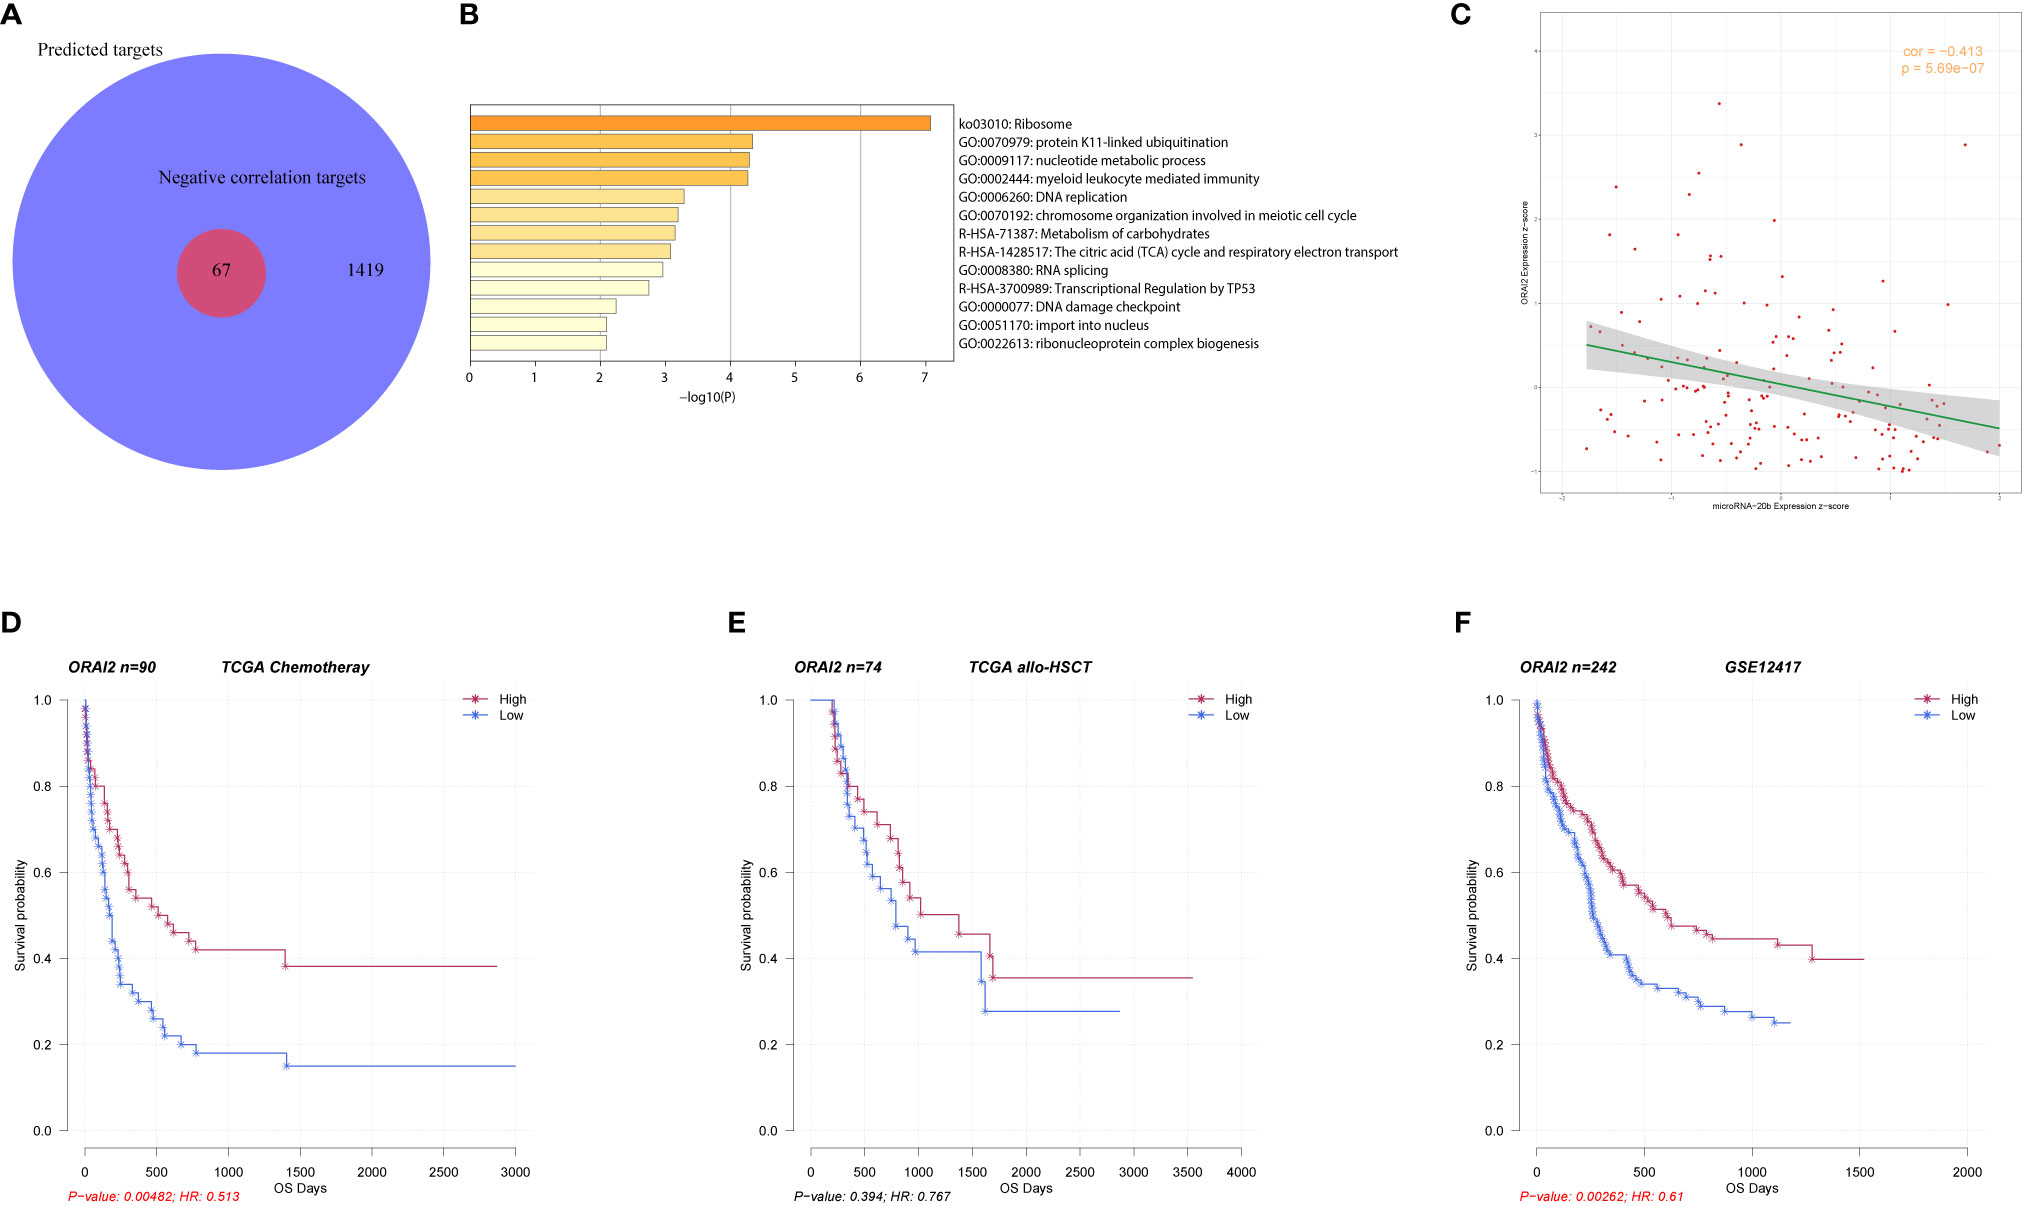
Figure 3 Biologic insight into miR-20b in AML. (A, B) Genes related to miR-20b and their pathway enrichment analysis. (C) Correlation analysis of miR-20b and ORAI2. (D–F) Survival analysis of ORAI2 in different groups.
Discussion
Our study showed that high miR-20b expression is an adverse prognostic factor in AML patients receiving chemotherapy only. No adverse effect of miR-20b expression on survival was observed in patients who received allo-HSCT, and as demonstrated by the second analysis, it might be overcome with allo-HSCT. On the other hand, AML patients with low miR-20b expression could not obtain survival benefit from allo-HSCT in the study.
The mechanisms of miR-20b in various tumors have been widely studied. Danza K, et al. found that the down-regulation of miR-20b can lead to the increased expression of HIF1A, MDR1 and HIPK2, which is related to the chemotherapeutic response in gastric cancer (22); Zhou W et al. found that miR-20b can directly bind to the 3’ untranslated region (UTR) of the phosphatase and tensin homolog (PTEN) mRNA and suppress its translation, thereby promoting growth and metastasis of breast cancer cells (23); and the mechanism by which miR-20b directly regulates PTEN to promote cell proliferation, migration and invasion has also been found in liver, prostate, and esophageal cancers (24–26). Overexpression of miR-20b-5p promotes the malignant behavior of breast cancer stem cells by bidirectional regulation of CCND1 and E2F1 (27); while the deletion of miR-20b and miR-17 enhances the resistance of breast cancer to taxol by inhibiting the expression of NCOA3 (28). In addition, miR-20b inhibits the proliferation, migration and invasion of osteosarcoma cells and colon cancer cells by targeting HIF-1α and cyclinD1, respectively (29, 30). High miR-20b expression indicates poor prognosis in laryngeal squamous cell carcinoma and prostate cancer (25, 31). The expression of miR-20b-5p is also elevated in chronic lymphocytic leukemia (CML), but it is an indicator of favorable prognosis (32). We found that high miR-20b expression indicates poor prognosis in AML patients receiving chemotherapy only, and it coexists with known adverse prognostic factors such as TP53 mutation and old age but not with known favorable prognostic factors such as RUNX1-RUNX1T and CBFβ-MYH11. These results support that miR-20b expression may contribute to some of the invasive features of AML.
We further explored the potential mechanism of miR-20b in AML and found that the expression of genes involved in “ribosome,” “nucleotide metabolic process,” “myeloid leukocyte mediated immunity,” and “DNA replication” signaling pathways is negatively correlated with miR-20b expression. Ribosome modulation participates in the exacerbation of T-cell acute lymphoblastic leukemia (T-ALL) caused by 6q deletion (33). Abnormal DNA replication in hematopoietic cells is also common to various blood diseases (34). We found that ORAI2 has the strongest negative correlation with miR-20b. It is a tetraspanning plasma membrane protein that forms Ca2+ release-activated Ca2+ channels with ORAI1 and ORAI3 to mediate Ca2+ influx (35). ORAI2 regulates the migration and colonization of oral cancer cells by inhibiting Akt/mTOR/NF-κB signaling pathway (36). Diez-Bello R, et al. found that ORAI2 can regulate store-operated calcium entry to promote cell migration and FAK tyrosine phosphorylation in the AML cell line HL60 (37). MiR-20b may participate in the process of AML by targeting genes in the above signaling pathways, but the mechanism of miR-20b in leukemogenesis needs further study.
More and more gene mutations are incorporated into the prognosis and risk stratification and treatment outcome-prediction of AML. Allo-HSCT can improve the prognosis of CN-AML patients with DNMT3A mutation but cannot triumph over the adverse prognostic effect of FLT3-ITD, and TP53 mutation is associated with increased relapse-risk after allo-HSCT (38–40). FLT3-ITD and DNMT3A double mutation denote poor prognosis in AML patients even after allo-HSCT (41). Negative FLT3-ITD, NPM1 and biallelic CEBPA mutations confer better prognosis in AML patients who receiving post-remission allo-HSCT than consolidation chemotherapy alone (42). Our survival analysis found that high miR-20b expression and TP53 mutation are independent risk factors in AML patients received chemotherapy only, but the other widely-used genetic characteristics, such as FLT3-ITD and NPM1 and DNMT3A mutations, are not associated with EFS and OS. Thus, it may be useful to incorporate miR-20b into prognostication. In the allo-HSCT group, miR-20b expression is not correlated with survival, suggesting that its adverse prognostic effect in AML may be conquered by allo-HSCT. Throughout the cohort, patients with high miR-20b expression benefit more from allo-HSCT, but the treatment modalities of those with low mir-20b expression do not affect survival. Therefore, allo-HSCT may be a better choice for AML patients with high miR-20b expression, but it may not be necessary for patients with low miR-20b expression.
In conclusion, our results suggest that high miR-20b expression is a poor prognostic factor in AML and these patients may benefit from allo-HSCT. Thus, it is reasonable to envision it as a marker for risk stratification and guidance for treatments in AML. Our study is limited by the small sample size and needs to be verified by a larger prospective population. The mechanism of miR-20b in AML, especially its association with ORAI2, requires further experimental verification.
Data Availability Statement
Publicly available datasets were analyzed in this study. This data can be found here: https://tcga-data.nci.nih.gov/tcga.
Author Contributions
ZC and YD collected and analyzed the data. ZC drafted the manuscript. ZC and YD revised the manuscript. WH, QZ, PZ, WZ, ZW, QL, HZ, LC, TQ, and CD participated in the data collection and discussion in the revision. LF, YL, and TZ conceived and led the study. All authors contributed to the article and approved the submitted version.
Funding
This work was supported by grant from Xinjiang Joint Fund of National Natural Science Foundation of China (U1903117).
Conflict of Interest
The authors declare that the research was conducted in the absence of any commercial or financial relationships that could be construed as a potential conflict of interest.
Supplementary Material
The Supplementary Material for this article can be found online at: https://www.frontiersin.org/articles/10.3389/fonc.2020.553344/full#supplementary-material
References
1. De Kouchkovsky I, Abdul-Hay M. ‘Acute myeloid leukemia: a comprehensive review and 2016 update’. Blood Cancer J (2016) 6:e441. doi: 10.1038/bcj.2016.50
2. Bullinger L, Döhner K, Döhner H. Genomics of Acute Myeloid Leukemia Diagnosis and Pathways. J Clin Oncol (2017) 35:934–46. doi: 10.1200/JCO.2016.71.2208
3. Cheng Z, Dai Y, Zeng T, Liu Y, Cui L, Qian T, et al. Upregulation of Glutamic-Oxaloacetic Transaminase 1 Predicts Poor Prognosis in Acute Myeloid Leukemia. Front Oncol (2020) 10:379. doi: 10.3389/fonc.2020.00379
4. Cheng Z, Dai Y, Pang Y, Jiao Y, Liu Y, Cui L, et al. Up-regulation of DDIT4 predicts poor prognosis in acute myeloid leukaemia. J Cell Mol Med (2020) 24:1067–75. doi: 10.1111/jcmm.14831
5. Cheng Z, Dai Y, Pang Y, Jiao Y, Zhao H, Zhang Z, et al. Enhanced expressions of FHL2 and iASPP predict poor prognosis in acute myeloid leukemia. Cancer Gene Ther (2019) 26:17–25. doi: 10.1038/s41417-018-0027-0
6. Quan L, Cheng Z, Dai Y, Jiao Y, Shi J, Fu L. Prognostic significance of PAK family kinases in acute myeloid leukemia. Cancer Gene Ther (2020) 27:30–7. doi: 10.1038/s41417-019-0090-1
7. Zhang L, Li R, Hu K, Dai Y, Pang Y, Jiao Y, et al. Prognostic role of DOK family adapters in acute myeloid leukemia. Cancer Gene Ther (2019) 26:305–12. doi: 10.1038/s41417-018-0052-z
8. Wallace JA, O’Connell RM. MicroRNAs and acute myeloid leukemia: therapeutic implications and emerging concepts. Blood (2017) 130:1290–301. doi: 10.1182/blood-2016-10-697698
9. Jongen-Lavrencic M, Sun SM, Dijkstra MK, Valk PJ, Löwenberg B. MicroRNA expression profiling in relation to the genetic heterogeneity of acute myeloid leukemia. Blood (2008) 111:5078–85. doi: 10.1182/blood-2008-01-133355
10. Li Z, Lu J, Sun M, Mi S, Zhang H, Luo RT, et al. Distinct microRNA expression profiles in acute myeloid leukemia with common translocations. Proc Natl Acad Sci USA (2008) 105:15535–40. doi: 10.1073/pnas.0808266105
11. Wang X, Chen H, Bai J, He A. MicroRNA: an important regulator in acute myeloid leukemia. Cell Biol Int (2017) 41:936–45. doi: 10.1002/cbin.10770
12. Hu N, Cheng Z, Pang Y, Zhao H, Chen L, Wang C, et al. High expression of MiR-98 is a good prognostic factor in acute myeloid leukemia patients treated with chemotherapy alone. J Cancer (2019) 10:178–85. doi: 10.7150/jca.26391
13. Cheng Z, Zhou L, Hu K, Dai Y, Pang Y, Zhao H, et al. Prognostic significance of microRNA-99a in acute myeloid leukemia patients undergoing allogeneic hematopoietic stem cell transplantation. Bone Marrow Transplant (2018) 53:1089–95. doi: 10.1038/s41409-018-0146-0
14. Sun SM, Rockova V, Bullinger L, Dijkstra MK, Döhner H, Löwenberg B, et al. The prognostic relevance of miR-212 expression with survival in cytogenetically and molecularly heterogeneous AML. Leukemia (2013) 27:100–6. doi: 10.1038/leu.2012.158
15. Zhu C, Wang Y, Kuai W, Sun X, Chen H, Hong Z. Prognostic value of miR-29a expression in pediatric acute myeloid leukemia. Clin Biochem (2013) 46:49–53. doi: 10.1016/j.clinbiochem.2012.09.002
16. Huang T, Alvarez AA, Pangeni RP, Horbinski CM, Lu S, Kim SH, et al. A regulatory circuit of miR-125b/miR-20b and Wnt signalling controls glioblastoma phenotypes through FZD6-modulated pathways. Nat Commun (2016) 7:12885. doi: 10.1038/ncomms12885
17. Li S, Qiang Q, Shan H, Shi M, Gan G, Ma F, et al. MiR-20a and miR-20b negatively regulate autophagy by targeting RB1CC1/FIP200 in breast cancer cells. Life Sci (2016) 147:143–52. doi: 10.1016/j.lfs.2016.01.044
18. Xue TM, Tao LD, Zhang M, Xu GC, Zhang J, Zhang PJ. miR-20b overexpression is predictive of poor prognosis in gastric cancer. Onco Targets Ther (2015) 8:1871–6. doi: 10.2147/OTT.S85236
19. Guo J, Xiao Z, Yu X, Cao R. miR-20b promotes cellular proliferation and migration by directly regulating phosphatase and tensin homolog in prostate cancer. Oncol Lett (2017) 14:6895–900. doi: 10.3892/ol.2017.7041
20. Tomizawa D, Tanaka S, Kondo T, Hashii Y, Arai Y, Kudo K, et al. Allogeneic Hematopoietic Stem Cell Transplantation for Adolescents and Young Adults with Acute Myeloid Leukemia. Biol Blood Marrow Transplant (2017) 23:1515–22. doi: 10.1016/j.bbmt.2017.05.009
21. Cancer Genome Atlas Research Network, Ley TJ, Miller C, Ding L, Raphael BJ, Mungall AJ, et al. Genomic and epigenomic landscapes of adult de novo acute myeloid leukemia. N Engl J Med (2013) 368:2059–74. doi: 10.1056/NEJMoa1301689
22. Danza K, Silvestris N, Simone G, Signorile M, Saragoni L, Brunetti O, et al. Role of miR-27a, miR-181a and miR-20b in gastric cancer hypoxia-induced chemoresistance. Cancer Biol Ther (2016) 17:400–6. doi: 10.1080/15384047.2016.1139244
23. Zhou W, Shi G, Zhang Q, Wu Q, Li B, Zhang Z. MicroRNA-20b promotes cell growth of breast cancer cells partly via targeting phosphatase and tensin homologue (PTEN). Cell Biosci (2014) 4:62. doi: 10.1186/2045-3701-4-62
24. He J, Mu M, Luo Y, Wang H, Ma H, Guo S, et al. MicroRNA-20b promotes proliferation of H22 hepatocellular carcinoma cells by targeting PTEN. Oncol Lett (2019) 17:2931–6. doi: 10.3892/ol.2019.9925
25. Zhang R, Li F, Wang Y, Yao M, Chi C. Prognostic value of microRNA-20b expression level in patients with prostate cancer. Histol Histopathol (2020) 35:827–31. doi: 10.14670/HH-18-216
26. Wang B, Yang J, Xiao B. MicroRNA-20b (miR-20b) Promotes the Proliferation, Migration, Invasion, and Tumorigenicity in Esophageal Cancer Cells via the Regulation of Phosphatase and Tensin Homologue Expression. PloS One (2016) 11:e0164105. doi: 10.1371/journal.pone.0164105
27. Xia L, Li F, Qiu J, Feng Z, Xu Z, Chen Z, et al. Oncogenic miR-20b-5p contributes to malignant behaviors of breast cancer stem cells by bidirectionally regulating CCND1 and E2F1. BMC Cancer (2020) 20:949. doi: 10.1186/s12885-020-07395-y
28. Ao X, Nie P, Wu B, Xu W, Zhang T, Wang S, et al. Decreased expression of microRNA-17 and microRNA-20b promotes breast cancer resistance to taxol therapy by upregulation of NCOA3. Cell Death Dis (2016) 7:e2463. doi: 10.1038/cddis.2016.367
29. Liu M, Wang D, Li N. MicroRNA-20b Downregulates HIF-1α and Inhibits the Proliferation and Invasion of Osteosarcoma Cells. Oncol Res (2016) 23:257–66. doi: 10.3727/096504016X14562725373752
30. Yang H, Lin J, Jiang J, Ji J, Wang C, Zhang J. miR-20b-5p functions as tumor suppressor microRNA by targeting cyclinD1 in colon cancer. Cell Cycle (2020) 19:2939–54. doi: 10.1080/15384101.2020.1829824
31. Pantazis TL, Giotakis AI, Karamagkiolas S, Giotakis I, Konstantoulakis M, Liakea A, et al. Low expression of miR-20b-5p indicates favorable prognosis in laryngeal squamous cell carcinoma, especially in patients with non-infiltrated regional lymph nodes. Am J Otolaryngol (2020) 41:102563. doi: 10.1016/j.amjoto.2020.102563
32. Papageorgiou SG, Kontos CK, Tsiakanikas P, Stavroulaki G, Bouchla A, Vasilatou D, et al. Elevated miR-20b-5p expression in peripheral blood mononuclear cells: A novel, independent molecular biomarker of favorable prognosis in chronic lymphocytic leukemia. Leuk Res (2018) 70:1–7. doi: 10.1016/j.leukres.2018.04.014
33. Gachet S, El-Chaar T, Avran D, Genesca E, Catez F, Quentin S, et al. Deletion 6q Drives T-cell Leukemia Progression by Ribosome Modulation. Cancer Discovery (2018) 8:1614–31. doi: 10.1158/2159-8290.CD-17-0831
34. Sincennes MC, Humbert M, Grondin B, Lisi V, Veiga DF, Haman A, et al. The LMO2 oncogene regulates DNA replication in hematopoietic cells. Proc Natl Acad Sci USA (2016) 113:1393–8. doi: 10.1073/pnas.1515071113
35. Prakriya M, Lewis RS. Store-Operated Calcium Channels. Physiol Rev (2015) 95:1383–436. doi: 10.1152/physrev.00020.2014
36. Singh AK, Roy NK, Bordoloi D, Padmavathi G, Banik K, Khwairakpam AD, et al. Orai-1 and Orai-2 regulate oral cancer cell migration and colonisation by suppressing Akt/mTOR/NF-κB signalling. Life Sci (2020) 261:118372. doi: 10.1016/j.lfs.2020.118372
37. Diez-Bello R, Jardin I, Salido GM, Rosado JA. Orai1 and Orai2 mediate store-operated calcium entry that regulates HL60 cell migration and FAK phosphorylation. Biochim Biophys Acta Mol Cell Res (2017) 1864:1064–70. doi: 10.1016/j.bbamcr.2016.11.014
38. Xu Y, Sun Y, Shen H, Ding L, Yang Z, Qiu H, et al. Allogeneic hematopoietic stem cell transplantation could improve survival of cytogenetically normal adult acute myeloid leukemia patients with DNMT3A mutations. Am J Hematol (2015) 90:992–7. doi: 10.1002/ajh.24135
39. Schmid C, Labopin M, Socié G, Daguindau E, Volin L, Huynh A, et al. Outcome of patients with distinct molecular genotypes and cytogenetically normal AML after allogeneic transplantation. Blood (2015) 126:2062–9. doi: 10.1182/blood-2015-06-651562
40. Luskin MR, Carroll M, Lieberman D, Morrissette JJD, Zhao J, Crisalli L, et al. Clinical Utility of Next-Generation Sequencing for Oncogenic Mutations in Patients with Acute Myeloid Leukemia Undergoing Allogeneic Stem Cell Transplantation. Biol Blood Marrow Transplant (2016) 22:1961–7. doi: 10.1016/j.bbmt.2016.07.018
41. Tang S, Shen H, Mao X, Dai H, Zhu X, Xue S, et al. FLT3-ITD with DNMT3A R882 double mutation is a poor prognostic factor in Chinese patients with acute myeloid leukemia after chemotherapy or allogeneic hematopoietic stem cell transplantation. Int J Hematol (2017) 106:552–61. doi: 10.1007/s12185-017-2256-7
Keywords: acute myeloid leukemia, miR-20b, allogeneic hematopoietic stem cell transplantation, chemotherapy, prognosis
Citation: Cheng Z, Dai Y, Huang W, Zhong Q, Zhu P, Zhang W, Wu Z, Lin Q, Zhu H, Cui L, Qian T, Deng C, Fu L, Liu Y and Zeng T (2021) Prognostic Value of MicroRNA-20b in Acute Myeloid Leukemia. Front. Oncol. 10:553344. doi: 10.3389/fonc.2020.553344
Received: 18 April 2020; Accepted: 30 December 2020;
Published: 18 February 2021.
Edited by:
Michele Malagola, University of Brescia, ItalyReviewed by:
Alessandro Barbon, University of Brescia, ItalySara Galimberti, University of Pisa, Italy
Copyright © 2021 Cheng, Dai, Huang, Zhong, Zhu, Zhang, Wu, Lin, Zhu, Cui, Qian, Deng, Fu, Liu and Zeng. This is an open-access article distributed under the terms of the Creative Commons Attribution License (CC BY). The use, distribution or reproduction in other forums is permitted, provided the original author(s) and the copyright owner(s) are credited and that the original publication in this journal is cited, in accordance with accepted academic practice. No use, distribution or reproduction is permitted which does not comply with these terms.
*Correspondence: Lin Fu, ZnVsaW4wMjJAMTI2LmNvbQ==; Yan Liu, bGl1eWFuNTUxNUAxMjYuY29t; Tiansheng Zeng, YWxsZW56ZW5ndHNAMTI2LmNvbQ==
†These authors have contributed equally to this work