 Raíza Dias Freitas1,2†
 Rosane Borges Dias1,3†
 Manuela Torres Andion Vidal1,2
 Ludmila de Faro Valverde1,2
 Rafaela Gomes Alves Costa1Andresa Karen Andrade Damasceno1Caroline Brandi Schlaepfer Sales4Leonardo de Oliveira Siquara da Rocha1
 Mitermayer Galvão dos Reis1,2
 Milena Botelho Pereira Soares1
 Ricardo Della Coletta5Thiago Almeida Pereira6
 Daniel Pereira Bezerra1
 Clarissa Araújo Gurgel Rocha1,2,3*
- 1Gonçalo Moniz Institute, Oswaldo Cruz Foundation (IGM-FIOCRUZ/BA), Salvador, Brazil
- 2Department of Pathology and Forensic Medicine, School of Medicine of the Federal University of Bahia, Salvador, Brazil
- 3Department of Propaedeutics, School of Dentistry of the Federal University of Bahia, Bahia, Brazil
- 4Department of Biomorphology, Institute of Health Sciences, Federal University of Bahia, Salvador, Brazil
- 5Department of Oral Diagnostics, School of Dentistry, University of Campinas, Piracicaba, Brazil
- 6Institute for Stem Cell Biology and Regenerative Medicine, Stanford University, Stanford, CA, United States
Oral Squamous Cell Carcinoma (OSCC) presents an important challenge for the health systems worldwide. Thus, unraveling the biological mechanisms involved in OSCC pathogenesis is essential to the discovery of new drugs with anticancer potential. The Hedgehog (HH) pathway has shown promising results as a therapeutic target both in vitro and in vivo. This study aimed to investigate the effects of vismodegib and itraconazole on the expression of Hedgehog (HH) genes (PTCH1, SMO, and GLI1), cell cycle and cell death in OSCC cells. Alamar Blue assay was used to assess the cytotoxicity of vismodegib and itraconazole in a panel of oral cancer cell lines, including CAL27. The expression of HH signaling components after treatment with vismodegib and itraconazole, at concentrations of 25 or 50 μg/ml was evaluated by qPCR. Cell cycle and apoptosis were evaluated by flow cytometry after 72 h treatment with 50 μg/ml of vismodegib or itraconazole. HH signaling was activated in OSCC cell lines CAL27, SCC4, SCC9, and HSC3. Vismodegib and itraconazole significantly reduced CAL27 cell viability after 48 h of treatment. Gene expression of PTCH1, SMO, and GLI1 decreased in response to 24 h of treatment with vismodegib or itraconazole. Furthermore, CAL27 cells exhibited alterations in morphology, cell size, and cellular granularity. An increase in the DNA fragmentation was observed after treatment and both inhibitors induced apoptosis after 72 h. In conclusion, SMO inhibitors vismodegib and itraconazole demonstrably reduced the expression of HH genes in CAL27 OSCC cell line. In addition, treatment with vismodegib and itraconazole reduced cellular viability and altered the morphology of CAL27 cells, and also induced apoptosis.
Introduction
Head and neck cancers pose a serious public health problem due to its high incidence, prevalence, and mortality (1–3). Among these, cancers affecting the oral cavity rank in the top 20 of all malignant tumors worldwide, with more than 350,000 new cases reported in 2018 (4). Oral squamous cell carcinoma (OSCC) is the most frequently histological type, corresponding to 90% of all diagnoses (5–7). According to the classification criteria for oral cavity and oropharynx tumors established by the World Health Organization (8), OSCC is considered an invasive and aggressive epithelial neoplasia with the potential to promote early metastasis and extensive lymph node involvement. This disease mainly affects adult population aged 50 to 60 years old and has a multifactorial etiology, with the principal risk factors being tobacco and alcohol use (9–12). A 5-year survival rate has been reported in approximately 50% of OSCC cases (3, 13).
Despite advances in cancer treatment, the therapeutic options for OSSC remain limited, with surgery and radiotherapy being the most common approaches. The lack of robust treatment options has led to high morbidity, reduced quality of life, and a high frequency of metastatic disease (14). Accordingly, obtaining a comprehensive understanding of biology of this type of tumor is crucial to the development of new therapeutic strategies. Advances in knowledge will also improve the clinical outcome and survival of OSCC patients, since morbidities associated with surgical treatment (e.g. facial deformity, speech problems, difficulty swallowing, etc.) constitute an important aspect of this disease, leading to social, emotional, and economic impacts (e.g. low productivity at work, difficulty in re-entering the labor market, etc.).
Our group was one of the pioneers in demonstrating that the Hedgehog (HH) cascade becomes reactivated in OSCC (15). Considering that, this pathway becomes dysregulated in several types of carcinomas, such as lung (16–18), breast (19, 20), ovaries (21, 22), and liver (23, 24), HH molecules can be considered as potential pharmacological targets in OSCC. Of special interest in the HH pathway are the Sonic ligand (Shh), the Patched receptor (PTCH1), the Smoothened co-receptor (SMO), and GLI transcription factors, which are the major components of the HH pathway responsible for cellular proliferation, self-renewal, migration, and stem cell-population maintenance, among others (25–28). In brief, this cascade is activated by binding one of secreted ligands (Shh, Ihh, or Dhh) to the PTCH1 or PTCH2 receptor expressed by responsive cells. PTCH1-ligand complex promotes conformational changes in SMO, resulting in its activation, signal transduction into cytoplasm and, consequently, to the activation and nuclear translocation of GLI transcription factors, which will ultimately activate target genes (27, 29). HH cascade activation may also occur due to activating mutations in SMO or inactivating mutations in PTCH1 (20, 30).
The search for drugs capable of blocking the HH pathway has already produced important results. Vismodegib (GDC-0449) was the first HH signaling pathway targeting agent approved by the US Food and Drug Administration (FDA) and European Medicines Agency (EMA) for the treatment of advanced local or metastatic basal cell carcinomas in patients who are not suitable candidates for surgical resection or radiotherapy (31–35). Many clinical studies have investigated the effects of vismodegib, either as monotherapy or in combination with other drugs, on various types of cancers, such as advanced chondrosarcoma (NCT01267955) (36), metastatic breast cancer (NCT01071564) (37), medulloblastoma (NCT00939484) (38), sarcoma (NCT01154452) (39), and others (US, NLM, 2018).
Several mechanisms of resistance to vismodegib have been demonstrated in studies using medulloblastoma and basal cell carcinoma cells (40, 41), which may be related to its pharmacokinetic properties, including high affinity for plasma proteins, limited absorption, and slow elimination (42, 43), or related to GLI1 activation, which can be mediated by other signaling pathways (44–46).
Itraconazole, a broad-spectrum antifungal agent that inhibits lanosterol 14-α-demethylase (14LDM), an enzyme that produces ergosterol in fungi and cholesterol in mammals (4–8), is also a known regulator of the HH pathway (47–49). This compound prevents the accumulation of SMO in the primary cilia (47), and therefore stands out as a potential agent for combating the treatment resistance seen in other anti-HH compounds, such as vismodegib. Moreover, several clinical trials are currently underway to investigate the inhibitory potential of itraconazole in various cancer types, including esophageal (NCT02749513) (50), ovarian (NCT03081702) (51), non-small cell lung (NCT02357836) (52), and others (US, NLM, 2018).
Despite the promising results seen in several types of cancer using vismodegib and itraconazole (34, 53), their therapeutic potential of blocking the HH pathway in OSCC has not been studied. The present study attempted to demonstrate the in vitro effects of vismodegib and itraconazole on the expression of HH pathway genes, as well as OSCC cell proliferation and death.
Materials and Methods
Cell Culturing
All human cell lines (Table S1) were cultured in cell culture flasks (75 cm3, 250 ml volume) in DMEM medium (Life Technologies, Gibco®; Carlsbad, CA, USA) supplemented with 10% fetal bovine serum (FBS, Life Technologies, Gibco®; Carlsbad, CA, USA) and 50 μg/ml gentamicin (Novafarma, Anapolis, GO, Brazil). Cultures were maintained in incubators under 5% CO2 at 37°C and monitored daily using an inverted microscope. Cell dissociation with trypsin was performed when cell growth reached the confluence of 70 to 80% of the total culture flask volume. Cell lines were tested monthly for mycoplasma contamination using Hoechst dye (Sigma-Aldrich; St Louis, USA).
PBMC Preparation
Human peripheral blood mononuclear cells (PBMC) were obtained from the peripheral blood of healthy non-smokers aged 25–35 years who had no reported drug or medication use for at least 15 days prior to collection. The Institutional Review Board of the Oswaldo Cruz Foundation (FIOCRUZ, Salvador, Bahia, Brazil) approved the present experimental protocol (Number 031019/2013). All participants signed a term of informed consent to participate in the study. Blood collection (up to a final volume of 5 ml) was performed in heparinized flasks by trained professionals at Fiocruz using sterile disposable syringes.
PBMCs were isolated following a standard protocol by centrifugation using a Ficoll density gradient (Ficoll-Paque Plus; GE Healthcare Bio-Sciences AB; Chicago, IL, USA). After separation, cells were washed twice with saline, resuspended (0.3 × 10⁶ cells/ml) in RPMI medium supplemented with 20% FBS, 2 mM glutamine, and 50 μg/ml gentamicin. To induce T cell proliferation, 10 μg/ml concanavalin A (Con A; Sigma Chemical Co; St Louis, MO, USA.) was added for use as a mitogen.
Gene Expression of HH Pathway Components in OSCC
To characterize the expression of the studied HH pathway components (SHH, PTCH1, SMO, and GLI1), OSCCs were maintained under serum-free condition for 24 h, since FBS is known to inhibit the expression of HH molecules, as previously reported (54).
Total RNA Isolation and Reverse Transcription (RT-PCR)
For total RNA isolation, OSCC cells were plated on 6-well plates at a density of 0.7 × 10⁵ cells/ml per well in 2.5 ml of complete medium. After, 24 and 48 h cells were directly collected to the buffer lysis solution (RLT, Rneasy® Mini Kit, QIAGEN; Hilden, Germany). RNA was extracted using silica microcolumns (Rneasy® Mini Kit, QIAGEN; Hilden, Germany) and eluted in 20 µl of water. The quantity and purity of the RNA preparations was analyzed using Qubit™ RNA Assay Kit (Thermo Fisher Scientific, USA) in a fluorometer (QuBit™, Life Technologies; Carlsbad, CA, USA). Reverse transcription was performed using the Superscript VILO™ master mix (Invitrogen Corporation, USA) after elimination of genomic DNA with DNase I, Amplification Grade (Invitrogen Corporation, USA), during 10 min. All resulting cDNA samples were stored at −20°C. Experiments were performed under DNAse/RNAse-free conditions.
HH Pathway Gene Expression
HH pathway component expression was evaluated by qPCR using inventoried TaqMan Gene Expression Assays™ for genes SHH (Hs00179843_m1), PTCH1 (Hs00181117_m1), SMO (Hs01090242_m1), and GLI1 (Hs01110766_m1), as well as for the reference gene B2M (Hs99999907_m1). Reactions were run on an ABI ViiA7 system (Applied Biosystems™; Foster City, CA, USA) using a 96 Fast Well Block with total volumes of 20 μl containing 1 µg of total RNA. The amplification process consisted of an initial step at 50°C for 2 min, followed by 95°C for 10 min, then 40 cycles at 95°C for 15 s and 60°C for 1 min.
After the amplification and dissociation runs, Quantification Cycle (Cq) values were obtained using the Expression Suite software (Applied Biosystems; Foster City, CA, USA). For the comparison of experimental groups and controls by relative quantification, the Cq comparative method (2-ΔΔCQ) was used. The B2M reference gene was used as a normalizer (55) and reactions were calibrated using the Cq values of samples treated with dimethylsulfoxide (DMSO 0.2%) as a negative control. All qPCR reactions were performed in three independent experiments with duplicate samples.
Assessment of Cytotoxicity by Alamar Blue Assay
To assess the cytotoxicity on tumor and non-tumor cells, Alamar blue assay was performed following treatment, as described by Ahmed et al. (56). Tumor and non-tumor cells were distributed on 96-well plates at a density of 0.7 × 10⁵ cells/ml in 100 μl of complete medium.
Following dissolution in 0.5% DMSO, each inhibitor was added and the plates were incubated for 72 h at concentrations ranging from 0.39 to 50 µg/ml. Doxorubicin and 5-fluorouracil were used as positive controls at concentrations ranging from 0.03 to 5 µg/ml. Cells treated with the vehicle (DMSO 0.5%) used to dilute the tested inhibitors were employed as a negative control. After 68 or 48 h (PBMC) of incubation, 20 μl of Alamar blue stock solution (0.312 mg/ml) was added to each well. Absorbance was measured at wavelengths of 570 nm (reduced) and 600 nm (oxidized) using a microplate reader (Molecular Devices; Sunnyvale, CA, USA).
The CAL27 cells were selected for use in all following in vitro assays, which allowed us to better evaluate the effects of vismodegib and itraconazole on HH pathway component gene expression, as well as cell viability, cycle, and death patterns. Additionally, Alamar blue assays were also performed in CAL27 cells following treatment of 6, 12, 24, 48, and 72 h to confirm the cell response to SMO inhibitors. After determining the IC50 value for SMO inhibitors, all following assays were performed using two concentrations (25 or 50 µg/ml), in CAL27 cells. All results were confirmed by at least three independent experiments with duplicate samples.
SMO Inhibitor Concentrations and Specifications
For all inhibition assays, the test compounds vismodegib (Selleck Chemicals; Houston, USA) and itraconazole (Sigma-Aldrich; St. Louis, MO, USA) were used. Doxorubicin (IMA S.A.I.C. Lab; Buenos Aires, Argentina) and 5-fluorouracil (5-FU) (Sigma-Aldrich; St Louis, MO, USA) were used as positive controls, as both chemotherapeutic agents are approved by the FDA for the treatment of several cancers, including breast, pancreatic, ovarian, colon, and stomach (NIH, 2017). All compounds used in experimentation were dissolved in 0.5% DMSO and diluted in saline to variable concentrations in accordance with each assay performed (Table S2). These concentrations were determined using the IC50 values obtained for each compound in each evaluated cell line. To evaluate any possible effects of the drug vehicle, some assays included 0.5% DMSO as a control.
Cell Viability Assay—Trypan Blue
To assess the viability of CAL27 cells, a trypan blue assay was performed after 24 and 48 h treatment. OSCC cells plated on 6-well plates at a density of 0.7 × 10⁵ cells/ml at a final volume of 2.5 ml were incubated with vismodegib and itraconazole for 24 and 48 h. For this analysis, 90 μl was removed from the plate using trypsin, stained with 10 μl trypan blue and counted in a Neubauer chamber, under optical microscopy, at 20× magnification (Olympus CX41, Olympus, Tokyo, Japan). All results were confirmed by at least three independent experiments.
Morphological Evaluation
For morphological analysis, CAL27 cells were incubated on 6-well culture plates at a density of 0.7 × 10⁵ cells/ml at a final volume of 2.5 ml containing the SMO inhibitors. Cells were observed both before and after treatment using an inverted microscope (DMi8, Leica; Wetzlar, Germany). Digital images were captured using Leica software Application Suite X (XLAS X, Leica Microsystems; Wetzlar, Germany) for the analysis of morphological changes. Additionally, flow cytometry was performed to evaluate FSC (forward scatter) and SSC (side scatter) standards to demonstrate relative size and granularity or internal cell complexity, respectively.
Cell Cycle and Cell Death Analyses
The effects of vismodegib and itraconazole on cell cycle and cell death were analyzed using the CAL27 cell line. In all experiments, 2.5 ml of cell suspension (0.7 × 10⁵ cells/ml) was plated into each well of 6-well plates and incubated overnight to allow cell adhesion, followed by a 72 h treatment period with vismodegib and itraconazole. Doxorubicin and 5-FU were used as positive controls. Flow cytometry was performed on a BD LSRFortessa cytometer using the BD FACSDiva Software (BD Biosciences; Franklin Lakes, NJ, USA) and Flowjo Software 10 (Flowjo LCC; Ashland, OR, USA). Experiments were performed in duplicate and repeated at least three times.
Analysis of DNA Fragmentation and Cell Cycle With Propidium Iodide
Nuclear DNA content, which reflects the cell cycle phase, was evaluated by flow cytometry using propidium iodide (PI) as a fluorogenic agent. After 72 h treatment with the test compounds, cells were treated with a permeabilization solution (300 μl) containing 0.1% triton X-100, 0.1% sodium citrate, 2 μg/ml PI, and 100 μg/ml RNase in distilled water, in the absence of light and at room temperature. After 30 min, cell fluorescence was measured by flow cytometry on a LSRFortessa cytometer using FACSDiva Software version 6.2 (Becton Dickinson Biosciences; San Jose, CA, USA). Proportions of fragmented internucleosomal DNA and cell cycle phases were determined using Flowjo software, v 10 (Flowjo LCC; Ashland, OR, USA). Cells in the sub-G1 phase represent internucleosomal DNA fragmentation. Cellular debris were omitted from the analysis and 10,000 events were analyzed per sample.
Cell Death Pattern Analysis Using Annexin V and Propidium Iodide
After 48 and 72 h of treatment with the HH pathway inhibitors, cells were stained with annexin V-FITC and PI (BD Biosciences; Franklin Lakes, NJ, USA) to assess cell viability (categories: viable - Q4, early apoptosis - Q3, late apoptosis - Q2, or necrotic - Q1.) Cell fluorescence was measured by flow cytometry, as above.
Statistical Analyses
Statistical analysis was performed using the GraphPad Prism program. Data were analyzed according to distribution using a normal Gaussian curve. IC50 values were obtained by non-linear regression, considering three independent experiments performed in duplicate. Differences between groups were evaluated by ANOVA (analysis of variance), followed by the Student-Newman-Keuls test (p < 0.05).
Regarding gene expression analysis, relative quantification (QR) values were obtained with the aid of the Gene Expression Suite™ program (Applied Biosystems) according to the Cq comparative method (ΔΔ CQ) (57).
Results
The HH Pathway Is Activated in Human Oral Cancer Cell Lines
Initially, we investigated the transcriptional activity of HH components by qPCR. HH pathway activity was confirmed via the constitutive expression of GLI-1 gene, the gold standard for determining HH pathway activation (58–60), in all OSCC cell lines tested. The SHH ligand was constitutively expressed in CAL27 and SCC4 cell lines (Figure S1).
Cytotoxic Activity of Vismodegib and Itraconazole in OSCC Cell Lines
To evaluate the tumor cytotoxicity of the SMO inhibitors vismodegib and itraconazole, a cytotoxicity assay was performed using Alamar Blue after 72 h of treatment. Vismodegib presented cytotoxicity, with IC50 values ranging from 34.03 μg/ml in CAL27 and 41.30 in HSC-3. IC50 values for itraconazole were similar for all cell lines tested (Table 1). The positive controls doxorubicin and 5-FU demonstrated cytotoxic activity (<4μg/ml) in all tumor lines. The treatment and positive-control and compounds were also evaluated in two non-tumor cell types, HaCaT, an immortalized non-transformed keratinocyte cell line, and in a primary culture of peripheral blood mononuclear cells (PBMC). Vismodegib presented an IC50 of 23.81 μg/ml in HaCaT and 31.16 μg/ml in PBMCs, whereas itraconazole presented IC50 values of 17.66 μg/ml and 15.35 μg/ml in HaCaT and PBMC, respectively (Table 1).
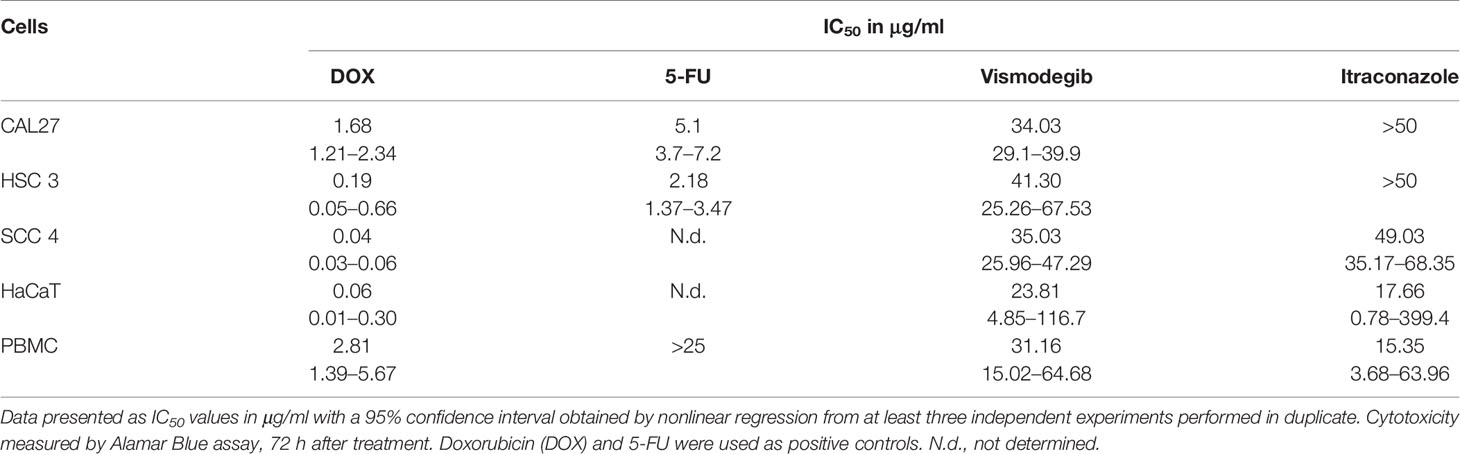
Table 1 Human tumor lineages used in the Alamar Blue cytotoxicity assay.
The CAL27 cell line was selected to determine the optimal treatment time for vismodegib and itraconazole. Cytotoxicity was evaluated at the 6, 12, 24, 48, and 72 h time points. At 6 and 12 h, IC50 values of 5-FU and the test compounds were unable to be determined. However, after 24, and at 48 and 72 h of treatment, vismodegib presented IC50 values of 54.9, 41.5, and 34.03 μg/ml, respectively. It was not possible to determine IC50 values for itraconazole at any of the time points evaluated. The IC50 values of 5-FU were 95.6, 28.2 and 5.1 μg/ml at 24, 48 and 72 h of treatment, respectively (Table 2).
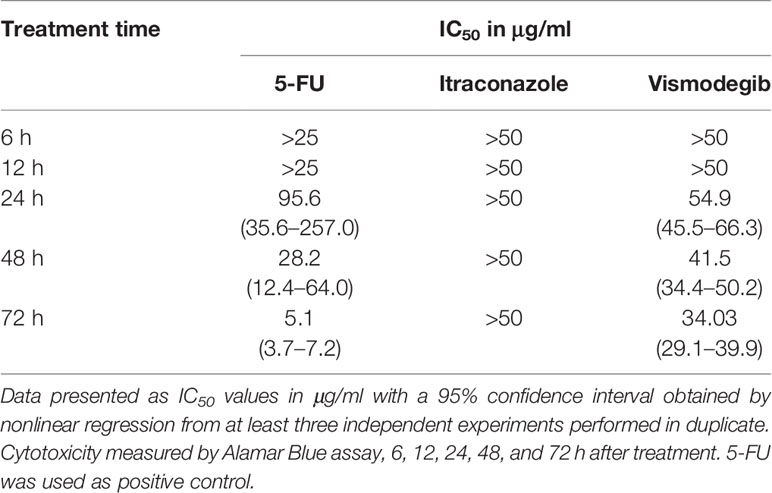
Table 2 Cytotoxic activity of 5-FU, vismodegib, and itraconazole in the CAL-27 cell line.
Vismodegib and Itraconazole Reduce the Viability of CAL27 Cell Line
Vismodegib is a small-molecule inhibitor of Smoothened (34, 35), while itraconazole reduces HH pathway activity by inhibiting the accumulation of SMO in primary cilium (45). We first examined the effects of vismodegib on the viability of CAL27 OSCC cell line. At 24 h, the greatest effect on cell viability was seen using itraconazole at 50 μg/ml, followed by itraconazole at 25 μg/ml. At 48 h, significant reductions in the number of viable cells were observed after treatment with itraconazole and vismodegib at 50 μg/ml in comparison to untreated and vehicle-treated groups (p < 0.05) (Figure 1).
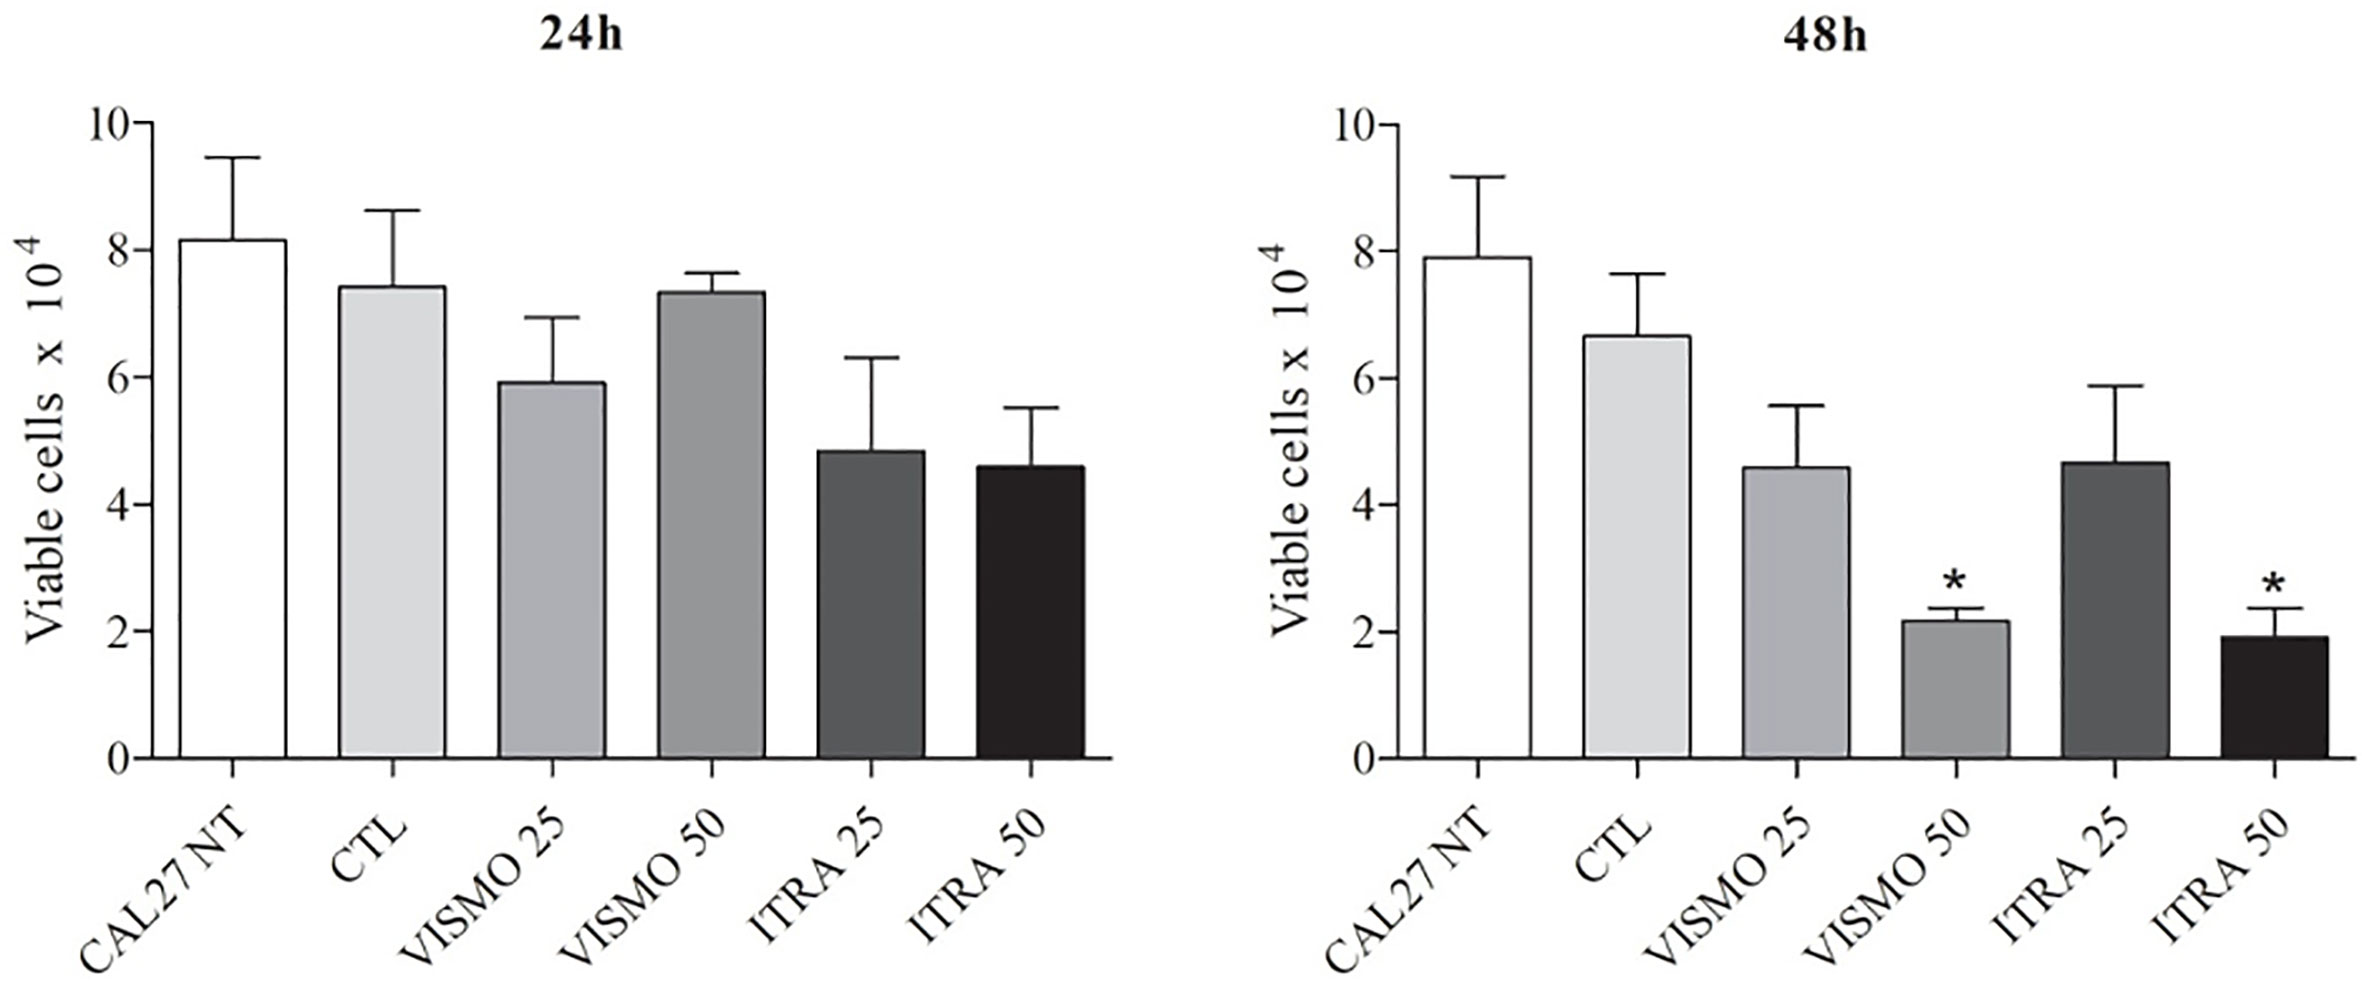
Figure 1 Effect of SMO inhibitors on CAL27 cell line viability. CAL27 cells were cultured for 24 or 48 h in the absence (CAL27 NT), or presence of vismodegib (VISMO) or itraconazole (ITRA). One negative control (CTL) was treated with the vehicle (0.2% DMSO) used to solubilize test compounds. Cell viability was determined using a trypan blue dye exclusion assay. Values represent mean ± S.E.M. from three independent experiments performed in duplicate. *p < 0.05 compared to the CTL group by ANOVA, followed by the Student Newman-Keuls test.
Treatment With SMO Inhibitors Altered CAL27 Cell Morphology, Volume, and Granularity
Analysis of cell populations showed morphology alterations in cells treated with vismodegib or itraconazole at 24 or 48 h, compared to the untreated and vehicle groups (Figures S2, S3, S4, and S5). With regard to morphology, an evident aspect visualized in the treatment groups was reduced numbers and volumes of tumor islands, with cells exhibiting greater loss of adhesion and nuclear fading (Figures S2, S3, S4, and S5). Cellular retraction was also observed, especially in cells treated for 48 h with itraconazole (Figures S4 and S5).
At only after 72 h, flow cytometry analysis revealed cellular retraction arising from treatment with the SMO inhibitors, as evidenced by a decrease in Forward Light Scatter (FSC), and nuclear condensation due to increased lateral dispersion (SSC), as demonstrated by the scatterplots in Figure 2A. The positive controls doxorubicin and 5-FU were found to decrease cell size (p < 0.05). In addition, these two controls and itraconazole at 50 μg/ml were found to increase the granularity of CAL27 cells (p < 0.05) (Figure 2).
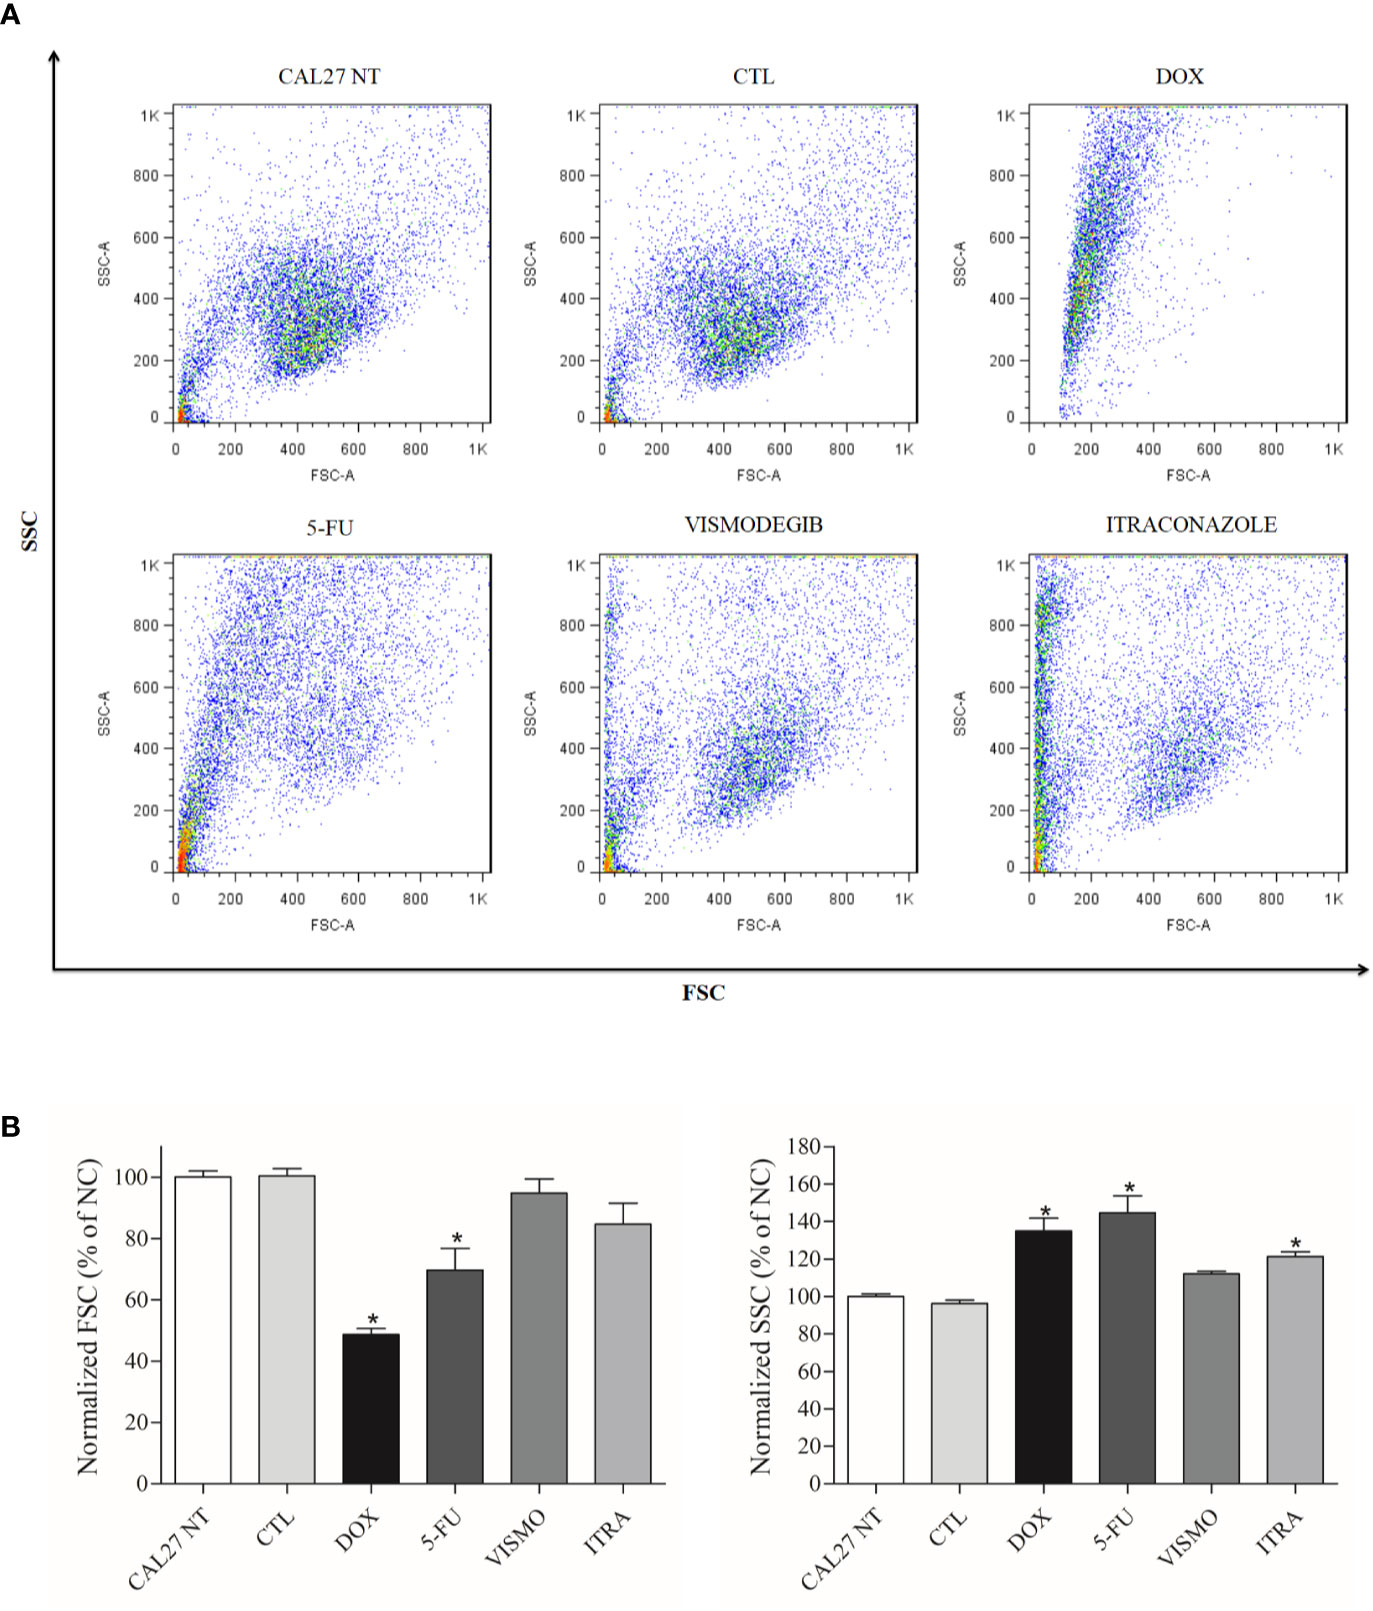
Figure 2 (A) Scatterplots and (B) Graphical representation of light scattering characteristics of CAL27 cells treated with vismodegib and itraconazole, as determined by flow cytometry after 72 h of treatment. FSC (forward scatter) and SSC (side scatter) were used to demonstrate relative size and granularity or internal cell complexity. FSC and SSC values were normalized with the negative control (DMSO 0.2%). The negative control was treated with the vehicle (DMSO 0.2%) used to solubilize and dilute the compounds. Doxorubicin (DOX, 1 μg/ml) and 5-FU (10 μg/ml) were used as positive controls. Data is representative of three independent experiments performed in duplicate. Cellular debris was omitted from the analyses and 10,000 events were analyzed per sample. *p < 0.05 compared to the CTL group by ANOVA, followed by the Student Newman-Keuls test.
Treatment With Vismodegib or Itraconazole Reduced the Expression of SMO, PTCH1, and GLI1
After 24 h of treatment with vismodegib or itraconazole (at 25 or 50 µg/ml), reduced gene expression of SMO, PTCH1, and GLI1 were observed (Figure 3).
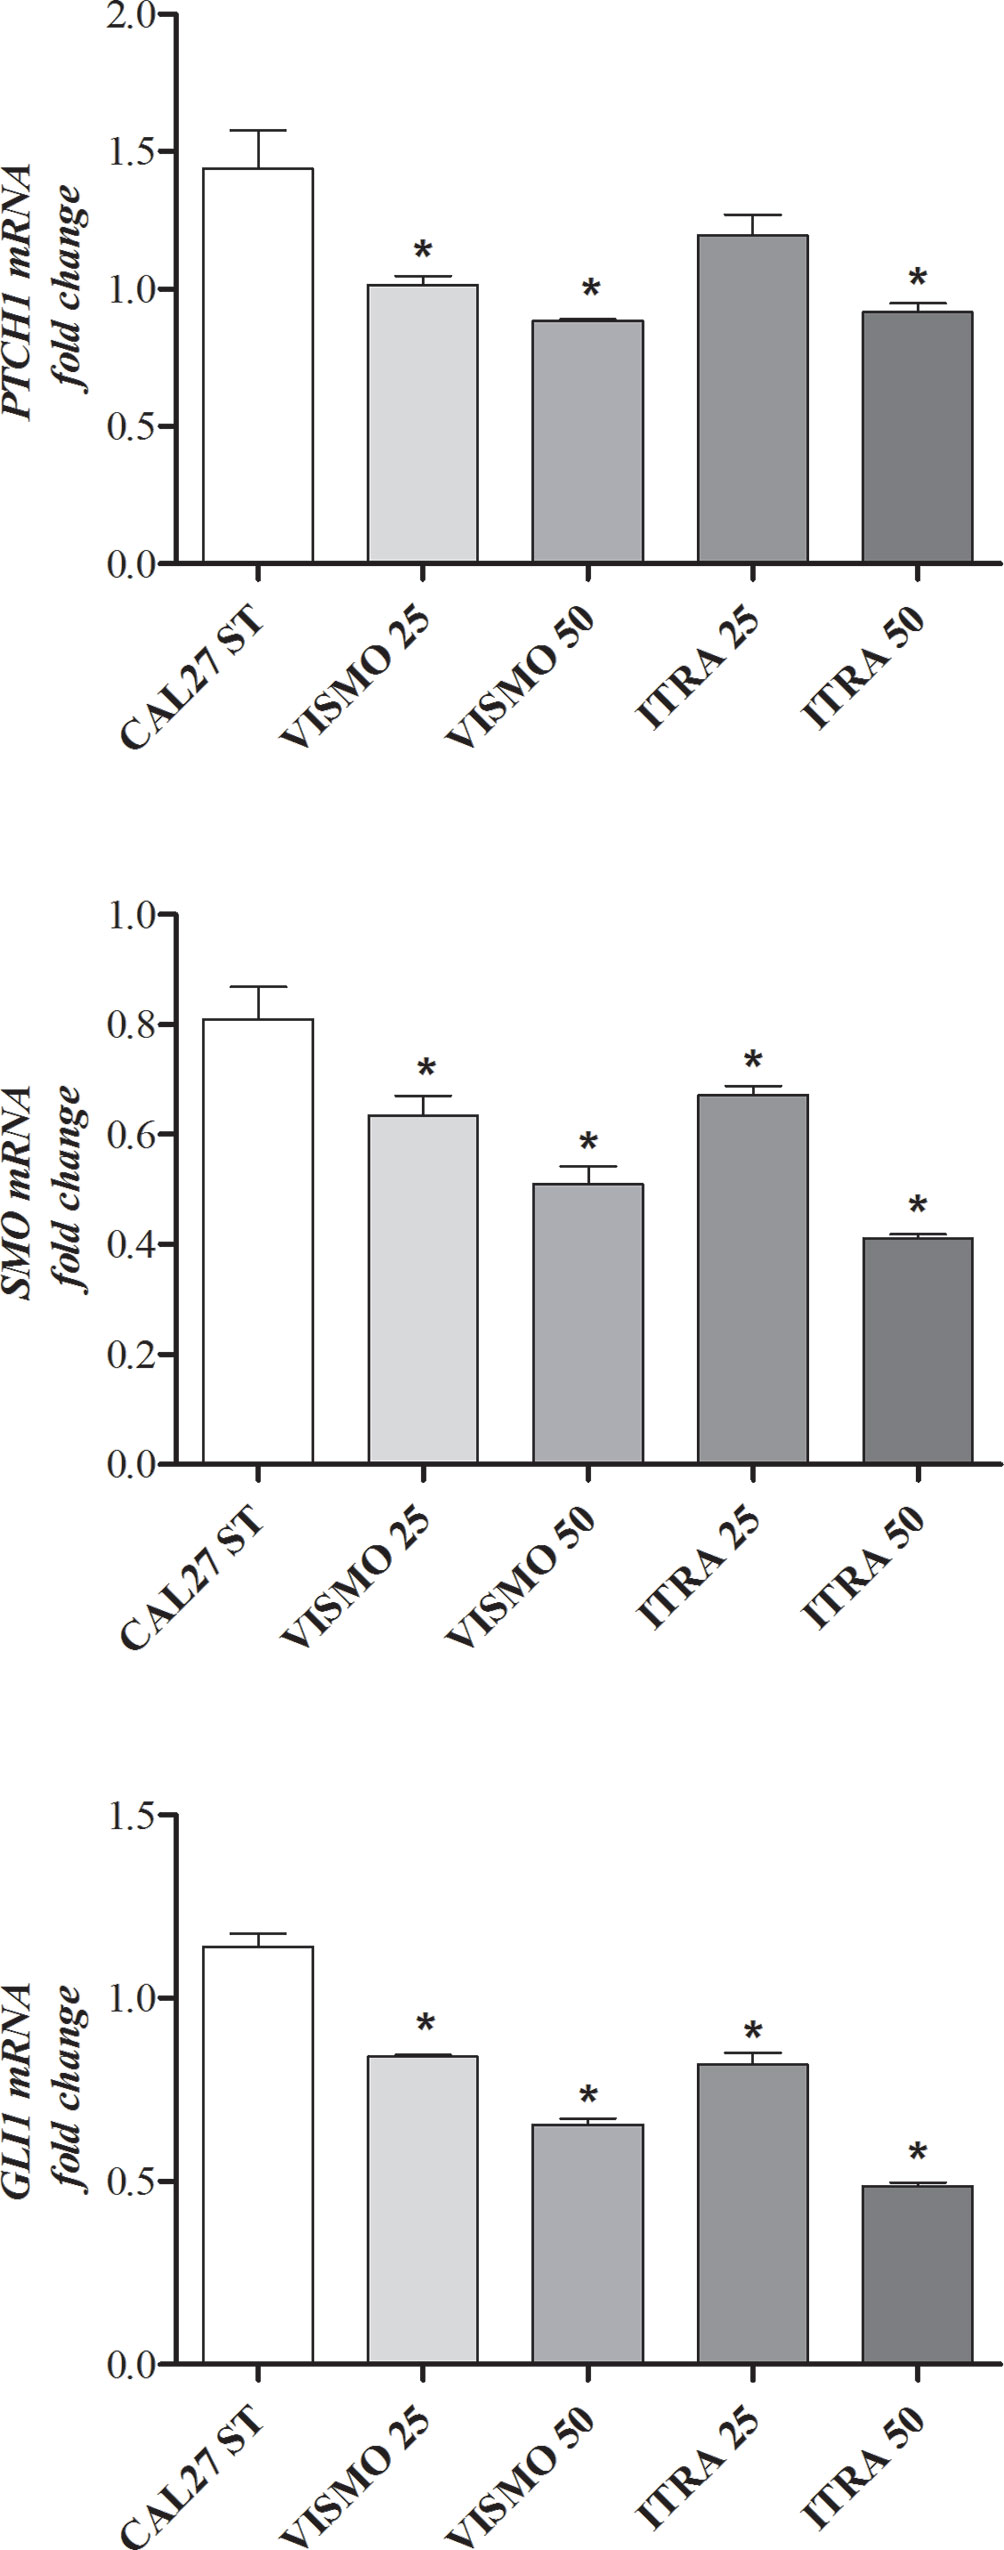
Figure 3 HH pathway component gene expression profiles after 24 h of treatment with vismodegib or itraconazole (at 25 or 50 µg/ml) in CAL27 cells. Negative control was treated with DMSO (0.2%), used to solubilize and dilute tested compounds. Doxorubicin (DOX, 1 μg/ml) and 5-FU (10 μg/ml) were used as positive controls. The value of relative quantification (RQ) used in each sample was normalized using the B2M reference gene and calibrated according to RQ values obtained for the CAL27 treated with DMSO (0.2%). qPCR reactions were performed in cells treated and non-treated with SMO inhibitors. *p < 0.05 compared to the CTL group by ANOVA, followed by the Student Newman-Keuls test.
Vismodegib and Itraconazole Induce Apoptosis in CAL27 Cells
After 48 h of treatment with the tested compounds, results did not show a significant increase of cell death by apoptosis. Only after 72 h of treatment with vismodegib or itraconazole, an increase in the number of apoptotic cells was seen in comparison to the negative control and DMSO groups. The positive control groups (doxorubicin and 5-FU) also presented significantly increased populations of apoptotic cells (p < 0.05) (Figures 4 and 5).
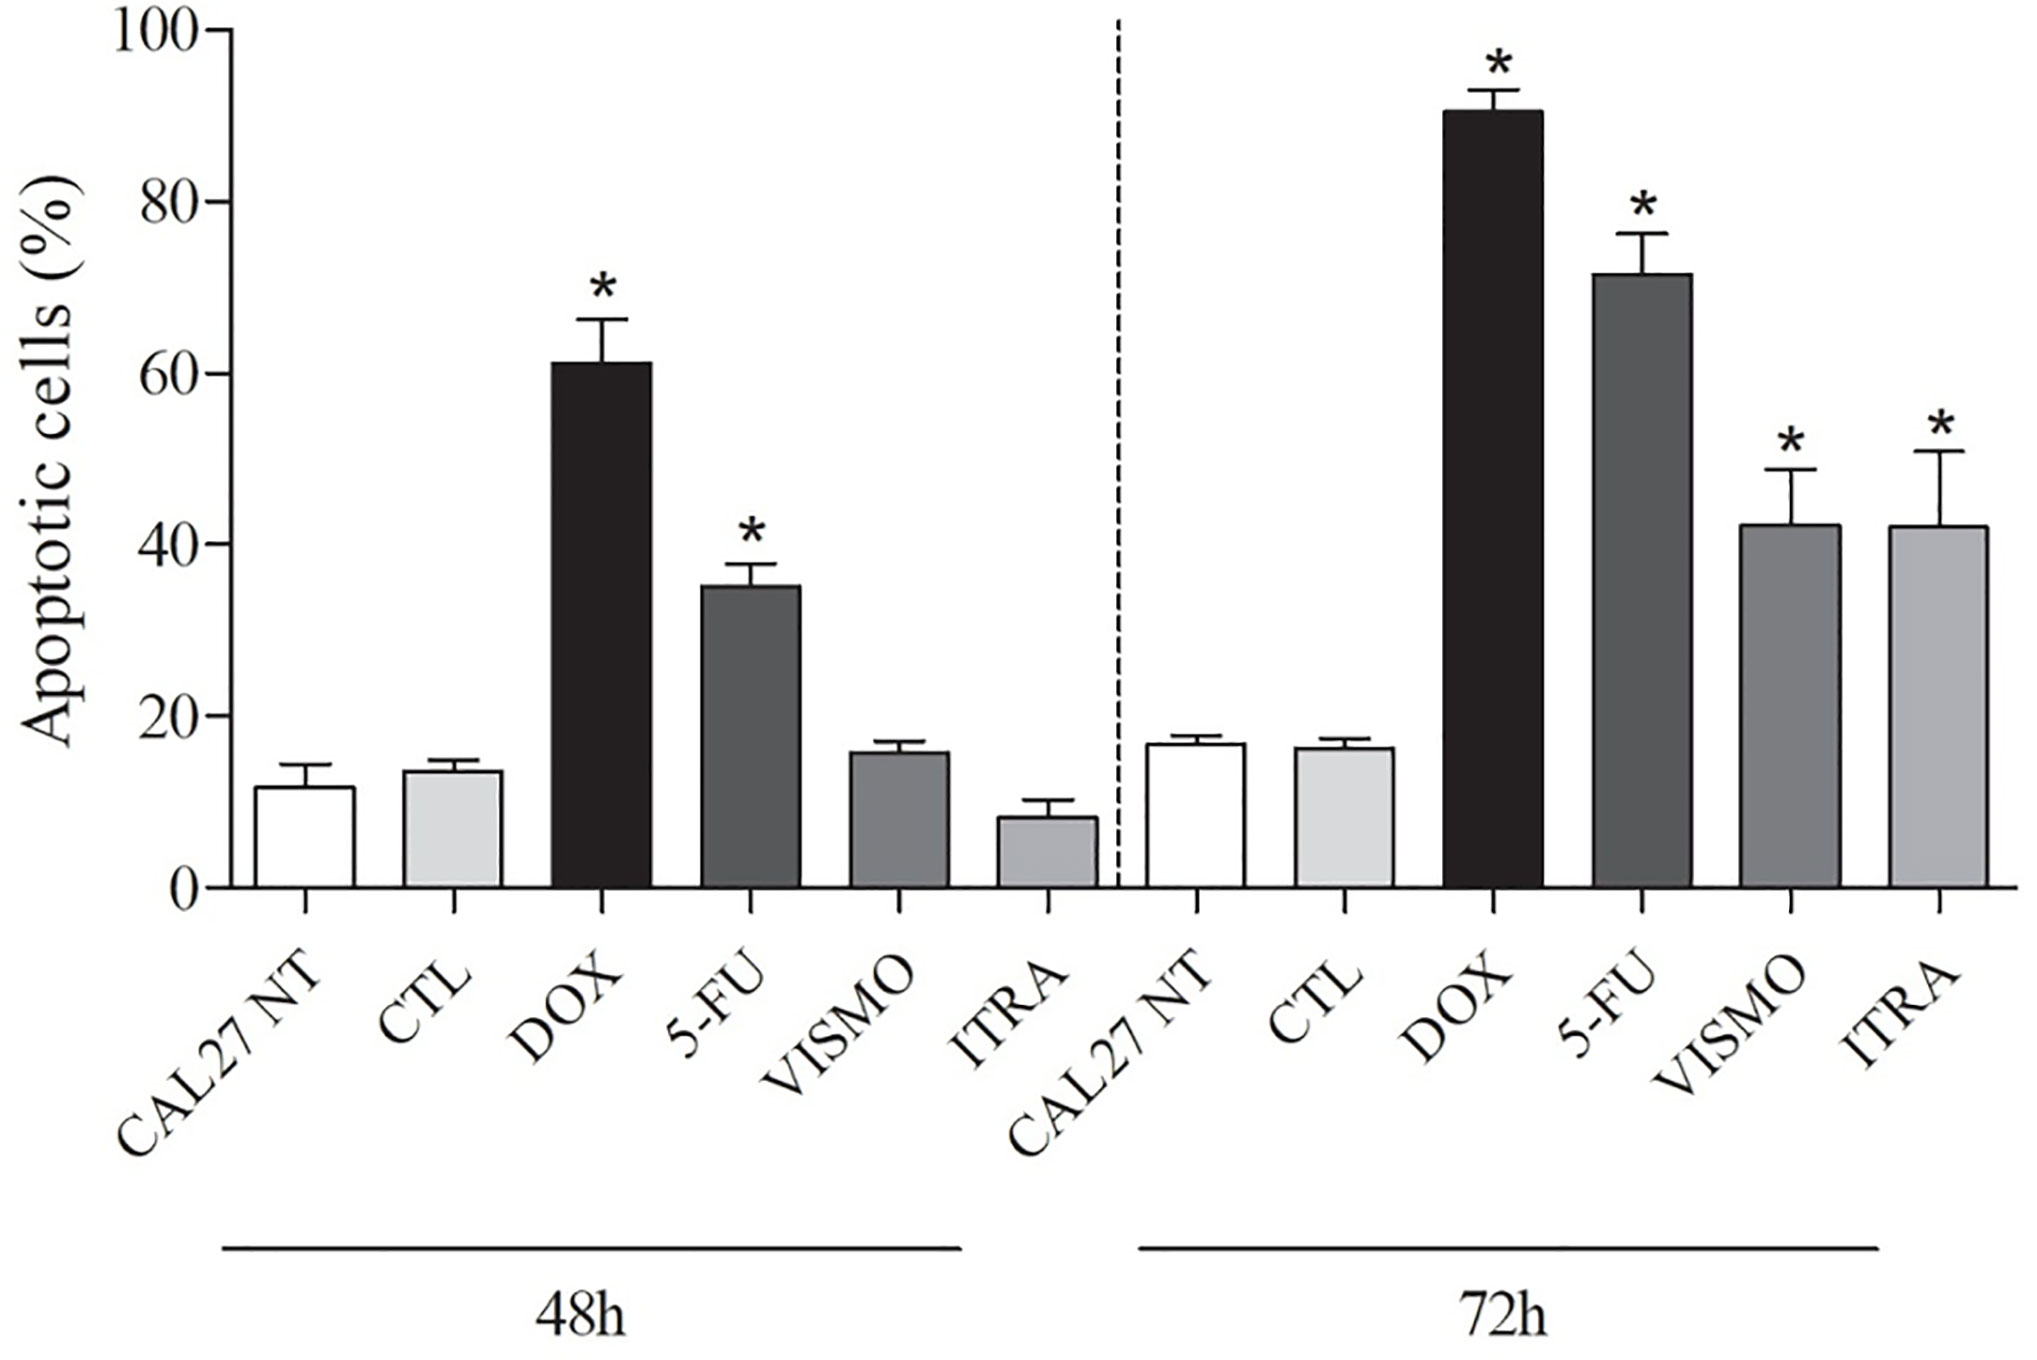
Figure 4 Effects of vismodegib and itraconazole on the externalization of phosphatidylserine in CAL27 cells, as determined by flow cytometry using annexin V-FITC after 48 and 72 h of treatment. Negative control was treated with the vehicle (0.2% DMSO) used to solubilize and dilute test compounds. Doxorubicin (DOX, 1 μg/ml) and 5-FU (10 μg/ml) were used as positive controls. Values are expressed as means ± S.E.M. from three independent experiments performed in duplicate. Cellular debris was omitted from analyzes and 10,000 events were analyzed per sample. *p < 0.05 when compared to negative controls by ANOVA (analysis of variance) followed by the Student Newman-Keuls test.
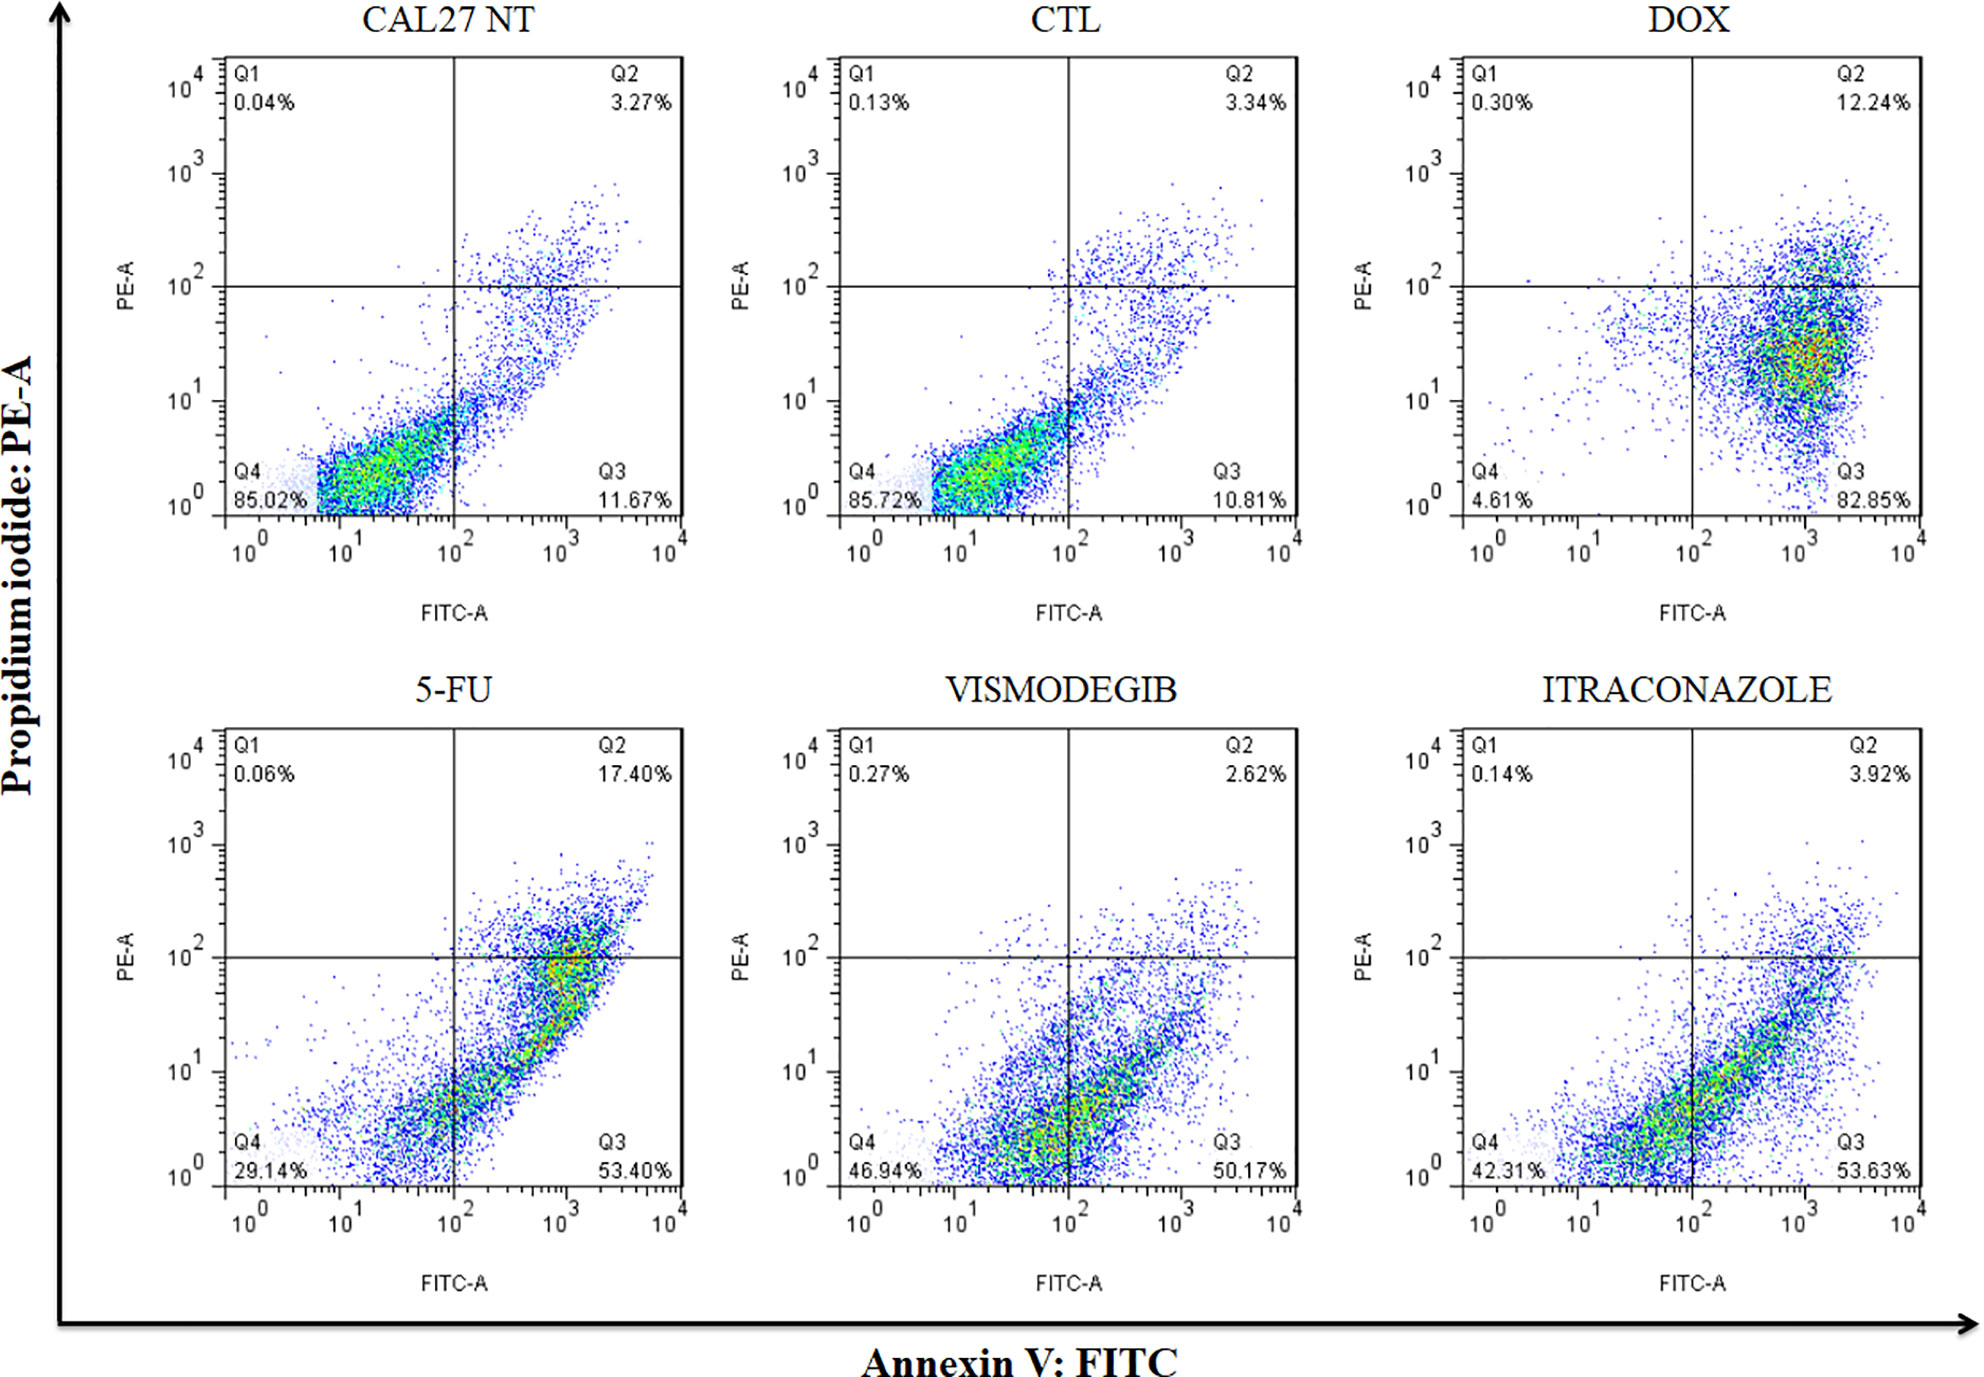
Figure 5 Representative flow cytometry dot plots show the percentage of cells in viable, early apoptotic, late apoptotic, and necrotic stages in CAL27 cells treated with vismodegib and itraconazole after 72 h of treatment. Negative control (DMSO, 0.2%) was used to solubilize and dilute all tested compounds. Doxorubicin (DOX, 1 μg/ml) and 5-FU (10 μg/ml) were used as positive controls. Data represents results from three independent experiments performed in duplicate. Cell debris was omitted from analyses; 10,000 events was analyzed per sample.
SMO Inhibitors Induced DNA Fragmentation
After 72 h of treatment with vismodegib and itraconazole (50 µg/ml), an increased number of CAL27 cells in the Sub-G1 phase were found compared to negative controls (CAL27 NT and CTL groups), as well as reductions in cell populations in the G0-G1 and S phases (Figures 6 and S6).
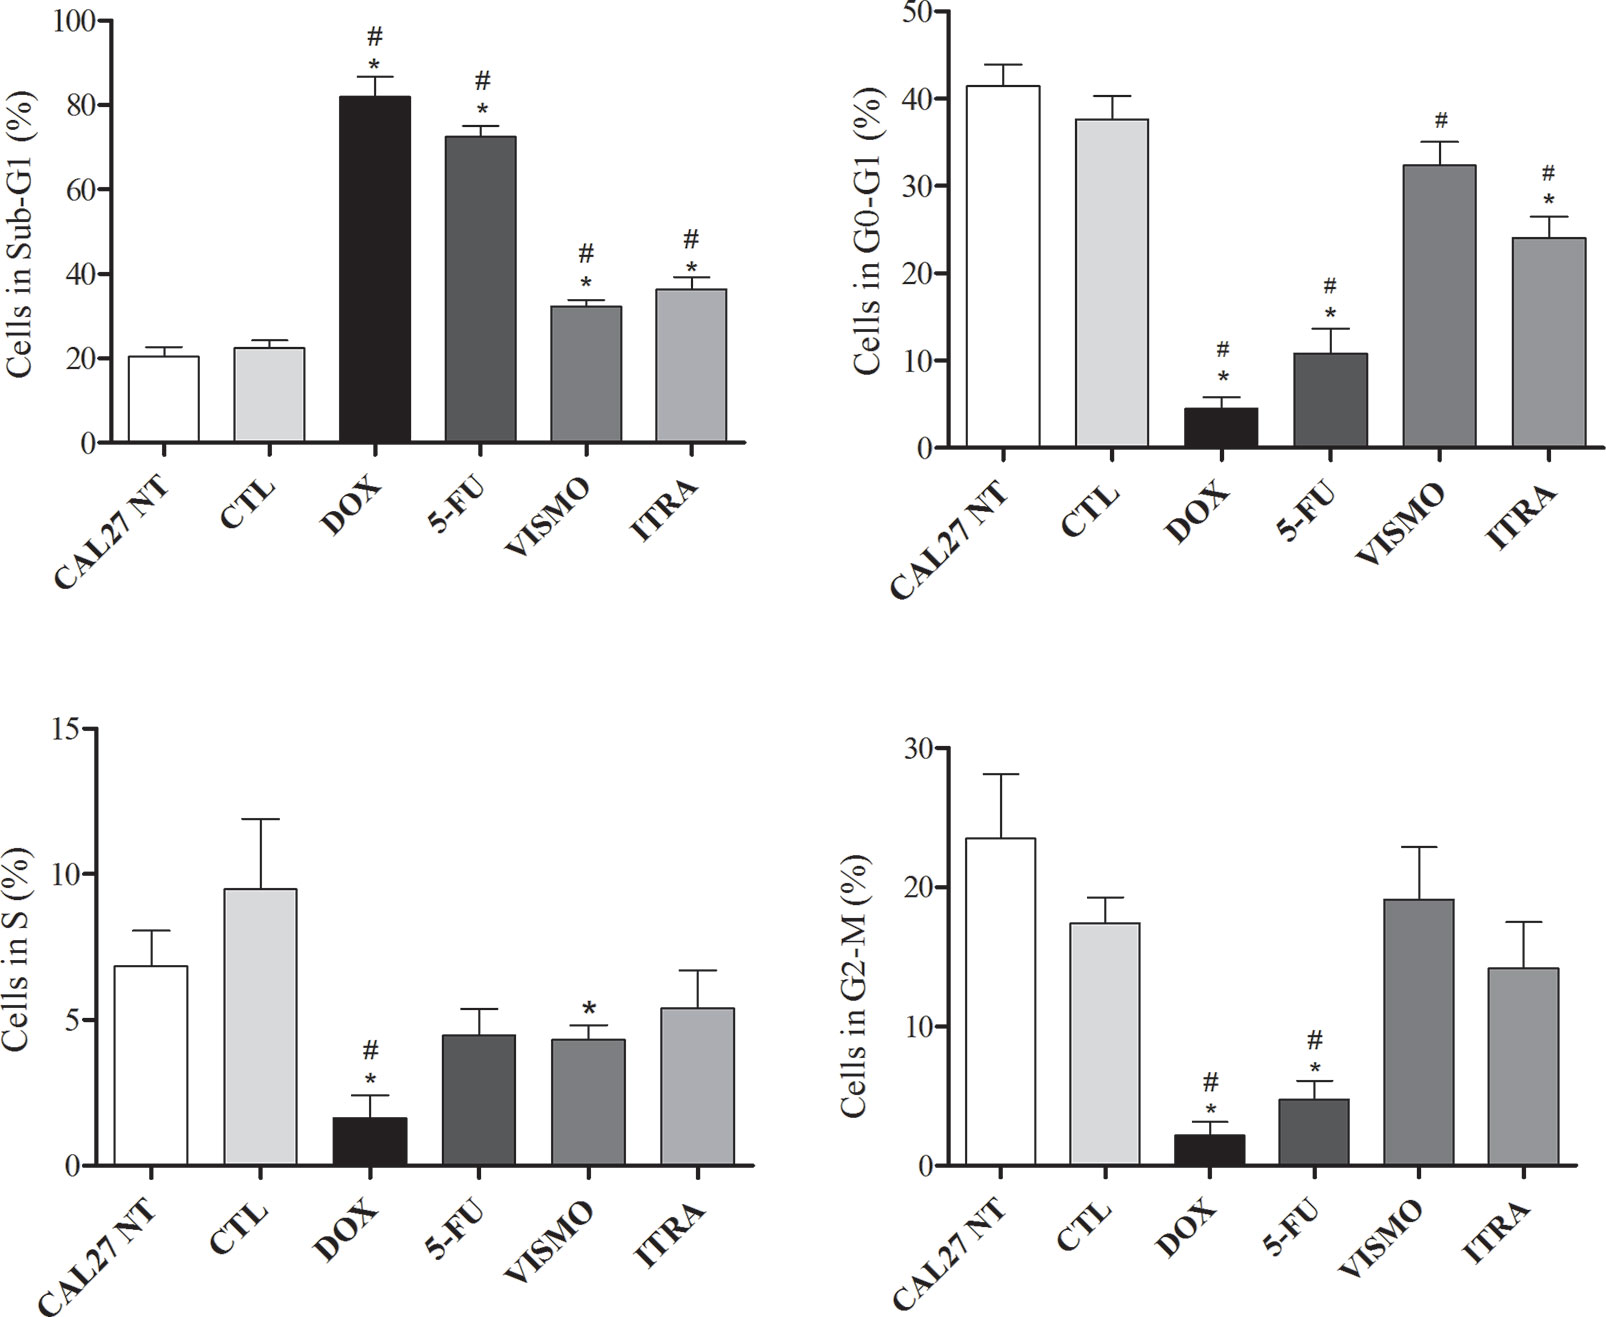
Figure 6 Effects of SMO inhibitors on cell cycle and internucleosomal DNA fragmentation in CAL27 cells after 72 h of treatment. Negative control was treated with the vehicle (0.2% DMSO) used to solubilize and dilute test compounds. Doxorubicin (DOX, 1 μg/ml) and 5-FU (10 μg/ml) were used as positive controls. Values are shown as means ± S.E.M. from three independent experiments carried out in duplicate. Cellular debris was omitted from analyzes and 10,000 events were analyzed per sample. p < 0.05 compared to the CTL group by ANOVA, followed by the Student Newman-Keuls test. * and # indicate significant differences in relation to negative control (CTL, DMSO 0.2%) and CAL27-NT, respectively.
Discussion
HH pathway activity has been shown to lead to the development of several human tumors (16–24, 27, 61), including OSCC (15, 62–65) and other cell lineages of this type of tumor (66). The results presented here corroborate the participation of this signaling pathway in OSCC, providing a basis for efforts to investigate and develop targeted pathway inhibitors. As HH pathway represents a potential pharmacological target in OSCC, some drugs developed to target SMO may prove useful. More than 50 compounds have been identified as inhibitors of HH signaling in cancer (67), and, of these, vismodegib was approved in 2012 by FDA for the treatment of advanced or metastatic adult basal-cell carcinoma. Although vismodegib and itraconazole have been shown to strongly inhibit HH signaling in several types of cancers (34, 53), the inhibition potential in oral cancer cells has not been well investigated.
The present study demonstrates that SMO inhibitors, vismodegib and itraconazole, successfully reduced the gene expression levels of SMO, PTCH1, and GLI1, reduced the viability of OSCC CAL27 cells and altered the morphology of this cell line in a time- and concentration-dependent manner. In addition, these inhibitors induced apoptosis and increased DNA fragmentation, demonstrating the therapeutic potential of inhibiting the expression of HH pathway components in OSCC.
The treatment of CAL27 cells with vismodegib or itraconazole reduced SMO, PTCH1, and GLI1 gene expression after 24 h, similarly to what was observed by Hu et al. (49), who reported reduced HH pathway component expression after treatment with itraconazole and vismodegib (31, 34, 35, 45, 68). GLI1, a transcription factor of HH pathway, is believed to regulate the expression of genes involved in proliferation, survival, and cell viability (69, 70) and the blockage of HH pathway may inhibit these cancer hallmarks.
In fact, after 72 h of treatment with vismodegib or itraconazole, alterations in cell cycle distribution and increases in DNA fragmentation were observed, which seems to indicate apoptosis (71). In addition, treatment with vismodegib was observed to reduce the relative quantity of S-phase cells. Other authors showed that treatment with 50 μM vismodegib led to an increase in the apoptotic fraction in colorectal (72) and prostate cancer cells (73), whereas itraconazole also induced apoptosis in gastric cancer cells (49). On the other hand, cyclopamine, another SMO inhibitor, failed to induce significant apoptosis in human pancreatic carcinoma cells (74).
Therefore, SMO inhibitors tested here were shown to inhibit the growth of OSCC cells through the reduction of cell viability, induction of apoptosis, and alterations of cell cycle phases. Moreover, we found reduced size and increased granularity in CAL27 OSCC cells treated with these SMO inhibitors, which indicates the involvement of apoptosis or senescence either of which cause cells to lose their proliferative potential. This effect has been observed in the use of chemotherapeutic agents, and may represent and interesting marker for the selection of new drugs with anticancer potential (40).
Considering these results, we can indicate that HH pathway is active in OSCC cells and the pharmacological inhibition of this pathway in CAL27 OSCC cell lines with SMO inhibitors reduced the expression of PTCH1, SMO, and GLI1 genes, suggesting a reduction in the activity of this signaling pathway after 24 h of treatment. SMO inhibitors were capable of reducing viability and altering CAL27 OSCC cell line morphology in a time and concentration-dependent manner. In addition, these inhibitors have induced apoptosis and increased DNA fragmentation in this cell type. Figure 7 summarizes our results.
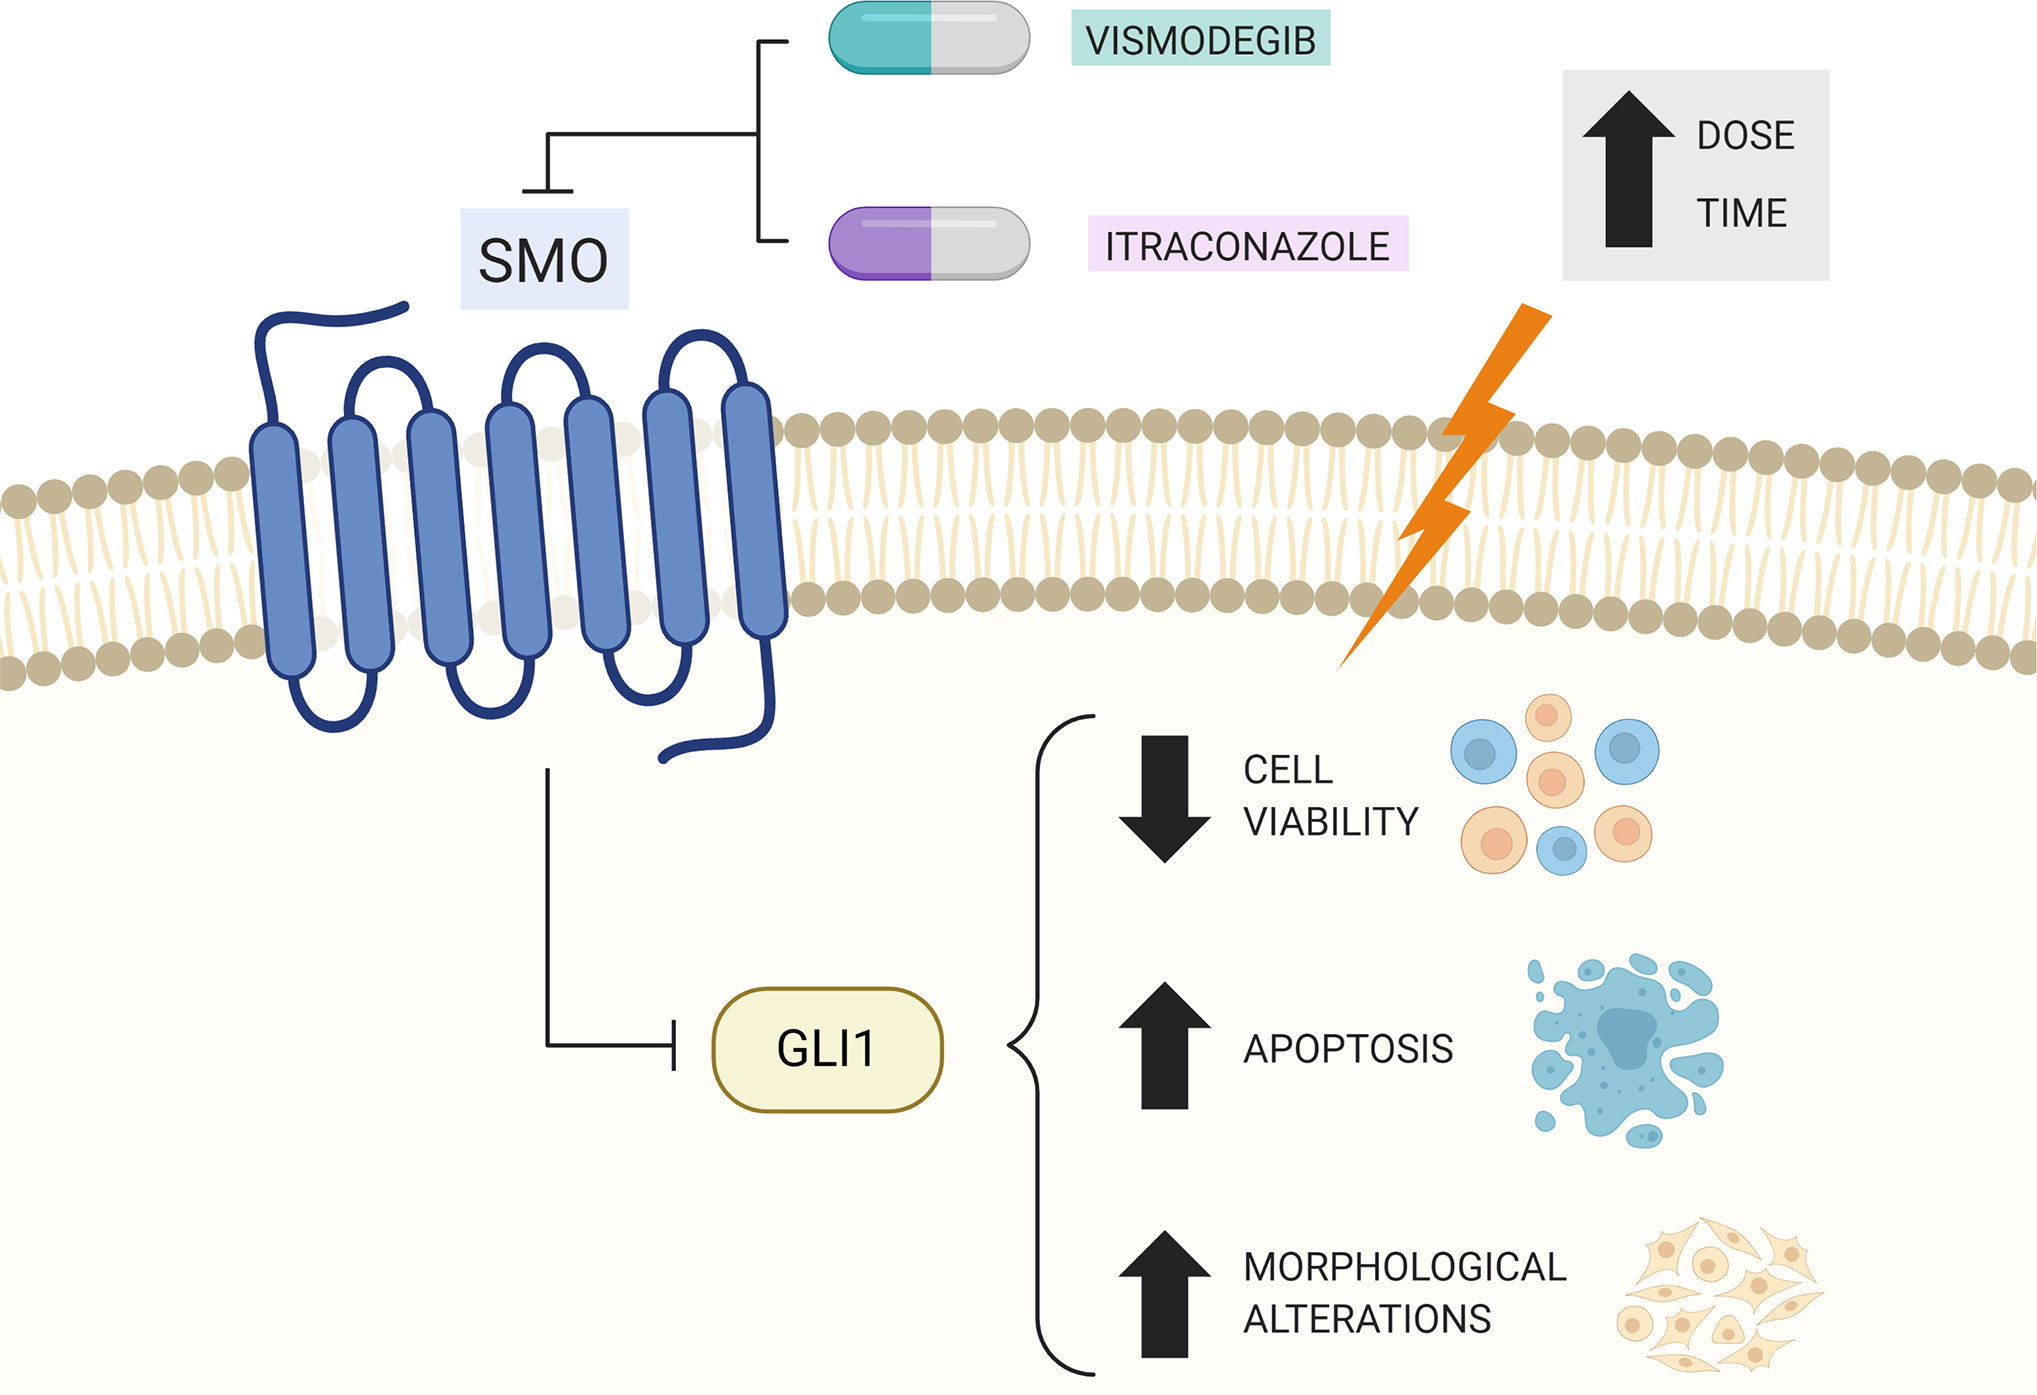
Figure 7 Summary of therapeutic effects of Vismodegib and Itraconazole treatment in CAL27 cells. Created with BioRender.com.
While the in vitro results of the present study are promising in the CAL27 OSCC cell line, with demonstrated effects on viability, morphology, HH gene expression, cell cycle, and cell death, the efficacy of vismodegib and itraconazole in OSCC should be evaluated in vivo in the future. This data will be highly relevant in pre-clinical studies designed to assess the potential therapeutic use of vismodegib and itraconazole in OSCC treatments.
Data Availability Statement
The original contributions presented in the study are included in the article/Supplementary Material. Further inquiries can be directed to the corresponding author.
Ethics Statement
This study was approved by The Institutional Review Board of the Oswaldo Cruz Foundation (FIOCRUZ,Salvador, Bahia, Brazil). All participants signed a term of informed consent to participate in the study.
Author Contributions
Conceptualization: CR, TP, and DB. Methodology: CR, RD, RF, RC, CS, TP. Software: RG, RD, LV, MV. Validation: RF, LR, RC, MV, LV. Formal analysis: CR, CS, MS, DB, RC, MR. Investigation: RF, RD, MV, LV, RG, AD, CS, and LR. Resources: CR, RC, MR, MS, DB, and AD. Writing—original draft preparation: CR, RF, RD, TP, and MS. Writing—review and editing: CR, RF, RD, MS. Visualization: all authors. Supervision: CR, DB, and RD. Project administration: CR, DB, MR, MS. Funding acquisition: CR. All authors contributed to the article and approved the submitted version.
Funding
This research was funded by FAPESB, grant number APP006/2016 and National Council for Scientific and Technological Development (CNPq) grant number 308595/2016-5.
Conflict of Interest
The authors declare that the research was conducted in the absence of any commercial or financial relationships that could be construed as a potential conflict of interest.
Acknowledgments
The authors are grateful to the flow cytometry and electron microscopy platforms of FIOCRUZ-Bahia for collecting the flow cytometric data and acquiring the photomicrographs. We also thank Andris K. Walter for providing English translation and consulting services.
Supplementary Material
The Supplementary Material for this article can be found online at: https://www.frontiersin.org/articles/10.3389/fonc.2020.563838/full#supplementary-material
References
1. Rivera C, Venegas B. Histological and molecular aspects of oral squamous cell carcinoma (Review). Oncol Lett (2014) 8:7–11. doi: 10.3892/ol.2014.2103
2. Chi AC, Day TA, Neville BW. Oral Cavity and Oropharyngeal Squamous Cell Carcinoma—An Update. CA. Cancer J Clin (2015) 65:401–21. doi: 10.3322/caac.21293
3. Moro JS, Maroneze MC, Ardenghi TM, Barin LM, Danesi CC. Oral and oropharyngeal cancer: epidemiology and survival analysis. Einstein (São Paulo) (2018) 16:1–5. doi: 10.1590/S1679-45082018AO4248
4. Ferlay J, Colombet M, Soerjomataram I, Mathers C, Parkin DM, Piñeros M, et al. Estimating the global cancer incidence and mortality in 2018: GLOBOCAN sources and methods. Int J Cancer (2018) 00:1–13. doi: 10.1002/ijc.31937
5. Jemal A, Bray F, Center MM, Ferlay J, Ward E, Forman D. Global cancer statistics. CA Cancer J Clin (2011) 61:69–90. doi: 10.3322/caac.20107
6. Brands MT, Brennan PA, Verbeek ALM, Merkx MAW, Geurts SME. Follow-up after curative treatment for oral squamous cell carcinoma. A critical appraisal of the guidelines and a review of the literature. Eur J Surg Oncol (2018) 44:559–65. doi: 10.1016/j.ejso.2018.01.004
7. Liu T, Chua B, Batstone M. Postoperative Radiotherapy for Oral Squamous Cell Carcinoma With Histologic Risk Factors: Are We Over-Treating? J Oral Maxillofac Surg (2018) 76:1565–70. doi: 10.1016/j.joms.2018.01.014
8. World Health Organization (WHO). WHO classification of Head and Neck tumors. 4th edition. El-naggar A, Chan J, Grandis J, Takata T, Slootweg P, editors. Lyon, France: International Agency for Research on Cancer (2017). ISBN: SBN 978-92-832-2438-9.
9. Fronie A, Bunget A, Afrem E, Preoţescu LL, CorlanPuşcu D, Streba L, et al. Squamous cell carcinoma of the oral cavity: clinical and pathological aspects. Rom J Morphol Embryol (2013) 54:343–8.
10. Adrien J, Bertolus C, Gambotti L, Mallet A, Baujat B. Why are head and neck squamous cell carcinoma diagnosed so late? Influence of health care disparities and socio-economic factors. Oral Oncol (2014) 50:90–7. doi: 10.1016/j.oraloncology.2013.10.016
12. Yesensky JA, Hasina R, Wroblewski KE, Bellairs J, Gooi Z, Saloura V, et al. Role of dental hardware in oral cavity squamous cell carcinoma in the low-risk nonsmoker nondrinker population. Head Neck (2018) 40:784–92. doi: 10.1002/hed.25059
13. Rhodus NL, Kerr AR, Patel K. Oral Cancer: Leukoplakia, Premalignancy, and Squamous Cell Carcinoma. Dent Clin North Am (2014) 58:315–40. doi: 10.1016/j.cden.2013.12.004
14. Hartner L. Chemotherapy for Oral Cancer. Dent Clin North Am (2018) 62:87–97. doi: 10.1016/j.cden.2017.08.006
15. Cavicchioli Buim ME, Gurgel CAS, Gonçalves Ramos EA, Lourenço SV, Soares FA. Activation of sonic hedgehog signaling in oral squamous cell carcinomas: a preliminary study. Hum Pathol (2011) 42:1484–90. doi: 10.1016/j.humpath.2010.12.015
16. Hong Z, Bi A, Chen D, Gao L, Yin Z, Luo L. Activation of hedgehog signaling pathway in human non-small cell lung cancers. Pathol Oncol Res (2014) 20:917–22. doi: 10.1007/s12253-014-9774-x
17. Abe Y, Tanaka N. The Hedgehog Signaling Networks in Lung Cancer: The Mechanisms and Roles in Tumor Progression and Implications for Cancer Therapy. BioMed Res Int (2016) 2016:7969286. doi: 10.1155/2016/7969286
18. Liu X, Liu J, Zhang X, Tong Y, Gan X. MiR-520b promotes the progression of non-small cell lung cancer through activating Hedgehog pathway. J Cell Mol Med (2019) 23:205–15. doi: 10.1111/jcmm.13909
19. Benvenuto M, Masuelli L, De Smaele E, Fantini M, Mattera R, Cucchi D, et al. In vitro and in vivo inhibition of breast cancer cell growth by targeting the Hedgehog/GLI pathway with SMO (GDC-0449) or GLI (GANT-61) inhibitors. Oncotarget (2016) 7:9250–70. doi: 10.18632/oncotarget.7062
20. Skoda AM, Simovic D, Karin V, Kardum V, Vranic S, Serman L. The role of the Hedgehog signaling pathway in cancer: A comprehensive review. Bosn J Basic Med Sci (2018) 18:8–20. doi: 10.17305/bjbms.2018.2756
21. Chen Q, Gao G, Luo S. Hedgehog signaling pathway and ovarian cancer. Chin J Cancer Res (2013) 25:346–53. doi: 10.7150/jca.17712
22. Zhang H, Wang Y, Chen T, Zhang Y, Xu R, Wang W, et al. Aberrant Activation Of Hedgehog Signalling Promotes Cell Migration And Invasion Via Matrix Metalloproteinase-7 In Ovarian Cancer Cells. J Cancer (2019) 10:990–1003. doi: 10.7150/jca.26478
23. Chan IS, Guy CD, Chen Y, Lu J, Swiderska-Syn M, Michelotti GA, et al. Paracrine Hedgehog signaling drives metabolic changes in hepatocellular carcinoma. Cancer Res (2012) 72:6344–50. doi: 10.1158/0008-5472.CAN-12-1068
24. Della Corte CM, Viscardi G, Papaccio F, Esposito G, Martini G, Ciardiello D, et al. Implication of the Hedgehog pathway in hepatocellular carcinoma. World J Gastroenterol (2017) 23:4330–40. doi: 10.3748/wjg.v23.i24.4330
25. Katoh Y, Katoh M. Hedgehog signaling pathway and gastrointestinal stem cell signaling network (Review). Int J Mol Med (2006) 18:1019–23. doi: 10.3892/ijmm.18.6.1019
26. Shi Y, Sun G, Zhao C, Stewart R. Neural stem cell self-renewal. C. Rit Rev Oncol Hematol (2008) 65:43–53. doi: 10.1016/j.critrevonc.2007.06.004
27. Varjosalo M, Björklund M, Cheng F, Syvänen H, Kivioja T, Kilpinen S, et al. Application of active and kinase-deficient kinome collection for identification of kinases regulating hedgehog signaling. Cell (2008) 133:537–48. doi: 10.1016/j.cell.2008.02.047
28. Amankulor NM, Hambardzumyan D, Pyonteck SM, Becher OJ, Joyce JA, Holland EC. Sonic hedgehog pathway activation is induced by acute brain injury and regulated by injury-related inflammation. J Neurosci (2009) 29:10299–308. doi: 10.1523/JNEUROSCI.2500-09.2009
29. Yue S, Chen Y, Cheng SY. Hedgehog signaling promotes the degradation of tumor suppressor Sufu through the ubiquitin-proteasome pathway. Oncogene (2009) 28:492–9. doi: 10.1038/onc.2008.403
30. Didiasova M, Schaefer L, Wygrecka M. Targeting gli transcription factors in cancer. Molecules (2018) 23:1–19. doi: 10.3390/molecules23051003
31. Dirix L. Discovery and Exploitation of Novel Targets by Approved Drugs. J Clin Oncol (2014) 32:1–2. doi: 10.1200/JCO.2013.53.7118
33. Sekulic A, Migden MR, Oro AE, Dirix L, Lewis KD, Hainsworth JD, et al. Efficacy and Safety of Vismodegib in Advanced Basal-Cell Carcinoma. N Engl J Med (2012) 366:2171–9. doi: 10.1056/NEJMoa1113713
34. Meiss F, Andrlová H, Zeiser R. Vismodegib. In: . Small molecules in Oncology. Berlin: Springer (2018). p. 125–39.
35. Carpenter RL, Ray H. Safety and Tolerability of Sonic Hedgehog Pathway Inhibitors in Cancer. Drug Saf (2019) 42:263–79. doi: 10.1007/s40264-018-0777-5
36. Vismodegib in Treating Patients With Advanced Chondrosarcomas (NCT01267955). Available at: https://clinicaltrials.gov/ct2/show/NCT01267955?term=NCT01267955&rank=1 (Accessed Jun 11, 2019).
37. RO4929097 and Vismodegib in Treating Patients With Breast Cancer That is Metastatic or Cannot Be Removed By Surgery (NCT01071564). Available at: https://clinicaltrials.gov/ct2/show/NCT01071564?term=NCT01071564&rank=1 (Accessed Jun 11, 2019).
38. Vismodegib in Treating Patients With Recurrent or Refractory Medulloblastoma (NCT00939484). Available at: https://clinicaltrials.gov/ct2/show/NCT00939484?term=NCT00939484&rank=1 (Accessed Jun 11, 2019).
39. Vismodegib and Gamma-Secretase/Notch Signalling Pathway Inhibitor RO4929097 in Treating Patients With Advanced or Metastatic Sarcoma (NCT01154452). Available at: https://clinicaltrials.gov/ct2/show/NCT01154452?term=NCT01154452&rank=1 (Accessed Jun 11, 2019).
40. Chang ALS, Oro AE. Initial assessment of tumor regrowth after vismodegib in advanced Basal cell carcinoma. Arch Dermatol (2012) 148:1324–5. doi: 10.1001/archdermatol.2012.2354
41. Rudin CM, Hann CL, Laterra J, Yauch RL, Callahan CA, Fu L, et al. Treatment of Medulloblastoma with Hedgehog Pathway Inhibitor GDC-0449. N Engl J Med (2009) 361:1173–8. doi: 10.1056/NEJMoa0902903
42. Graham RA, Lum BL, Cheeti S, Jin JY, Jorga K, Von Hoff DD, et al. Pharmacokinetics of hedgehog pathway inhibitor vismodegib (GDC-0449) in patients with locally advanced or metastatic solid tumors: The role of alpha-1-acid glycoprotein binding. Clin Cancer Res (2011) 17:2512–20. doi: 10.1158/1078-0432.CCR-10-2736
43. Takebe N, Miele L, Harris PJ, Jeong W, Bando H, Kahn M, et al. Targeting Notch, Hedgehog, and Wnt pathways in cancer stem cells: Clinical update. Nat Rev Clin Oncol (2015) 12:445–64. doi: 10.1038/nrclinonc.2015.61
44. Ramaswamy B, Lu Y, Teng KY, Nuovo G, Li X, Shapiro CL, et al. Hedgehog signaling is a novel therapeutic target in tamoxifen-resistant breast cancer aberrantly activated by PI3K/AKT pathway. Cancer Res (2012) 72:5048–59. doi: 10.1158/0008-5472.CAN-12-1248
45. Wahid M, Jawed A, Mandal RK, Dar SA, Khan S, Akhter N, et al. Vismodegib, itraconazole and sonidegib as hedgehog pathway inhibitors and their relative competencies in the treatment of basal cell carcinomas. Crit Rev Oncol Hematol (2016) 98:235–41. doi: 10.1016/j.critrevonc.2015.11.006
46. Dong X, Wang C, Chen Z, Zhao W. Overcoming the resistance mechanisms of Smoothened inhibitors. Drug Discovery Today (2018) 23:704–10. doi: 10.1016/j.drudis.2018.01.012
47. Kim J, Tang JY, Gong R, Kim J, Lee JJ, Clemons KV, et al. Itraconazole, a Commonly Used Antifungal that Inhibits Hedgehog Pathway Activity and Cancer Growth. Cancer Cell (2010) 17:388–99. doi: 10.1016/j.ccr.2010.02.027
48. Kim DJ, Kim J, Spaunhurst K, Montoya J, Khodosh R, Chandra K, et al. Open-label, exploratory phase II trial of oral itraconazole for the treatment of basal cell carcinoma. J Clin Oncol (2014) 32:745–51. doi: 10.1200/JCO.2013.49.9525
49. Hu Q, Hou Y-C, Huang J, Fang J-Y, Xiong H. Itraconazole induces apoptosis and cell cycle arrest via inhibiting Hedgehog signaling in gastric cancer cells. J Exp Clin Cancer Res (2017) 36:50. doi: 10.1186/s13046-017-0526-0
50. Itraconazole as a Targeted Therapy for Inhibiting Hedgehog Pathway Signaling in Esophageal Cancer Patients (NCT02749513). Available at: https://clinicaltrials.gov/ct2/show/NCT02749513?term=NCT02749513&rank=1 (Accessed Jun 11, 2019).
51. A Study of the Safety, Tolerability and Effectiveness of Hydroxychloroquine and Itraconazole in Platinum-resistant Epithelial Ovarian Cancer (NCT03081702). Available at: https://clinicaltrials.gov/ct2/show/NCT03081702?term=NCT03081702&rank=1 (Accessed Jun 11, 2019).
52. Neoadjuvant Itraconazole in Non-small Cell Lung Cancer (NCT02357836). Available at: https://clinicaltrials.gov/ct2/show/NCT02357836?term=NCT02357836&rank=1 (Accessed Jun 11, 2019).
53. Tsubamoto H, Ueda T, Inoue K, Sakata K, Shibahara H, Sonoda T. Repurposing itraconazole as an anticancer agent. Oncol Lett (2017) 14:1240–6. doi: 10.3892/ol.2017.6325
54. Sasai K, Romer JT, Lee Y, Finkelstein D, Fuller C, McKinnon PJ, et al. Shh pathway activity is down-regulated in cultured medulloblastoma cells: implications for preclinical studies. Cancer Res (2006) 66:4215–22. doi: 10.1158/0008-5472.CAN-05-4505
55. Vandesompele J, De Preter K, Pattyn F, Poppe B, Van Roy N, De Paepe A, et al. Accurate normalization of real-time quantitative RT-PCR data by geometric averaging of multiple internal control genes. Genome Biol (2002) 3:0034.1–0034.11. doi: 10.1186/gb-2002-3-7-research0034. RESEARCH0034.
56. Ahmed SA, Gogal RMJ, Walsh JE. A new rapid and simple non-radioactive assay to monitor and determine the proliferation of lymphocytes: an alternative to [3H] thymidine incorporation assay. J Immunol Methods (1994) 170:211–24. doi: 10.1016/0022-1759(94)90396-4
57. Livak KJ, Schmittgen TD. Analysis of relative gene expression data using real-time quantitative PCR and the 2(-Delta Delta C(T)). Method Methods (2001) 25:402–8. doi: 10.1006/meth.2001.1262
58. Beachy PA, Hymowitz SG, Lazarus RA, Leahy DJ, Siebold C. Interactions between Hedgehog proteins and their binding partners come into view. Genes Dev (2010) 24:2001–12. doi: 10.1101/gad.1951710
59. ten Haaf A, Bektas N, von Serenyi S, Losen I, Arweiler C, Hartmann A, et al. Expression of the glioma-associated oncogene homolog (GLI) 1 in human breast cancer is associated with unfavourable overall survival. BMC Cancer (2009) 9:298. doi: 10.1186/1471-2407-9-298
60. Blotta S, Jakubikova J, Calimeri T, Roccaro AM, Amodio N, Azab AK, et al. Canonical and noncanonical Hedgehog pathway in the pathogenesis of multiple myeloma. Blood (2012) 120:5002–13. doi: 10.1182/blood-2011-07-368142
61. Yauch RL, Gould SE, Scales SJ, Tang T, Tian H, Ahn CP, et al. A paracrine requirement for hedgehog signalling in cancer. Nature (2008) 455:406–10. doi: 10.1038/nature07275
62. Wang YF, Chang CJ, Lin CP, Chang SY, Chu PY, Tai SK, et al. Expression of hedgehog signaling molecules as a prognostic indicator of oral squamous cell carcinoma. Head Neck (2012) 34:1556–61. doi: 10.1002/hed.21958
63. Leovic D, Sabol M, Ozretic P, Musani V, Car D, Marjanovic K, et al. Hh-Gli signaling pathway activity in oral and oropharyngeal squamous cell carcinoma. Head Neck (2012) 34:104–12. doi: 10.1002/hed.21696
64. Fan HX, Wang S, Zhao H, Liu N, Chen D, Sun M, et al. Sonic hedgehog signaling may promote invasion and metastasis of oral squamous cell carcinoma by activating MMP-9 and E-cadherin expression. Med Oncol (2014) 31:41. doi: 10.1007/s12032-014-0041-5
65. Srinath S, Iyengar AR, Mysorekar V. Sonic hedgehog in oral squamous cell carcinoma: An immunohistochemical study. J Oral Maxillofac Pathol (2016) 20:377–83. doi: 10.4103/0973-029X.190906
66. Yan M, Wang L, Zuo H, Zhang Z, Chen W, Mao L, et al. HH/GLI signalling as a new therapeutic target for patients with oral squamous cell carcinoma. Oral Oncol (2011) 47:504–9. doi: 10.1016/j.oraloncology.2011.03.027
67. Hadden MK. Hedgehog pathway inhibitors: a patent review (2009–present). Expert Opin Ther Pat (2013) 23:345–61. doi: 10.1517/13543776.2013.757304
68. Singh BN, Fu J, Srivastava RK, Shankar S. Hedgehog signaling antagonist GDC-0449 (Vismodegib) inhibits pancreatic cancer stem cell characteristics: molecular mechanisms. PloS One (2011) 6:e27306. doi: 10.1371/journal.pone.0027306
69. Merchant JL, Saqui-Salces M. Inhibition of Hedgehog signaling in the gastrointestinal tract: targeting the cancer microenvironment. Cancer Treat Rev (2014) 40:12–21. doi: 10.1016/j.ctrv.2013.08.003
70. Fattahi S, Pilehchian Langroudi M, Akhavan-Niaki H. Hedgehog signaling pathway: Epigenetic regulation and role in disease and cancer development. J Cell Physiol (2018) 233:5726–35. doi: 10.1002/jcp.26506
71. Kajstura M, Halicka HD, Pryjma J, Darzynkiewicz Z. Discontinuous fragmentation of nuclear DNA during apoptosis revealed by discrete “sub-G1” peaks on DNA content histograms. Cytometry A (2007) 71:125–31. doi: 10.1002/cyto.a.20357
72. Wu C, Hu S, Cheng J, Wang G, Tao K. Smoothened antagonist GDC-0449(Vismodegib) inhibits proliferation and triggers apoptosis in colon cancer cell lines. Exp Ther Med (2017) 13:2529–36. doi: 10.3892/etm.2017.4282
73. Mimeault M, Rachagani S, Muniyan S, Seshacharyulu P, Johansson SL, Datta K, et al. Inhibition of hedgehog signaling improves the anti-carcinogenic effects of docetaxel in prostate cancer. Oncotarget (2015) 6:3887–903. doi: 10.18632/oncotarget.2932
Keywords: oral squamous cell carcinoma, hedgehog pathway, vismodegib, itraconazole, real-time polymerase chain reaction
Citation: Freitas RD, Dias RB, Vidal MTA, Valverde LdF, Gomes Alves Costa R, Damasceno AKA, Sales CBS, Siquara da Rocha LdO, dos Reis MG, Soares MBP, Coletta RD, Pereira TA, Bezerra DP and Gurgel Rocha CA (2020) Inhibition of CAL27 Oral Squamous Carcinoma Cell by Targeting Hedgehog Pathway With Vismodegib or Itraconazole. Front. Oncol. 10:563838. doi: 10.3389/fonc.2020.563838
Received: 19 May 2020; Accepted: 15 October 2020;
Published: 10 November 2020.
Edited by:
Cirino Botta, Cosenza Hospital, ItalyReviewed by:
Fabrizio Martelli, National Institute of Health (ISS), ItalyFlavia Biamonte, Magna Græcia University of Catanzaro, Italy
Copyright © 2020 Freitas, Dias, Vidal, Valverde, Gomes Alves Costa, Damasceno, Sales, Siquara da Rocha, dos Reis, Soares, Coletta, Pereira, Bezerra and Gurgel Rocha. This is an open-access article distributed under the terms of the Creative Commons Attribution License (CC BY). The use, distribution or reproduction in other forums is permitted, provided the original author(s) and the copyright owner(s) are credited and that the original publication in this journal is cited, in accordance with accepted academic practice. No use, distribution or reproduction is permitted which does not comply with these terms.
*Correspondence: Clarissa Araújo Gurgel Rocha, Y2xhcmlzc2EuZ3VyZ2VsQGZpb2NydXouYnI=; Z3VyZ2VsLmNsYXJpc3NhQGdtYWlsLmNvbQ==
†These authors share first authorship