 Fenfang Zhou1†
 Dexin Shen1†
 Yaoyi Xiong1†Songtao Cheng1Huimin Xu1Gang Wang2,3,4
 Kaiyu Qian2,3,4
 Lingao Ju2,3*
 Xinhua Zhang1*
- 1Department of Urology, Zhongnan Hospital of Wuhan University, Wuhan, China
- 2Department of Biological Repositories, Zhongnan Hospital of Wuhan University, Wuhan, China
- 3Human Genetics Resource Preservation Center of Hubei Province, Wuhan, China
- 4Laboratory of Precision Medicine, Zhongnan Hospital of Wuhan University, Wuhan, China
Kidney renal clear cell carcinoma (KIRC) and kidney renal papillary cell carcinoma (KIRP) are the most common RCC types. RCC has high immune infiltration levels, and immunotherapy is currently one of the most promising treatments for RCC. Collagen triple helix repeat containing 1 (CTHRC1) is an extracellular matrix protein that regulates tumor invasion and modulates the tumor microenvironment. However, the association of CTHRC1 with the prognosis and tumor-infiltrating lymphocytes of KIRP and KIRC has not been reported. We examined the CTHRC1 expression differences in multiple tumor tissues and normal tissues via exploring TIMER, Oncomine, and UALCAN databases. Then, we searched the Kaplan-Meier plotter database to evaluate the correlation of CTHRC1 mRNA level with clinical outcomes. Subsequently, the TIMER platform and TISIDB website were chosen to assess the correlation of CTHRC1 with tumor immune cell infiltration level. We further explored the causes of aberrant CTHRC1 expression in tumorigenesis. We found that CTHRC1 level was significantly elevated in KIRP and KIRC tissues relative to normal tissues. CTHRC1 expression associates with tumor stage, histology, lymph node metastasis, and poor clinical prognosis in KIRP. The CTHRC1 level correlates to tumor grade, stage, nodal metastasis, and worse survival prognosis. Additionally, CTHRC1 is positively related to different tumor-infiltrating immune cells in KIRP and KIRC. Moreover, CTHRC1 was closely correlated with the gene markers of diverse immune cells. Also, high CTHRC1 expression predicted a worse prognosis in KIRP and KIRC based on immune cells. Copy number variations (CNV) and DNA methylation might contribute to the abnormal upregulation of CTHRC1 in KIRP and KIRC. In conclusion, CTHRC1 can serve as a biomarker to predict the prognosis and immune infiltration in KIRP and KIRC.
Introduction
Kidney cancer is among the top ten causes of cancer-related deaths. There are various subtypes of kidney cancer based on mixed histology, clinical course, and gene course. Renal cell carcinoma (RCC) is the most important type of kidney cancer (1). Besides, kidney renal clear cell carcinoma (KIRC) and kidney renal papillary cell carcinoma (KIRP) account for almost 95% of all renal cell cancers (2). The diagnosis, examination, surgery, and drug therapy of RCC have been advanced. However, its clinical outcome remains unsatisfactory (3, 4). RCC is a heterogeneous tumor that requires useful molecular markers suitable for personalized therapy (5, 6).
During cancer tumorigenesis and progression, tumor cells are affected by the tumor-infiltrating immune cells (7, 8). The immune invasion of the tumor is closely associated with the clinical prognosis of RCC. Precious studies indicated that tumor-infiltrating macrophages, regulatory T Cells (Treg cells), and CD8+ T cells influence RCC treatment outcomes (9–11). Besides, M1 macrophages are associated with better prognosis, while M2 macrophages predict poor outcome in KIRP. Immunoregulatory molecules CTLA-4 and LAG-3 associate with a poor prognosis in KIRC, while IDO1 and PD-L2 correlate with a poor prognosis in KIRP (12). These findings demonstrate that tumor infiltration of immune cells may be a useful drug target that improving clinical outcomes.
Tumor microenvironment comprises infiltrating immune cells, stromal cells, extracellular matrix, and tumor cells. Several studies have reported that tumor-infiltrating lymphocytes have different vital roles in tumor development. For example, tumor-associated macrophages (TAM) promotes cancer metastasis (13). CTHRC1 is a 30 kDa secreted protein, which is highly expressed in cartilage, developing bones, and myofibroblasts during skin wound healing and solid tumors (14, 15). Previous studies indicate that CTHRC1 promotes tumor cell progression via influencing specific pathways in various cancer types. CTHRC1 is elevated in cervical carcinoma and promotes metastasis through the Wnt/PCP pathway. In contrast, CTHRC1 modulates aggressiveness via GSK-3β/β-catenin pathway in human non-small cell lung cancer (16). Therefore, CTHRC1 is suggested to play an essential role in cancer progression. Current studies have found CTHRC1 function in modulating the tumor microenvironment via the E6/E7-p53-POU2F1 axis or focal adhesion kinase signal pathway (17, 18). In endometrial cancer, CTHRC1 promotes M2-like macrophage recruitment and myometrial invasion via the integrin-Akt signaling pathway (19). Thus, CTHRC1 has multifaceted functions in the tumor microenvironment. However, the underlying mechanisms of CTHRC1 in KIRP and KIRC progression and tumor-infiltrating lymphocytes remains unclear.
In this study, we used Oncomine, TIMER, UALCAN datasets, and Kaplan–Meier plotter web to analyze CTHRC1 expression and its association with the prognosis. Furthermore, we used the TIMER web resource and TISIDB database to analyze the correlation between CTHRC1 and tumor-infiltrated immune cells in the tumor microenvironment. Besides, we further explored the molecular mechanisms of CTHRC1 dysregulation, such as analysis of the CNV, DNA methylation, and somatic cell mutations. Our findings underline the vital role of CTHRC1 in KIRP and KIRC prognosis. Also, we provide an underlying mechanism of CTHRC1 expression in potentially regulating the infiltration of immune cells, partly affecting the prognosis of KIRP and KIRC.
Materials and Methods
Oncomine Database Analysis
Oncomine database (https://www.oncomine.org/resource/main.html) integrates literature and databases of tumor microarray results and is mainly used for gene expression analysis, co-expression analysis, enrichment analysis, interaction networks (20). We used the Oncomine database to analyze CTHRC1 expression in various cancer types.
TIMER Database Analysis
TIMER web server (https://cistrome.shinyapps.io/timer/) is a website for comprehensive analysis of gene expression and tumor-infiltrating immune cells of diverse cancer types. This web assesses the abundances of six tumor-infiltrating cells (B cells, CD4+ T cells, CD8+ T cells, neutrophils, macrophages, and dendritic cells), using the TIMER algorithm (21). TIMER website also enables the user to explore gene expression in tumor tissues and normal tissues in multiple cancers. We used the TIMER website to analyze the differential expression of CTHRC1 in tumor and normal tissues in various cancers. We evaluated the correlation of CTHRC1 with 6 tumor immune infiltrating cells and molecular markers of 16 immune cells. We also used this web to explore the relationship between immune infiltrating cells and gene expression that affects clinical prognosis in KIRP and KIRC. The levels of gene expression were expressed as log2 RSEM.
UALCAN Database Analysis
UALCAN database (http://ualcan.path.uab.edu/index.html) is available for online analysis of differential gene expression in cancer and normal tissue from the TCGA RNA sequencing data and clinical data of 31 malignancies (22). Besides, this website provides survival prognosis data based on gene expression differences in 31 cancer types. This study used the UALCAN database to validate the analysis results of the Oncomine database, and furtherly determined the correlation between CTHRC1 gene expression and clinical features. Differences at p<0.05 were considered statistically significant.
Kaplan-Meier Plotter Database Analysis
Kaplan-Meier plotter (http://kmplot.com/analysis/) (23) is an open, intuitive portal tool for prognostic analysis. It contains 54,675 genes survival data from 10,461 cancer samples. Kaplan-Meier plotter database was used to assess the relationship between clinic outcomes and CTHRC1 expression in different cancers. We performed a prognostic analysis based on CTHRC1 expression levels in relevant immune cell subgroups using this web. We calculated hazard ratios (HRs) of 95% confidence intervals (CIs) and the log-rank p-value.
TISIDB
TISIDB database (http://cis.Hku.hk/TISIDB/) is a portal for analyzing tumor and immune cell interactions that integrates multiple heterogeneous data types (24). We analyze the correlation between CTHRC1 expression and tumor-infiltrating lymphocytes via this platform.
UCSC Xena
UCSC Xena database (http://xena.ucsc.edu/) is a genome-related database, which brings approximately 200 public databases together, including TCGA, ICGC, TARGET, GTEx, CCL, etc. (25). The database is available to examine copy number and methylation, somatic mutation, gene expression, protein expression. This web also provides clinical information such as patient treatment and survival.
DiseaseMeth Version 2.0
The Human Disease Methylation Database (http://bioinfo.hrbmu.edu.cn/diseasemeth/) is an interactive database that provides annotation and analysis of abnormal DNA methylation in human diseases, especially cancers, which includes 32701 samples, 88 diseases, 679602 disease-gene associations (26).
Statistical Analysis
The CTHRC1 expression was analyzed via the Oncomine, TIMER, and UALCAN database. Survival curves were generated using the Kaplan-Meier plotter database and R project using “survival” packages. We used Spearman’s correlation analysis to evaluate the correlation of gene expression in the TIMER. p<0.05 were considered statistically significant.
Results
The Collagen Triple Helix Repeat Containing 1 mRNA Expression in Different Cancers
We analyzed the mRNA expression of CTHRC1 using the Oncomine database. The results showed that CTHRC1 was significantly high in various cancer tissues, compared to normal tissues (Figure 1A). Then, the mRNA level in the TIMER database was determined. We found that CTHRC1 mRNA expression was significantly high in most human tumors, especially in KIRP and KIRC, compared with the corresponding normal tissues (Figure 1B). These results showed that CTHRC1 was highly expressed in various cancers. Besides, we used the UALCAN database to validate the findings in Oncomine and TIMER web and reported higher expression of CTHRC1 in KIRP and KIRC tissues than in normal tissues (Figures 1C, G). Notably, CTHRC1 expression was associated with tumor histology, stage, lymph node metastasis in KIRP (Figures 1D–F). Meanwhile, the high CTHRC1 level in KIRC was related to lymph node metastasis high grade and stage (Figures 1H–J).
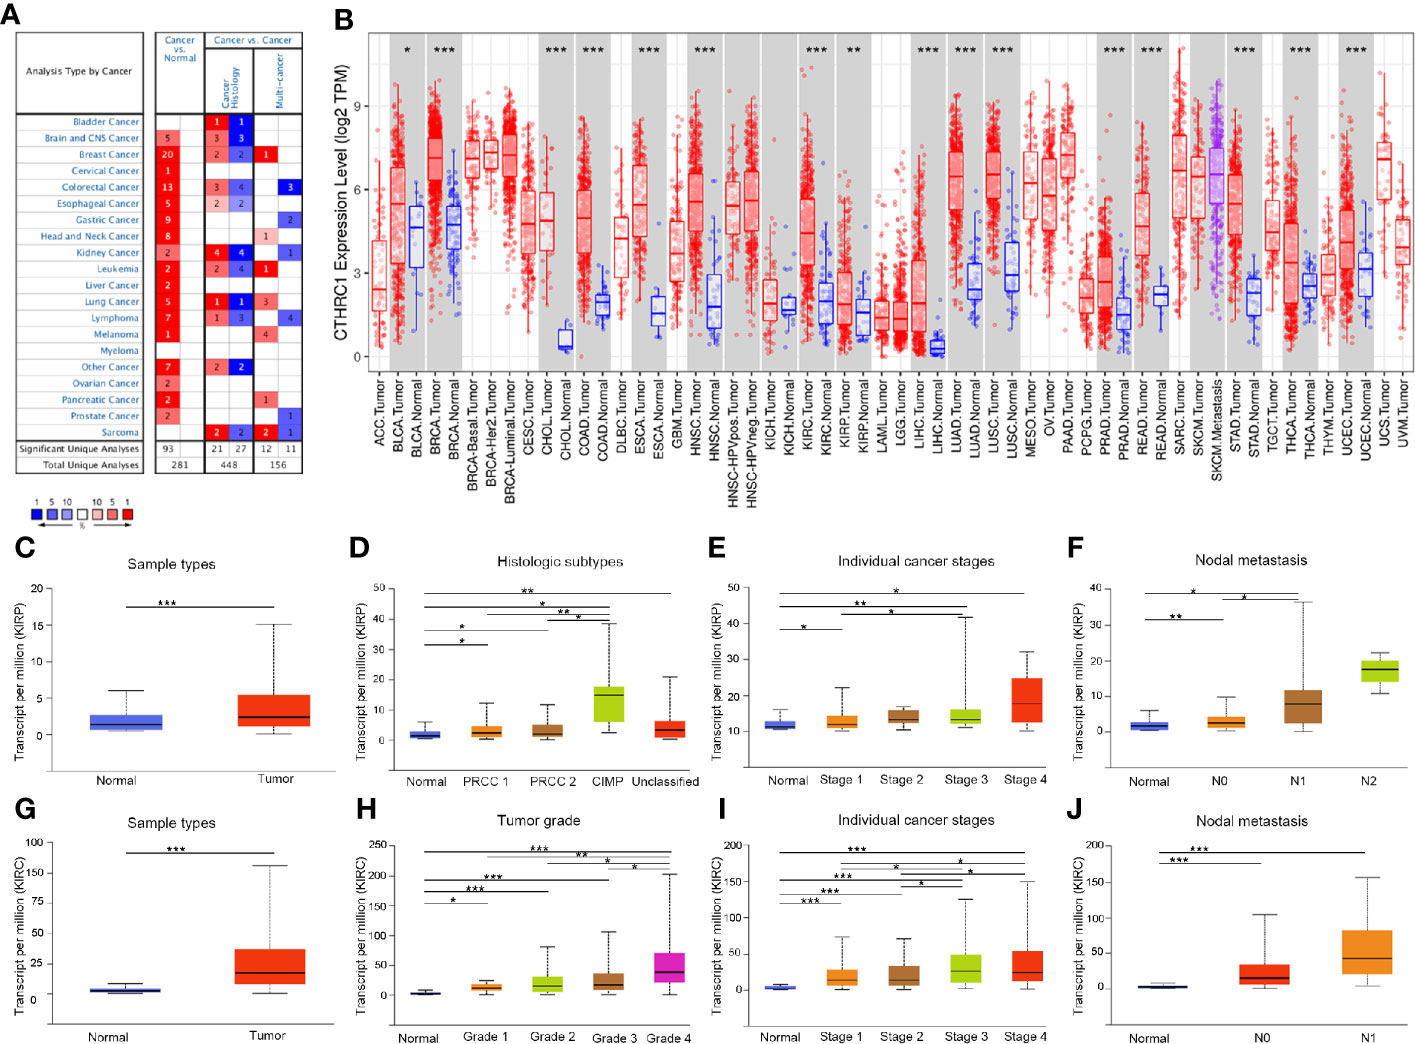
Figure 1 The expression of CTHRC1 in different cancers and its relationship with individual clinical parameters of KIRP and KIRC. (A) CTHRC1 level in different cancers tissues compared to normal tissues in the Oncomine database. (B) CTHRC1 expression of different tumor types in the TIMER database. (C) CTHRC1 expression difference in KIRP samples. (D–F) CTHRC1 mRNA expressions were remarkably correlated with KIRP patients’ individual cancer histologic subtypes (D), stages (E), nodal metastasis (F). (G) Differential expression of CTHRC1 in KIRC tissues. (H–J) CTHRC1 level were significantly associated with KIRC patients’ individual cancer grade (H), stages (I), nodal metastasis (J). N0: Metastases in 1 to 3 axillary lymph nodes, N1: Metastases in 1 to 3 axillary lymph nodes, N2: Metastases in 4 to 9 axillary lymph nodes. *p<0.05, **p<0.01, ***p<0.001.
Prognostic Significance of Collagen Triple Helix Repeat Containing 1 Expression in Human Cancers
We investigated the Kaplan-Meier plotter database for the prognostic significance of CTHRC1 expression in human cancers. High levels of CTHRC1 predicted poor prognostic in KIRP (Figures 2A, B), KIRC (Figures 2C, D), THCA (Figures 2E, F), and LUAD (Figures 2G, H). As Kaplan-Meier plotter analyzes only OS and RFS value, we assessed the multiple clinical prognostic value of CTHRC1 in a variety of cancers by R project using “survival” packages. Forest plot showed CTHRC1 as a risk factor of different prognosis in KIRP and KIRC (Figure 3). Besides, we generated the Kaplan-Meier plot, which showed that high expression of CTHRC1 had a poor prognosis in KIRP (Supplementary Figures S1A–D) and KIRC (Supplementary Figures S1E–H). These findings indicated that CTHRC1 is a hazard for predicting worse prognostic in KIRP and KIRC.
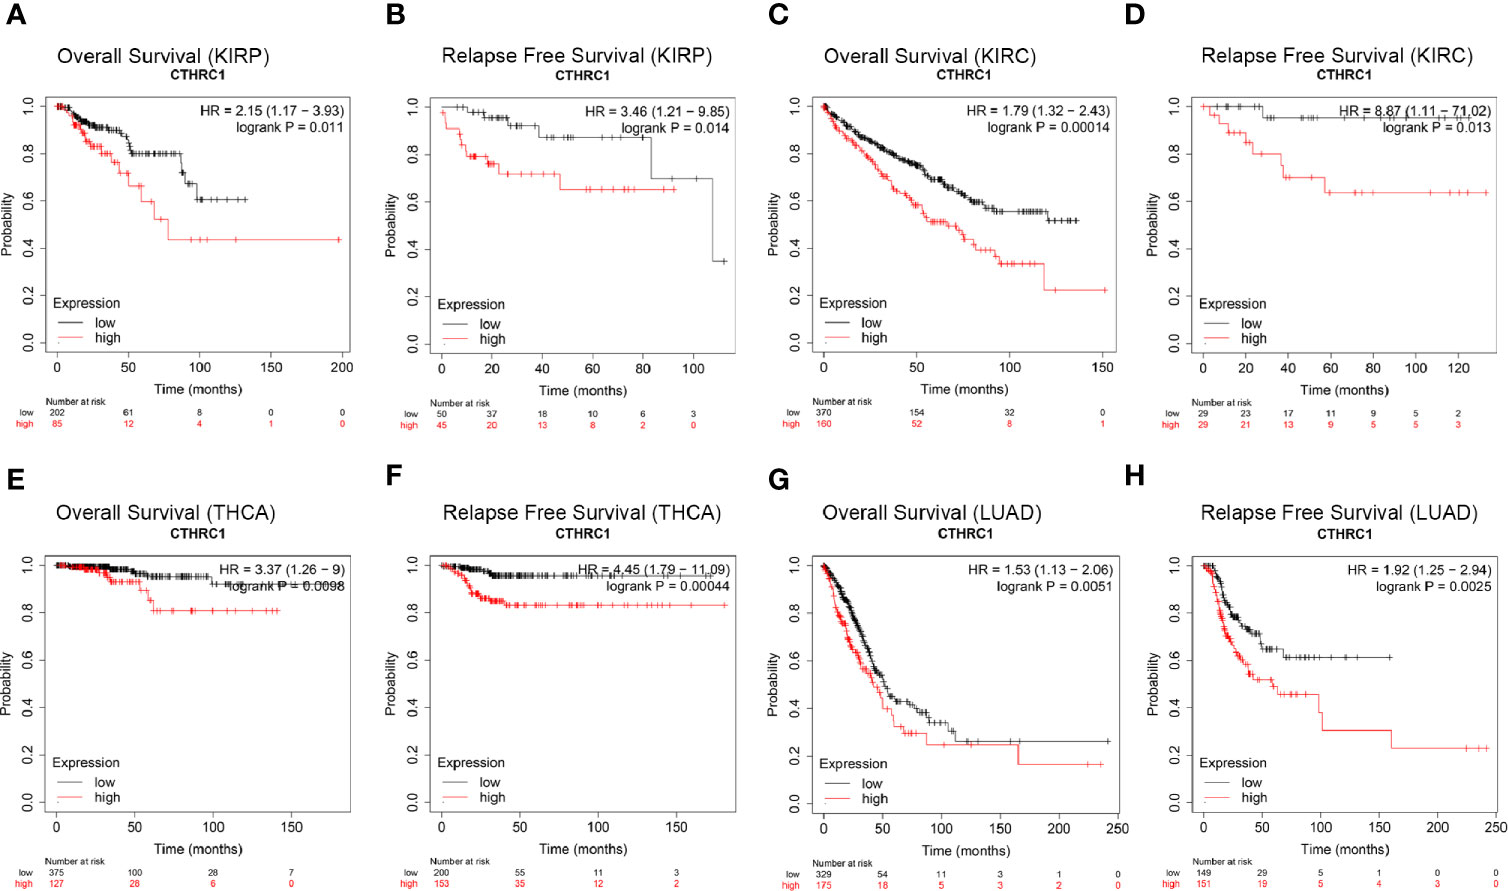
Figure 2 Comparison of Kaplan-Meier survival curves of CTHRC1 high and low expression in different cancers. (A, B) High CTHRC1 expression had poor OS and RFS in KIRP (n=288). (C, D) Upregulated CTHRC1 expression had worse OS and RFS in KIRC (n=530). (E, F) Difference in survival among high and low CTHRC1 levels in THCA (n=502). (G, H) Survival differences of CTHRC1 expression in LUAD (n=513).
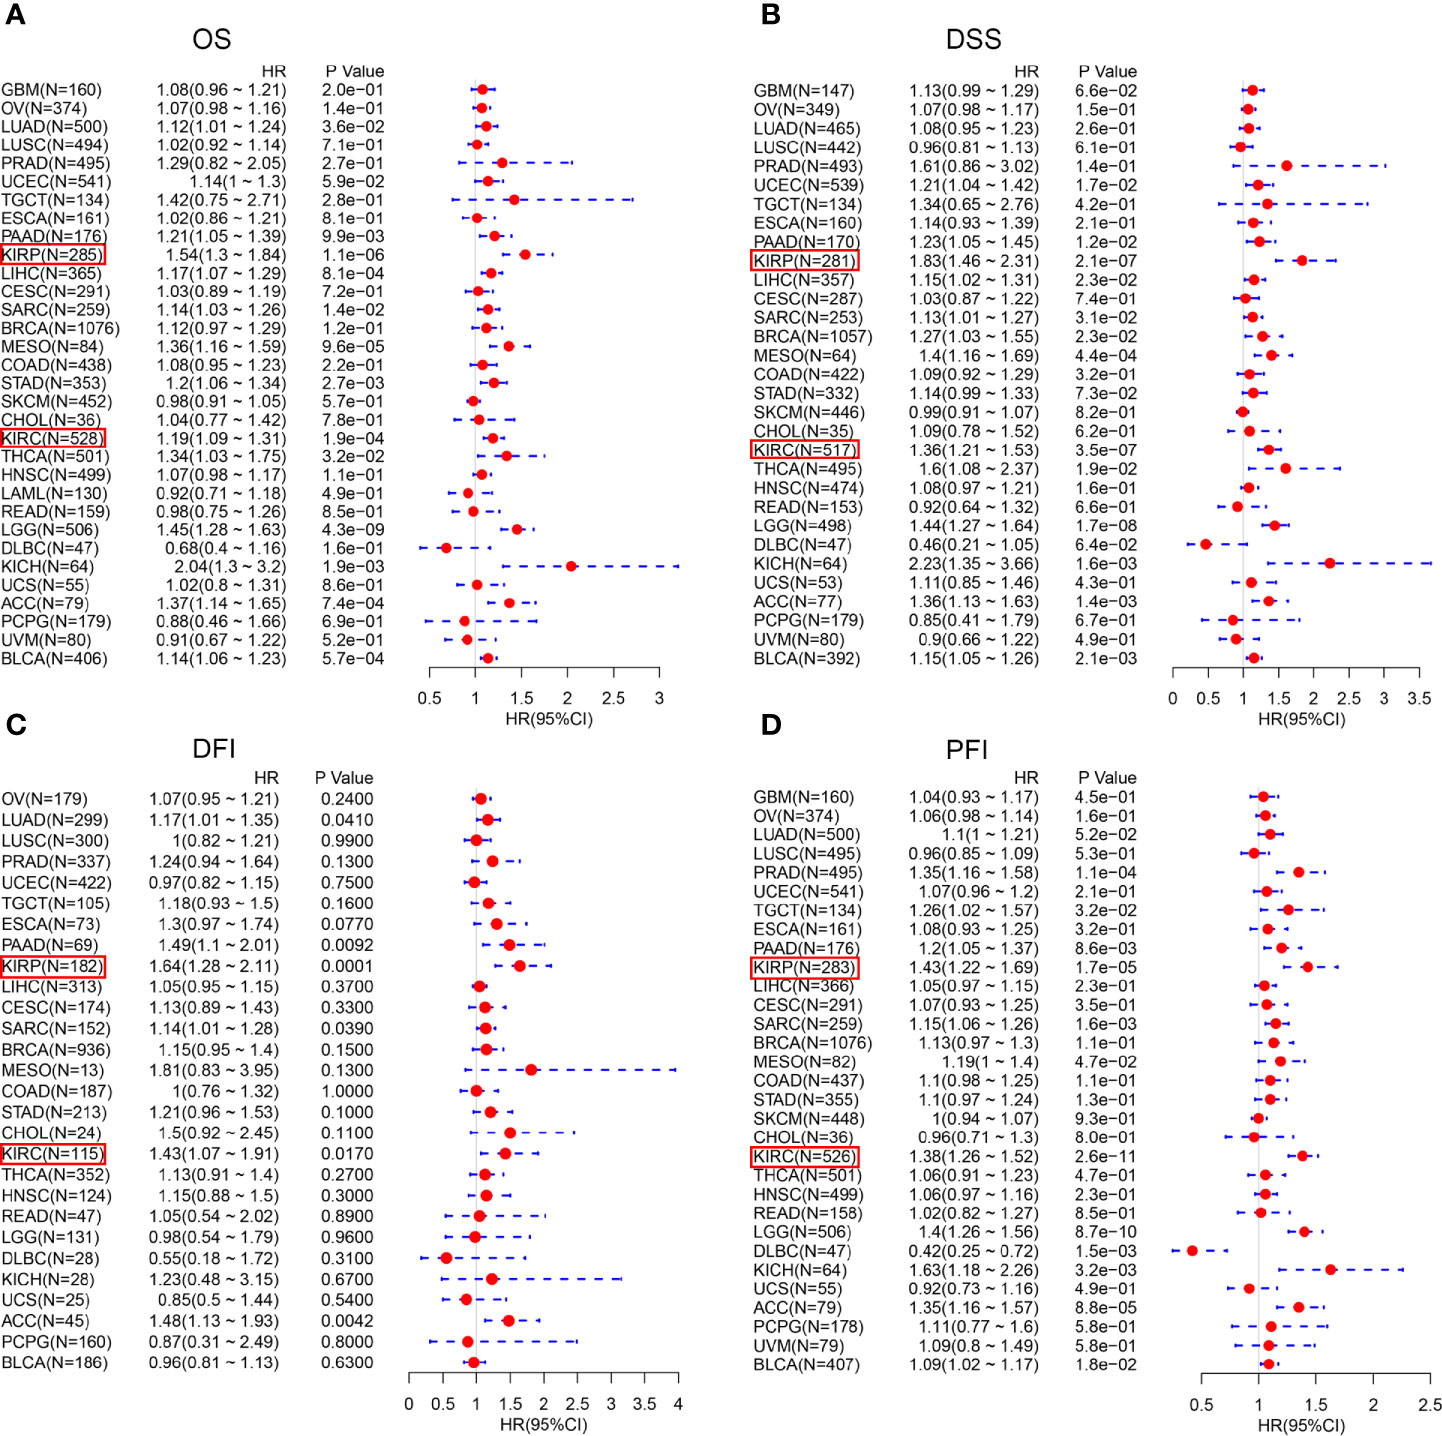
Figure 3 Forest plot of the prognostic values in various cancer subgroups of CTHRC1. (A–D) Prognostic HR of CTHRC1 in different cancers for OS (A), DSS (B), DFI (C), PFI (D).
Correlation of Collagen Triple Helix Repeat Containing 1 Expression With Clinical Characteristics of Kidney Renal Papillary Cell Carcinoma and Kidney Renal Clear Cell Carcinoma Patients
Then, we investigated the association of CTHRC1 expression with different clinical characteristics of KIRP and KIRC using the Kaplan-Meier Plotter database (Table 1). High CTHRC1 level was associated with poorer OS and RFS in females (OS: HR=7.87, p=0.00021; RFS: HR=8.01, p=0.0022) and stage 3 (OS: HR=4.87, p=0.0028; RFS: HR=9.2, p=0.00021) in KIRP. Similarly, upregulated levels of CTHRC1 was correlated with worse prognostic outcomes in males (OS: HR=1.71, p=0.0143; RFS: HR=5.44, p=0.0025), and stage 2 (OS: HR=13.51, p=0.0021), stage 3 (RFS: HR=4.65, p=0.0457), stage 4 (OS: HR=1.72, p=0.0345) in KIRC. These results illustrate that the prognostic value of the CTHRC1 mRNA level, following their clinical characteristics, particularly in the advanced stage of KIRP and KIRC patients.
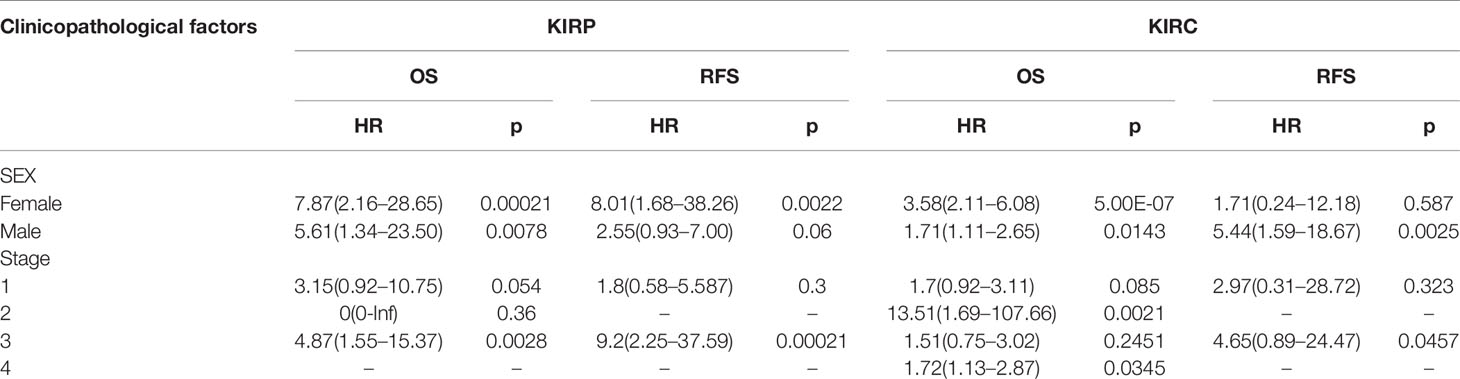
Table 1 Correlation of CTHRC1 mRNA expression and prognosis in KIRP and KIRC with different clinicopathological factors by Kaplan-Meier plotter.
Collagen Triple Helix Repeat Containing 1 Expression is Correlated With Immune Infiltration in Kidney Renal Papillary Cell Carcinoma and Kidney Renal Clear Cell Carcinoma
Tumor-infiltrating lymphocytes can independently be used to predict sentinel lymph node status and prognosis in cancers (27, 28). Therefore, we used TIMER to analyze the correlation of CTHRC1 level with immune infiltration levels in various cancer types. The results showed that CTHRC1 expression is significantly positively correlated with B cells (r=0.311, p=3.66e-07), CD4+ T cells (r=0.347, p=1.03e-08), CD8+ T cells (r=0.324, p=1.03e-07), dendritic cells (r=0.463, p=4.98e-15) and neutrophils (r=0.464, p=3.66e-15) in KIRP (Figure 4A). Besides, the CTHRC1 level showed a positive correlation with infiltrating levels of CD4+ T cells (r=0.195, p=2.63e-05), neutrophils (r=0.214, p=3.89e-06), macrophage (r=0.187, p=6.54e-04), dendritic cell (r=0.152, p=1.12e-03) in KIRC (Figure 4B). However, CTHRC1 was not correlated with B cells (r=−0.053, p=3.80e-01), CD4+ T cells (r=0.021, p=7.27e-01), CD8+ T cells (r=−0.063, p=2.98e-01), dendritic cells (r=0.041, p=4.98e-01), and neutrophils (r=−0.037, p=5.42e-01) in cervical and endocervical cancers (Figure 4C). In addition, we examined prognostic value of CTHRC1 level and tumor infiltrating immune cells in KIRP and KIRC, using Cox proportional hazard model by TIMER. The result states that B cells (p=0.039), CD8+ T cells (p=0.001), dendritic cells (p=0.018), CTHRC1 expression (p<0.001) were significantly correlated with clinical prognosis in KIRP (Table 2). Besides, there is a strong correlation between Macrophage (p=0.020), CTHRC1 expression (p<0.001) and clinical outcome of KIRC (Table 2). Then, we used TISIDB database to furtherly explore the relationship between CTHRC1 level and 28 tumor immune infiltrating cell subtypes. These results showed that CTHRC1 is associated with twenty-seven immune cell subtypes in KIRP (Figure 4D, Table 3). Especially, effector memory CD8+ T cell (r=0.414, p=1.81E-13), activated CD4 T cell (r=0.546, p<2.2e-16), Type 1 T helper cell (r=0.454, p<2.2e-16), Type 2 T helper cell (r=0.562, p<2.2e-16), regulatory T cell (r=0.435, p<2.2e-16), activated B cell (r=0.409, p=4.11e-13), natural killer cell (r=0.493, p<2.2e-16), natural killer T cell (r=0.508, p<2.2e-16), neutrophil (r=0.422, p=3.40E-14) and CTHRC1 are moderately correlated (Figure 4E). In addition, CTHRC1 showed a positive correlation with 24 immune cell (Figure 4D, Table 3). Notably, central memory CD8+ T cell (r=0.444, p<2.2e-16), central memory CD4+ T cell (r=0.446, p<2.2e-16), gamma delta T cell (r=0.43, p<2.2e-16), macrophage (r=0.477, p<2.2e-16) displayed a moderate correlation with CTHRC1 expression (Figure 4F). These results strongly implicate that CTHRC1 could serve as a major tumor immune infiltration regulator in KIRP and KIRC.
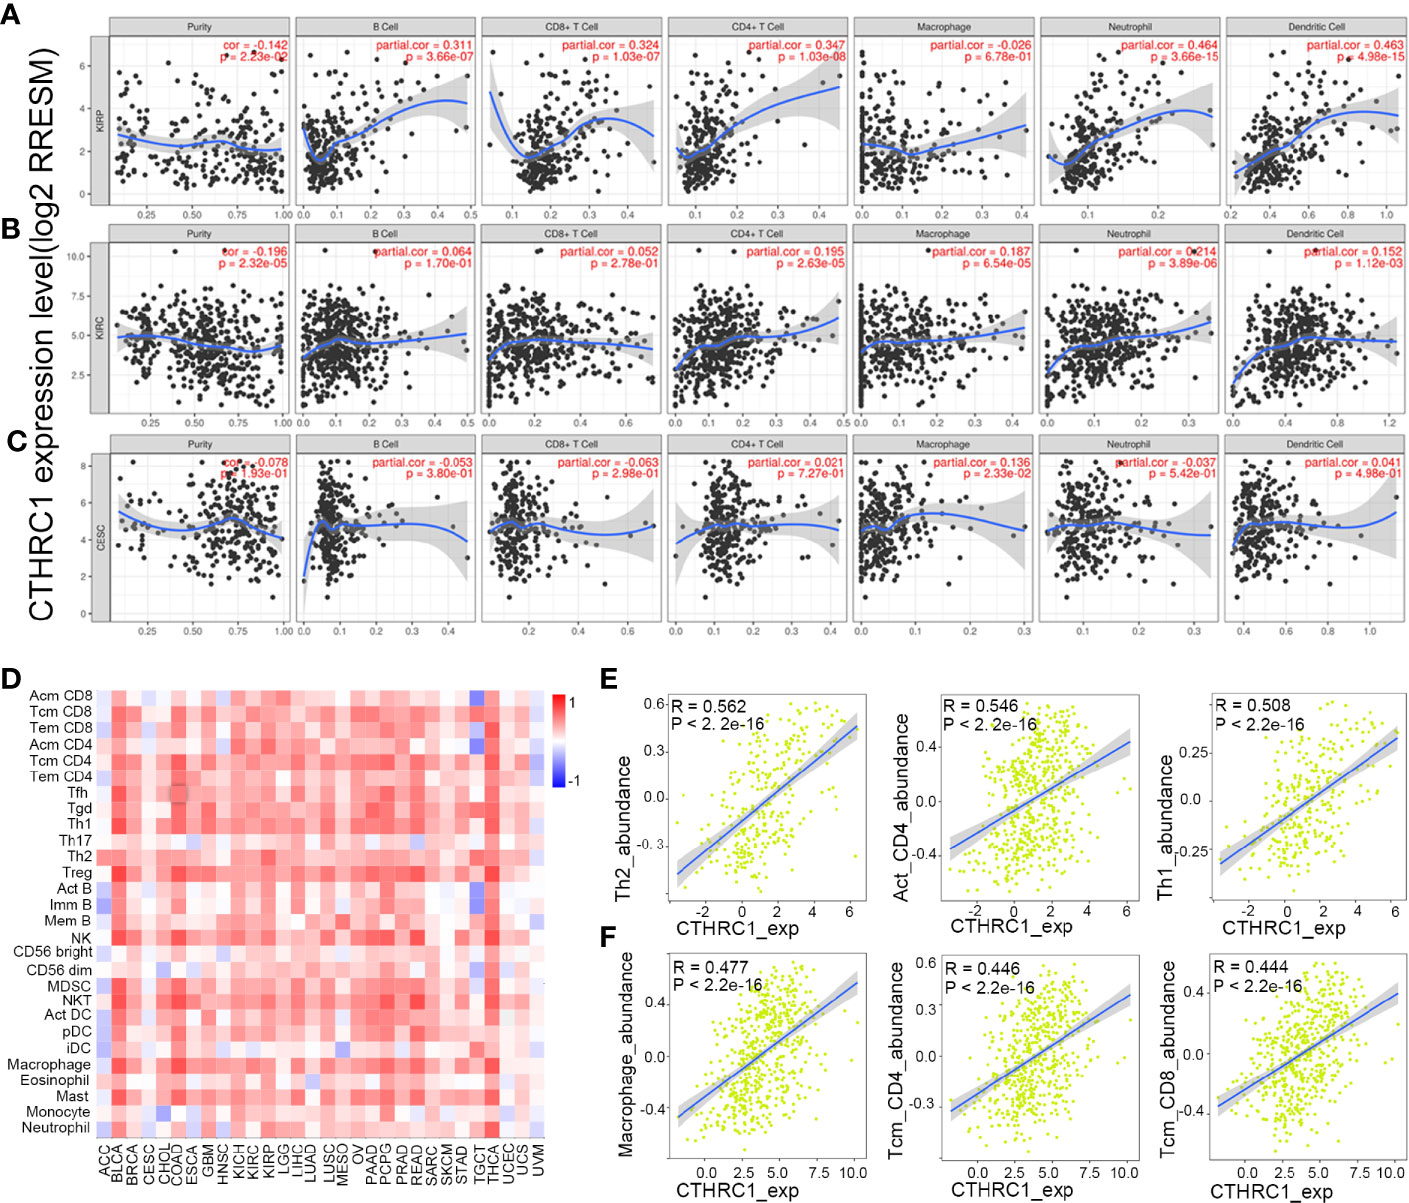
Figure 4 Correlation analysis of CTHRC1 level and immune cells infiltration levels across human cancers using the TIMER database and TISIDB database. (A) CTHRC1 expression in KIRP tissues positive correlates with tumor immune infiltration levels of B cells, CD8+ T cells, CD4+ T cells, neutrophils, and dendritic cells. (B) CTHRC1 level correlates with tumor immune infiltration in KIRC. (C) CTHRC1 level weakly correlated with immune cells infiltration of CESC. (D) Relations between expression of CTHRC1 and 28 types of TILs across human heterogeneous cancers. (E) Top 3 TILs were displaying the greatest Spearman’s correlation with CTHRC1 expression in KIRP. (F) CTHRC1 significantly correlated with abundance of top 3 TILs in KIRC.
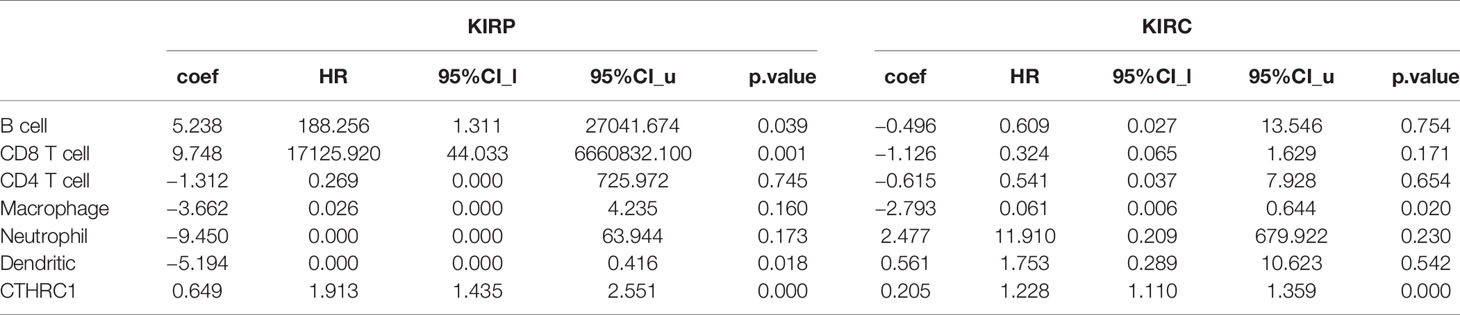
Table 2 The cox proportional hazard model of CTHRC1 and six tumor-infiltrating immune cells in KIRP and KIRC (TIMER).
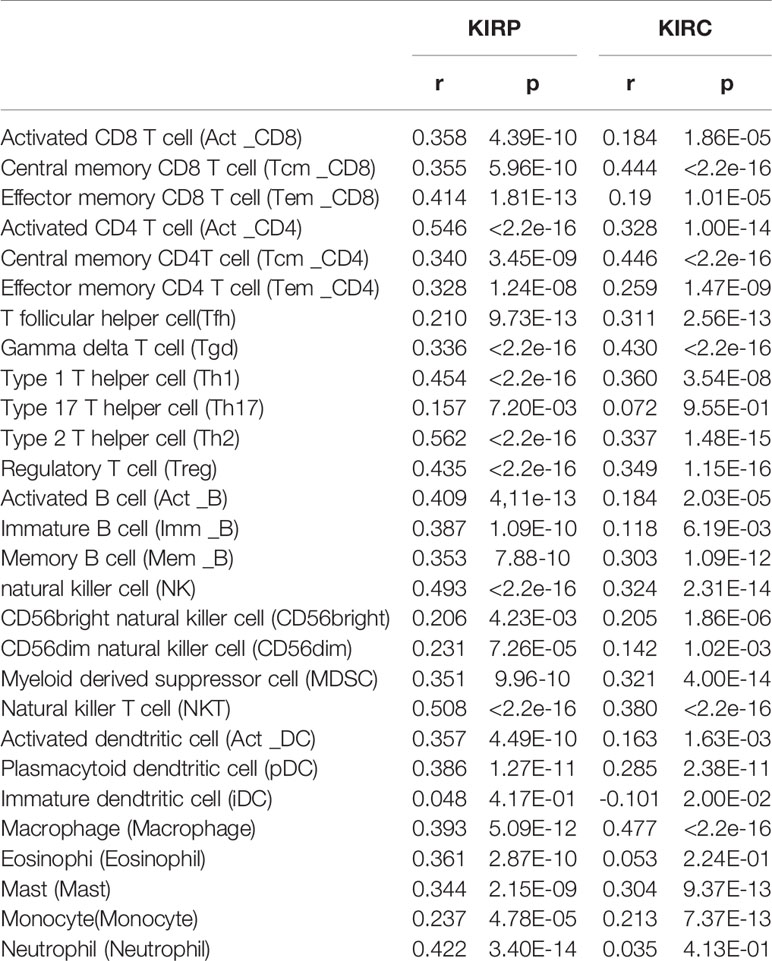
Table 3 The correlation between CTHRC1 expression and tumor lymphocyte infiltration in human cancer (TISIDB).
Collagen Triple Helix Repeat Containing 1 Expressions Were Correlated With Immune Cell Type Markers
We assessed the correlation between CTHRC1 expression and tumor-infiltrating immune cell gene marker levels in KIRP, KIRC, and CESC tissues by exploring the TIMER database. Our results showed that the CTHRC1 level in KIRP tissues was strongly associated with immune markers of B cells, monocytes, and dendritic neutrophils, DCs, CD8+ T cells, T helper, Tregs, and T exhaustion cells. Moreover, CTHRC1 in KIRC positively correlates with the marker genes of B cells, macrophages, and neutrophils. However, there were only ten significant markers associated with CTHRC1 in CESC.
Notably, we found that the CTHRC1 level was significantly correlated with various subtypes of T cells marker levels, including CD8+ T markers, CD8A, CD8B, cell T (general) markers, CD3D, CD3E, CD2, exhausted T cell marker, GZMB, LAG-3, PD-1, Th2 markers, GATA3, Th17 markers, STAT3, Treg markers, FOXP3, CCR8, TGF-β, Tfh marker, BCL6, and neutrophils markers, ITGAM, CCR7, DC markers, CD1C, NRP1, B cells markers, CD79A, CD19 in KIRP (Table 4). A significant correlation of CTHRC1 level with the marker genes expression in different subsets of macrophage. M2 macrophage markers MS4A4A, VSIG4, CD163, monocyte markers, CSF1R, CD86, TAM markers, CD68, B cell markers, CD19, CD79A, was reported (Table 4). Furthermore, the expression of CTHRC1 was not markedly related to marker genes for CD8+ T cells, NK cells, Th2, and Th17 cells in KIRC. These findings reveal that CTHRC1 is involved in the regulation of tumor immune infiltration in KIRP and KIRC.
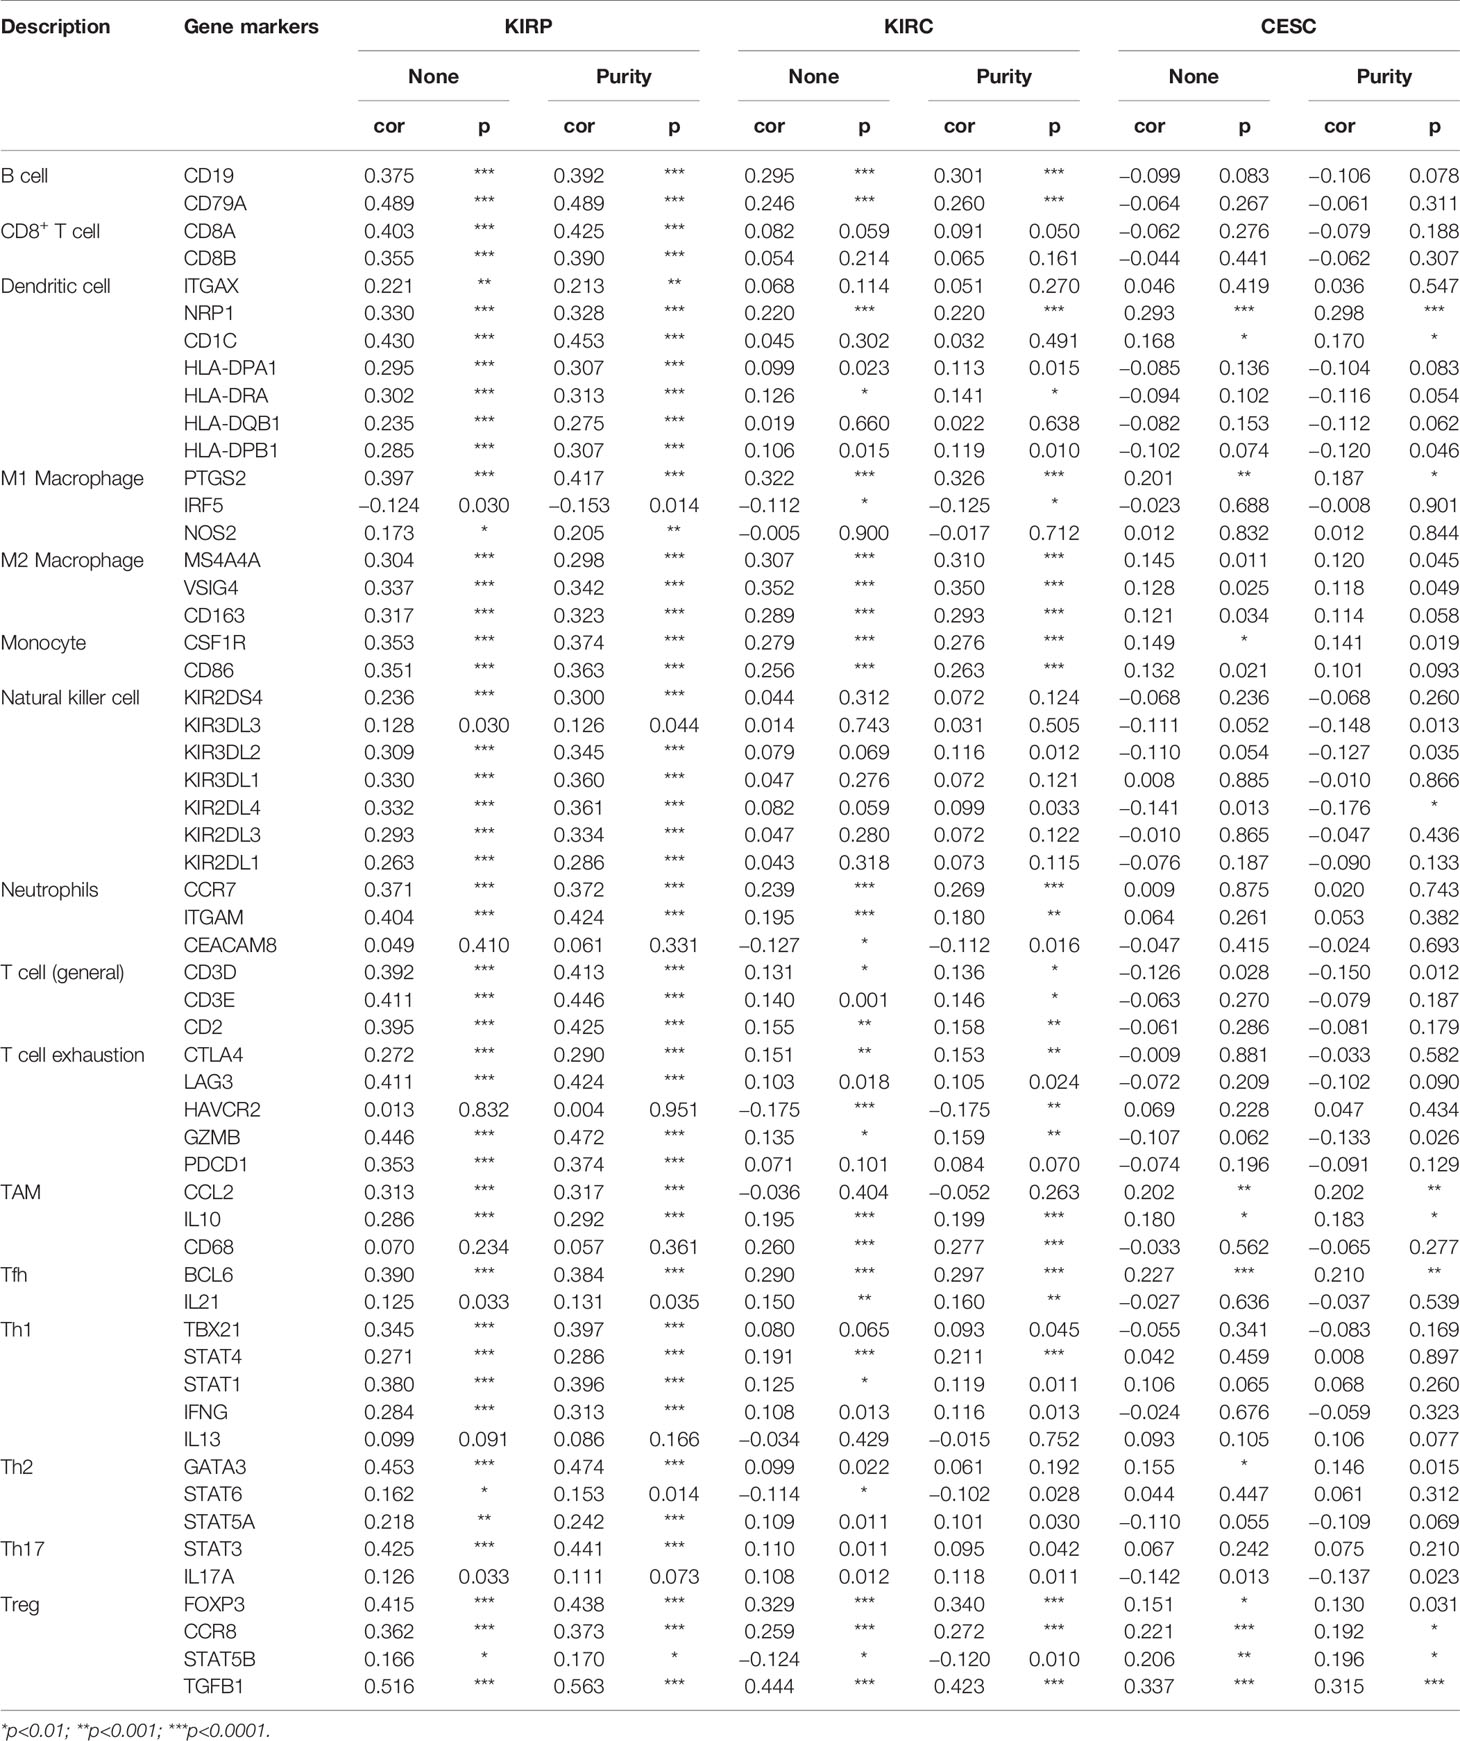
Table 4 Correlation analysis between CTHRC1 and relate genes and markers of immune cells in TIMER.
Prognostic Potential of Collagen Triple Helix Repeat Containing 1 Expressions in Different Tumors Based on Immune Cells
This study showed that the CTHRC1 level was associated with the immune infiltration of KIRP and KIRC. Also, upregulated CTHRC1 has a worse prognosis in KIRP and KIRC patients. Thus, we propose a hypothesis that CTHRC1 may affect the prognosis of KIRP and KIRC patients partly through immune infiltration.
We perform Kaplan-Meier plotter analyses of CTHRC1 expression in KIRP and KIRC following B cells, CD4+ memory T cells, CD8+ T cells, macrophages, NK T cells, Treg T cells, Th1 cells, Th2 cells. We found that high CTHRC1 levels in KIRP in enriched B cells (p=0.00017), B cells (p=4.6e-05), CD4+ memory T cells (p=8.8e-03), CD8+ T cells (p=8e-03), macrophages (p=2.6e-04), natural killer T cells (p=5.8e-03), regulatory T cells (p=1e-03), type 1 T helper cells (p=4.7e-03) cohort had a worse prognosis (Figures 5A–G). Unfortunately, clinical samples of Th2 cells enriched in renal cancer are too few to analyze. Similarly, the high expression of CTHRC1 in KIRC had poor prognosis in enriched B cells (p=5.5e-03), CD4+ memory T cells (p=1.9e-04), CD8+ T cells (p=6.3e-04), macrophages (p=3.9e-05), regulatory T cells (p=4.7e-04), type 2 T-helper cells (p=3.5e-03) (Figures 5H–K, M, O). However, there was no significant difference between high and low CTHRC1 expression groups overall survival in enriched NK cells (p=0.18) and Th1 cells (p=0.05) (Figures 5L, N). The above analysis suggested that immune infiltration may, in part, affect high CTHRC1 expression prognosis of KIRC and KIRP patients.
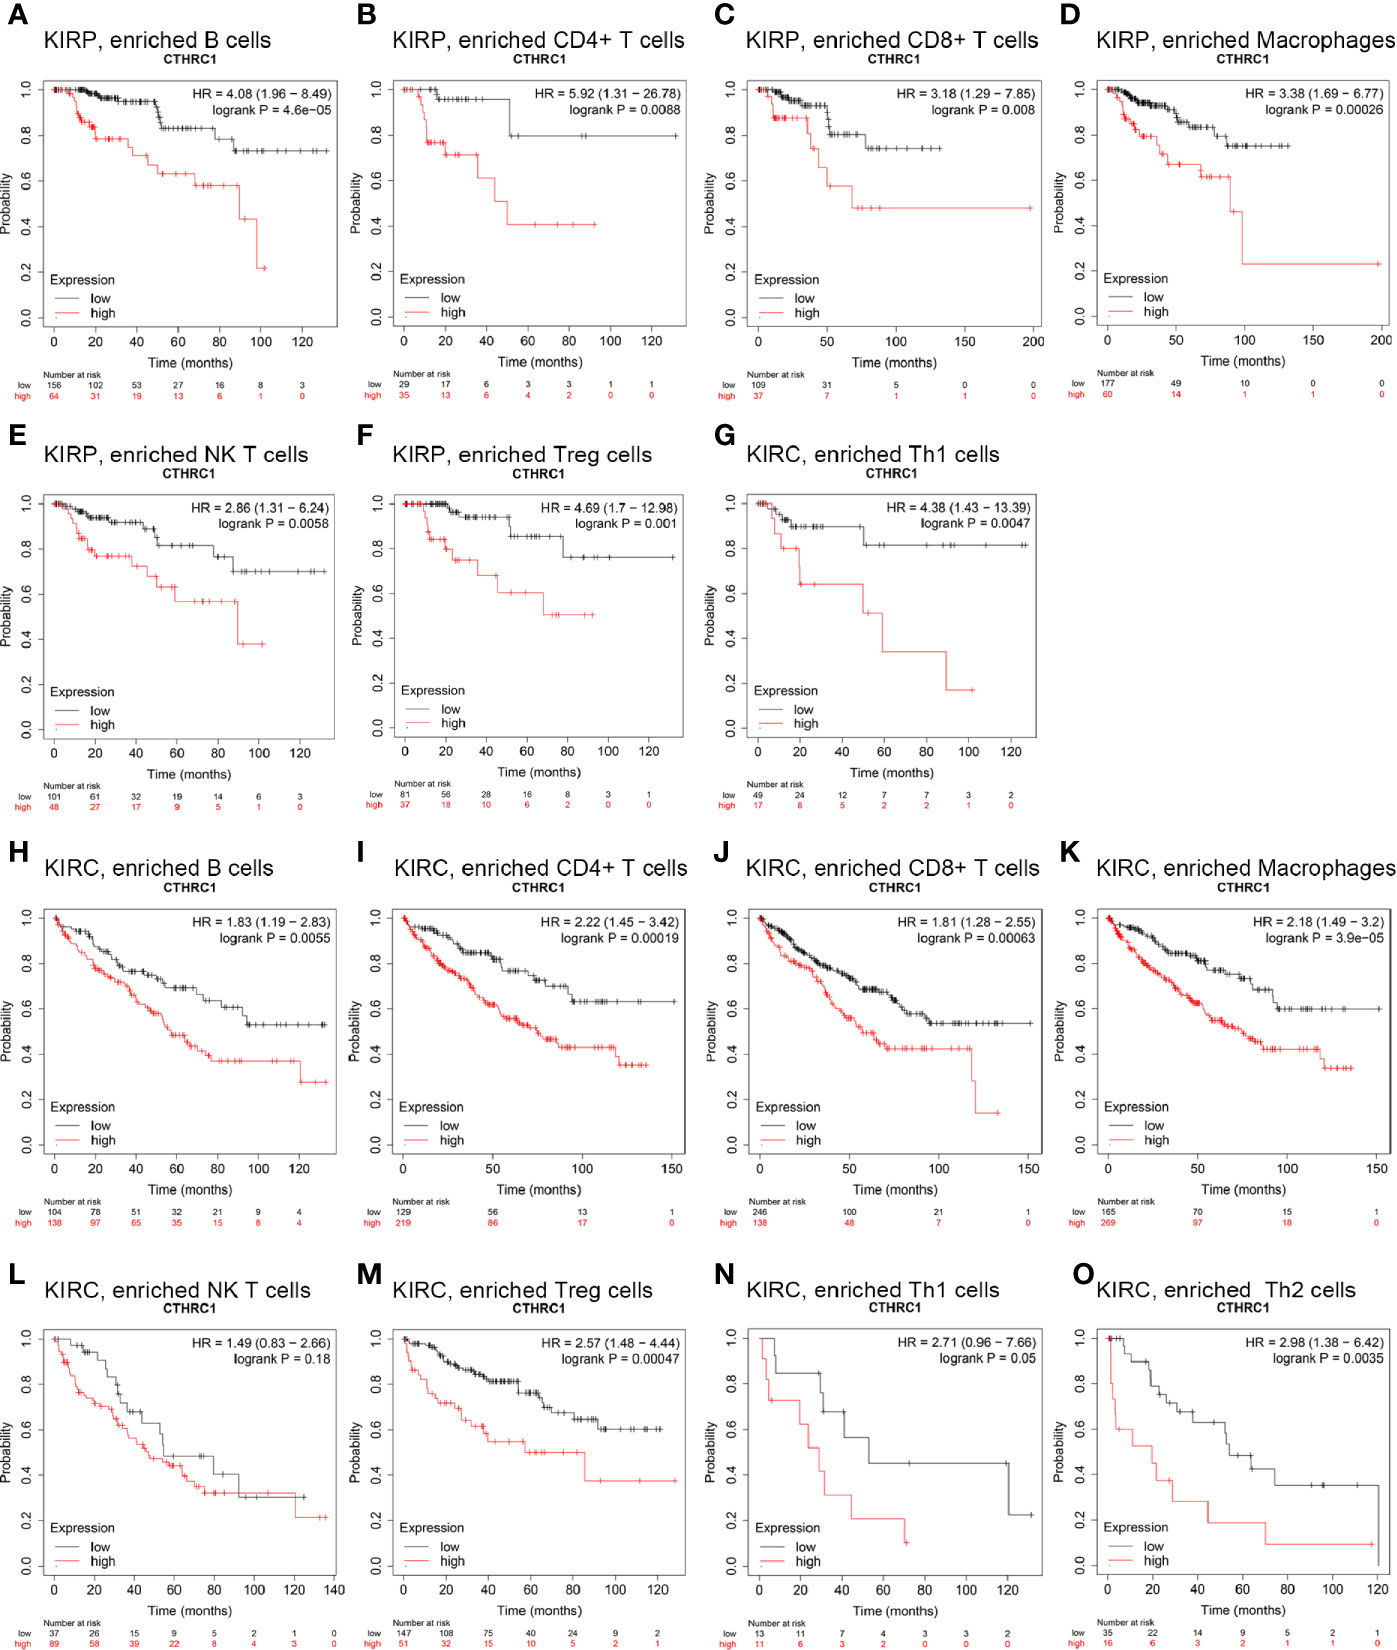
Figure 5 Comparison of Kaplan-Meier survival curves of the high and low expression of CTHRC1 in KIRP and KIRC based on immune cells subgroups. (A–G) High CTHRC1 level enriched in B cells, CD4+ memory T cells, CD8+ T cells, macrophages, NK T cells, Treg T cells, Th1 cells had worse OS in KIRP. (H–O) Relationships between CTHRC1 of enriched in diverse immune and OS in KIRC.
Mutation, Copy Number Variation, and Methylation Analysis of Collagen Triple Helix Repeat Containing 1
CTHRC1 expression was significantly elevated in KIRP and KIRC. We assessed the cause of elevated CTHRC1 levels. DNA methylation, gene mutation, CNV was critically involved in genetic and epigenetic regulation and were highly associated with the process of cancers. We verified the DNA methylation, gene mutation, CNV levels of the CTHRC1 in KIRP and KIRC via the UCSC Xena database. The heatmap indicates that the expression of CTHRC1 mRNA was correlated with CNV and DNA methylation, but not with a somatic mutation in KIRP (Figure 6A) and KIRC (Figure 6B). The human disease methylation database was used to further validate the lower methylation level in KIRP (Supplementary Figures S2A, B) and KIRC (Supplementary Figures S2C, D), compared to normal tissues. Therefore, we suggested that CNV and DNA methylation might contribute to the elevated level of CTHRC1 in KIRP and KIRC, respectively.
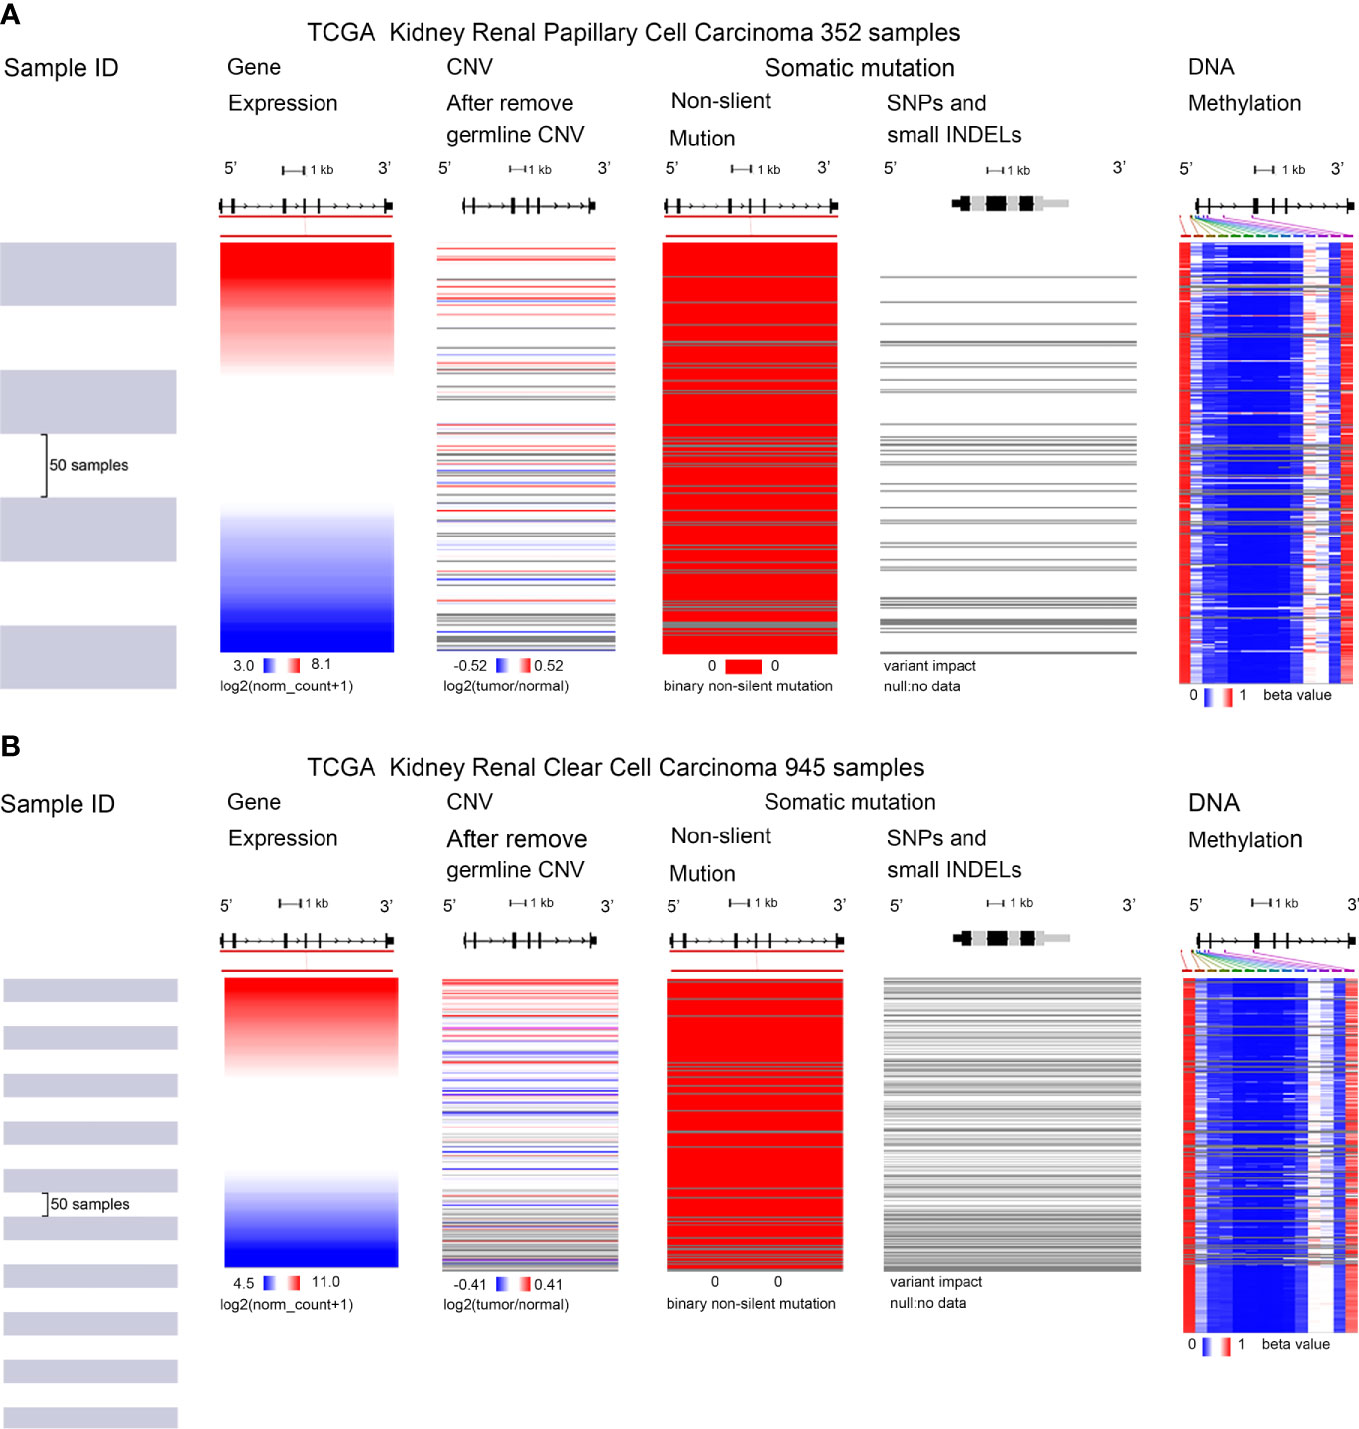
Figure 6 Mutation, CNV, and methylation analysis of CTHRC1 in KIRP and KIRC. (A, B) Heatmap showing the correlations between CTHRC1 mRNA and somatic mutations, CNV, and methylation in KIRP (A) and KIRC (B) via UCSC Xena.
Discussion
CTHRC1 is an extracellular matrix protein that regulates tumor metastasis and the extracellular microenvironment. In this study, we analyzed CTHRC1 expression, prognostic value, genetic variations, and correlation with tumor immune cell infiltration in KIRP and KIRC for the first time.
In this study, we found that CTHRC1 expression was highly elevated in KIRP and KIRC, compared to normal tissues. Moreover, CTHRC1 expression has associations with tumor histology, stage, lymph node metastasis in KIRP (Figures 1D–F). Meanwhile, the high CTHRC1 level was related to lymph node metastasis, high grade, and stage (Figures 1H–J). These results suggest that CTHRC1 plays an important role in the progression and metastasis of KIRP and KIRC. Our findings are consistent with previous researches. CTHRC1 was elevated in some tumor tissues and associated with clinicopathological features, including late T stage, lymph nodal metastasis, and TNM staging (17, 29).
Results from survival analysis showed that high CTHRC1 expression was associated with poor OS, DSS, DFI, and PFI (Figure S1) in KIRP and KIRC, consistent with previous findings CTHRC1 affects tumor growth and invasion and leads to a poor prognosis (30, 31). Ni et al. (32) reported that CTHRC1 promotes metastasis through an epithelial-mesenchymal transformation in colorectal cancer, resulting in a poor prognosis. Our results strongly indicate that CTHRC1 can be used as a prognostic biomarker for KIRP and KIRC.
CTHRC1 was previously reported to regulate tumor microenvironment. Through correlation analysis, we reported that CTHRC1 expression is associated with several immune infiltrating cells in KIRP and KIRC (Figure 4, Table 3). These results suggest that CTHRC1 is involved in the regulation of tumor immune cells. Lee et al (33). study revealed that CTHRC1 recruits Tie2-expressing monocytes into tumor tissues by activating ERK-dependent AP-1 to promote angiogenesis. Besides, the use of CTHRC1 antibodies reduced tumor burden and TEMs infiltration in tumor tissue in xenograft mouse models. Another study demonstrated that CTHRC1 expression has a role in tumor-associated macrophages infiltration by upregulating fractalkine chemokine receptor (CX3CR1) expression (19). Our analysis had the effect of mutual authentication with the results of this researches.
We further analyzed the immunotype markers in KIRP and KIRC. After cell purity correction, CTHRC1 was positively correlated with many immune cell makers in KIRP and KIRC (Table 4). The results further imply that CTHRC1 is associated with immune infiltration in KIRP and KIRC. Besides, our results suggest that CTHRC1 can potentially modulate Tregs and results in T cell exhaustion. Notably, increased CTHRC1 level was positively associates with Treg and T cells exhaustion markers, such as FOXP3. FOXP3 is a valid target for identifying Treg in the tumor microenvironment and contributes significantly to Treg cells differentiation and mediated tumor immune escape (34). There was a significant correlation between CTHRC1 level and several T helper cells (Th1, Th2, Tfh, and Th17) markers in KIRP. These connections may indicate the underlying mechanisms for CTHRC1 regulation of T cell function in KIRP. Therefore, it was potentially related to the poor prognosis of KIRP and KIRC by recruiting and regulating immune cells.
Through the Kaplan Meier-Plotter database analysis, high expression levels of CTHRC1 enriched in a variety of immune cells cohort of KIRP and KIRC had a worse prognosis (Figure 5). Tregs can suppress anti-tumor responses, leading to tumor immune escape (35). DC can promote tumor metastasis by increasing Treg cells and decreasing the cytotoxicity of CD8+ T cells (36). Myeloid origin suppressor cells (MDSC) contact with T cells, which rapidly depletes arginine from the microenvironment and leads to tumor-mediated immune escape (37). Previous studies also have proven that the proportion of macrophages, CD8+ T cells, Tregs, and MDSC in RCC patients correlates with poor prognosis (9–11, 38, 39). These results may explain that high expression of CTHRC1 partly affects the prognosis of KIRP and KIRC patients through immune infiltration.
Genetic and epigenetic phenomena play an essential role in regulating gene expression (40). In this study, we found that CTHRC1 expression was strongly correlated with DNA methylation and CNV and not with somatic mutations. DNA methylation is the most common epigenetic phenotype that usually acts as a transcriptional repressor and plays an essential role in tumor progression (41, 42). Besides, CTHRC1 is reported to be upregulated by promoter demethylation in gastric cancer and down-regulated by hypermethylation in hepatocellular carcinoma (43). DNA copy number variation, including gene amplification, gain, loss, and deletion. And CNV influences the gene expression in carcinogenesis (44). Wang et al. (45) presented the evidence that 5-aza-2’-deoxycytidine (the demethylating agent) can restore CTHRC1 expression, and TGF-β1 led to an increase in levels of CTHRC1 mRNA and protein. Therefore, DNA hypomethylation and CNV may be a cause for CTHRC1 upregulated in KIRP and KIRC.
In conclusion, the upregulated CTHRC1 is strongly associated with clinicopathological features, poor prognosis, and immune cell infiltration. DNA methylation and copy number variation may attribute to CTHRC1 upregulated. Furthermore, our study provides a new mechanism that CTHRC1 may affect the prognosis of KIRP and KIRC through tumor immune infiltration. Therefore, this study offers insights for further studies on tumor immunotherapy of KIRP and KIRC. The current study is the preliminary part of a larger study, including validation in a study population prospectively enrolled. Undoubtedly, we will make further validation when there are available independent datasets and perform experiments in the future.
Data Availability Statement
The datasets presented in this study can be found in online repositories. The names of the repository/repositories and accession number(s) can be found in the article.
Author Contributions
FZ, DS, YX, LJ, and XZ conceived and designed the study. FZ, DS, YX, and LJ performed the analysis procedures. FZ, DS, SC, GW, and YX analyzed the results. YX, SC, KQ, and LJ contributed the analysis tools. FZ, DS, LJ, and XZ contributed to the writing of the manuscript. All authors reviewed the manuscript. All authors contributed to the article and approved the submitted version.
Funding
This work was supported by the National Natural Science Foundation of China (81770757, 31900902, and 81902603).
Conflict of Interest
The authors declare that the research was conducted in the absence of any commercial or financial relationships that could be construed as a potential conflict of interest.
Acknowledgments
We acknowledge the Oncomine, TIMER, UALCAN, Kaplan–Meier Plotter, TISIDB, UCSC Xena, and DiseaseMeth version 2.0 databases for free use.
Supplementary Material
The Supplementary Material for this article can be found online at: https://www.frontiersin.org/articles/10.3389/fonc.2020.570819/full#supplementary-material
Abbreviations
RCC, Renal Cell Carcinoma; KIRC, Kidney Renal Clear Cell Carcinoma; KIRP, Kidney Renal Papillary Cell Carcinoma; LUAD, Lung Adenocarcinoma; THCA, Thyroid Carcinoma; CESC, Cervical and Endocervical Cancer; CTLA-4, Cytotoxic T - Lymphocyte Antigen 4; LAG-3, Lymphocyte-activation-gene-3; IDO1, Indoximod -1; PD-L2, Programmed death-2; NK cells, Natural Killer cells; NK T cells, Natural Killer T cells; Th 1 cells, Type I helper T cells; Th 2 cells, Type II helper T cells; Treg, Regulatory T cells; Th17 cells, Type 17 T helper cells; Tfh, T follicular helper cell; TAMs, Tumor-Associated Macrophages; TEMs, Tie2-expressing monocytes; TILs, Tumor infiltrating lymphocytes; OS, Overall Survival; RFS, Relapse-Free Survival; DSS, Disease-Specific Survival; DFI, Disease-Free Interval; PFI, Progression-Free Interval; CNV, Copy number variations.
References
1. Ljungberg B, Bensalah K, Canfield S, Dabestani S, Hofmann F, Hora M, et al. EAU Guidelines on Renal Cell Carcinoma: 2014 Update. Eur Urol (2015) 67(5):913–24. doi: 10.1016/j.eururo.2015.01.005
2. Hsieh J, Purdue M, Signoretti S, Swanton C, Albiges L, Schmidinger M, et al. Renal cell carcinoma. Nat Rev Dis Primers (2017) 3:17009. doi: 10.1038/nrdp.2017.9
3. Srigley J, Delahunt B, Eble J, Egevad L, Epstein J, Grignon D, et al. The International Society of Urological Pathology (ISUP) Vancouver Classification of Renal Neoplasia. Am J Surg Pathol (2013) 37(10):1469–89. doi: 10.1097/PAS.0b013e318299f2d1
4. Shuch B, Amin A, Armstrong A, Eble J, Ficarra V, Lopez-Beltran A, et al. Understanding Pathologic Variants of Renal Cell Carcinoma: Distilling Therapeutic Opportunities from Biologic Complexity. Eur Urol (2014) 67(1):85–97. doi: 10.1016/j.eururo.2014.04.029
5. Garcia J, Rini B. Recent Progress in the Management of Advanced Renal Cell Carcinoma. CA: Cancer J Clin (2007) 57(2):112–25. doi: 10.3322/canjclin.57.2.112
6. Barata P, Rini B. Treatment of renal cell carcinoma: Current status and future directions. CA: A Cancer J Clin (2017) 67(6):507–24. doi: 10.3322/caac.21411
7. Matsushita H, Vesely M, Koboldt D, Rickert C, Uppaluri R, Magrini V, et al. Cancer Exome Analysis Reveals a T Cell Dependent Mechanism of Cancer Immunoediting. Nature (2012) 482:400–4. doi: 10.1038/nature10755
8. Hanahan D, Weinberg R. Hallmarks of Cancer: The Next Generation. Cell (2011) 144:646–74. doi: 10.1016/j.cell.2011.02.013
9. Cros J, Sbidian E, Posseme K, Letierce A, Guettier C, Benoît G, et al. Nestin expression on tumour vessels and tumour-infiltrating macrophages define a poor prognosis subgroup of pt1 clear cell renal cell carcinoma. Virchows Archiv (2016) 469(3):331–7. doi: 10.1007/s00428-016-1973-2
10. Desar I, Jacobs J, Hulsbergen-vandeKaa C, Oyen W, Mulders P, Van der Graaf W, et al. Sorafenib reduces the percentage of tumour infiltrating regulatory T cells in renal cell carcinoma patients. International journal of cancer. J Int Du Cancer (2011) 129:507–12. doi: 10.1002/ijc.25674
11. Zhu Q, Cai M-Y, Weng D-S, Zhao J-J, Pan Q-Z, Wang Q-J, et al. PD-L1 expression patterns in tumour cells and their association with CD8 + tumour infiltrating lymphocytes in clear cell renal cell carcinoma. J Cancer (2019) 10:1154–61. doi: 10.7150/jca.29052
12. Zhang S, Zhang E, Long J, Hu Z, Peng J, Liu L, et al. Immune Infiltration in Renal Cell Carcinoma. Cancer Sci (2019) 110(5):1564–72. doi: 10.1111/cas.13996
13. Coussens L, Werb Z. Matrix metalloproteinase and the development of cancer. Chem Biol (1996) 3:895–904. doi: 10.1016/S1074-5521(96)90178-7
14. Liu W, Fu X-L, Yang J-Y, Yang M, Tao L-Y, Liu D-J, et al. Elevated expression of CTHRC1 predicts unfavorable prognosis in patients with pancreatic ductal adenocarcinoma. Am J Cancer Res (2016) 6:1820–7. doi: 10.1002/cam4.1064
15. Tang L, Dai D, Su M, Martinka M, Yang F, Zhou Y. Aberrant expression of collagen triple helix repeat containing 1 in human solid cancers. Clin Cancer Res (2006) 12:3716–22. doi: 10.1158/1078-0432.CCR-06-0030
16. Ke Z, He W, Lai Y, Guo X, Chen S, Li S, et al. Overexpression of Collagen Triple Helix Repeat Containing 1 (CTHRC1) is associated with tumour aggressiveness and poor prognosis in human non-small cell lung cancer. Oncotarget (2014) 5:9410–24. doi: 10.18632/oncotarget.2421
17. Zhang R, Lu H, Lyu Y-Y, Yang X-M, Zhu L-Y, Yang G-D, et al. E6/E7-P53-POU2F1-CTHRC1 axis promotes cervical cancer metastasis and activates Wnt/PCP pathway. Sci Rep (2017) 7:44744. doi: 10.1038/srep44744
18. Guo B, Yan H, Li L, Yin K, Ji F, Zhang S. Collagen triple helix repeat containing 1 (CTHRC1) activates Integrin β3/FAK signaling and promotes metastasis in ovarian cancer. J Ovarian Res (2017) 10:69. doi: 10.1186/s13048-017-0358-8
19. Li L-Y, Yin K-M, Bai Y-H, Zhang Z-G, di W, Zhang S. CTHRC1 promotes M2-like macrophage recruitment and myometrial invasion in endometrial carcinoma by integrin-Akt signaling pathway. Clin Exp Metastasis (2019) 36(4):351–63. doi: 10.1007/s10585-019-09971-4
20. Rhodes D, Kalyana-Sundaram S, Mahavisno V, Varambally R, Yu J, Briggs B, et al. Oncomine 3.0: Genes, Pathways, and Networks in a Collection of 18,000 Cancer Gene Expression Profiles. Neoplasia (N Y NY) (2007) 9:166–80. doi: 10.1593/neo.07112
21. Li T, Fan J, Traugh N, Chen Q, Liu J, Li B, et al. TIMER: A Web Server for Comprehensive Analysis of Tumor-Infiltrating Immune Cells. Cancer Res (2017) 77:e108–10. doi: 10.1158/0008-5472.CAN-17-0307
22. Sc D, Bashel B, Balasubramanya S, Creighton C, Ponce-Rodriguez I, Chakravarthi B, et al. UALCAN: A Portal for Facilitating Tumor Subgroup Gene Expression and Survival Analyses. Neoplasia (2017) 19:649–58. doi: 10.1016/j.neo.2017.05.002
23. Nagy Á., Lánczky A, Menyhart O, Györffy B. Validation of miRNA prognostic power in hepatocellular carcinoma using expression data of independent datasets. Sci Rep (2018) 8(1):9227. doi: 10.1038/s41598-018-27521-y
24. Ru B, Wong C, Tong Y, Zhong J, Zhong S, Wu W, et al. TISIDB: an integrated repository portal for tumor-immune system interactions. Bioinformatics (2019) 35(20):4200–2. doi: 10.1093/bioinformatics/btz210
25. Goldman M, Craft B, Hastie M, Repečka K, McDade F, Kamath A, et al. Visualizing and interpreting cancer genomics data via the Xena platform. Nat Biotechnol (2020) 38(6):675–8. doi: 10.1038/s41587-020-0546-8
26. Xiong Y-C, Wei Y, Gu Y, Zhang S, Zhang B, Chen C, et al. DiseaseMeth version 2.0: a major expansion and update of the human disease methylation database. Nucleic Acids Res (2016) 45(D1):D888–95. doi: 10.1093/nar/gkw1123
27. Ohtani H. Focus on TILs: Prognostic significance of tumor infiltrating lymphocytes in human colorectal cancer. Cancer Immun (2007) 7:4.
28. Azimi F, Scolyer R, Rumcheva P, Moncrieff M, Murali R, McCarthy S, et al. Tumor-Infiltrating Lymphocyte Grade Is an Independent Predictor of Sentinel Lymph Node Status and Survival in Patients With Cutaneous Melanoma. J Clin Oncol (2012) 30:2678–83. doi: 10.1200/JCO.2011.37.8539
29. Chen Y-L, Wang T-H, Hsu H-C, Yuan R-H, Jeng Y-M. Overexpression of CTHRC1 in Hepatocellular Carcinoma Promotes Tumor Invasion and Predicts Poor Prognosis. PLoS One (2013) 8:e70324. doi: 10.1371/journal.pone.0070324
30. He W, Zhang H, Wang Y, Zhou Y, Luo Y, Cui Y, et al. CTHRC1 induces non-small cell lung cancer (NSCLC) invasion through upregulating MMP-7/MMP-9. BMC Cancer (2018) 18:400. doi: 10.1186/s12885-018-4317-6
31. Ye J, Chen W, Wu Z-Y, Zhang J-H, Fei H, Zhang L-W, et al. Upregulated CTHRC1 promotes human epithelial ovarian cancer invasion through activating EGFR signaling. Oncol Rep (2016) 36(6):3588–96. doi: 10.3892/or.2016.5198
32. Ni S, Ren F, Xu M-D, Tan C, Weiwei W, Huang Z, et al. CTHRC1 overexpression predicts poor survival and enhances epithelial-mesenchymal transition in colorectal cancer. Cancer Med (2018) 7(11):5643–54. doi: 10.1002/cam4.1807
33. Lee J, Song J, Kwon E-S, Jo S, Kang M, Kim Y, et al. CTHRC1 promotes angiogenesis by recruiting Tie2-expressing monocytes to pancreatic tumors. Exp Mol Med (2016) 48:e261. doi: 10.1038/emm.2016.87
34. Wang C, Li Z, Shao F, Yang X, Feng X, Shi S, et al. High expression of Collagen Triple Helix Repeat Containing 1 (CTHRC1) facilitates progression of oesophageal squamous cell carcinoma through MAPK/MEK/ERK/FRA-1 activation. J Exp Clin Cancer Res CR (2017) 36(1):84. doi: 10.1186/s13046-017-0555-8
35. Sakaguchi S, Miyara M, Costantino C, Hafler D. FOXP3+ regulatory T cells in the human immune system. Nat Rev Immunol (2010) 10:490–500. doi: 10.1038/nri2785
36. Sawant A, Hensel J, Chanda D, Harris B, Siegal G, Maheshwari A, et al. Depletion of Plasmacytoid Dendritic Cells Inhibits Tumor Growth and Prevents Bone Metastasis of Breast Cancer Cells. J Immunol (Baltimore Md 1950) (2012) 189:4258–65. doi: 10.4049/jimmunol.1101855
37. Ochoa A, Zea A, Hernandez C, Rodriguez P. Arginase, Prostaglandins, and Myeloid-Derived Suppressor Cells in Renal Cell Carcinoma. Clin Cancer Res (2007) 13:721s–6s. doi: 10.1158/1078-0432.CCR-06-2197
38. Shang B, Liu Y, Jiang SJ. Prognostic value of tumor-infiltrating FoxP3+ regulatory T cells in cancers: A systematic review and meta-analysis. Sci Rep (2015) 5:15179. doi: 10.1038/srep15179
39. Walter S, Weinschenk T, Stenzl A, Pluzanska A, Szczylik C, Staehler M, et al. Multipeptide immune response to cancer vaccine IMA901 after single-dose cyclophosphamide associates with longer patient survival. Nat Med (2012) 18(8):1254–61. doi: 10.1038/nm.2883
40. Grewal S, Moazed D. Heterochromatin and Epigenetic Control of Gene Expression. Science (New York NY) (2003) 301:798–802. doi: 10.1126/science.1086887
41. Feinberg A, Tycko B. The history of cancer epigenetics. Nat Rev Cancer (2004) 4:143–53. doi: 10.1038/nrc1279
42. Ehrlich M. DNA methylation in cancer: too much, but also too little. Oncogene (2002) 21:5400–13. doi: 10.1038/sj.onc.1205651
43. Sun XJ, Wang MC, Zhang FH, Kong X. An integrated analysis of genome-wide DNA methylation and gene expression data in hepatocellular carcinoma. FEBS Open Bio (2018) 8(7):1093–103. doi: 10.1002/2211-5463.12433
44. Hudler P. Genetic Aspects of Gastric Cancer Instability. Sci World J (2012) 2012:761909. doi: 10.1100/2012/761909
Keywords: collagen triple helix repeat containing 1 (CTHRC1), kidney renal clear cell carcinoma, kidney renal papillary cell carcinoma, prognosis, immune infiltration
Citation: Zhou F, Shen D, Xiong Y, Cheng S, Xu H, Wang G, Qian K, Ju L and Zhang X (2021) CTHRC1 Is a Prognostic Biomarker and Correlated With Immune Infiltrates in Kidney Renal Papillary Cell Carcinoma and Kidney Renal Clear Cell Carcinoma. Front. Oncol. 10:570819. doi: 10.3389/fonc.2020.570819
Received: 09 June 2020; Accepted: 22 December 2020;
Published: 08 February 2021.
Edited by:
Marco Borghesi, University of Genoa, ItalyReviewed by:
Daniela Terracciano, University of Naples Federico II, ItalyLothar Bergmann, University Hospital Frankfurt, Germany
Copyright © 2021 Zhou, Shen, Xiong, Cheng, Xu, Wang, Qian, Ju and Zhang. This is an open-access article distributed under the terms of the Creative Commons Attribution License (CC BY). The use, distribution or reproduction in other forums is permitted, provided the original author(s) and the copyright owner(s) are credited and that the original publication in this journal is cited, in accordance with accepted academic practice. No use, distribution or reproduction is permitted which does not comply with these terms.
*Correspondence: Xinhua Zhang, emhhbmd4aW5odWFkQDE2My5jb20=; Lingao Ju, anVsaW5nYW8xOTkwQHdodS5lZHUuY24=
†These authors have contributed equally to this work