 Zijun Xu1†
 Lijuan Xu1†Liping Liu2,3Hai Li1
 Jiewen Jin1Miaoguan Peng1Yanrui Huang1
 Haipeng Xiao1Yanbing Li1*
 Hongyu Guan1*
- 1Department of Endocrinology and Diabetes Center, The First Affiliated Hospital of Sun Yat-sen University, Guangzhou, China
- 2National Clinical Research Center for Respiratory Disease, The First Affiliated Hospital of Guangzhou Medical University, Guangzhou, China
- 3The Translational Medicine Laboratory, The First Affiliated Hospital of Guangzhou Medical University, Guangzhou, China
Prostate cancer (PCa) is one of the most frequently diagnosed cancers in males worldwide. Approximately 25% of all patients experience biochemical recurrence (BCR) after radical prostatectomy (RP) and BCR indicates increased risk for metastasis and castration resistance. PCa patients with highly glycolytic tumors have a worse prognosis. Thus, this study aimed to explore glycolysis-based predictive biomarkers for BCR. Expression data and clinical information of PCa samples were retrieved from three publicly available datasets. One from The Cancer Genome Atlas (TCGA) dataset was used as the training cohort, and two from the Gene Expression Omnibus (GEO) dataset (GSE54460 and GSE70769) were used as validation cohorts. Using the training cohort, univariate Cox regression survival analysis, robust likelihood-based survival model, and stepwise multiply Cox analysis were sequentially applied to explore predictive glycolysis-related candidates. A five-gene risk score was then constructed based on the Cox coefficient as the following: (−0.8367*GYS2) + (0.3448*STMN1) + (0.3595*PPFIA4) + (−0.1940*KDELR3) + (0.4779*ABCB6). Receiver operating characteristic curve (ROC) analysis was used to identify the optimal cut-off point, and patients were divided into low risk and high risk groups. Kaplan–Meier analysis revealed that high risk group had significantly shorter BCR free survival time as compared with that in low risk group in training and validation cohorts. In conclusion, our data support the glycolysis-based five-gene signature as a novel and robust signature for predicting BCR of PCa patients.
Introduction
Prostate cancer (PCa) is one of the most frequently diagnosed solid malignancies in men and has become the fifth leading cause of male cancer death worldwide (1, 2). Due to the widespread use of prostate-specific antigen (PSA) serum test and the improvement of overall longevity, the incidence of this disease is increasing. Although radical prostatectomy (RP) leads to a favorable rate of cancer control, approximately 25% of all patients experience biochemical recurrence (BCR), which is determined by rising of serum PSA levels within 10 years of RP (3, 4). BCR indicates increased risk for metastasis and castration resistant PCa (5, 6). Exploring gene expressions that are closely correlated with BCR is of great importance. In this regard, more informative markers for assessing increased risk of BCR are highly needed.
Reprogramming of energy metabolism, especially abnormal activation of glycolysis (also known as the Warburg effect) in the presence of oxygen, has been recognized as one of the central hallmarks of cancer (7, 8). Cancer cells exhibit a higher level of glucose consumption and consequent lactate production (9). Glycolysis facilitates conversion of nutrient uptake into biomass and thereby sustains the rapid cancer cell growth (10). Moreover, activation of glycolysis coupled to increased production of lactic acid, promotes multiple cancer-promoting processes, including tumor invasion and metastasis, angiogenesis, suppression of the local anticancer immune response, as well as hypoxia resistance (11, 12). It has been reported that PCa cells develop high rates of glucose consumption in the metastatic stage (13, 14). PCa patients with highly glycolytic tumors have a worse prognosis (15). However, the association between the glycolysis-related gene signature and biochemical recurrence of PCa is largely unknown. We hypothesized that a signature based on glycolysis-related genes might be a concise and practical tool for predicting the BCR of PCa patients after RP. Here, we develop a glycolysis-based five-gene signature for BCR after RP using large-scale gene expression data obtained from The Cancer Genome Atlas (TCGA) and validate it using two Gene Expression Omnibus (GEO) dataset (GSE54460 and GSE70769).
Methodology and Methods
All analyses were processed using the R software (v. 3.6.3).
Data Acquisition
RNA-seq raw counts (Illumina Hiseq 2000v2) and clinical information for TCGA prostate adenocarcinoma (TCGA-PRAD, https://portal.gdc.cancer.gov/) dataset were downloaded using TCGAbiolinks (Bioconductor version, Release 3.11) package in R. This study complies with the publication guidelines of TCGA (http://cancergenome.nih.gov/publications/publicationguidelines). The RNA-seq data of 100 patients (GSE54460) and the microarray data of 94 patients (GSE70769) were downloaded from GEO dataset (https://www.ncbi.nlm.nih.gov/gds). We used TCGA dataset as the training set and two GEO datasets as independent validation cohorts. There are 408 patients with complete BCR information in TCGA dataset. Among these, 48 cases had BCR, and 360 cases had no BCR. Among the 100 patients from GSE54460, 97 had complete data and were included in this study. Of these cases, 47 had BCR and 50 had no BCR. Additionally, there are 45 cases with BCR in 92 patients with complete information from GSE70769 (Table 1). BCR is defined as two or more consecutively elevated PSA results greater than 0.2 ng/ml.
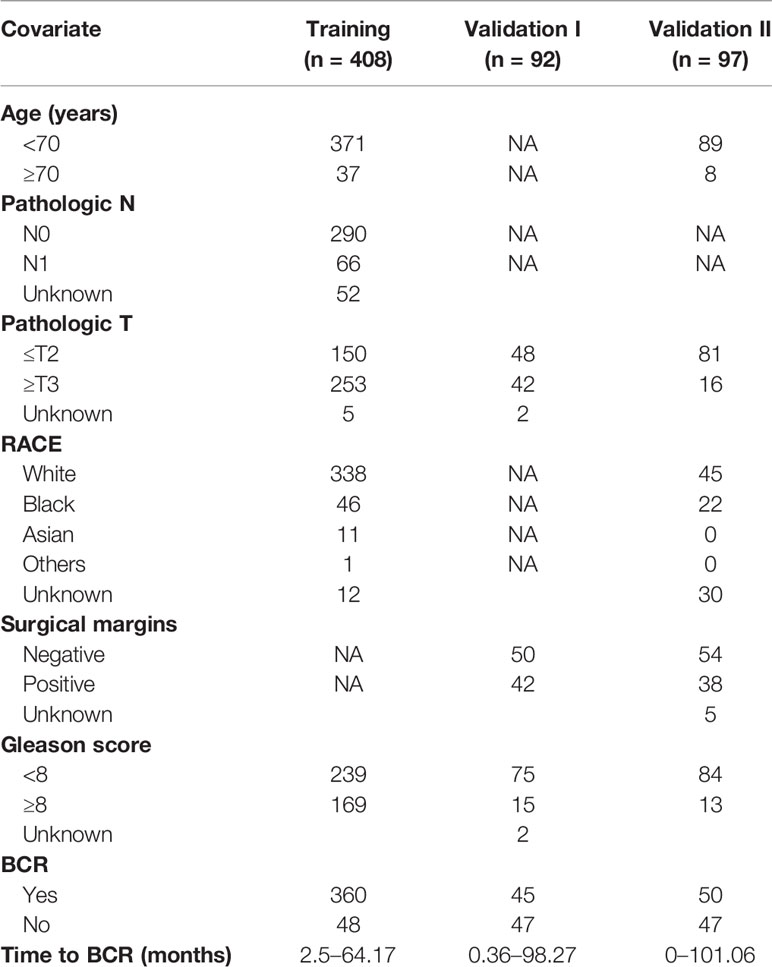
Table 1 Clinical characteristics for study cohorts.
Preliminary Screening of Genes
Since genes with no biologically meaningful expression levels are not of interest in a biological point of view (16), we excluded genes with very low expression level by selecting genes with their expression level above 1 in >50% of the total samples. Moreover, among the patients with the same cancer, different patient experiences totally different clinical outcome. The different mRNA expression levels result in diverse prognostic risks, suggesting that the genes with higher variable expression among different patients are more likely to have predictive values (17, 18). To select genes with variable expressions, we calculated median absolute deviation (MAD), a robust measure of the variability of quantitative data, of every gene, and the genes in the last 20 percent of the total expression variances were excluded.
Gene Set Selection
A glycolysis-related gene set (HALLMARK_GLYCOLYSIS) containing 200 genes was collected from the Molecular Signatures Database (MsigDB, v7.2).
Selection of BCR Free Survival-Related Genes
The association between glycolysis-related genes and the BCR of the patients was analyzed in the training cohort. Survival package in R was used to perform the univariable cox proportional hazards regression analysis. P < 0.05 was considered as statistically significance, and the gene was selected as a BCR-related gene. We then applied a robust likelihood-based survival modeling approach to further identify BCR-related genes. The analysis was implemented by using the rbsurv package in R, and the detailed algorithm is summarized in the previous publication (19).
Construction and Validation of the Risk Score Formula
Glycolysis-related genes identified in the training set from the previous steps were further weighed by their estimate regression coefficients in the multiply Cox regression analysis and thereby the risk formula was calculated. The risk score for each patient in the training set was calculated with this formula. A receiver operating characteristic curve (ROC) was constructed using the survival ROC package in R and the optimal cut-off point was determined with the maximal sensitivity and specificity. ROC figure was plotted by ggplot2 in R. Based on the cut-off value, the patients were classified into low-risk score and high-risk score groups. “Survfit” function in survival package was used to plot Kaplan–Meier curves for two distinct groups of patients and to calculate P value from log rank test. The association between the five-gene signature and clinical characteristics, as well as the expression levels of five genes in recurrent PCa and non-recurrent PCa were calculated and plotted using function based on ggbetweenstats of the ggstatsplot R package. The accuracy of the risk score formula was then further validated by fitting in two independent validation cohorts.
Results
The overall study procedures were summarized in Figure 1. Univariate Cox proportional hazard model, robust likelihood-based survival model and multivariate Cox proportional hazards model were used to establish a five-gene signature that can predict the BCR free survival.
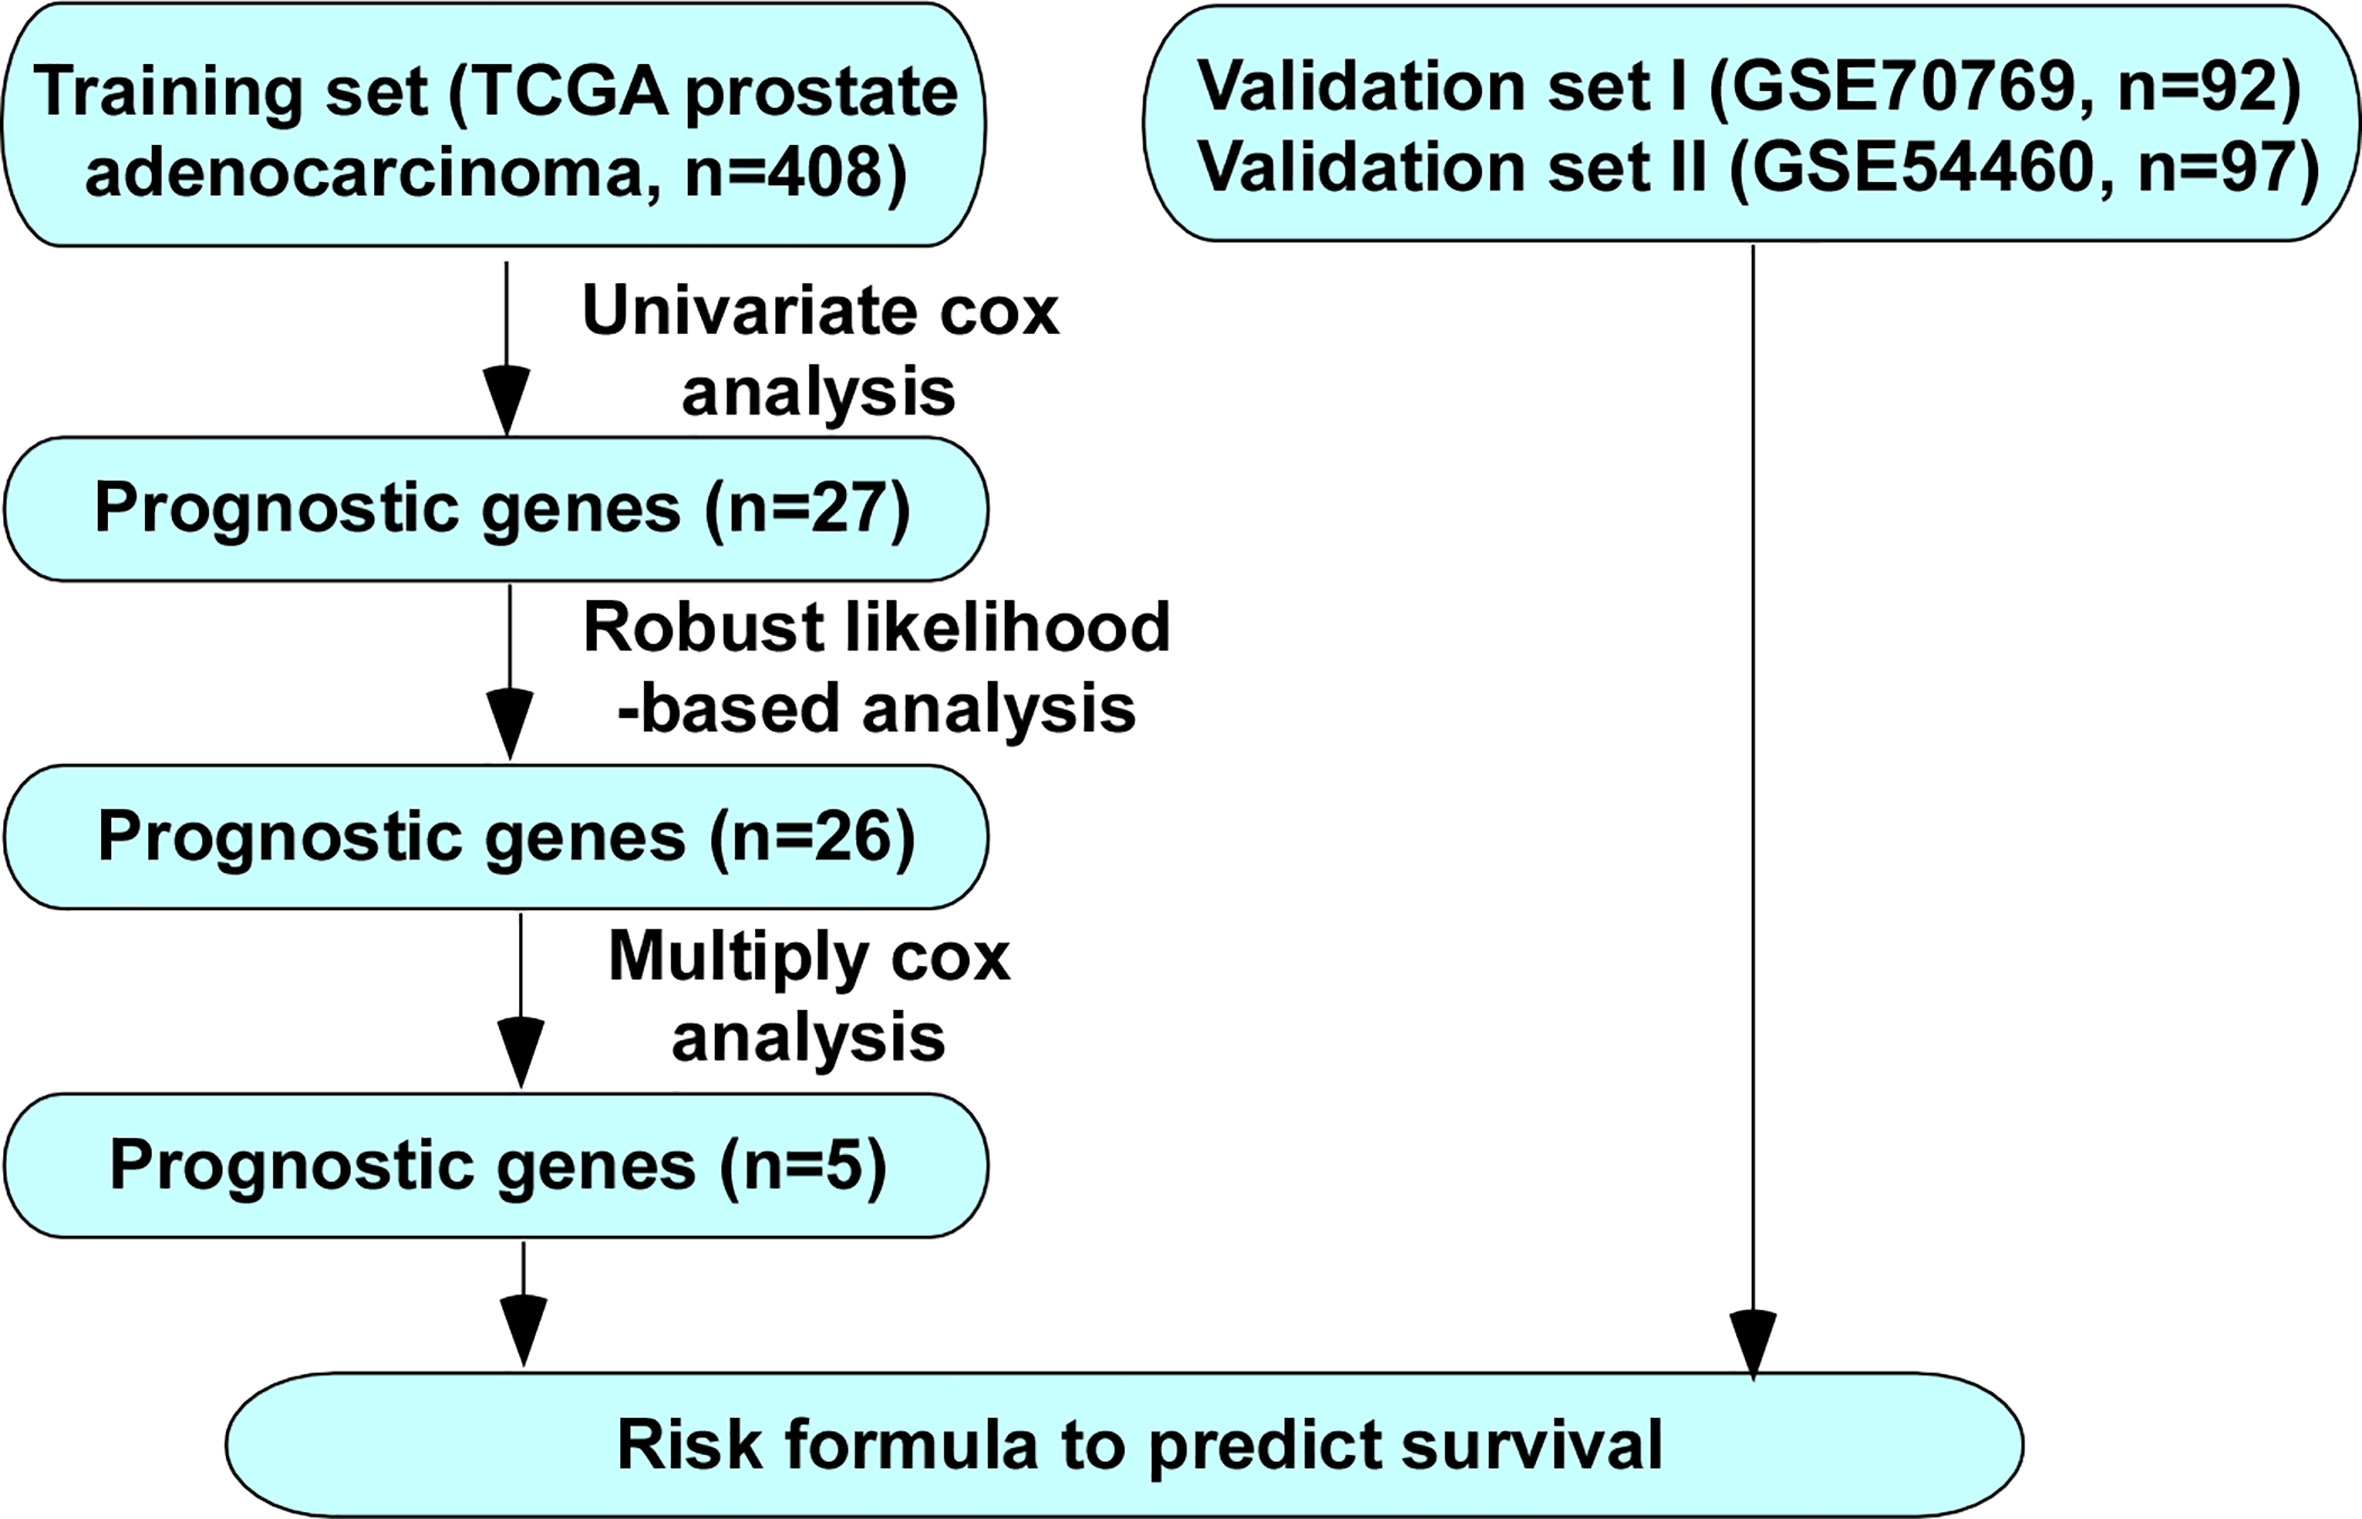
Figure 1 Flow chart of methods for building the five-gene signature for prediction of BCR free survival of PCa patients.
Screening of BCR Free Survival-Related Genes by Univariate Cox Proportional Hazard Modeling
The patients in TCGA with complete BCR information (408 cases) were used as the training set. The 97 patients from GSE54460 and 92 patients from GSE70769 with complete BCR information were used as validation cohorts. The demographic and clinical characteristics of the three cohorts are presented in Table 1. A univariate Cox proportional hazards regression model was employed for training cohort using the coxph function in the R package survival to identify an initial set of 27 BCR free survival-related genes with the threshold of P value set as 0.05 (Table 2).
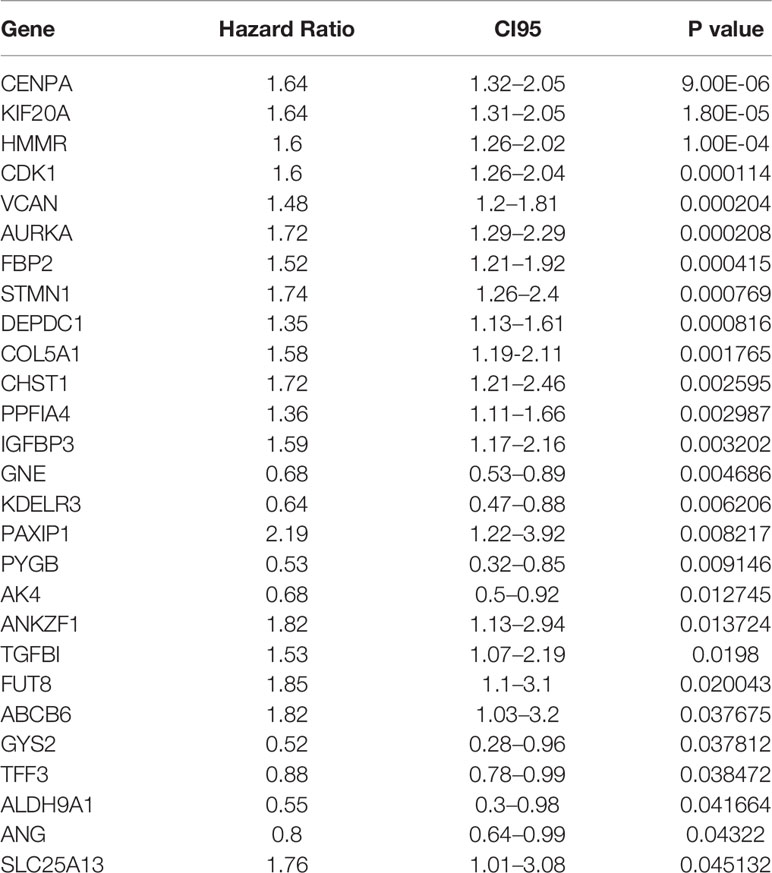
Table 2 Twenty-seven genes significantly associated with the BCR of patients in the training set (n = 408).
Establishment of a Glycolysis-Based Five-Gene Signature by Robust Likelihood-Based Survival and Multivariate Cox Proportional Hazards Modeling
To increase the feasibility and reliability, we performed the robust likelihood-based survival analysis using the R package rbsurv. As shown in Table 3, 26 genes were selected using rbsurv. Next, we subjected these genes to multivariable Cox analysis using the training set, and each gene’s regression coefficient was generated. This procedure constructed a prediction model containing five genes: glycogen synthase 2 (GYS2), stathmin 1 (STMN1), PTPRF interacting protein alpha 4 (PPFIA4), KDEL endoplasmic reticulum protein retention receptor 3 (KDELR3), and ATP binding cassette subfamily B member 6 (ABCB6). The risk formula used to calculate the risk score was as follows: risk score = (−0.8367*GYS2) + (0.3448*STMN1) + (0.3595*PPFIA4) + (−0.1940*KDELR3) + (0.4779*ABCB6). We then calculated the risk score of each patient in training set using the risk formula. As shown in Figure 2A, we visualized risk score distribution and the dash line was used to determine the boundary between high risk group and low risk group. An optimal cut-off was determined based on the ROC analysis (Figure 2B). As shown in Figure 2B, we selected the point with the maximal sensitivity and specificity as the cut-off point (value = 1.349) and the patients in training set were divided into two groups, high risk group (n = 130) and low risk group (n = 278) (Figure 2A). The area under the ROC Curves (AUC) was 0.751 (Figure 2B). We evaluated the BCR free survival using Kaplan-Meier method and log-rank test, and the results showed that BCR free survival time of the high risk group was significantly shorter than the low risk group (P <0.0001) (Figure 2C).
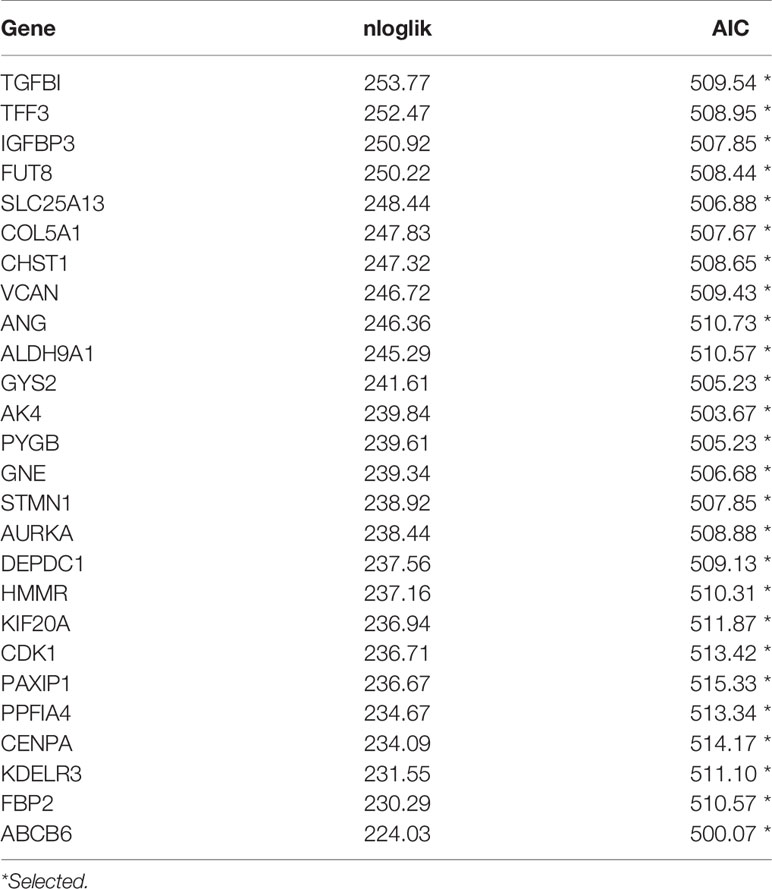
Table 3 Prognosis related genes signature screened using forward selection in the training set (n = 408).
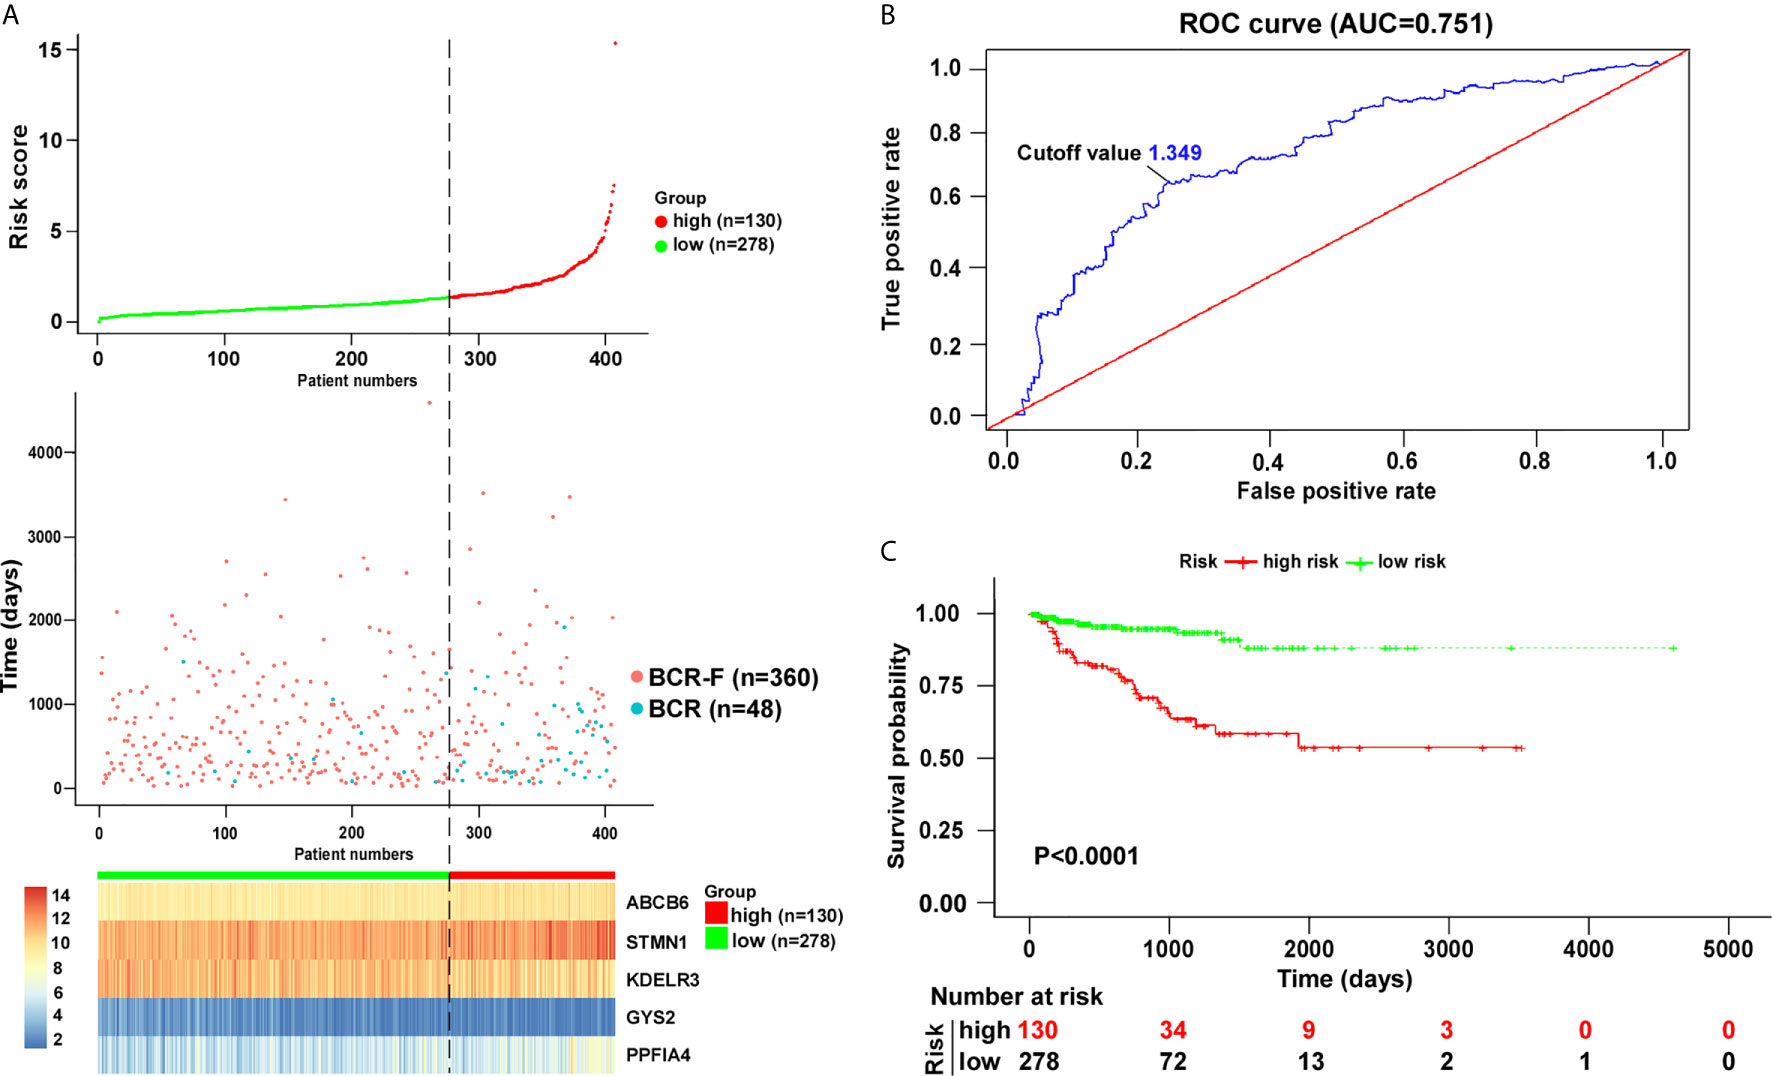
Figure 2 Risk score analysis based on five-gene signature in training cohort. (A) Distribution of five-gene-based risk scores, BCR free survival status, and gene expression levels of patients in training cohort. (B) ROC curve analyses based on the five-gene signature. (C) Kaplan–Meier curves of BCR free survival according to the five-gene signature. P value was calculated with the logrank test.
Among the five genes, GYS2 and KDELR3 have negative coefficients and were highly expressed in BCR free patients as compared with that in BCR patients. In contrast, the levels of genes with positive coefficients (STMN1, PPFIA4, and ABCB6) were increased in BCR patients (Figure 3).
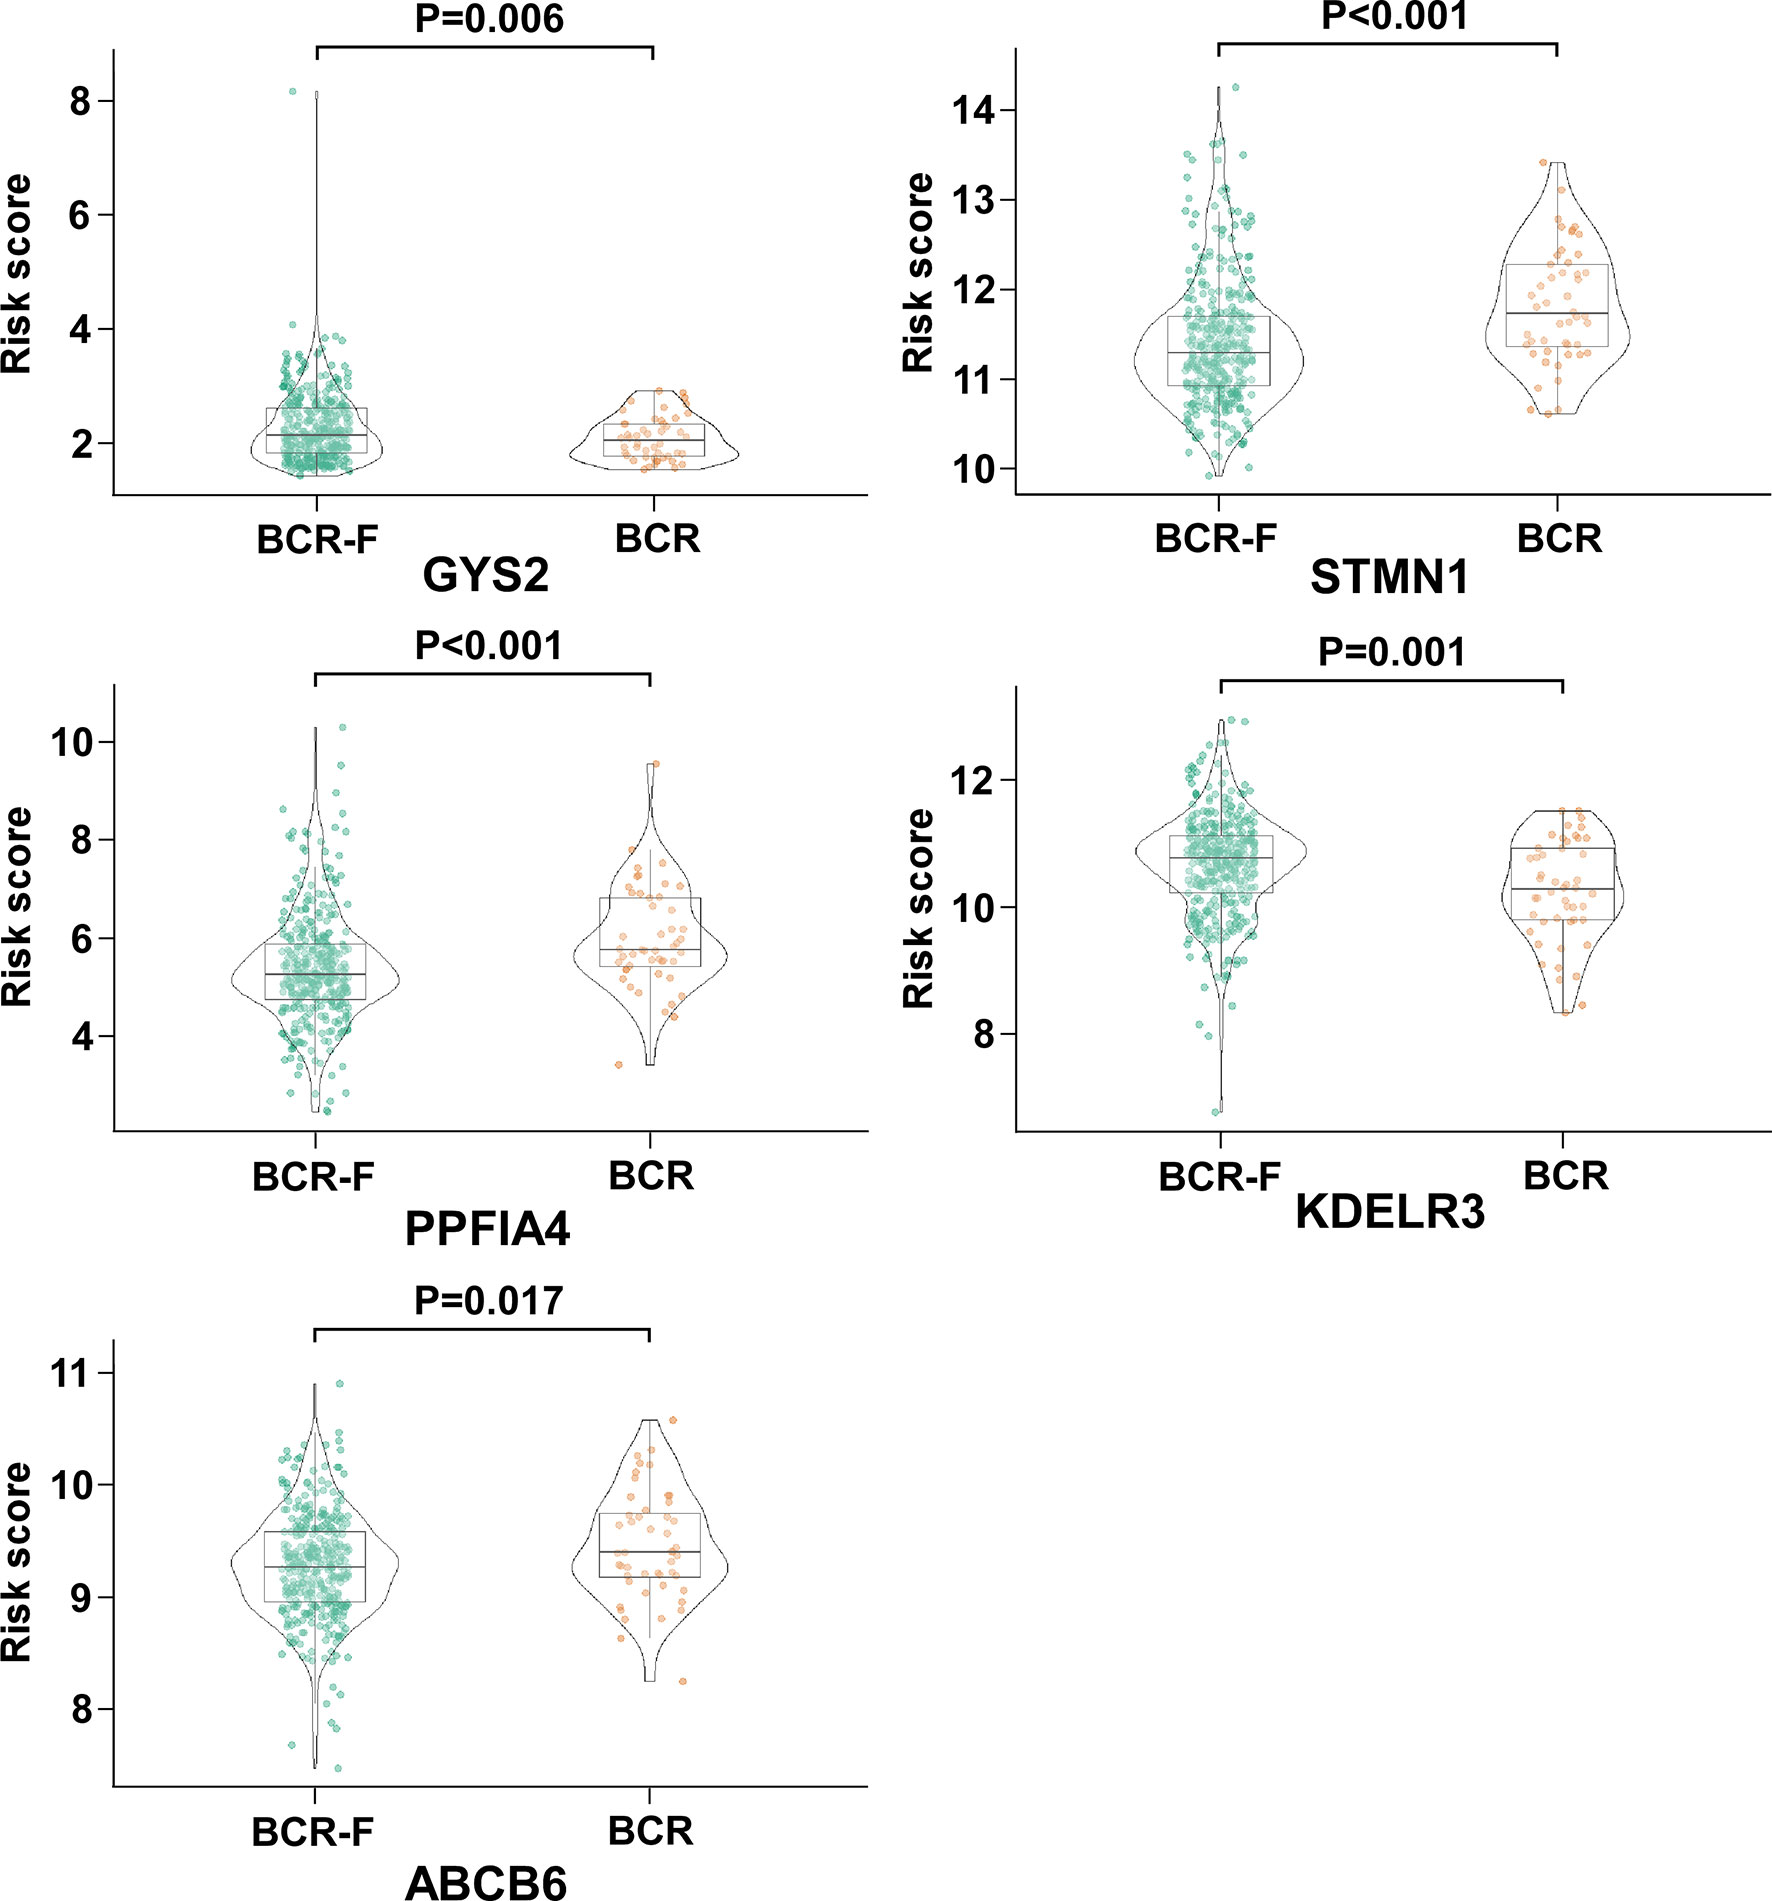
Figure 3 The expression of GYS2, KDELR3, STMN1, PPFIA4, and ABCB6 in BCR and BCR free patients. GYS2 and KDELR3 were highly expressed in BCR free patients. In contrast, the expression levels of STMN1, PPFIA4, and ABCB6 were increased in BCR patients.
The Relationship Between Clinical Characteristics and BCR Free Survival-Related Prediction Model
Next, we analyzed the association between the risk score value and clinical characteristics of the PCa patients. As shown in Figure 4, the risk score value was higher in T3–4 than in T2 (P < 0.001), higher in N1 stage than N0 stage (P = 0.013), and higher in Gleason score ≥ 8 than <7 (P < 0.001). No significance was observed in age <70 and age ≥70 (Figure 4).
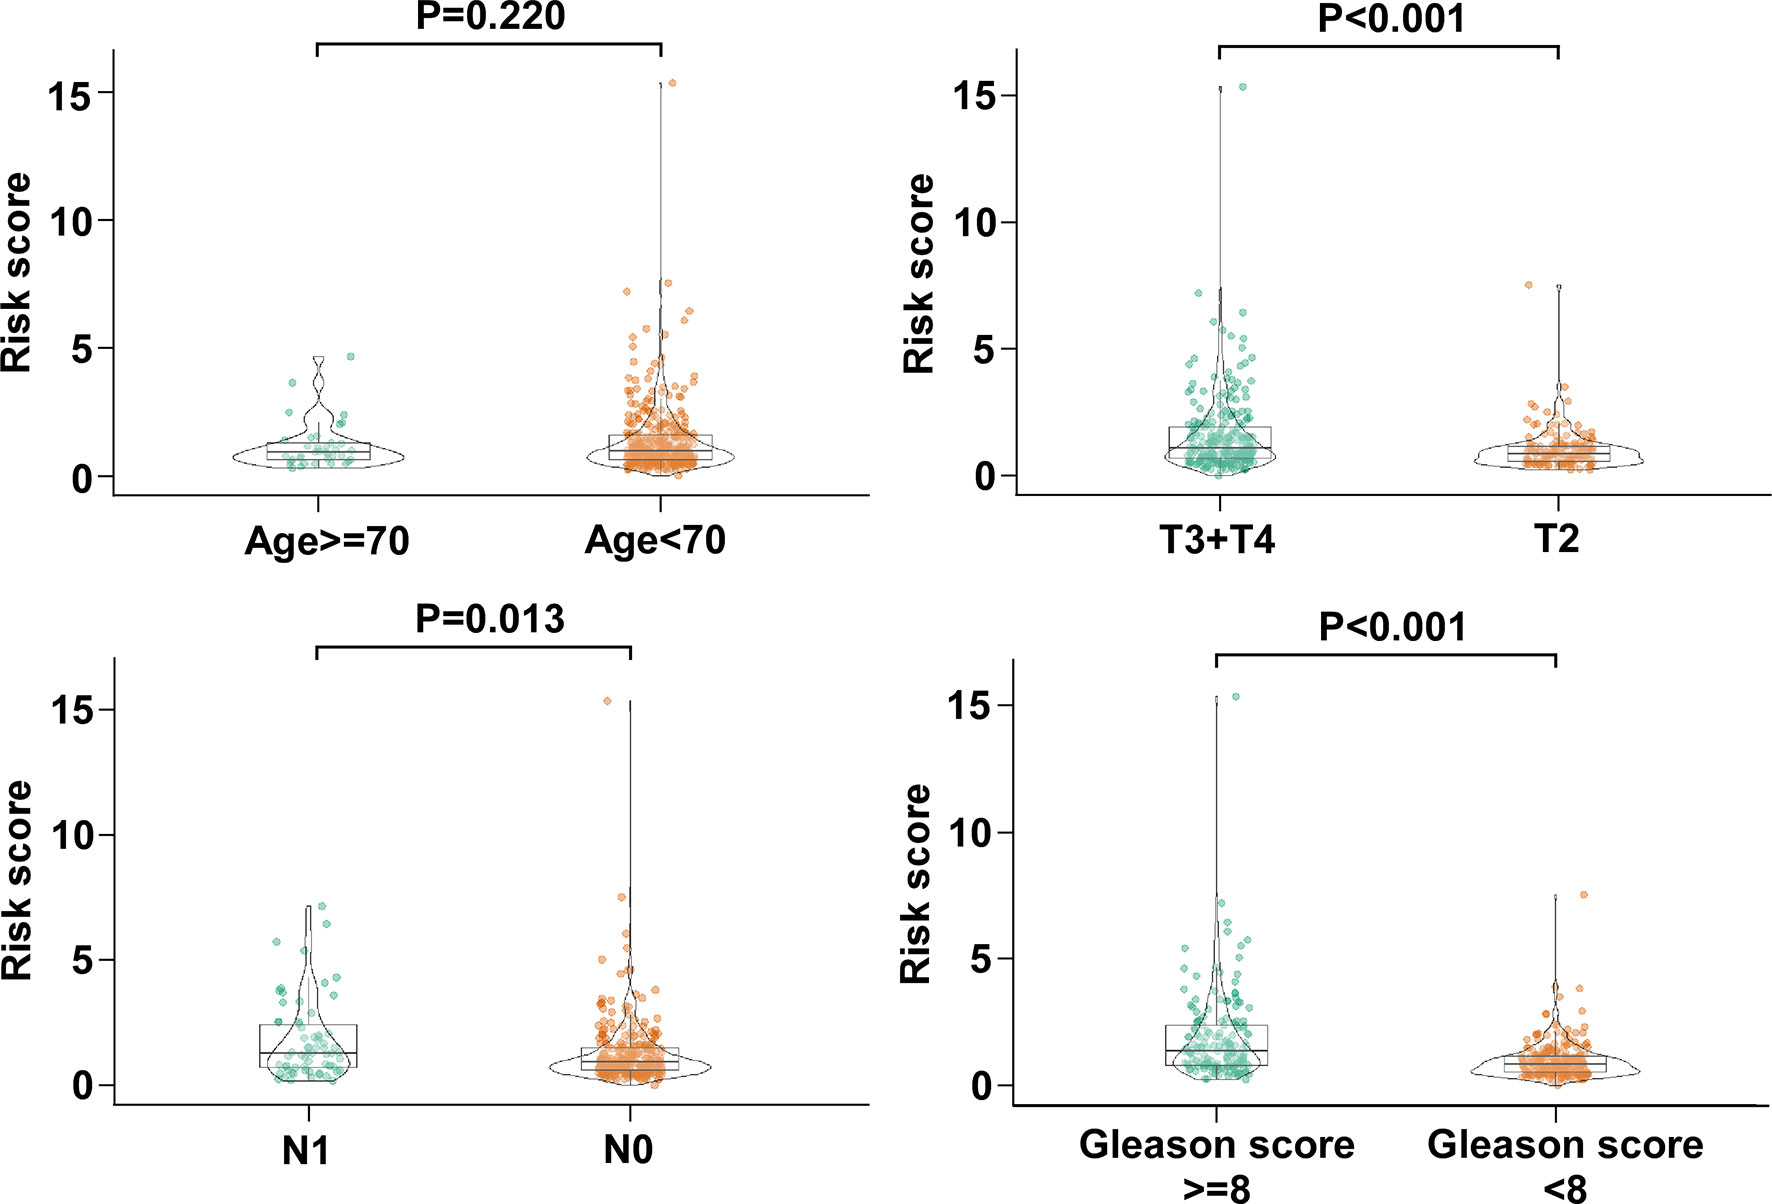
Figure 4 The association between the five-gene signature and clinical characteristics of PCa patients. The distribution of risk scores was associated with pathologic T, pathologic N, and Gleason score, but not age.
Screening of BCR Free Survival-Related Clinical Characteristics
We screened the BCR free survival-related clinical characteristics by performing Kaplan–Meier analyses in the training cohort. As shown in Figure 5A, pathological T, pathological N, and Gleason score were significantly associated with the BCR free survival of PCa patients. Moreover, a forest plot was constructed using a multivariable Cox regression analysis to visualize the distribution of clinicopathological parameters, including age, pathological T, pathological N, Gleason score and risk score. As shown in Figure 5B, the identified five-gene signature was an independent factor affecting BCR free survival in the training cohort.
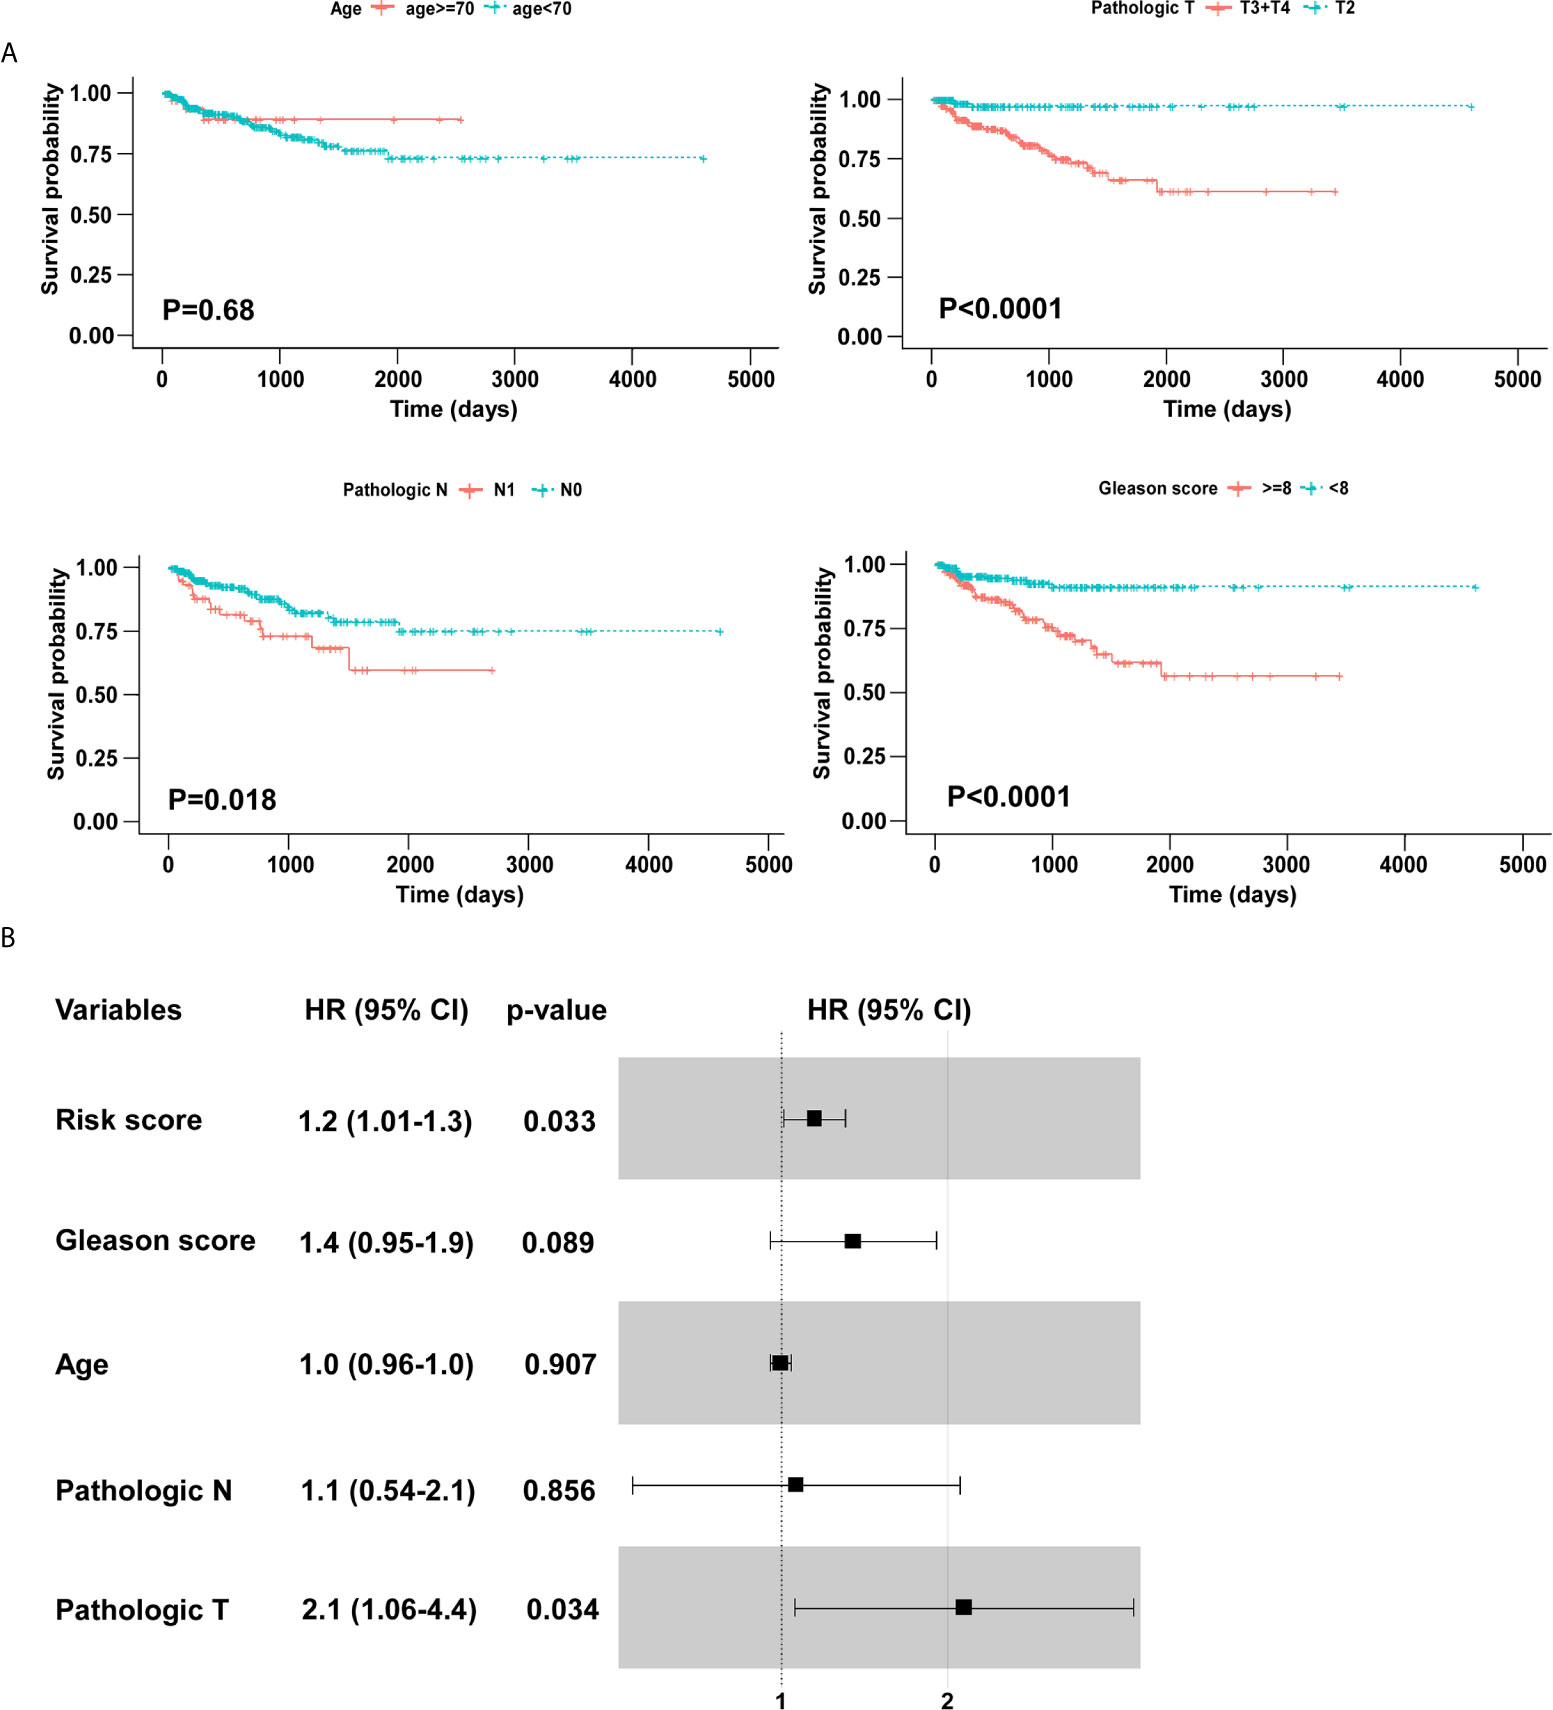
Figure 5 Identification of BCR free survival related clinical characteristics using Kaplan–Meier analyses. (A) Pathologic T and Gleason score were significantly associated with BCR free survival. (B) The forest plot of risk score and clinical parameters.
Validation of the Five-Gene Signature for BCR Free Survival Prediction
To validate the five-gene signature for BCR free survival prediction, we applied the same analyses to the other two independent validation cohorts, respectively. The distributions of risk scores, BCR status and genes expression were presented in Figures 6A and 7A. Moreover, the results of Kaplan–Meier analysis in two validation cohorts revealed that the BCR free survival time in patients with low risk was significantly longer than that of the patients with high risk (GSE70769: P = 0.001; GSE54460: P = 0.00019) (Figures 6B and 7B). Of note, in consistent with the result in the training cohort, the risk score was also an independent risk factor in two validation cohorts (GSE70769: HR = 2.6, P = 0.003; GSE54460: HR = 4.7, P = 0.002) (Figures 6C and 7C).

Figure 6 Verification of five-gene signature in validation cohort (GSE70769). (A) Distribution of five-gene-based risk scores, BCR free survival status, and gene expression levels of patients in validation cohort. (B) Kaplan–Meier curves of BCR free survival according to the five-gene signature. P value was calculated with the logrank test. (C) The forest plot of risk score and clinical parameters.
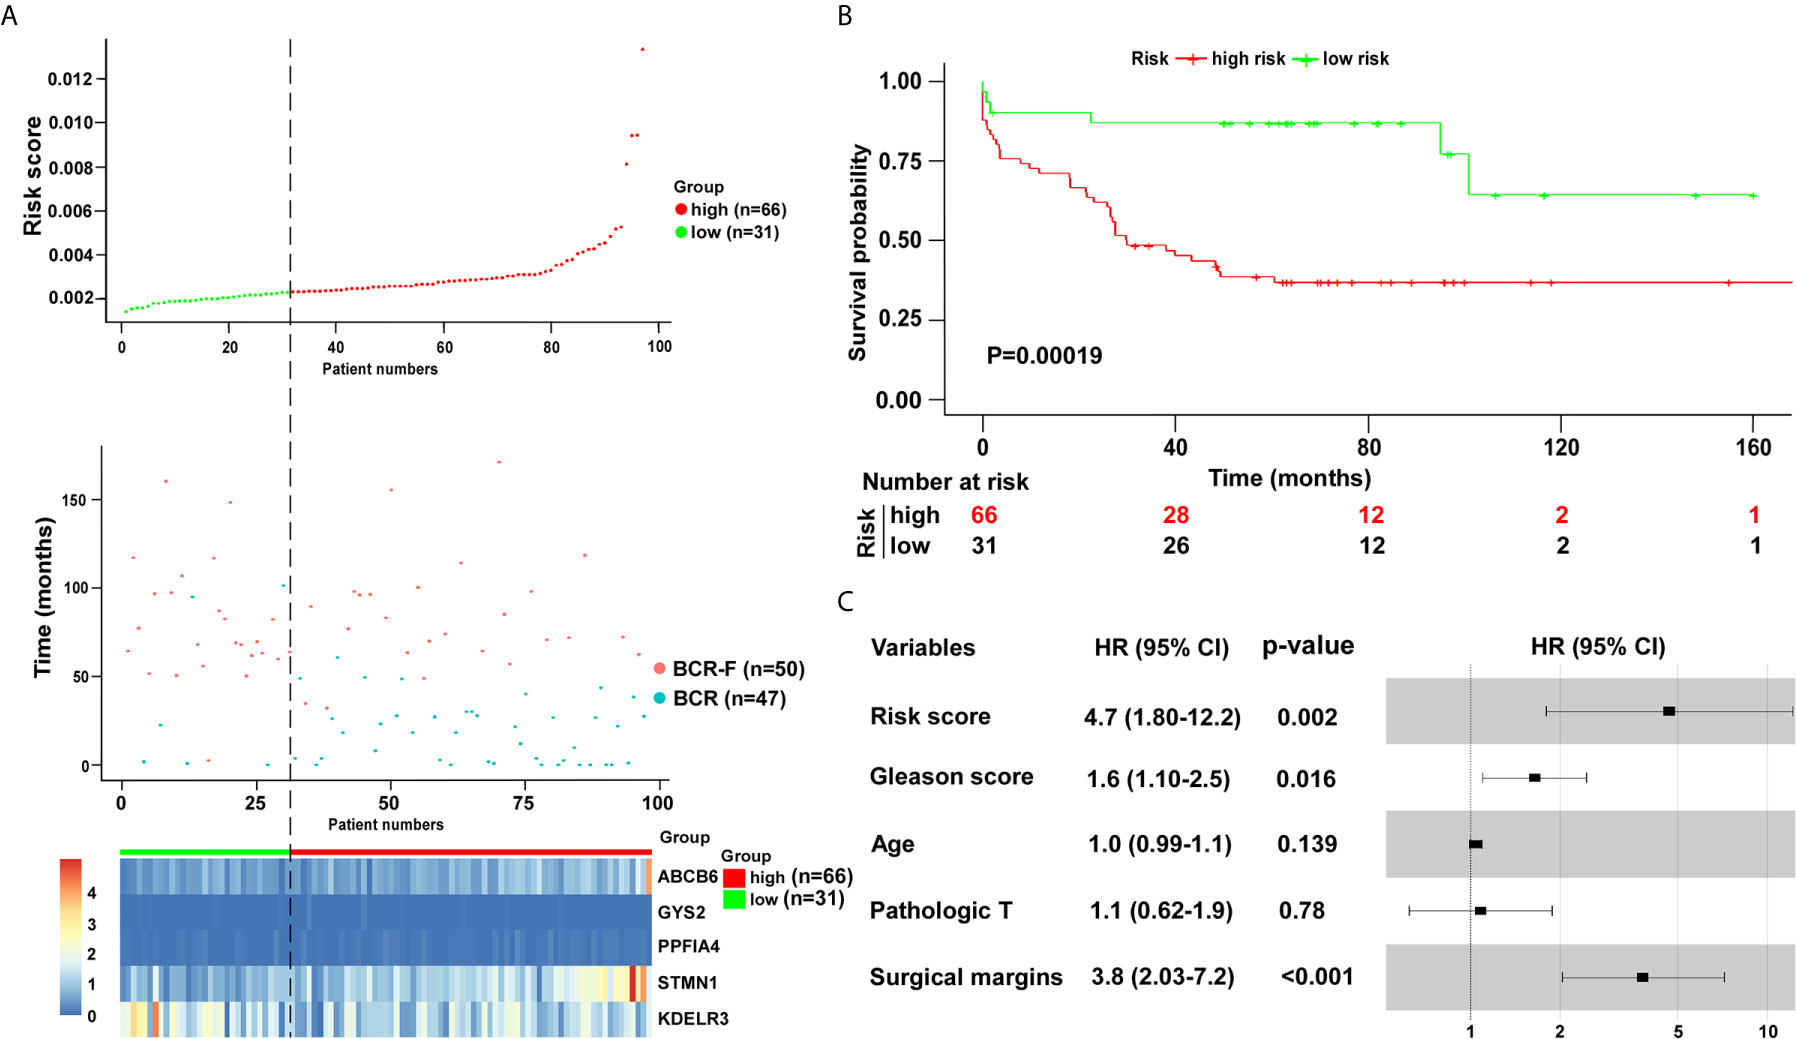
Figure 7 Verification of five-gene signature in validation cohort (GSE54460). (A) Distribution of five-gene-based risk scores, BCR free survival status, and gene expression levels of patients in validation cohort. (B) Kaplan–Meier curves of BCR free survival according to the five-gene signature. P value was calculated with the logrank test. (C) The forest plot of risk score and clinical parameters.
Discussion
Considering that one of the major turning points in PCa development is the progression to BCR, it is highly desirable to effectively assess PCa patients with increased risk of BCR (20, 21). Accumulating researches have been made to identify biomarkers to improve the prediction of patients with BCR. It has been demonstrated that certain clinical parameters, including pathologic stage, Gleason score, lymphonode metastasis, and lymphovascular invasion, are associated with BCR (22–24). Moreover, several gene signatures have been established to predict BCR after prostatectomy. For instance, it has been shown that the cell cycle progression (CCP) score, an RNA expression signature based on the levels of 31 CCP genes, can predict BCR free survival (25). Jiang et al. extracted 696 differentially expressed genes from the TCGA dataset and developed a 15-gene signature (SigMuc1NW) using Elasticnet for prediction of BCR (26). In addition, signatures based on non-coding RNA, such as long non-coding RNAs (lncRNAs) and microRNAs (miRNAs), also have been established to predict BCR. Using lncRNAs that were differentially expressed between tumor and normal prostate tissues, as well as between high and low Gleason score tumor tissues, Shao et al. constructed a seven-lncRNA signature that can predict BCR (27). Moreover, five miRNAs (miR-30c-5p/31-5p/141-3p/148a-3p/miR-221-3p) were identified as independent prognostic biomarkers for BCR (28). However, the predictive value of glycolysis-related gene signature in BCR remains largely unknown. Given the important roles of elevated glycolysis in cancer development and progression, we would like to explore whether it is possible to establish a robust glycolysis-based gene signature to predict the BCR in PCa patients.
As compared with a single biomarker, integrating multiple biomarkers into an aggregated model with bioinformatics analysis would substantially improve the predictive performance (29, 30). Here, we performed a multistep analysis to identify a glycolysis-based gene signature which could predict BCR free survival in patients with PCa. Considering that differentially expressed genes between normal tissues and malignant specimens may not be associated with BCR at all, a univariable Cox analysis was carried out for the primary screening. Robust likelihood-based survival modeling, which selects predictive factors based on the partial likelihood of the Cox model, is commonly used in construction of predictive signature for cancers (31, 32). We used robust likelihood-based survival analysis and multiply Cox regression model to establish a five-gene signature with prediction value. Cut-off scores are often set arbitrarily and vary between reports. ROC curve analysis can be used as an alternative method in the selection and validation of cut-off scores for determining clinically relevant threshold (33, 34). We used ROC analysis to identify the optimal cut-off point for dividing patients into low risk and high risk groups. We found that the BCR free survival time of high risk group was significantly shortened. Importantly, results from the validation cohorts confirmed the robustness of the glycolysis-based five-gene signature, suggesting the excellent performance and consistency of this model throughout the training cohort and two validation cohorts. These data indicate that the five-gene signature exhibits a robust prediction value for BCR free survival in patients with PCa.
We identified five glycolysis-related mRNAs (GYS2, STMN1, PPFIA4, KDELR3 and ABCB6) which were associated with BCR after RP. Among the 5 genes, the expression levels of the genes with negative coefficients (GYS2 and KDELR3) were increased in BCR free patients. Moreover, STMN1, PPFIA4, and ABCB6 have positive coefficients, and their expression levels were upregulated in patients with BCR. It is of note that bulk tumor mass is composed of diverse cells, including malignant, stromal and immune cells (35). Moreover, the datasets in current study are based on the conventional bulk-level molecular profiling. The molecular profiles of these approaches represent an average readout from all cell types within the tissue. The averaging over the individual cells leads to information loss (36). Therefore, the change of the expression levels of the five genes may partially be due to the alterations in stromal amount. Recent developments in single-cell RNA sequencing (scRNA-seq) have enabled the transcriptomes of single cells to be sequenced in a high throughput manner (37). ScRNA-seq provides a comprehensive and precise analysis of the cancer cell genome (38). Further studies based on the new powerful approach in large cohort of PCa patients will provide new insights into the characteristics of the disease and facilitate the exploration of new markers and therapeutic targets.
Some of the 5 genes have been implicated to be involved in cancers, including PCa. GYS2 encodes a protein that catalyzes the rate-limiting step in the synthesis of glycogen (39). It has been reported that GYS2 acted as a tumor suppressor in hepatocellular carcinoma (HCC) (40). The research found that GYS2 inhibited the proliferation of HCC cells via a negative feedback loop with p53 (40). A series studies have demonstrated the oncogenic role of STMN1 in various kinds of cancers (41–43). STMN1 was overexpressed in PCa and its expression was associated with the malignant behavior of the disease (44). MiR-34a, a tumor suppressor miRNA, inhibited the progressive phenotypes of PCa cells via directly regulating STMN1 (45). PPFIA4 belongs to the liprin-alpha gene family and inhibition of PPFIA4 reduced pancreatic cancer cell proliferation and invasion (46). Moreover, suppression of PPFIA4 promoted chemosensitivity of small lung cancer (SCL) cells under hypoxia (47). KDELR3 is a gene which encodes a member of the KDEL endoplasmic reticulum protein retention receptor family. The research by Marie et al. showed that silencing of KDELR3 reduced lung colonization of melanoma cells in experimental metastasis assays via regulating the metastasis suppressor, KAI1 (48). In addition, overexpression of ABCB6, a member of the ATP-binding cassette (ABC) transporter superfamily, could enhance the accumulation of protoporphyrin IX and improve the efficacy of 5-aminolevulinic acid-based photodynamic therapy in glioma (49). Karatas et al. reported that the expression of ABCB6 was elevated in PCa tissues as compared with that in normal prostate tissues. Consistently, they also found that ABCB6 was overexpressed in recurrent PCa in comparison with non-recurrent PCa (50). However, the unrecognized roles of GYS2, PPFIA4 and KDELR3 in PCa are worth further investigating to identify the biological functions and underlying mechanisms of theirs in the development and progression of the disease. Further delineation of molecules from the signature will provide new insights into the etiology of the disease and might uncover potential therapeutic targets.
In conclusion, we conducted an integrated study to develop a glycolysis-based five-gene signature for the prediction of the BCR free survival of PCa patients after RP. Future prospective clinical trials are warranted to evaluate the clinical utilization of this signature.
Data Availability Statement
Publicly available datasets were analyzed in this study. This data can be found here: https://portal.gdc.cancer.gov/, The Cancer Genome Atlas prostate adenocarcinoma dataset.
Author Contributions
ZX, LX, and LL: data acquisition, analysis, and manuscript writing. HL, JJ, MP, and YH: interpretation of data and statistical analyses. HX, HG, and YL: study concept, design, and supervision. All authors contributed to the article and approved the submitted version.
Funding
The funding for this project was provided by the National Natural Science Foundation of China (No. 82073050 and 81772486); Guangdong Basic and Applied Basic Research Foundation (No. 2019A1515012046 and 2020A1515010049); Guangdong Medical Scientific Research Foundation (No. A2020343); and Young Teachers Cultivate Projects of Sun Yat-sen University (No. 20ykpy60).
Conflict of Interest
The authors declare that the research was conducted in the absence of any commercial or financial relationships that could be construed as a potential conflict of interest.
References
1. Munkley J, Mills IG, Elliott DJ. The role of glycans in the development and progression of prostate cancer. Nat Rev Urol (2016) 13:324–33. doi: 10.1038/nrurol.2016.65
2. Miyahira AK, Sharp A, Ellis L, Jones J, Kaochar S, Larman HB, et al. Prostate cancer research: The next generation; report from the 2019 Coffey-Holden Prostate Cancer Academy Meeting. Prostate (2020) 80:113–32. doi: 10.1002/pros.23934
3. Faria EF, Chapin BF, Muller RL, Machado RD, Reis RB, Matin SF. Radical Prostatectomy for Locally Advanced Prostate Cancer: Current Status. Urology (2015) 86:10–5. doi: 10.1016/j.urology.2015.03.012
4. Briganti A, Joniau S, Gandaglia G, Cozzarini C, Sun M, Tombal B, et al. Patterns and predictors of early biochemical recurrence after radical prostatectomy and adjuvant radiation therapy in men with pT3N0 prostate cancer: implications for multimodal therapies. Int J Radiat Oncol Biol Phys (2013) 87:960–7. doi: 10.1016/j.ijrobp.2013.09.015
5. Arichi N, Mitsui Y, Hiraki M, Nakamura S, Hiraoka T, Sumura M, et al. Versican is a potential therapeutic target in docetaxel-resistant prostate cancer. Oncoscience (2015) 2:193–204. doi: 10.18632/oncoscience.136
6. Antonarakis ES, Feng Z, Trock BJ, Humphreys EB, Carducci MA, Partin AW, et al. The natural history of metastatic progression in men with prostate-specific antigen recurrence after radical prostatectomy: long-term follow-up. BJU Int (2012) 109:32–9. doi: 10.1111/j.1464-410X.2011.10422.x
7. Koppenol WH, Bounds PL, Dang CV. Otto Warburg’s contributions to current concepts of cancer metabolism. Nat Rev Cancer (2011) 11:325–37. doi: 10.1038/nrc3038
8. Hanahan D, Weinberg RA. Hallmarks of cancer: the next generation. Cell (2011) 144:646–74. doi: 10.1016/j.cell.2011.02.013
9. Wigfield SM, Winter SC, Giatromanolaki A, Taylor J, Koukourakis ML, Harris AL. PDK-1 regulates lactate production in hypoxia and is associated with poor prognosis in head and neck squamous cancer. Br J Cancer (2008) 98:1975–84. doi: 10.1038/sj.bjc.6604356
10. Lincet H, Icard P. How do glycolytic enzymes favour cancer cell proliferation by nonmetabolic functions? Oncogene (2015) 34:3751–9. doi: 10.1038/onc.2014.320
11. Mimeault M, Batra SK. Hypoxia-inducing factors as master regulators of stemness properties and altered metabolism of cancer- and metastasis-initiating cells. J Cell Mol Med (2013) 17:30–54. doi: 10.1111/jcmm.12004
12. Bénéteau M, Zunino B, Jacquin MA, Meynet O, Chiche J, Pradelli LA, et al. Combination of glycolysis inhibition with chemotherapy results in an antitumor immune response. Proc Natl Acad Sci USA (2012) 109:20071–6. doi: 10.1073/pnas.1206360109
13. Cutruzzolà F, Giardina G, Marani M, Macone A, Paiardini A, Rinaldo S, et al. Glucose Metabolism in the Progression of Prostate Cancer. Front Physiol (2017) 8:97. doi: 10.3389/fphys.2017.00097
14. Schoors S, De Bock K, Cantelmo AR, Georgiadou M, Ghesquière B, Cauwenberghs S, et al. Partial and transient reduction of glycolysis by PFKFB3 blockade reduces pathological angiogenesis. Cell Metab (2014) 19:37–48. doi: 10.1016/j.cmet.2013.11.008
15. Pertega-Gomes N, Felisbino S, Massie CE, Vizcaino JR, Coelho R, Sandi C, et al. A glycolytic phenotype is associated with prostate cancer progression and aggressiveness: a role for monocarboxylate transporters as metabolic targets for therapy. J Pathol (2015) 236:517–30. doi: 10.1002/path.4547
16. Bourgon R, Gentleman R, Huber W. Independent filtering increases detection power for high-throughput experiments. Proc Natl Acad Sci USA (2010) 107:9546–51. doi: 10.1073/pnas.0914005107
17. Luo D, Deng B, Weng M, Luo Z, Nie X. A prognostic 4-lncRNA expression signature for lung squamous cell carcinoma. Artif Cells Nanomed Biotechnol (2018) 46:1207–14. doi: 10.1080/21691401.2017.1366334
18. Li J, Wang J, Chen Y, Yang L, Chen S. A prognostic 4-gene expression signature for squamous cell lung carcinoma. J Cell Physiol (2017) 232:3702–13. doi: 10.1002/jcp.25846
19. He Y, Li X, Meng Y, Fu S, Cui Y, Shi Y, et al. A prognostic 11 long noncoding RNA expression signature for breast invasive carcinoma. J Cell Biochem (2019) 120:16692–702. doi: 10.1002/jcb.28927
20. May EJ, Viers LD, Viers BR, Kawashima A, Kwon ED, Karnes RJ, et al. Prostate cancer post-treatment follow-up and recurrence evaluation. Abdominal Radiol (New York) (2016) 41:862–76. doi: 10.1007/s00261-015-0562-1
21. Shipley WU, Seiferheld W, Lukka HR, Major PP, Heney NM, Grignon DJ, et al. Radiation with or without Antiandrogen Therapy in Recurrent Prostate Cancer. N Engl J Med (2017) 376:417–28. doi: 10.1056/NEJMoa1607529
22. Liesenfeld L, Kron M, Gschwend JE, Herkommer K. Prognostic Factors for Biochemical Recurrence More than 10 Years after Radical Prostatectomy. J Urol (2017) 197:143–8. doi: 10.1016/j.juro.2016.07.004
23. Fajkovic H, Mathieu R, Lucca I, Hiess M, Hubner N, Al Hussein Al Awamlh B, et al. Validation of lymphovascular invasion is an independent prognostic factor for biochemical recurrence after radical prostatectomy. Urol Oncol (2016) 34:233.e1–6. doi: 10.1016/j.urolonc.2015.10.013
24. Acimovic M, Dabic-Stankovic K, Pejcic T, Dzamic Z, Rafailovic D, Hadzi-Djokic J. Preoperative Gleason score, percent of positive prostate biopsies and PSA in predicting biochemical recurrence after radical prostatectomy. J BUON (2013) 18:954–60.
25. Sommariva S, Tarricone R, Lazzeri M, Ricciardi W, Montorsi F. Prognostic Value of the Cell Cycle Progression Score in Patients with Prostate Cancer: A Systematic Review and Meta-analysis. Eur Urol (2016) 69:107–15. doi: 10.1016/j.eururo.2014.11.038
26. Jiang Y, Mei W, Gu Y, Lin X, He L, Zeng H, et al. Construction of a set of novel and robust gene expression signatures predicting prostate cancer recurrence. Mol Oncol (2018) 12:1559–78. doi: 10.1002/1878-0261.12359
27. Shao N, Zhu Y, Wan F-N, Ye D-W. Identification of seven long noncoding RNAs signature for prediction of biochemical recurrence in prostate cancer. Asian J Androl (2019) 21:618–22. doi: 10.4103/aja.aja_118_18
28. Zhao Z, Weickmann S, Jung M, Lein M, Kilic E, Stephan C, et al. A Novel Predictor Tool of Biochemical Recurrence after Radical Prostatectomy Based on a Five-MicroRNA Tissue Signature. Cancers (Basel) (2019) 11:1603. doi: 10.3390/cancers11101603
29. Wei JH, Haddad A, Wu KJ, Zhao HW, Kapur P, Zhang ZL, et al. A CpG-methylation-based assay to predict survival in clear cell renal cell carcinoma. Nat Commun (2015) 6:8699. doi: 10.1038/ncomms9699
30. Zhang JX, Song W, Chen ZH, Wei JH, Liao YJ, Lei J, et al. Prognostic and predictive value of a microRNA signature in stage II colon cancer: a microRNA expression analysis. Lancet Oncol (2013) 14:1295–306. doi: 10.1016/s1470-2045(13)70491-1
31. Diao P, Song Y, Ge H, Wu Y, Li J, Zhang W, et al. Identification of 4-lncRNA prognostic signature in head and neck squamous cell carcinoma. J Cell Biochem (2019) 120:10010–20. doi: 10.1002/jcb.28284
32. Li GX, Ding ZY, Wang YW, Liu TT, Chen WX, Wu JJ, et al. Integrative analysis of DNA methylation and gene expression identify a six epigenetic driver signature for predicting prognosis in hepatocellular carcinoma. J Cell Physiol (2019) 234:11942–50. doi: 10.1002/jcp.27882
33. Gomez-Martin C, Plaza JC, Pazo-Cid R, Salud A, Pons F, Fonseca P, et al. Level of HER2 gene amplification predicts response and overall survival in HER2-positive advanced gastric cancer treated with trastuzumab. J Clin Oncol (2013) 31:4445–52. doi: 10.1200/jco.2013.48.9070
34. Zlobec I, Vuong T, Hayashi S, Haegert D, Tornillo L, Terracciano L, et al. A simple and reproducible scoring system for EGFR in colorectal cancer: application to prognosis and prediction of response to preoperative brachytherapy. Br J Cancer (2007) 96:793–800. doi: 10.1038/sj.bjc.6603619
35. Yoshihara K, Shahmoradgoli M, Martínez E, Vegesna R, Kim H, Torres-Garcia W, et al. Inferring tumour purity and stromal and immune cell admixture from expression data. Nat Commun (2013) 4:2612. doi: 10.1038/ncomms3612
36. Rantalainen M. Application of single-cell sequencing in human cancer. Brief Funct Genomics (2018) 17:273–82. doi: 10.1093/bfgp/elx036
37. Hwang B, Lee JH, Bang D. Single-cell RNA sequencing technologies and bioinformatics pipelines. Exp Mol Med (2018) 50:96. doi: 10.1038/s12276-018-0071-8
38. Suvà ML, Tirosh I. Single-Cell RNA Sequencing in Cancer: Lessons Learned and Emerging Challenges. Mol Cell (2019) 75:7–12. doi: 10.1016/j.molcel.2019.05.003
39. Flannery CA, Choe GH, Cooke KM, Fleming AG, Radford CC, Kodaman PH, et al. Insulin Regulates Glycogen Synthesis in Human Endometrial Glands Through Increased GYS2. J Clin Endocrinol Metab (2018) 103:2843–50. doi: 10.1210/jc.2017-01759
40. Chen S-L, Zhang CZ, Liu L-L, Lu S-X, Pan Y-H, Wang C-H, et al. A GYS2/p53 Negative Feedback Loop Restricts Tumor Growth in HBV-Related Hepatocellular Carcinoma. Cancer Res (2019) 79:534–45. doi: 10.1158/0008-5472.CAN-18-2357
41. Zhang R, Gao X, Zuo J, Hu B, Yang J, Zhao J, et al. STMN1 upregulation mediates hepatocellular carcinoma and hepatic stellate cell crosstalk to aggravate cancer by triggering the MET pathway. Cancer Sci (2020) 111:406–17. doi: 10.1111/cas.14262
42. Suzuki K, Watanabe A, Araki K, Yokobori T, Harimoto N, Gantumur D, et al. High STMN1 Expression Is Associated with Tumor Differentiation and Metastasis in Clinical Patients with Pancreatic Cancer. Anticancer Res (2018) 38:939–44. doi: 10.21873/anticanres.12307
43. Bai T, Yokobori T, Altan B, Ide M, Mochiki E, Yanai M, et al. High STMN1 level is associated with chemo-resistance and poor prognosis in gastric cancer patients. Br J Cancer (2017) 116:1177–85. doi: 10.1038/bjc.2017.76
44. Friedrich B, Grönberg H, Landström M, Gullberg M, Bergh A. Differentiation-stage specific expression of oncoprotein 18 in human and rat prostatic adenocarcinoma. Prostate (1995) 27:102–9. doi: 10.1002/pros.2990270207
45. Chakravarthi BVSK, Chandrashekar DS, Agarwal S, Balasubramanya SAH, Pathi SS, Goswami MT, et al. miR-34a Regulates Expression of the Stathmin-1 Oncoprotein and Prostate Cancer Progression. Mol Cancer Research: MCR (2018) 16:1125–37. doi: 10.1158/1541-7786.MCR-17-0230
46. Yamasaki A, Nakayama K, Imaizumi A, Kawamoto M, Fujimura A, Oyama Y, et al. Liprin-α4 as a Possible New Therapeutic Target for Pancreatic Cancer. Anticancer Res (2017) 37:6649–54. doi: 10.21873/anticanres.12122
47. Onishi H, Yamasaki A, Nakamura K, Ichimiya S, Yanai K, Umebayashi M, et al. Liprin-α4 as a New Therapeutic Target for SCLC as an Upstream Mediator of HIF1α. Anticancer Res (2019) 39:1179–84. doi: 10.21873/anticanres.13227
48. Marie KL, Sassano A, Yang HH, Michalowski AM, Michael HT, Guo T, et al. Melanoblast transcriptome analysis reveals pathways promoting melanoma metastasis. Nat Commun (2020) 11:333. doi: 10.1038/s41467-019-14085-2
49. Zhao SG, Chen XF, Wang LG, Yang G, Han DY, Teng L, et al. Increased expression of ABCB6 enhances protoporphyrin IX accumulation and photodynamic effect in human glioma. Ann Surg Oncol (2013) 20:4379–88. doi: 10.1245/s10434-011-2201-6
Keywords: prostate adenocarcinoma, biochemical recurrence, glycolysis, gene signature, The Cancer Genome Atlas
Citation: Xu Z, Xu L, Liu L, Li H, Jin J, Peng M, Huang Y, Xiao H, Li Y and Guan H (2021) A Glycolysis-Related Five-Gene Signature Predicts Biochemical Recurrence-Free Survival in Patients With Prostate Adenocarcinoma. Front. Oncol. 11:625452. doi: 10.3389/fonc.2021.625452
Received: 03 November 2020; Accepted: 22 March 2021;
Published: 19 April 2021.
Edited by:
Marijo Bilusic, National Cancer Institute (NIH), United StatesReviewed by:
Arriana Rieland, Howard University, United StatesLeena Latonen, University of Eastern Finland, Finland
Copyright © 2021 Xu, Xu, Liu, Li, Jin, Peng, Huang, Xiao, Li and Guan. This is an open-access article distributed under the terms of the Creative Commons Attribution License (CC BY). The use, distribution or reproduction in other forums is permitted, provided the original author(s) and the copyright owner(s) are credited and that the original publication in this journal is cited, in accordance with accepted academic practice. No use, distribution or reproduction is permitted which does not comply with these terms.
*Correspondence: Hongyu Guan, Z2hvbmd5QG1haWwuc3lzdS5lZHUuY24=; Yanbing Li, bGl5YkBtYWlsLnN5c3UuZWR1LmNu
†These authors have contributed equally to this work