 Ying Li
 Li Zhu†
- Department of Radiation Oncology, Cancer Hospital of China Medical University, Liaoning Cancer Hospital & Institute, and Key Laboratory of Tumor Radiosensitization and Normal Tissue Radioprotection of Liaoning Province, Shenyang, China
Background: Inflammation-related gene polymorphisms are some of the most important determinants for cancer susceptibility, clinical phenotype diversity, and the response to radiotherapy and chemotherapy. However, the relationship between these polymorphisms and head and neck squamous cell carcinoma (HNSCC) remains unclear. The aim of this study was to investigate the role of inflammation-related gene polymorphisms in the developmental risk and radiotherapy sensitivity of HNSCC.
Methods: The Matrix-Assisted Laser Desorption Ionization Time of Flight (MALDI-TOF) genotyping system was used to genotype 612 individuals from a Chinese population for 28 inflammation-related gene polymorphisms.
Results: The protein kinase B (AKT1) rs1130233 TT, dominance model (CT+TT vs. CC), recessive model (TT vs. CT+CC), and rs2494732 CC genotypes were associated with reduced risk of HNSCC (P=0.014; P=0.041; P=0.043). The polymeric immunoglobulin receptor (PIGR) rs291097 GA, dominance model (GA+AA vs. GG), and rs291102 dominance model (GA+AA vs. GG) were associated with increased risk of HNSCC (P=0.025; P=0.025; P=0.040). The interleukin-4 receptor-α (IL-4RA) rs1801275 AA genotype was significantly correlated with increased radiotherapy sensitivity of HNSCC patients (P=0.030). In addition, age ≤ 60 years, non-smoker status, and normal levels of squamous cell carcinoma antigen (SCC) were found to be associated with increased radiotherapy sensitivity of HNSCC patients (P=0.033; P=0.033; P=0.030).
Conclusion: The AKT1 rs1130233, AKT1 rs2494732, PIGR rs291097, and PIGR rs291102 polymorphisms were significantly related to the risk of HNSCC. The IL-4RA rs1801275 polymorphism, age ≤ 60 years, non-smoker status, and normal levels of SCC were significantly associated with increased radiotherapy sensitivity of HNSCC.
Introduction
Head and neck squamous cell carcinoma (HNSCC) is a general term for a set of different tumors located in the lips, oral cavity, pharynx (nasopharynx, oropharynx and hypopharynx), as well as the larynx, salivary glands, and thyroid glands (1). HNSCC is sixth in the world in overall incidence, and is also a major cancer type that leads to death (1). The initiation and development of HNSCC is a multistep process influenced by various genetic and environmental factors. Tobacco and alcohol consumption are the most classical risk factors associated with its development. At least 75% of HNSCC cases are attributable to the combination of both tobacco and alcohol use (2). However, the role of genetic factors in head and neck squamous cell carcinogenesis is largely unknown.
Single nucleotide polymorphisms (SNPs) are a class of genetic factors that have been implicated in HNSCC susceptibility and determine inter-individual variations in HNSCC risk. Genetic polymorphisms can weaken intrinsic protective mechanisms and increase the damage caused by environmental carcinogens (3). Carriers of susceptible genotypes are at a greater risk of developing cancer than those with resistant genotypes under similar conditions (3). Therefore, genetic factors may play a crucial role in HNSCC risk and clinical outcome.
Inflammation is an important cellular process that can be activated in response to tissue damage, infections, and other cellular stress factors6. There is a relationship between inflammation and the development of many cancers where tumorigenesis was initiated at the site of inflammation (4, 5). Interleukin-1 (IL-1) is a pleiotropic cytokine involved in the initiation of immune and inflammatory responses. The IL-1 gene family has been reported to play a crucial role in the pathogenesis of various cancers (6–9). The interleukin-1 receptor antagonist (IL-1RN) polymorphism is associated with cervical cancer (10). Additionally, there is a pro-inflammatory cytokine haplotype (IL-6 CC, IL-10 GG, TNF-α AA) that is associated with adverse prognosis that may act through an inflammatory-mediated mechanism (11). Furthermore, protein kinase B (AKT1) is an important downstream effector of the gene of phosphate and tension homology deleted on chromosome ten/phosphoinositide 3-kinase/protein kinase B (PTEN/PI3K/AKT) signal transduction pathway. Aberrant expression and genetic variation of the AKT1 gene are suggested to be involved in several types of human cancers, including oral squamous cell carcinoma (OSCC) (12). The AKT1 rs1130214 and rs3803300 polymorphisms were related to OSCC susceptibility in a Chinese Han population (12). The polymeric immunoglobulin receptor (PIGR) 1739C>T is a missense mutation that results in an alanine residue being changed to valine near an endoproteolytic cleavage site. This variant can alter the efficiency of PIGR to release the Epstein–Barr virus immunoglobulin A (IgA-EBV) complex and consequently increase the susceptibility of populations in endemic areas to develop NPC (13). PIGR 8880C>T is also related to NPC susceptibility (14). Additionally, the cyclooxygenase-2 (COX-2) gene (PTGS2) rs5275 variant contributes to NPC risk in a Chinese population (15).
Chronic inflammation promotes genetic and epigenetic aberrations that result in various pathogeneses. These changes may be useful biomarkers in liquid biopsies for early detection and prevention of various cancers (16). To achieve our aim, analysis of candidate genes in a Chinese population was performed to study 28 SNPs in inflammation-related genes that could possibly be associated with the risk of developing HNSCC.
Materials and Methods
Research Design and Study Population
The study design was approved by the Human Ethics Committee of Liaoning Cancer Hospital (Shenyang, China). Each individual provided written informed consent during an epidemiological investigation. Patients were from Liaoning Cancer Hospital and received surgical resection or needle biopsy diagnosis/treatment between 2018 and 2019. The control participants were recruited from health check center in Liaoning Province hospital between 2018 and 2019. The HNSCC patient group and the control group were matched at a 1:2 ratio. All diagnoses of HNSCC patients were based on histopathological examinations. Information regarding smoking habits, alcohol consumption, and family history in cases were acquired by a “face-to-face” questionnaire survey. We collected fasting venous blood from each one and stored the samples at −20°C as serum and clotted cells.
To further evaluate the relationship of polymorphisms with clinicopathological parameters of HNSCC, histology or clinical data were assessed according to World Health Organization criteria. Additionally, tumor-node-metastasis (TNM) staging was performed according to the 8th edition of the International Union Against Cancer (UICC)/American Joint Committee on Cancer (AJCC) (2017) criteria (17).
SNP Selection
A compilation of genes involved in the inflammatory response was conducted on the basis of a published panel of inflammation-associated genes (6, 9, 13–15, 18–44) and the NCBI-Gene website analysis (https://www.ncbi.nlm.nih.gov/gene/). In this study, we selected 16 genes and 28 SNPs for analysis. They are as follows: AKT1 rs130233 and rs2494732; complement C3d receptor 2 (CR2) rs3813946; IL10 rs1800871, rs1800872, and rs1800896; IL1A rs17561; IL1B rs1143627, rs16944, and rs1143634; IL1RN rs419598; IL21R rs2189521; IL4 rs2243250 and rs2227284; IL4RA rs1801275; IL6 rs1800796; PIGR rs291097 and rs291102; tumor necrosis factor (TNF) rs1799964, rs1800629, rs361525, rs1800630 and rs1799724; TNFRSF1A rs4149570; TNFSF7 rs7259857; COX-2 rs5275 and rs20417; B-cell lymphoma-2 (BCL2) rs2279115.
SNP Genotyping
Genomic DNA was extracted from peripheral blood samples obtained from the study participants using the phenol-cholesterol method according to a standard procedure (45). The Matrix-Assisted Laser Desorption Ionization Time of Flight (MALDI-TOF) genotyping system was used to genotype 612 individuals for 28 inflammation-related gene polymorphisms. MALDI-TOF is a medium-to-high-throughput technology platform that takes both sensitivity and specific into account and used mass spectrometry for direct detection (46). Amplification and extension primers were designed by BGI. The charged analytes were detected and measured using time of flight analyzers. During MALDI-TOF analysis, the m/z ratio of an ion was measured by determining the time required for the ion to travel the length of the flight tube (47, 48). Primers sequences are listed in Supplementary Table 1.
Radiosensitivity Analysis
Radiosensitivity analysis was done according to the new response evaluation criteria for solid tumors: Revised response evaluation criteria in solid tumors (RECIST) guideline (version 1.1) (49). Patients who were sensitive to radiation therapy were categorized as either complete response (CR) or partial response (PR). Patients who were not sensitive to radiation therapy were categorized as either progressive disease (PD) or stable disease (SD). Radiosensitivity was assessed one month after radiotherapy, and the results were compared with the MRI image before radiotherapy. The criteria for classification are as follows:
CR: patients had a disappearance of all target lesions and any pathological lymph nodes (whether target or non-target) were required to have a short axis reduction to <10 mm.
PR: patients were required to have at least a 30% decrease in the sum of the diameters of target lesions, using the baseline sum diameters as a reference.
PD: patients were required to have at least a 20% increase in the sum of the diameters of target lesions, using the smallest sum of the study as a reference. In addition to the relative increase of 20%, the sum was also required to demonstrate an absolute increase of at least 5 mm. Patients that had an appearance of one or more new lesions were also categorized as PD.
SD: patients were required to have neither a sufficient level of shrinkage to qualify for PR nor a sufficient amount of increase to qualify for PD. The smallest sum diameters were used as references.
Statistical Analysis
Statistical analysis was performed using SPSS (version 22.0). Adjusted odds ratios (ORs) and 95% confidence intervals (CIs) for the relationships between both SNPs and disease risk were calculated by multivariable logistic regression, with adjustments for gender and age. If stratified by sex, then the age was adjusted; if stratified by age, then the sex was adjusted. Chi-squared tests were used to assess the correlation between different genotypes and the clinicopathological parameters and radiosensitivity of HNSCC patients.
Results
Baseline Patient Characteristics
To analyze the risk of HNSCC, the study subjects included 211 patients with HNSCC and 401 age- and sex-matched control subjects. The comparisons of baseline characteristics between cases and controls are shown in Table 1. There was a significant difference in both age and sex distribution between the HNSCC group and the control group. The overall mean age and mean age of menarche differed significantly between cases and controls (both P<0.001). In cases, the mean menopausal age was 58.00 years and only a small proportion of cases had a family history of cancer (15.2%). In cases with invasion depth, 55.2% and 44.8% of cases were in T1-2 and T3-4, respectively. Tumor stages I-II (23.7%) and III-IV (76.3%) accounted for the majority of HNSCC cases, whereas 69.6% of cases had positive lymph nodes and 5.9% of cases had metastasis (Table 1).
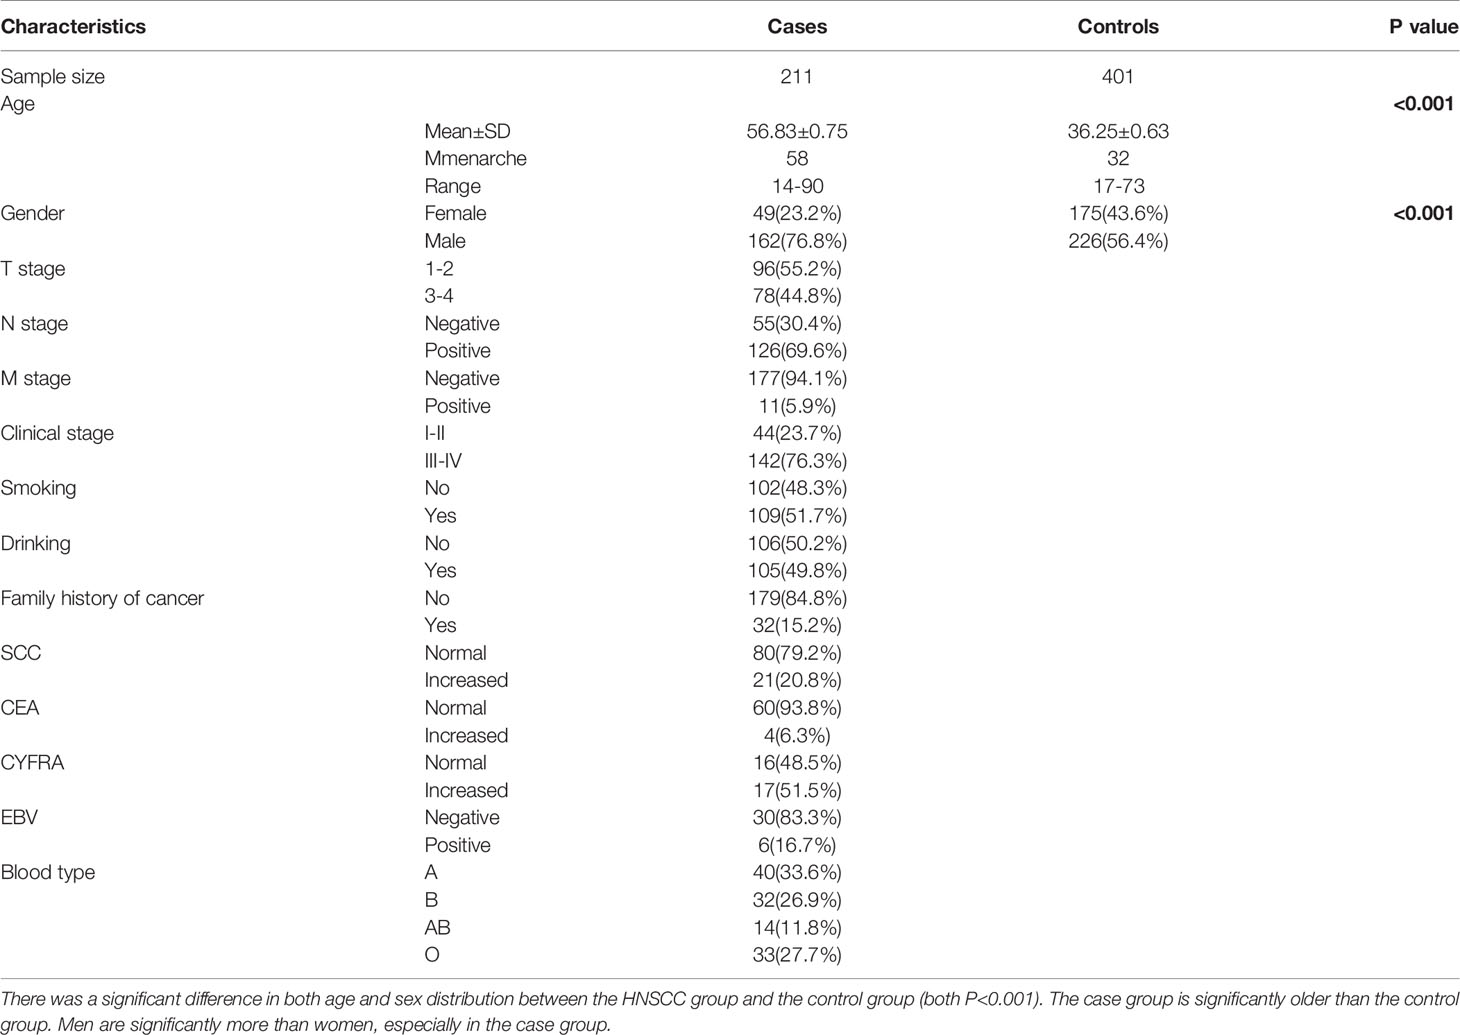
Table 1 The baseline characteristics of the objects.
Association of 28 Inflammation-Associated Gene SNPs With HNSCC Risk
Multivariable logistic regression was used to investigate the association of 28 inflammation-associated gene SNPs with HNSCC risk. The results indicated that the AKT1 rs1130233 and rs2494732 SNPs, as well as the PIGR rs291097 and rs291102 SNPs, had a significant association with HNSCC risk progression (Table 2). We also found that the carriers of the AKT1 rs1130233 TT genotype, dominance model (CT+TT vs. CC), recessive model (TT vs. CT+CC), or the AKT1 rs2494732 CC genotype had reduced risk of HNSCC (P<0.05), whereas those with the PIGR rs291097 GA genotype, dominance model (GA+ AA vs. GG), or PIGR rs291102 dominance model (GA+ AA vs. GG) had an increased risk of HNSCC (P<0.05). However, we found no significant differences with the other 24 SNPs in HNSCC risk progression (Table 2).
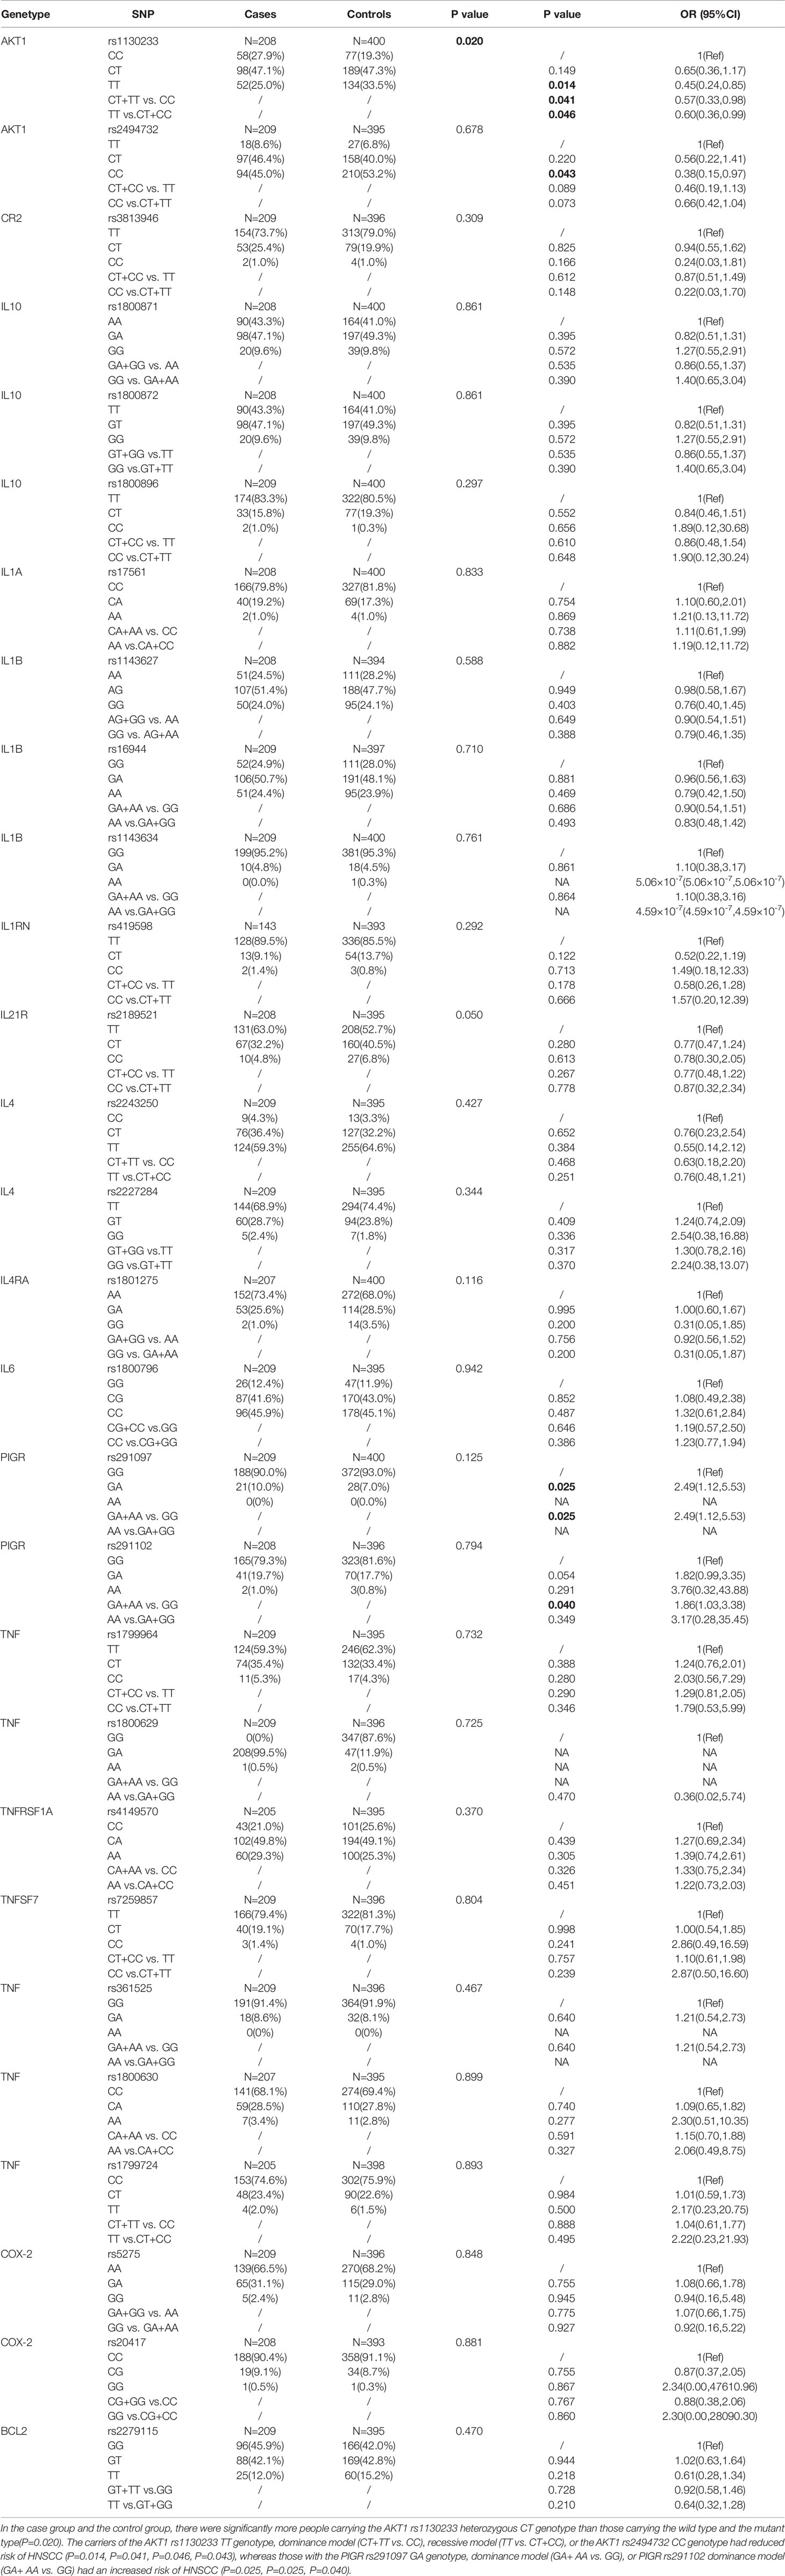
Table 2 Association of 28 inflammation-associated gene SNPs with HNSCC risk.
Stratified Analysis of the Association of 28 Inflammation-Associated Gene SNPs With HNSCC Risk
In stratified analyses, we found that the IL-1RN rs419598 TT genotype and dominance model (CT+TT vs. CC) conferred a 0.12-fold and 0.16-fold reduction in HNSCC progression, respectively, in individuals older than age 60. However, in those age 60 or younger, the AKT1 rs1130233 TT genotype and dominance model (CT+TT vs. CC), IL-21R rs2189521 CT genotype and dominance model (CT+ CC vs. TT), and BCL2 rs2279115 recessive model (TT vs. GT+GG) conferred a 0.48-fold, 0.57-fold, 0.61-fold, 0.60-fold, and 0.49-fold reduction in HNSCC progression, respectively. In addition, in men, the AKT1 rs1130233 TT genotype and dominance model (CT+TT vs. CC) and the BCL2 rs2279115 TT genotype and recessive model (TT vs. GT+GG) conferred a 0.37-fold, 0.43-fold, 0.37-fold, and 0.41-fold reduction in HNSCC progression, respectively. In women, the IL-21R rs2189521 CT genotype and dominance model (CT+TT vs. TT) conferred a 0.39-fold and 0.43-fold reduction in HNSCC progression, respectively. However, the PIGR rs291097 GA genotype and dominance model (GA+AA vs. GG) and the TNF rs1800630 AA genotype conferred a 3.43-fold, 3.43-fold, and 9.42-fold increase in HNSCC progression, respectively. All these stratified analysis results are shown in Table 3.

Table 3 Stratified analysis of the association of 28 inflammation-associated gene SNPs with HNSCC risk.
Association of 28 Inflammation-Associated Gene SNPs With Radiotherapy Sensitivity of HNSCC Patients
We further analyzed the correlation between 28 SNPs and radiotherapy sensitivity of HNSCC individuals. We found that, compared with those with other genotypes, HNSCC patients carrying the IL-4RA rs1801275 AA wild-type genotype (40.9%) were more sensitive to radiotherapy (Table 4). There were no significant differences observed in the correlation analysis between the other 27 SNPs and radiotherapy sensitivity in HNSCC patients.
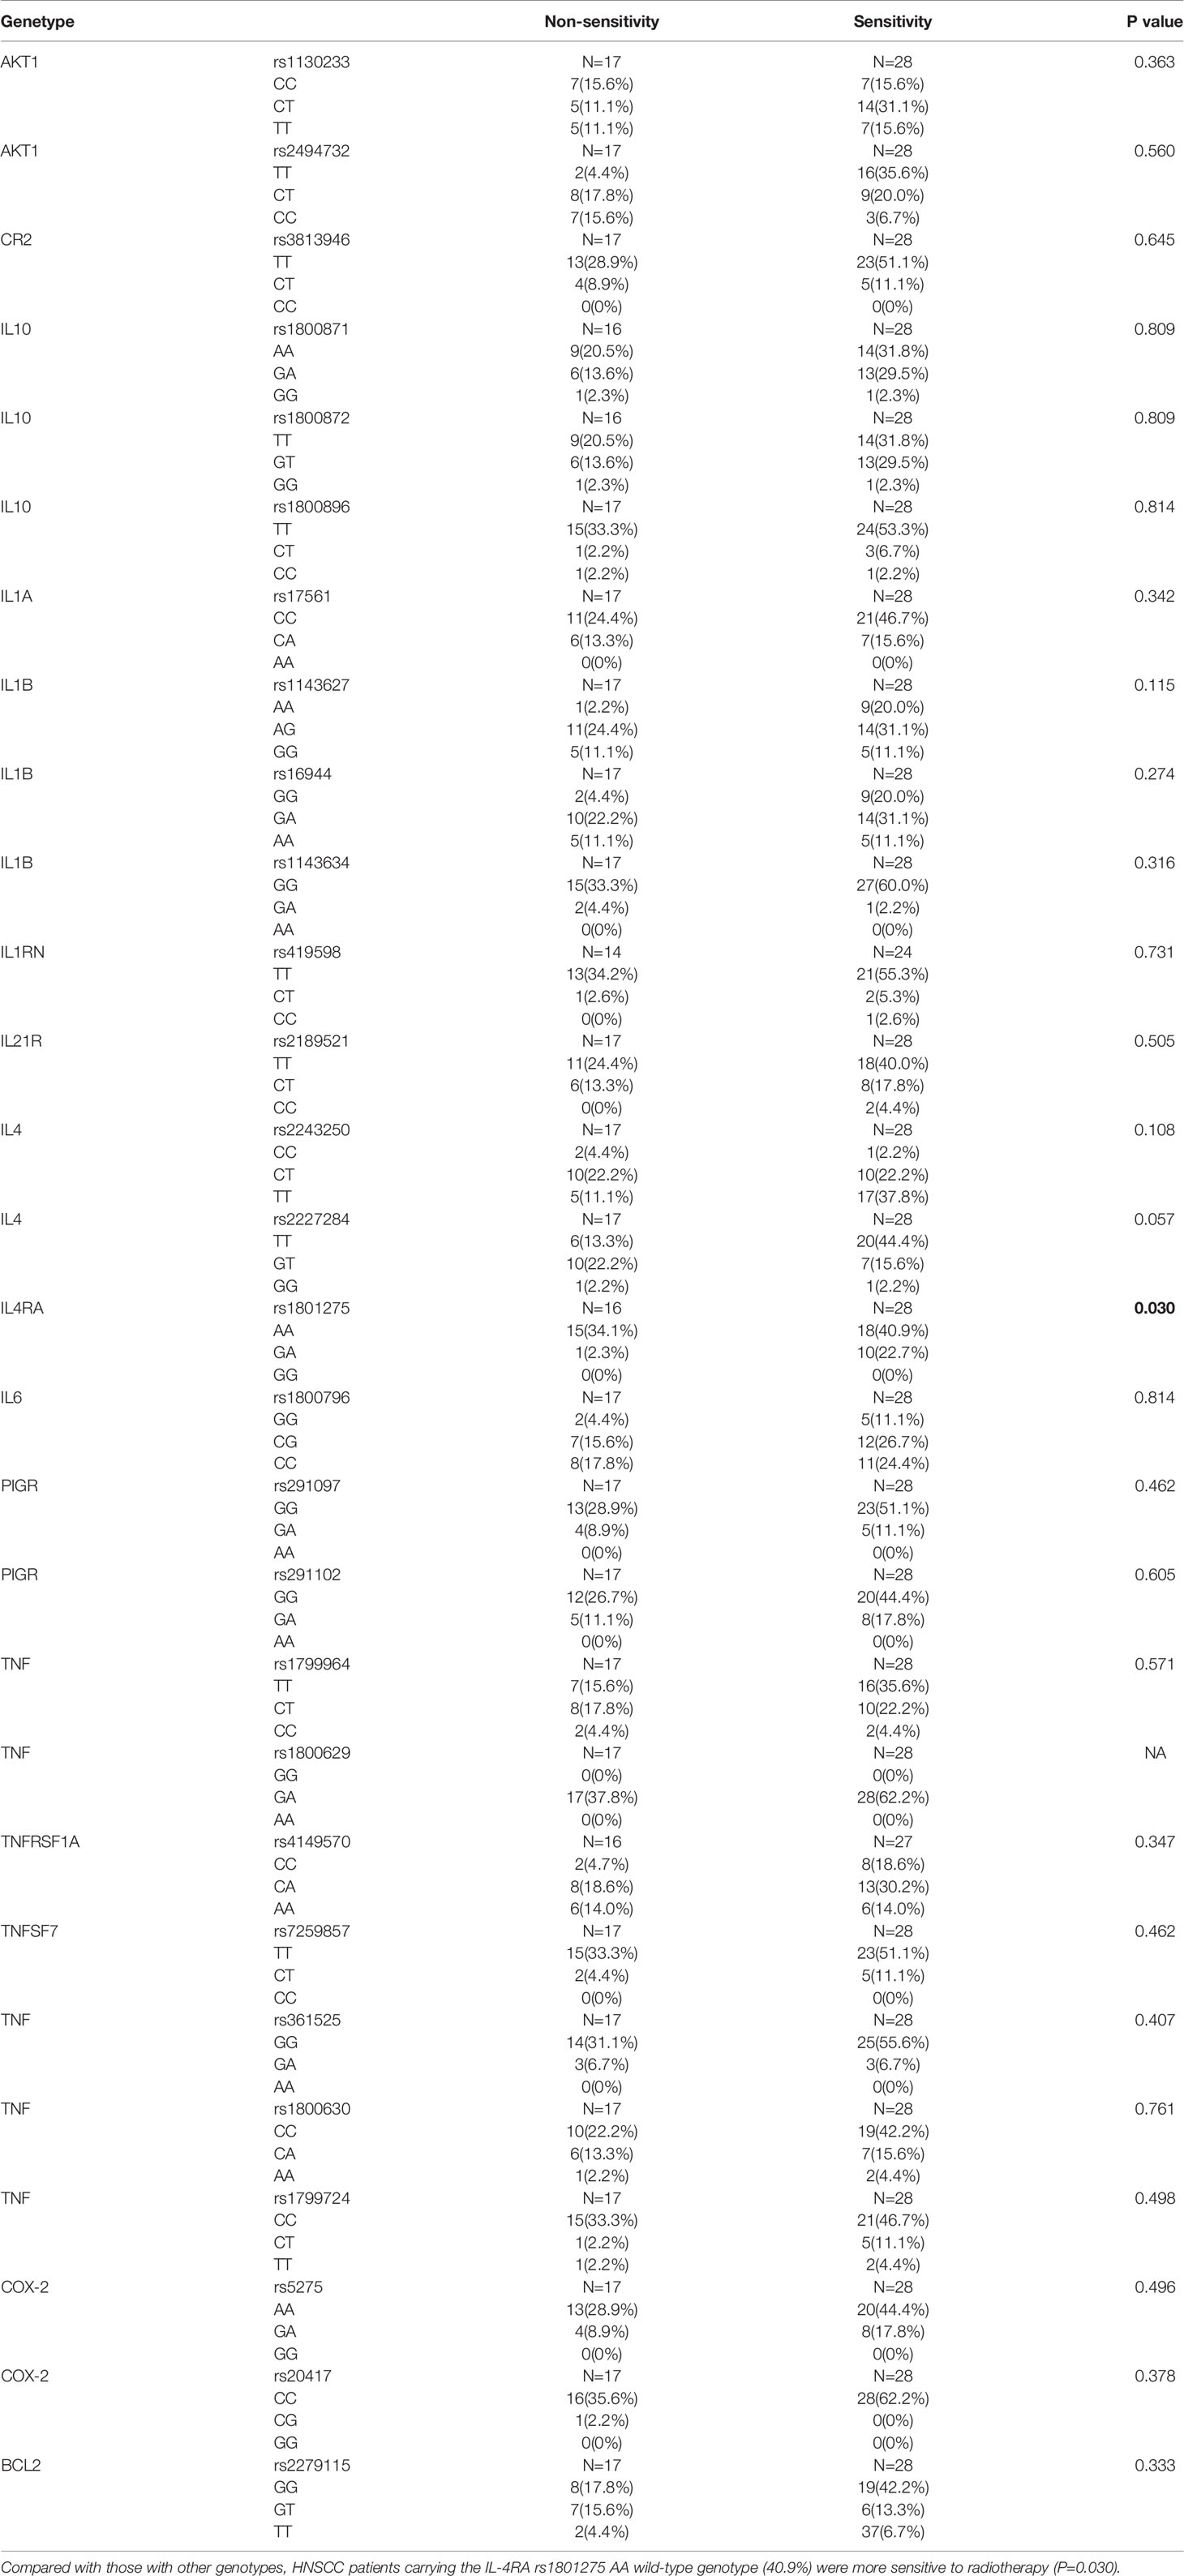
Table 4 Association of 28 inflammation-associated gene SNPs with radiotherapy sensitivity of HNSCC patients.
Association of Clinicopathological Parameters With Radiotherapy Sensitivity of HNSCC Patients
We further analyzed the potential correlations between clinicopathological parameters and radiotherapy sensitivity of HNSCC patients. We found that age ≤ 60 years, non-smoker status, and normal levels of SCC were associated with increased radiotherapy sensitivity of HNSCC patients (P=0.033; P=0.033; P=0.030, respectively) (Table 5). There were no significant differences observed in the correlation analysis between other clinicopathological parameters and radiotherapy sensitivity in HNSCC patients.
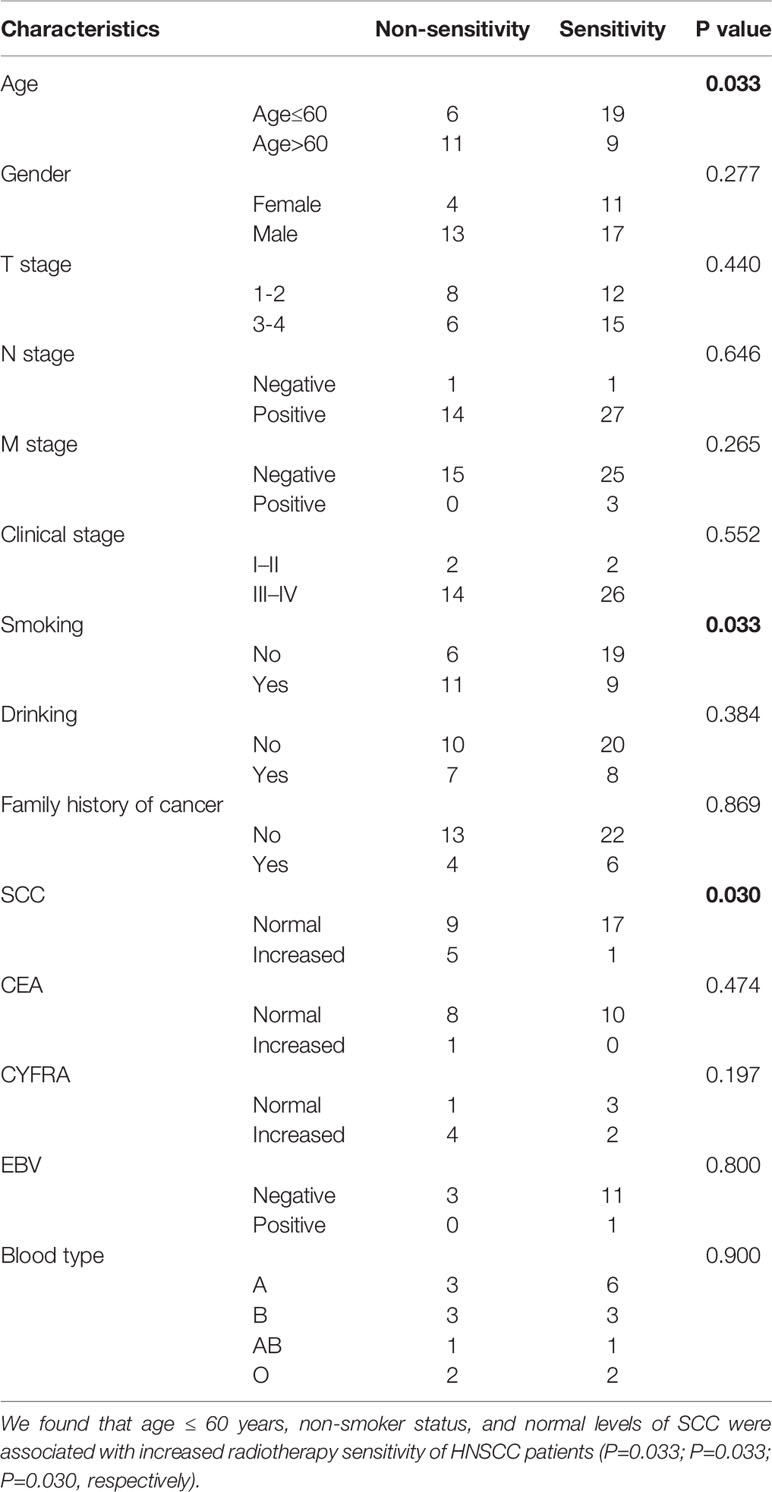
Table 5 Association of clinicopathological parameters with radiotherapy sensitivity of HNSCC patients.
Association of 28 Inflammation-Associated Gene SNPs With Clinicopathological Parameters of HNSCC Patients
Among the SNPs related to the risk of HNSCC, the heterozygous and dominant model of AKT1 rs1130233 were significantly related to lymph node metastasis and non-distant metastasis. The recessive model of AKT1 rs2494732 was significantly related to male sex, stage III-IV disease, and normal carcinoembryonic antigen (CEA) levels. The IL-1RN rs419598 wild-type genotype was significantly related to stage III-IV disease, the PIGR rs291102 wild-type genotype was significantly related to normal levels of cytokeratin fragment 19 (CYFRA), and the BCL2 rs2279115 wild-type genotype was significantly related to lymph node metastasis. In addition, we found that the IL-1B rs1143627 recessive model was significantly related to normal levels of SCC, the IL-4 rs2243250 mutant, dominant model, and recessive model were significantly related to lymph node metastasis, and the IL-4 rs2227284 dominant model was significantly related to lymph node metastasis. Furthermore, the IL-6 rs1800796 heterozygous genotype and the absence of distant metastases were significantly related, whereas the mutant and recessive model were significantly related to lymph node metastasis. The IL-6 rs1800796 mutant were related to no family history of cancer and the recessive model were significantly related to stage III-IV disease. The TNFRSF1A rs414570 dominant model and recessive model were significantly related to the absence of distant metastases. The TNF rs361525 wild-type genotype was significantly related to stage III-IV disease and the COX-2 rs20417 wild-type genotype was significantly related to lymph node metastasis. The other SNPs showed no significant correlations with clinicopathological parameters. The results of association of significant inflammation-associated gene SNPs with clinicopathological parameters of HNSCC patients are shown in Table 6, and all results are shown in Supplementary Table 2.
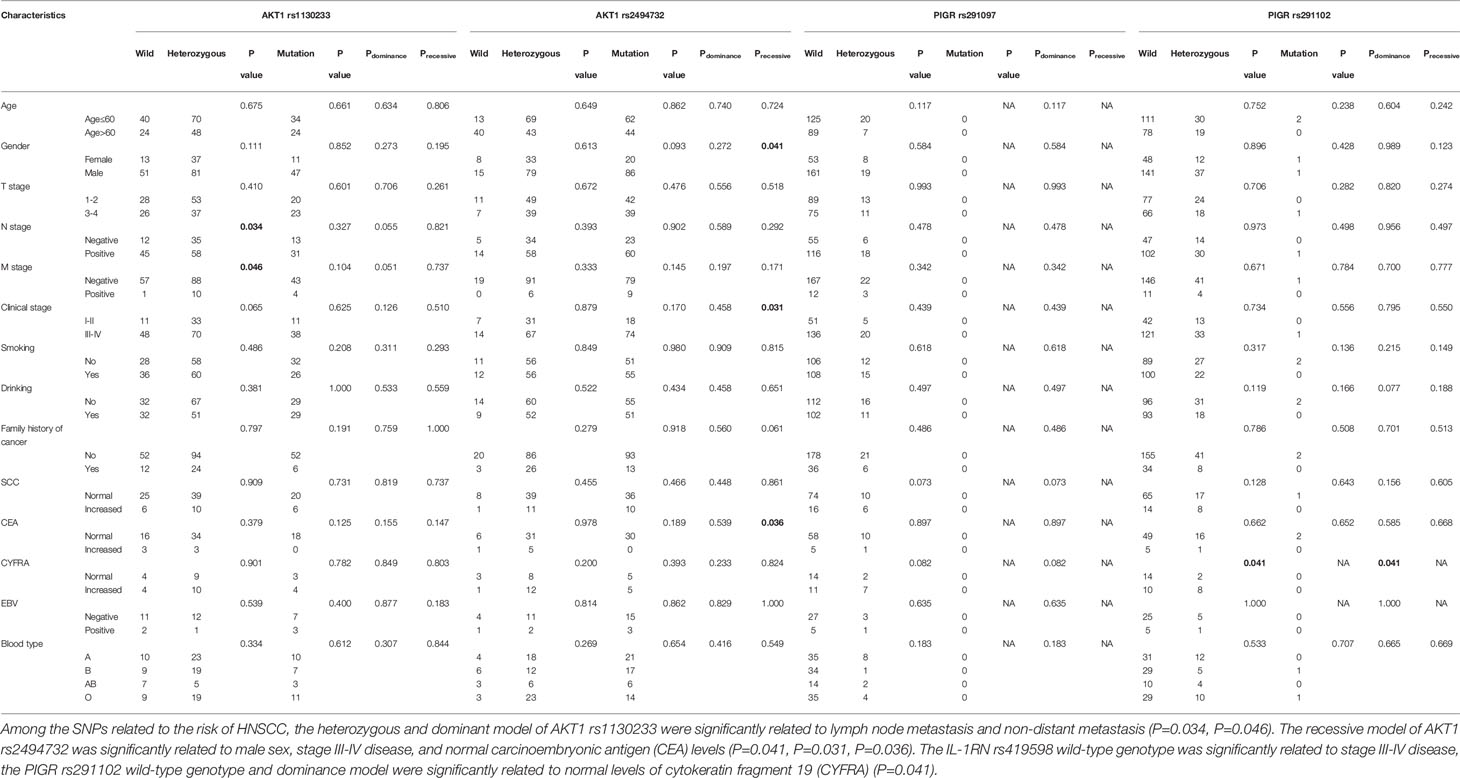
Table 6 Association of significant inflammation-associated gene SNPs with clinicopathological parameters of HNSCC patients.
Discussion
In this study, we report for the first time an association of 28 polymorphisms with HNSCC risk and radiotherapy sensitivity in a population of individuals from the Liaoning Province of China. We found that carriers of the AKT1 rs1130233 TT genotype, dominance model (CT+TT vs. CC), recessive model (TT vs. CT+CC), and the AKT1 rs2494732 CC genotype had a reduced risk of HNSCC (P<0.05), whereas those with the PIGR rs291097 GA genotype, dominance model (GA+ AA vs. GG), and PIGR rs291102 dominance model (GA+ AA vs. GG) showed increased risk of HNSCC (P<0.05). In addition, we found that the IL-1RN rs419598, IL-21R rs2189521, and BCL2 rs2279115 genotypes were associated with reduced HNSCC risk, while the TNF rs1800630 genotype was associated with increased HNSCC risk. These findings provide experimental evidence to support these genes or SNPs as potential biomarkers of specific types of HNSCC.
It is estimated that infectious diseases and chronic inflammation account for approximately 25% of cancer-causing factors (16). Inflammation may act at multiple stages of disease development to disrupt tissue homeostasis, induce aberrant proliferative responses, modulate the tumor microenvironment, and compromise immune surveillance (50–52). Inflammatory cells and related signaling molecules can also be used by tumors to facilitate progression and metastasis by generating a favorable microenvironment, as well as promoting genetic instability and angiogenesis (53). Inflammatory physiological changes, such as oxidative stress, exert downstream genotoxic effects (54). When sustained over extended periods, these changes promote the emergence of cancer-initiating mutations (55). Genetic variations in inflammation-related genes potentially complement prediction of HNSCC risk. Gene polymorphisms are a common genetic variant. The most common polymorphic form is a base difference, termed a single nucleotide polymorphism (3).
AKT, the v-AKT murine thymoma viral oncogene homolog, maps to human chromosome 14q32.32 and encodes a 56-kDa protein, comprising 480 amino acids (56). AKT is an important effector of the PI3K/AKT/MTOR signaling pathway, and genetic mutations or abnormal protein expression can alter a variety of cellular processes including migration, proliferation, growth, and survival (57). AKT SNPs are reported to be associated with susceptibility to various cancer types, such as nasopharyngeal carcinoma (NPC), OSCC, non-small cell lung cancer, pancreatic ductal adenocarcinoma, and GC via effects on protein expression and transcriptional activity (12, 36, 56, 58–60). Zhang et al. reported that the AKT1 rs1130233 and rs2494732 AA genotypes were associated with a significantly increased susceptibility to NPC risk in a Chinese population (36). Another study also reported an association between the AKT1 polymorphism and cancer metastasis (58). Collectively, these observations indicate that our findings of associations existing between AKT1 SNPs and the risk of HNSCC are biologically relevant.
PIGR is a member of the immunoglobulin superfamily and transports immunoglobulin A (IgA) onto mucosal surfaces (61). PIGR has been described as a putative cancer biomarker in a few studies on various cancers, the majority of which indicate an association between low PIGR expression and more aggressive disease (61). Individuals carrying the PIGR rs291097 T allele have a higher risk of NPC in Guangdong Province, China (14). The PIGR rs291102 genotype is a missense mutation changing alanine to valine near an endoproteolytic cleavage site. This variant could alter the efficiency of PIGR to release the IgA-EBV complex and consequently increase the susceptibility of populations in endemic areas to develop NPC (13). Chen et al. reported that the risk of HNSCC may be associated with SNPs in the BCL2 promoter region (43). Some scholars consider that TNF-α SNPs (rs1800629, rs1799724, rs1800630, and rs1799964) may individually or, more likely, jointly affect individual susceptibility to HPV16-associated OSCC, particularly squamous cell carcinoma of the oropharynx (SCCOP) in never smokers (38). Our results are similar to the abovementioned findings, which suggests that inflammatory-related gene SNPs are closely related to the risk of HNSCC in different populations and different cases.
Following stratified analyses, we found that the IL-1RN rs419598 TT genotype and dominance model (CT+ CC vs. TT) were associated with reduced HNSCC risk in individuals older than 60 years of age. However, in those age 60 and younger, the AKT1 rs1130233 TT genotype and dominance model (CT+TT vs. CC), the IL-21R rs2189521 CT genotype and dominance model (CT+ CC vs. TT), and the BCL2 rs2279115 recessive model (TT vs. GT+GG) were associated with reduced HNSCC risk. In addition, in men, the AKT1 rs1130233 TT genotype and dominance model (CT+TT vs. CC) and the BCL2 rs2279115 TT genotype and recessive model (TT vs. GT+GG) were associated with reduced HNSCC risk. In women, however, the IL-21R rs2189521 CT genotype and dominance model (CT+ CC vs. TT) were associated with reduced HNSCC risk. Additionally, the PIGR rs291097 GA genotype and dominance model (GA+AA vs. GG) and the TNF rs1800630 AA genotype were associated with increased HNSCC risk in women. These genes are all inflammatory-related genes, and these results suggest that inflammatory-related gene SNPs are closely related to the risk of HNSCC patients.
From our research data, the correlation between various genotypes and the risk of HNSCC may be related to the differences in the distribution of different clinicopathological parameters. We also compared the genotype distribution of these polymorphisms in HNSCC patients with different clinicopathological parameters. We found that the heterozygous and dominant models of the AKT1 rs1130233 polymorphism were significantly related to non-distant metastasis. This phenomenon may indicate that the carrier of AKT1 rs1130233 dominance model has a low risk of cancer and is not prone to distant metastasis, which may indicate they have a long survival time. The IL-1RN rs419598 wild-type genotype was significantly related to stage III-IV disease, the PIGR rs291102 wild-type genotype was significantly related to normal levels of CYFRA, and the BCL2 rs2279115 wild-type genotype was significantly related to lymph node metastasis. These results suggest that individuals with the IL-1RN rs419598, or BCL2 rs2279115 polymorphisms showed a significant reduction in HNSCC risk progression, whereas those with the PIGR rs291102 dominance model had increased HNSCC risk. In addition, we found that different genotypes of some SNPs are significantly correlated with different clinicopathological parameters, such as IL-1B rs1143627, IL-4 rs2243250, and IL-4 rs2227284, IL-6 rs1800796, TNFRSF1A rs414570, TNF rs361525, COX-2 rs20417, whereas other SNPs showed no significant correlations with clinicopathological parameters in our data.
Recently, studies on the relationships between genetic polymorphisms and radiotherapy sensitivity have been reported. For example, gene polymorphisms of Wnt/beta-catenin may be novel prognostic factors for NPC patients treated with RT (62). The authors observed that the catenin beta 1 gene (CTNNB1) rs1880481 and rs3864004 polymorphisms, as well as the glycogen synthase kinase 3 beta gene (GSK3beta) rs3755557 polymorphism, were significantly associated with a poorer efficacy of RT in NPC patients (63). However, the relationship between SNPs in inflammation-related genes and the risk of HNSCC has not been reported. In this study, we found that HNSCC patients carrying the IL-4RA rs1801275 AA wild-type genotype were more sensitive to radiotherapy compared with other patients. We also analyzed the relationships between clinicopathological parameters and radiotherapy sensitivity. Age ≤ 60 years, non-smoker status, and normal levels of SCC were found to be associated with increased radiotherapy sensitivity of HNSCC patients. We expect that these results may help guide radiotherapy and concurrent radiotherapy and chemotherapy treatment plans. However, this was only a correlation study, and the support of basic science experiments is necessary.
In our study, the 28 inflammation-related gene polymorphisms we screened were previously reported in various cancers, and several SNPs have been reported in HNSCC (6, 13, 31, 34–36, 39, 42, 64, 65). Drobin et al reported the correlation and possible mechanism of VEGFA rs69947 with breast cancer and HNSCC radiotherapy sensitivity. The authors proposed that this SNP may affect protein expression, which would impact biological processes such as blood vessel growth, inflammatory cell infiltration, the immune response, DNA repair, oxidative stress and hypoxia (66). These changes may underlie the differences in correlation and sensitivity among patients. TNF-α is a cytokine that is secreted during the inflammatory process accompanying RTH and during cancer development. An SNP in the TNF-α promoter region can potentially affect the function or expression of this cytokine and thus modulate the risk of occurrence and intensity of OM and shortening of overall survival (30). To explore these possibilities, further studies are required using a larger sample size and additional in vitro and in vivo experimental analyses.
The present study has some limitations. First, the sample size was relatively small, especially for the HNSCC case group. Our results need further confirmation in larger populations. Second, only HNSCC risk was analyzed in this study. Analysis of prognostic parameters, such as overall survival and progression-free survival, is also warranted. Last, functional experiments are required to elucidate the underlying disease mechanism responsible for our observations.
In summary, we found that the AKT1 rs1130233 TT and dominance model (CT+TT vs. CC) genotypes, as well as the rs2494732 CC genotype, were associated with reduced risk of HNSCC. The PIGR rs291097 GA and dominance model (GA+AA vs. GG) genotypes, as well as the rs291102 dominance model (GA+AA vs. GG), were associated with increased risk of HNSCC. We also found that the IL-4RA rs1801275 AA genotype was significantly correlated with increased radiotherapy sensitivity of HNSCC patients. In addition, age ≤ 60 years, non-smoker status, and normal levels of SCC were found to be associated with increased radiotherapy sensitivity of HNSCC patients. We expect that future data from a larger population sample will support our results and be used to guide the comprehensive treatment and prognosis of HNSCC patients. Further investigation is needed to elucidate the molecular mechanisms governing our findings.
Data Availability Statement
The data that support the findings of our study have been deposited into CNGB Sequence Archive (CNSA) of China National GeneBank DataBase (CNGBdb) with accession number CNP0001819.
Ethics Statement
The studies involving human participants were reviewed and approved by the Human Ethics Committee of Liaoning Cancer Hospital. Written informed consent to participate in this study was provided by the participants’ legal guardian/next of kin.
Author Contributions
YL and XL designed the study. HY was responsible for case screening. XK, LC, YS, and AM treated HNSCC patients. YZ was mainly for clinical information collection. YL and LZ processed, analysed data, and wrote the paper. All authors contributed to the article and approved the submitted version.
Funding
This work was supported by grants from the Doctoral Science and Technology Research Startup Fund Project of Liaoning Province of China (2019-BS-275), the Science and Technology Fund Project of Liaoning Province of China (20180550318), and Key Laborotary of Tumor Radiosensitization and Normal Tissue Radioprotection of Liaoning Province (2018225102).
Conflict of Interest
The authors declare that the research was conducted in the absence of any commercial or financial relationships that could be construed as a potential conflict of interest.
Supplementary Material
The Supplementary Material for this article can be found online at: https://www.frontiersin.org/articles/10.3389/fonc.2021.651632/full#supplementary-material
References
1. Fernandez-Mateos J, Seijas-Tamayo R, Klain JCA, Borgonon MP, Perez-Ruiz E, Mesia R, et al. Analysis of Autophagy Gene Polymorphisms in Spanish Patients With Head and Neck Squamous Cell Carcinoma. Sci Rep (2017) 7:6887. doi: 10.1038/s41598-017-07270-0
2. Hashibe M, Brennan P, Benhamou S, Castellsague X, Chen C, Curado MP, et al. Alcohol Drinking in Never Users of Tobacco, Cigarette Smoking in Never Drinkers, and the Risk of Head and Neck Cancer: Pooled Analysis in the International Head and Neck Cancer Epidemiology Consortium. J Natl Cancer Inst (2007) 99:777–89. doi: 10.1038/bdj.2007.638
3. Piao Y, Li Y, Xu Q, Liu JW, Xing CZ, Xie XD, et al. Association of MTOR and AKT Gene Polymorphisms With Susceptibility and Survival of Gastric Cancer. PloS One (2015) 10:e0136447. doi: 10.1371/journal.pone.0136447
4. Leibovici D, Grossman HB, Dinney CP, Millikan RE, Lerner S, Wang Y, et al. Polymorphisms in Inflammation Genes and Bladder Cancer: From Initiation to Recurrence, Progression, and Survival. J Clin Oncol (2005) 23:5746–56. doi: 10.1200/JCO.2005.01.598
5. Lu H, Ouyang W, Huang C. Inflammation, a Key Event in Cancer Development. Mol Cancer Res (2006) 4:221–33. doi: 10.1158/1541-7786.MCR-05-0261
6. Oh SS, Chang SC, Cai L, Cordon-Cardo C, Ding BG, Greenland S, et al. Single Nucleotide Polymorphisms of 8 Inflammation-Related Genes and Their Associations With Smoking-Related Cancers. Int J Cancer (2010) 127:2169–82. doi: 10.1002/ijc.25214
7. St John MA, Dohadwala M, Luo J, Wang G, Lee G, Shih H, et al. Proinflammatory Mediators Upregulate Snail in Head and Neck Squamous Cell Carcinoma. Clin Cancer Res (2009) 15:6018–27. doi: 10.1158/1078-0432.CCR-09-0011
8. Zhu Y, Xu Y, Wei Y, Liang W, Liao M, Zhang L. Association of IL-1B Gene Polymorphisms With Nasopharyngeal Carcinoma in a Chinese Population. Clin Oncol (R Coll Radiol) (2008) 20:207–11. doi: 10.1016/j.clon.2008.01.003
9. Kietthubthew S, Wickliffe J, Sriplung H, Ishida T, Chonmaitree T, Au WW. Association of Polymorphisms in Proinflammatory Cytokine Genes With the Development of Oral Cancer in Southern Thailand. Int J Hyg Environ Health (2010) 213:146–52. doi: 10.1016/j.ijheh.2010.01.002
10. Tamandani DM, Sobti RC, Shekari M, Kaur S, Huria A. Impact of Polymorphism in IL-1RA Gene on the Risk of Cervical Cancer. Arch Gynecol Obstet (2008) 277:527–33. doi: 10.1007/s00404-007-0504-4
11. Deans C, Rose-Zerilli M, Wigmore S, Ross J, Howell M, Jackson A, et al. Host Cytokine Genotype is Related to Adverse Prognosis and Systemic Inflammation in Gastro-Oesophageal Cancer. Ann Surg Oncol (2007) 14:329–39. doi: 10.1245/s10434-006-9122-9
12. Wang Y, Lin L, Xu H, Li T, Zhou Y, Dan H, et al. Genetic Variants in AKT1 Gene Were Associated With Risk and Survival of OSCC in Chinese Han Population. J Oral Pathol Med (2015) 44:45–50. doi: 10.1111/jop.12211
13. Hirunsatit R, Kongruttanachok N, Shotelersuk K, Supiyaphun P, Voravud N, Sakuntabhai A, et al. Polymeric Immunoglobulin Receptor Polymorphisms and Risk of Nasopharyngeal Cancer. BMC Genet (2003) 4:3. doi: 10.1186/1471-2156-4-3
14. Fan Q, Jia WH, Zhang RH, Yu XJ, Chen LZ, Feng QS, et al. Correlation of Polymeric Immunoglobulin Receptor Gene Polymorphisms to Susceptibility of Nasopharyngeal Carcinoma. Ai Zheng (2005) 24:915–8.
15. Fu J, Li Z, Li N. The Association Between COX-2 Gene Rs5275 Polymorphism and Nasopharyngeal Carcinoma Risk. Pathol Res Pract (2018) 214:1579–82. doi: 10.1016/j.prp.2018.07.028
16. Murata M. Inflammation and Cancer. Environ Health Prev Med (2018) 23:50. doi: 10.1186/s12199-018-0740-1
17. Huang SH, O’Sullivan B. Overview of the 8th Edition TNM Classification for Head and Neck Cancer. Curr Treat Options Oncol (2017) 18:40. doi: 10.1007/s11864-017-0484-y
18. Powrozek T, Mlak R, Brzozowska A, Mazurek M, Golebiowski P, Malecka-Massalska T. Relationship Between TNF-Alpha -1031T/C Gene Polymorphism, Plasma Level of TNF-Alpha, and Risk of Cachexia in Head and Neck Cancer Patients. J Cancer Res Clin Oncol (2018) 144:1423–34. doi: 10.1007/s00432-018-2679-4
19. Cui XB, Wang DD, Zhang HY, Li TT, Jin TT, Peng H, et al. Tumor Necrosis Factor-Alpha Gene 308G/a Polymorphism is Not Associated With Esophageal Squamous Cell Carcinoma Risk in Kazakh Patients. Int J Clin Exp Pathol (2015) 8:9293–9.
20. Singh PK, Bogra J, Chandra G, Ahmad MK, Gupta R, Kumar V, et al. Association of TNF-Alpha (-238 and -308) Promoter Polymorphisms With Susceptibility of Oral Squamous Cell Carcinoma in North Indian Population. Cancer Biomark (2015) 15:125–31. doi: 10.3233/CBM-140444
21. Hsu HJ, Yang YH, Shieh TY, Chen CH, Kao YH, Yang CF, et al. Role of Cytokine Gene (Interferon-Gamma, Transforming Growth Factor-Beta1, Tumor Necrosis Factor-Alpha, Interleukin-6, and Interleukin-10) Polymorphisms in the Risk of Oral Precancerous Lesions in Taiwanese. Kaohsiung J Med Sci (2014) 30:551–8. doi: 10.1016/j.kjms.2014.09.003
22. Zhang C, Sturgis EM, Zheng H, Zafereo ME, Wei Q, Li G. TNF-Alpha Promoter Polymorphisms and Risk of Recurrence in Patients With Squamous Cell Carcinomas of the Nonoropharynx. Int J Cancer (2014) 135:1615–24. doi: 10.1002/ijc.28793
23. Mendes SO, dos Santos M, Peterle GT, Maia Lde L, Stur E, Agostini LP, et al. HIF-1alpha Expression Profile in Intratumoral and Peritumoral Inflammatory Cells as a Prognostic Marker for Squamous Cell Carcinoma of the Oral Cavity. PloS One (2014) 9:e84923. doi: 10.1371/journal.pone.0084923
24. Al-toub M, Almusa A, Almajed M, Al-Nbaheen M, Kassem M, Aldahmash A, et al. Pleiotropic Effects of Cancer Cells’ Secreted Factors on Human Stromal (Mesenchymal) Stem Cells. Stem Cell Res Ther (2013) 4:114. doi: 10.1186/scrt325
25. de Jesus GP, Ribeiro FA, de Moura CF, Gollucke AP, Oshima CT, Ribeiro DA. Anti-Tumor Activity of Grape Juice Concentrate in the Rat Tongue Two-Stage Initiation-Promotion Protocol Induced by 4-Nitroquinoline 1-Oxide. Toxicol Mech Methods (2014) 24:276–83. doi: 10.3109/15376516.2014.881944
26. Erdogan M, Karadeniz M, Ozbek M, Ozgen AG, Berdeli A. Interleukin-10 Gene Polymorphism in Patients With Papillary Thyroid Cancer in Turkish Population. J Endocrinol Invest (2008) 31:750–4. doi: 10.1007/BF03349252
27. Chiang SL, Chen PH, Lee CH, Ko AM, Lee KW, Lin YC, et al. Up-Regulation of Inflammatory Signalings by Areca Nut Extract and Role of Cyclooxygenase-2 -1195G>a Polymorphism Reveal Risk of Oral Cancer. Cancer Res (2008) 68:8489–98. doi: 10.1158/0008-5472.CAN-08-0823
28. de Luis DA, Sagrado MG, Vallejo LA, Carcedo LM, Izaola O, Cuellar L, et al. Influence of G308A Polymorphism of Tumor Necrosis Factor-Alpha Gene on Inflammatory Markers in Postsurgical Head and Neck Cancer Patients With Early Enteral Nutrition. Nutrition (2007) 23:529–32. doi: 10.1016/j.nut.2007.04.011
29. Pu X, Wang L, Chang JY, Hildebrandt MA, Ye Y, Lu C, et al. Inflammation-Related Genetic Variants Predict Toxicity Following Definitive Radiotherapy for Lung Cancer. Clin Pharmacol Ther (2014) 96:609–15. doi: 10.1038/clpt.2014.154
30. Mlak R, Powrozek T, Brzozowska A, Homa-Mlak I, Mazurek M, Golebiowski P, et al. The Relationship Between TNF-Alpha Gene Promoter Polymorphism (- 1211 T > C), the Plasma Concentration of TNF-Alpha, and Risk of Oral Mucositis and Shortening of Overall Survival in Patients Subjected to Intensity-Modulated Radiation Therapy Due to Head and Neck Cancer. Support Care Cancer (2019) 28(2):531–40. doi: 10.1007/s00520-019-04838-6
31. Wu MY, Huang SJ, Yang F, Qin XT, Liu D, Ding Y, et al. Detection of Nasopharyngeal Carcinoma Susceptibility With Single Nucleotide Polymorphism Analysis Using Next-Generation Sequencing Technology. Oncotarget (2017) 8:52708–23. doi: 10.18632/oncotarget.17085
32. Brzozowska A, Powrozek T, Homa-Mlak I, Mlak R, Ciesielka M, Golebiowski P, et al. Polymorphism of Promoter Region of TNFRSF1A Gene (-610 T > G) as a Novel Predictive Factor for Radiotherapy Induced Oral Mucositis in HNC Patients. Pathol Oncol Res (2018) 24:135–43. doi: 10.1007/s12253-017-0227-1
33. Boaventura P, Duraes C, Mendes A, Costa NR, Chora I, Ferreira S, et al. IL6-174 G>C Polymorphism (Rs1800795) Association With Late Effects of Low Dose Radiation Exposure in the Portuguese Tinea Capitis Cohort. PloS One (2016) 11:e0163474. doi: 10.1371/journal.pone.0163474
34. Sousa H, Bastos MJ, Ribeiro J, Oliveira S, Breda E, Catarino R, et al. 5’UTR +24T>C CR2 is Not Associated With Nasopharyngeal Carcinoma Development in the North Region of Portugal. Oral Dis (2016) 22:280–4. doi: 10.1111/odi.12436
35. Sousa H, Mesquita L, Ribeiro J, Catarino R, Breda E, Medeiros R. Polymorphisms in Host Immune Response Associated Genes and Risk of Nasopharyngeal Carcinoma Development in Portugal. Immunobiology (2016) 221:145–52. doi: 10.1016/j.imbio.2015.09.015
36. Zhang X, Chen X, Zhai Y, Cui Y, Cao P, Zhang H, et al. Combined Effects of Genetic Variants of the PTEN, AKT1, MDM2 and P53 Genes on the Risk of Nasopharyngeal Carcinoma. PloS One (2014) 9:e92135. doi: 10.1371/journal.pone.0092135
37. Pu X, Hildebrandt MA, Lu C, Roth JA, Stewart DJ, Zhao Y, et al. Inflammation-Related Genetic Variations and Survival in Patients With Advanced non-Small Cell Lung Cancer Receiving First-Line Chemotherapy. Clin Pharmacol Ther (2014) 96:360–9. doi: 10.1038/clpt.2014.89
38. Jin L, Sturgis EM, Zhang Y, Huang Z, Song X, Li C, et al. Association of Tumor Necrosis Factor-Alpha Promoter Variants With Risk of HPV-Associated Oral Squamous Cell Carcinoma. Mol Cancer (2013) 12:80. doi: 10.1186/1476-4598-12-80
39. Fan Q, He JF, Wang QR, Cai HB, Sun XG, Zhou XX, et al. Functional Polymorphism in the 5’-UTR of CR2 is Associated With Susceptibility to Nasopharyngeal Carcinoma. Oncol Rep (2013) 30:11–6. doi: 10.3892/or.2013.2421
40. Gaur P, Mittal M, Mohanti B, Das S. Functional Variants of IL4 and IL6 Genes and Risk of Tobacco-Related Oral Carcinoma in High-Risk Asian Indians. Oral Dis (2011) 17:720–6. doi: 10.1111/j.1601-0825.2011.01831.x
41. Mittal M, Kapoor V, Mohanti BK, Das SN. Functional Variants of COX-2 and Risk of Tobacco-Related Oral Squamous Cell Carcinoma in High-Risk Asian Indians. Oral Oncol (2010) 46:622–6. doi: 10.1016/j.oraloncology.2010.06.002
42. Farhat K, Hassen E, Gabbouj S, Bouaouina N, Chouchane L. Interleukin-10 and Interferon-Gamma Gene Polymorphisms in Patients With Nasopharyngeal Carcinoma. Int J Immunogenet (2008) 35:197–205. doi: 10.1111/j.1744-313X.2008.00752.x
43. Chen K, Hu Z, Wang LE, Sturgis EM, El-Naggar AK, Zhang W, et al. Single-Nucleotide Polymorphisms At the TP53-Binding or Responsive Promoter Regions of BAX and BCL2 Genes and Risk of Squamous Cell Carcinoma of the Head and Neck. Carcinogenesis (2007) 28:2008–12. doi: 10.1093/carcin/bgm172
44. Guo W, Wang N, Wang YM, Li Y, Wen DG, Chen ZF, et al. Interleukin-10 -1082 Promoter Polymorphism is Not Associated With Susceptibility to Esophageal Squamous Cell Carcinoma and Gastric Cardiac Adenocarcinoma in a Population of High-Incidence Region of North China. World J Gastroenterol (2005) 11:858–62. doi: 10.3748/wjg.v11.i6.858
45. Xu Q, Yuan Y, Sun LP, Gong YH, Xu Y, Yu XW, et al. Risk of Gastric Cancer is Associated With the MUC1 568 a/G Polymorphism. Int J Oncol (2009) 35:1313–20. doi: 10.3892/ijo_00000449
46. Bonaparte E, Pesenti C, Fontana L, Falcone R, Paganini L, Marzorati A, et al. Molecular Profiling of Lung Cancer Specimens and Liquid Biopsies Using MALDI-TOF Mass Spectrometry. Diagn Pathol (2018) 13:4. doi: 10.1186/s13000-017-0683-7
47. Yang XD, Zhao SF, Zhang Q, Li W, Wang YX, Hong XW, et al. Gelsolin Rs1078305 and Rs10818524 Polymorphisms Were Associated With Risk of Oral Squamous Cell Carcinoma in a Chinese Han Population. Biomarkers (2016) 21:267–71. doi: 10.3109/1354750X.2015.1134664
48. Singhal N, Kumar M, Kanaujia PK, Virdi JS. MALDI-TOF Mass Spectrometry: an Emerging Technology for Microbial Identification and Diagnosis. Front Microbiol (2015) 6:791. doi: 10.3389/fmicb.2015.00791
49. Eisenhauer EA, Therasse P, Bogaerts J, Schwartz LH, Sargent D, Ford R, et al. New Response Evaluation Criteria in Solid Tumours: Revised RECIST Guideline (Version 1.1). Eur J Cancer (2009) 45:228–47. doi: 10.1016/j.ejca.2008.10.026
50. Hanahan D, Weinberg RA. Hallmarks of Cancer: the Next Generation. Cell (2011) 144:646–74. doi: 10.1016/j.cell.2011.02.013
51. Elinav E, Nowarski R, Thaiss CA, Hu B, Jin C, Flavell RA. Inflammation-Induced Cancer: Crosstalk Between Tumours, Immune Cells and Microorganisms. Nat Rev Cancer (2013) 13:759–71. doi: 10.1038/nrc3611
52. Jinushi M. Yin and Yang of Tumor Inflammation: How Innate Immune Suppressors Shape the Tumor Microenvironments. Int J Cancer (2014) 135:1277–85. doi: 10.1002/ijc.28626
54. Atsumi T, Singh R, Sabharwal L, Bando H, Meng J, Arima Y, et al. Inflammation Amplifier, a New Paradigm in Cancer Biology. Cancer Res (2014) 74:8–14. doi: 10.1158/0008-5472.CAN-13-2322
55. Buas MF, He Q, Johnson LG, Onstad L, Levine DM, Thrift AP, et al. Germline Variation in Inflammation-Related Pathways and Risk of Barrett’s Oesophagus and Oesophageal Adenocarcinoma. Gut (2017) 66:1739–47. doi: 10.1136/gutjnl-2016-311622
56. Kim MJ, Kang HG, Lee SY, Jeon HS, Lee WK, Park JY, et al. AKT1 Polymorphisms and Survival of Early Stage non-Small Cell Lung Cancer. J Surg Oncol (2012) 105:167–74. doi: 10.1002/jso.22071
57. De Marco C, Rinaldo N, Bruni P, Malzoni C, Zullo F, Fabiani F, et al. Multiple Genetic Alterations Within the PI3K Pathway are Responsible for AKT Activation in Patients With Ovarian Carcinoma. PloS One (2013) 8:e55362. doi: 10.1371/journal.pone.0055362
58. Li Q, Yang J, Yu Q, Wu H, Liu B, Xiong H, et al. Associations Between Single-Nucleotide Polymorphisms in the PI3K-PTEN-AKT-Mtor Pathway and Increased Risk of Brain Metastasis in Patients With non-Small Cell Lung Cancer. Clin Cancer Res (2013) 19:6252–60. doi: 10.1158/1078-0432.CCR-13-1093
59. Avan A, Avan A, Le Large TY, Mambrini A, Funel N, Maftouh M, et al. AKT1 and SELP Polymorphisms Predict the Risk of Developing Cachexia in Pancreatic Cancer Patients. PloS One (2014) 9:e108057. doi: 10.1371/journal.pone.0108057
60. Wang X, Lin Y, Lan F, Yu Y, Ouyang X, Wang X, et al. A GG Allele of 3’-Side AKT1 SNP is Associated With Decreased AKT1 Activation and Better Prognosis of Gastric Cancer. J Cancer Res Clin Oncol (2014) 140:1399–411. doi: 10.1007/s00432-014-1663-x
61. Fristedt R, Gaber A, Hedner C, Nodin B, Uhlen M, Eberhard J, et al. Expression and Prognostic Significance of the Polymeric Immunoglobulin Receptor in Esophageal and Gastric Adenocarcinoma. J Transl Med (2014) 12:83. doi: 10.1186/1479-5876-12-83
62. Ban S, Konomi C, Iwakawa M, Yamada S, Ohno T, Tsuji H, et al. Radiosensitivity of Peripheral Blood Lymphocytes Obtained From Patients With Cancers of the Breast, Head and Neck or Cervix as Determined With a Micronucleus Assay. J Radiat Res (2004) 45:535–41. doi: 10.1269/jrr.45.535
63. Yu J, Huang Y, Liu L, Wang J, Yin J, Huang L, et al. Genetic Polymorphisms of Wnt/Beta-Catenin Pathway Genes are Associated With the Efficacy and Toxicities of Radiotherapy in Patients With Nasopharyngeal Carcinoma. Oncotarget (2016) 7:82528–37. doi: 10.18632/oncotarget.12754
64. Caetano MS, Zhang H, Cumpian AM, Gong L, Unver N, Ostrin EJ, et al. IL6 Blockade Reprograms the Lung Tumor Microenvironment to Limit the Development and Progression of K-Ras-Mutant Lung Cancer. Cancer Res (2016) 76:3189–99. doi: 10.1158/0008-5472.CAN-15-2840
65. Pasvenskaite A, Vilkeviciute A, Liutkeviciene R, Gedvilaite G, Liutkevicius V, Uloza V. Associations of IL6 Rs1800795, BLK Rs13277113, TIMP3 Rs9621532, IL1RL1 Rs1041973 and IL1RAP Rs4624606 Single Gene Polymorphisms With Laryngeal Squamous Cell Carcinoma. Gene (2020) 747:144700. doi: 10.1016/j.gene.2020.144700
Keywords: inflammation-related gene, SNP, HNSCC, risk, radiotherapy sensitivity
Citation: Li Y, Zhu L, Yao H, Zhang Y, Kong X, Chen L, Song Y, Mu A and Li X (2021) Association of Inflammation-Related Gene Polymorphisms With Susceptibility and Radiotherapy Sensitivity in Head and Neck Squamous Cell Carcinoma Patients in Northeast China. Front. Oncol. 11:651632. doi: 10.3389/fonc.2021.651632
Received: 10 January 2021; Accepted: 07 May 2021;
Published: 04 June 2021.
Edited by:
Jun-Lin Yi, Chinese Academy of Medical Sciences and Peking Union Medical College, ChinaReviewed by:
Xin Jiang, The First Hospital of Jilin University, ChinaJinsheng Hong, First Affiliated Hospital of Fujian Medical University, China
Copyright © 2021 Li, Zhu, Yao, Zhang, Kong, Chen, Song, Mu and Li. This is an open-access article distributed under the terms of the Creative Commons Attribution License (CC BY). The use, distribution or reproduction in other forums is permitted, provided the original author(s) and the copyright owner(s) are credited and that the original publication in this journal is cited, in accordance with accepted academic practice. No use, distribution or reproduction is permitted which does not comply with these terms.
*Correspondence: Ying Li, bGl5aW5nODYxMDFAMTYzLmNvbQ==; Xia Li, bGl4aWFkb2N0b3JAMTYzLmNvbQ==
†These authors have contributed equally to this work