 Lili Xu
 Gumuyang Zhang1†
 Hao Sun
 Zhengyu Jin
- 1Department of Radiology, Peking Union Medical College Hospital, Peking Union Medical College, Chinese Academy of Medical Sciences, Beijing, China
- 2Department of Urology, Peking Union Medical College Hospital, Peking Union Medical College, Chinese Academy of Medical Sciences, Beijing, China
- 3Department of Pathology, Peking Union Medical College Hospital, Peking Union Medical College, Chinese Academy of Medical Sciences, Beijing, China
Objectives: To externally validate the extraprostatic extension (EPE) grade criteria on MRI and analyze the incremental value of EPE grade to clinical models of prostate cancer.
Methods: A consecutive 130 patients who underwent preoperative prostate MRI followed by radical prostatectomy between January 2015 to January 2020 in our institution were retrospectively enrolled. The EPE grade, Cancer of the Prostate Risk Assessment (CAPRA), and Memorial Sloan Kettering Cancer Center nomogram (MSKCCn) score for each patient were assigned. Significant clinicopathological factors in univariate and multivariate analyses were combined with EPE grade to build the Clinical + EPE grade model, and the CAPRA and MSKCCn score were also combined with EPE grade to build the CAPRA + EPE grade and MSKCCn + EPE grade model, respectively. The area under the curve (AUC), sensitivity and specificity of these models were calculated to evaluate their diagnostic performance. Calibration and decision curve analyses were used to analyze their calibration performance and clinical utility.
Results: The AUC for predicting EPE was 0.767–0.778 for EPE grade, 0.704 for CAPRA, and 0.723 for MSKCCn. After combination with EPE grade, the AUCs of these clinical models increased significantly than using clinical models along (P < 0.05), but was comparable with using EPE grade alone (P > 0.05). The calibration curves of EPE grade, clinical models and combined models showed that these models are well-calibrated for EPE. In the decision curve analysis, EPE grade showed slightly higher net benefit than MSKCCn and CAPRA.
Conclusion: The EPE grade showed good performance for evaluating EPE in our cohort and possessed well clinical utility. Further combinations with the EPE grade could improve the diagnostic performance of clinical models.
Introduction
Prostate cancer (PCa) is the most common malignancy in men worldwide (1). Extraprostatic extension (EPE) of PCa is associated with an increased risk of positive surgical margins (2), biochemical recurrence (3), and even death from PCa (4, 5). Preoperative prediction of EPE has an important influence on clinical decision making. Patients without EPE could consider nerve-sparing radical prostatectomy or active surveillance according to their risk stratification, while patients with positive EPE are recommended to undergo nerve-sacrificing radical prostatectomy or adjuvant radiotherapy (6, 7).
Previously, some clinical models and grading systems have been proposed for preoperative evaluation of EPE, including the Cancer of the Prostate Risk Assessment (CAPRA) score (8), Memorial Sloan Kettering Cancer Center nomogram (MSKCCn) (9), and Partin tables (PT) (10). These models are based on clinical and histopathological variables, such as prostate-specific antigen (PSA) level, biopsy Gleason score (GS), and clinical T stage. Nevertheless, the diagnostic performance of these models varies with reported areas under the curve (AUCs) ranging from 0.610 to 0.806 (9–12).
MRI is an important preoperative evaluation method for PCa, which has been reported to be useful for predicting EPE. Regarding the limitations of previous MRI criteria for EPE evaluation, there is heterogeneity in the definitions of positive and negative results and significant inter-reader variability (13). Mehralivand et al. proposed a standardized and more simplified MRI grading system (termed the EPE grade) for EPE evaluation (14). This EPE grading system showed comparable diagnostic performance with other MRI criteria, including the European Society of Urogenital Radiology score, capsular contact length, and Likert scales, and possessed the highest correlation with histologic EPE extent (15). Nevertheless, there is still a lack of a direct comparison of EPE grade with the presently existing clinical models, and the incremental value of the EPE grade to clinical variables remains unknown.
Therefore, this study was designed to externally validate the EPE grade, compare it with the MSKCCn and CAPRA score, and analyze whether combining the EPE grade with clinical variables and clinical models would improve their diagnostic performance.
Materials and Methods
Patients
The Institutional Review Board (IRB) approved this retrospective study (IRB number JS-2114) and waived the need for written informed consent. Consecutive patients with pathologically confirmed prostate cancer who underwent preoperative prostate multiparametric MRI (mpMRI) followed by radical prostatectomy between January 2015 to January 2020 in our institution were retrospectively enrolled in this study. The exclusion criteria were as follows (1): preoperative biopsy results were not available or complete pathological slices were not available for EPE evaluation (n = 5); (2) the interval between prostate MRI and radical prostatectomy was more than six months (n = 4); and (3) patients who received a biopsy (within 6 months before MRI), radiation therapy or hormonal therapy before MRI (n = 16). No patients received neo-adjuvant androgen deprivation therapy (ADT). Figure 1 shows a flowchart of patient recruitment in this study, and a total of 130 patients were finally enrolled.
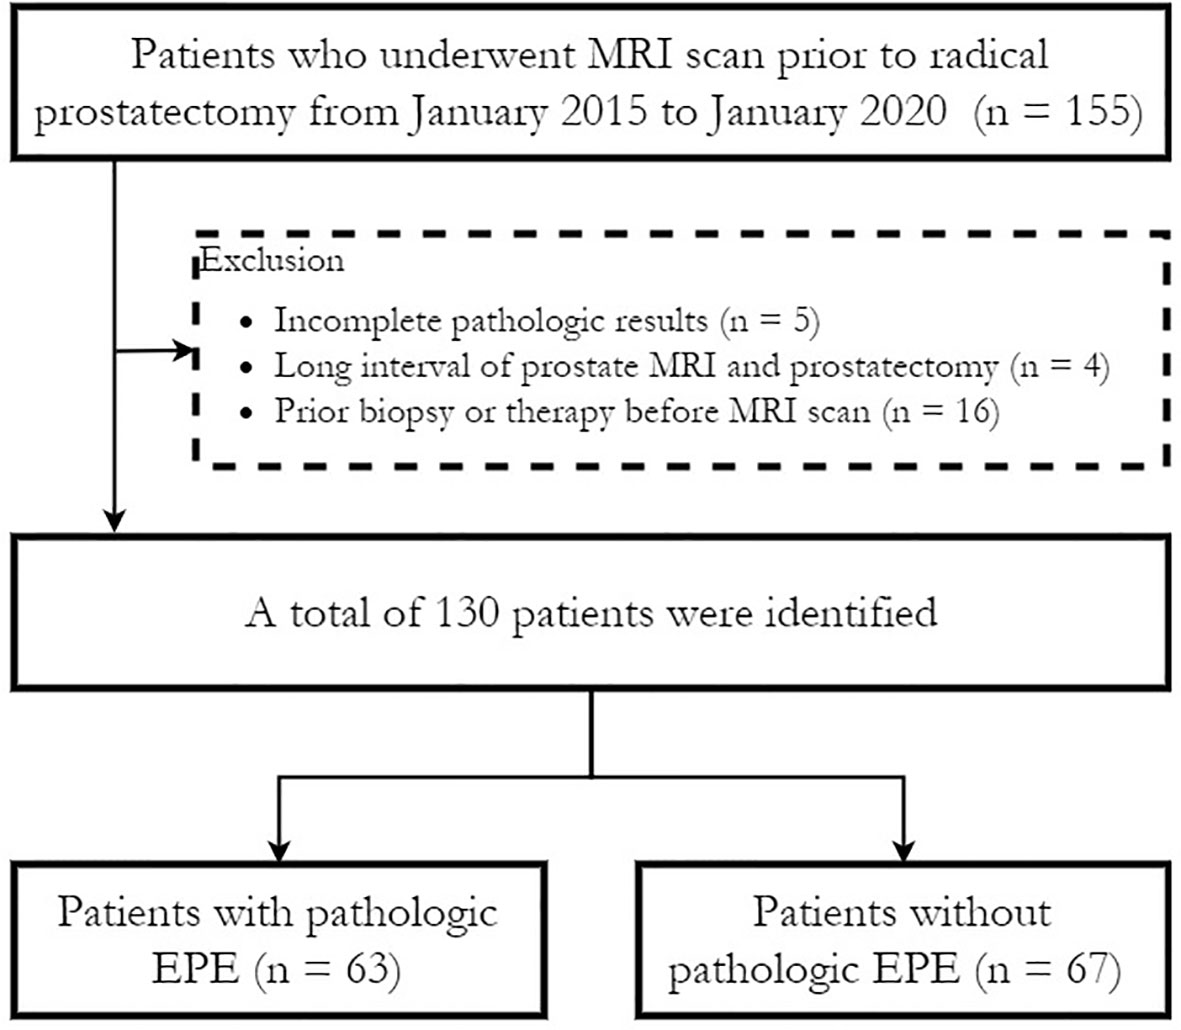
Figure 1 Flow diagram of patient selection for the study. EPE, extraprostatic extension.
The clinicopathologic data including age, PSA level, clinical T stage, biopsy GS, biopsy International Society of Urological Pathology (ISUP) category, and percentage of positive biopsy cores for each patient were obtained from the medical records. According to the patients’ PSA level, GS, and clinical stage, patients were stratified into low-, intermediate-, and high-risk/locally advanced groups (16). Additionally, the CAPRA score (8) and MSKCCn score (17) for each patient were also calculated.
MR Data Acquisition
A 3.0-T MRI scanner (GE750, GE Healthcare) was used to perform prostate mpMRI, including T2-weighted imaging (T2WI), diffusion-weighted imaging (DWI), and dynamic contrast-enhanced (DCE) imaging. Corresponding apparent diffusion coefficient (ADC) maps were calculated using b values of 0 and 800 mm2/sec. The detailed MR imaging acquisition parameters applied in this study are shown in Supplementary Table 1.
Image Interpretation
Mehralivand et al.’s EPE grade imaging criteria (14) were used to assess EPE likelihood: grade 0, no suspicion for EPE; grade 1, either curvilinear contact length ≥ 1.5 cm or capsular irregularity and bulge; grade 2, both curvilinear contact length ≥ 1.5 cm and capsular irregularity and bulge; grade 3, frank EPE visible at MRI or invasion of adjacent anatomic structures. Since our Picture Archiving and Communication Systems (PACS) doesn’t contain a free-hand measurement tool, the curvilinear contact length was estimated by drawing a series of measurements (usually 2–3 straight lines). All examinations were interpreted by one senior radiologist (Reader 1, with 7 years of experience in interpreting prostate MRI, interpreted more than 2 000 cases) who was unaware of the presence or absence of pathologic EPE or clinical variables. When multiple lesions existed, the lesion with the highest EPE grade was enrolled for analysis. The lesion’s Prostate Imaging Reporting and Data System version 2.1 (PI-RADS v2.1) category and tumor location were also recorded. Prostate volume at MRI was calculated using the formula for a prolate ellipse: (maximum anterior–posterior diameter) × (maximum transverse diameter) × (maximum longitudinal diameter) × 0.52. PSA density (PSAD) = PSA/prostate volume.
Another radiologist (Reader 2, with 2 years of experience in interpreting prostate MRI, interpreted about 300 cases) also reviewed the images to calculate the interreader variability of this EPE grade. All mpMRI studies were re-evaluated by the same radiologist after 4 weeks to assess the intrareader agreement.
Standard of References
The final histopathologic assessment was defined as the standard reference. One senior pathologist (with more than 10 years of experience in prostate specimen interpretation) who was blinded to the MRI reports reviewed the pathological slices (with a whole-mount slice thickness of 0.4 cm) and recorded the presence or absence of EPE for each patient. EPE was defined as the presence of prostate tumors extending out of the confines of the prostate (18). After image interpretation and pathology evaluation, another radiologist (Reader 3) performed the site concordance procedure, and matched the lesions evaluated on MRI with pathology specimen.
Statistical Analysis
The differences in clinicopathological variables between the EPE positive and EPE negative groups were assessed using the Mann-Whitney U test, chi-squared test, or Fisher’s exact test, where appropriate. Subsequently, the forward stepwise logistic regression method was used to select independent risk factors for EPE among the significant variables on univariate analysis. The selected clinicopathological variables were then integrated with EPE grade evaluated by Reader 1 using a logistic regression method to build the Clinical + EPE grade model. To analyze the additional value of MRI to clinical models, we also built a MSKCCn + EPE grade model and a CAPRA + EPE grade model by using the same method.
The receiver operating characteristic (ROC) curves of the different models were plotted, and the AUC, diagnostic sensitivity, specificity, positive predictive value (PPV), and negative predictive value (NPV) were calculated to evaluate the diagnostic performance of these models. The DeLong test was used to compare the AUCs of the different models. For EPE grade, a predefined cut-off value (EPE grade ≥ 1) (15) was used, and for the other models, the Youden J index was used to determine the optimal cut-off (19). The sensitivities and specificities of these methods were compared by using the McNemar test.
The calibration curve together with the Hosmer-Lemeshow test were used to analyze the calibration performance of these models. The decision curves were also plotted to compare the clinical utility of these models. The software used for analyses included SPSS 22.0 (IBM), MedCalc 11.4.2.0 (MedCalc), and R 3.5.1 (Comprehensive R Archive Network, www.r-project.org). A two-tailed P value < 0.05 was indicative of statistical significance.
Results
Patient Demographic Characteristics
A total of 130 patients (mean age, 64.21 ± 8.10 years; range, 24–81 years) were included. Their median PSA level was 9.95 (2.78-83.02) ng/mL, median prostate volume was 34 (15-145) cm3, and the median PSAD was 0.31 (0.05–2.77). Pathologic EPE was diagnosed in 48.5% (63/130) of the patients. The clinicopathological characteristics of the patients included in this study are presented in Table 1.
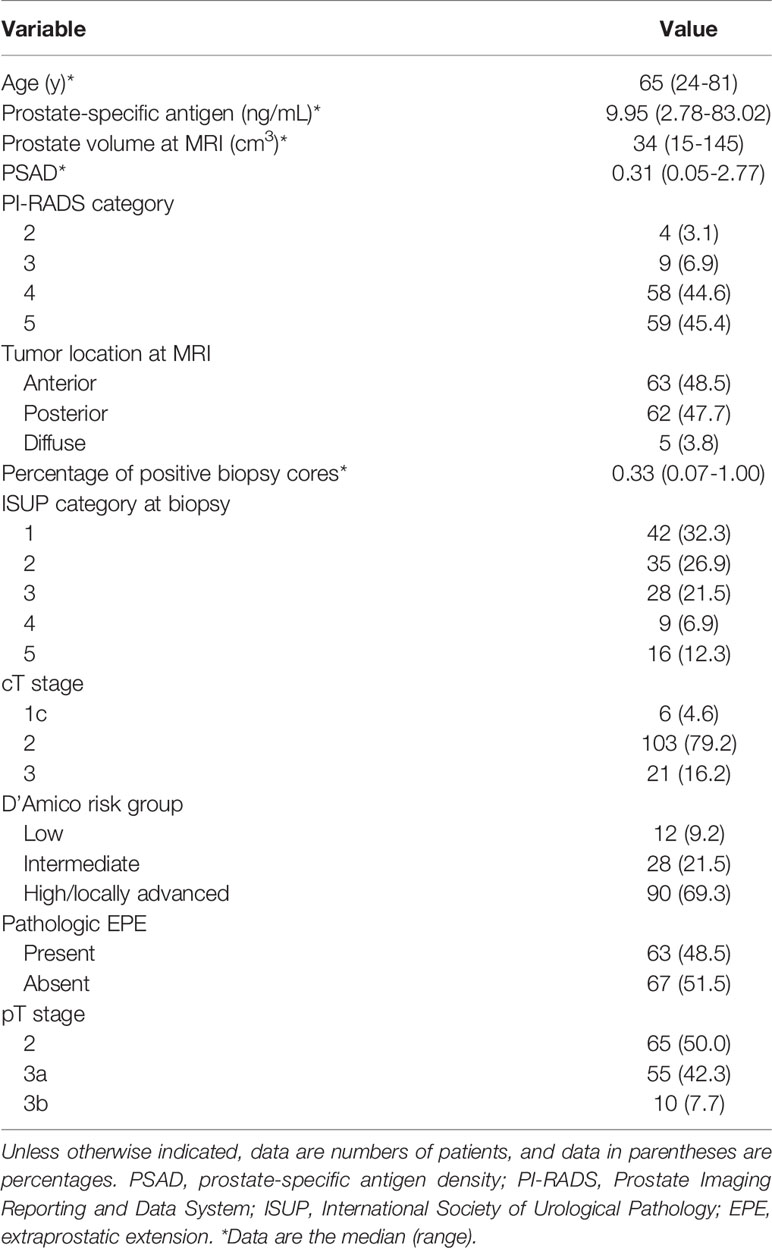
Table 1 Clinicopathological characteristics of patients in this study (n = 130).
Univariate and Multivariate Analysis of Patients’ Clinicopathological Variables
In univariate analysis, PSA, PSAD, PI-RADS category, percentage of positive biopsy cores, ISUP category at biopsy, cT stage and D’Amico risk group were significantly different between the EPE positive and negative groups (all P < 0.05) (Table 2). No statistical significance was noted for age and tumor location (P > 0.05). After calculating the multicollinearity of these independents, the result showed that the variance inflation factors (VIFs) were < 10 (1.281-3.778), and tolerances were > 0.1 (0.265-0.781), which indicated that there was no potential collinearity problem. A forward stepwise logistic regression was used to select significant indicators among these variables, and PSAD and PI-RADS category were the independent risk factors for EPE (P = 0.007 and < 0.001, respectively). The two selected variables were then integrated with EPE grade to build the Clinical + EPE grade model.
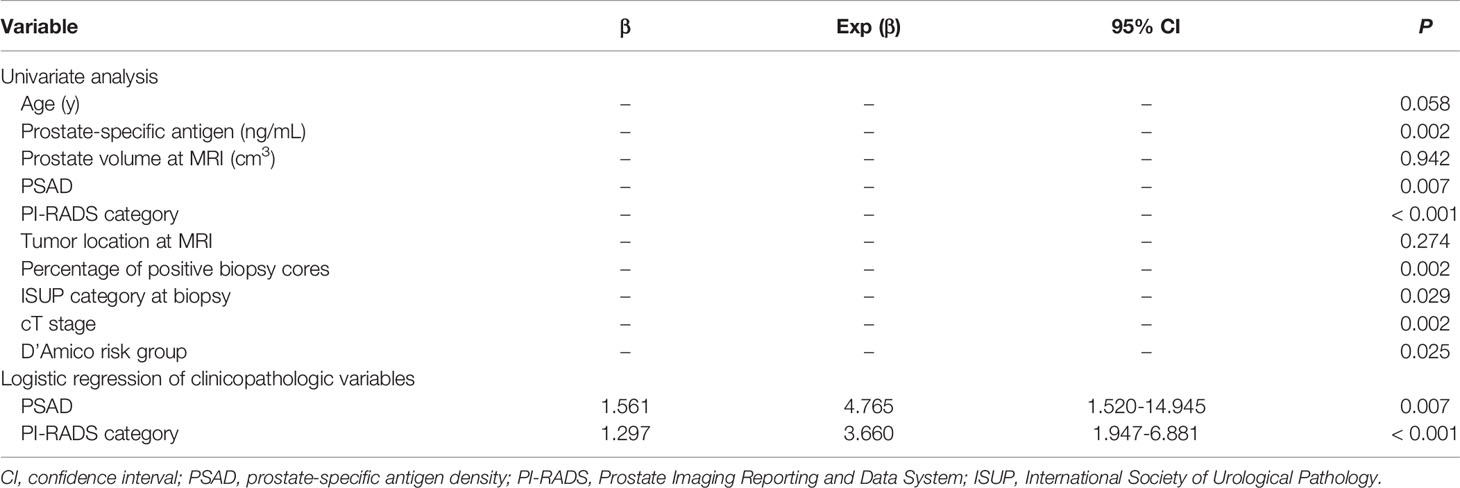
Table 2 Univariate and multivariate analysis of patients’ clinicopathological variables.
Diagnostic Performance of the EPE Grade and Comparison With Clinical Models
The diagnostic performance according to the CAPRA score, MSKCCn, and EPE grade are presented in Table 3 and Figure 2. The AUC for diagnosing EPE was 0.778 (95% confidence interval [CI]: 0.697–0.846) for EPE grade for Reader 1, 0.767 (95% CI: 0.684–0.836) for Reader 2, 0.704 (95% CI: 0.617–0.780) for the CAPRA score, and 0.723 (95% CI: 0.637–0.797) for MSKCCn. The AUCs of EPE grade, CAPRA score and MSKCCn were comparable (P > 0.05 for each comparison). The specificity of MSKCCn was significantly higher than the CAPRA score (65.7% vs. 56.7%, P = 0.031) and was comparable with the EPE grade (65.7% vs. 59.7%, P > 0.05). No significant difference was noted in sensitivity (88.9% for EPE grade in Reader 1, 79.4% for CAPRA, and 77.8% for MSKCCn, P > 0.05 for each comparison). The EPE grade for Reader 1 reached the highest NPV (85.1%) than other models. The intra- and interreader agreement of the EPE grade were both excellent, with a weighted kappa value of 0.805 and 0.877, respectively.
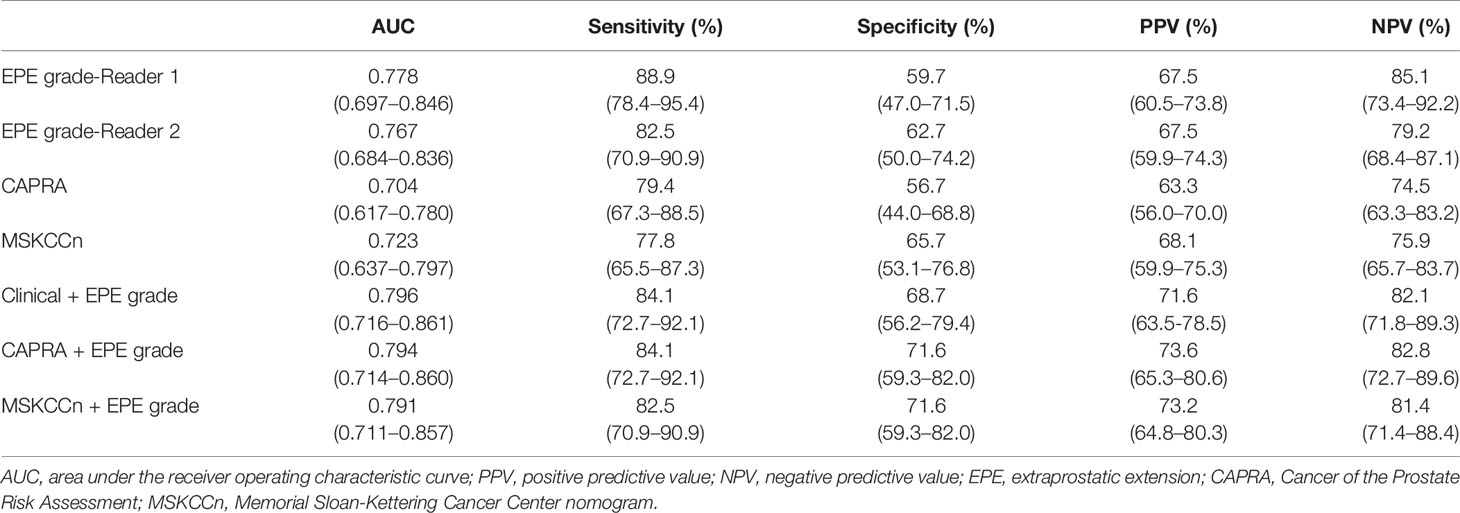
Table 3 Diagnostic performance of EPE grade, CAPRA score, MSKCCn, and combined model for extraprostatic extension.
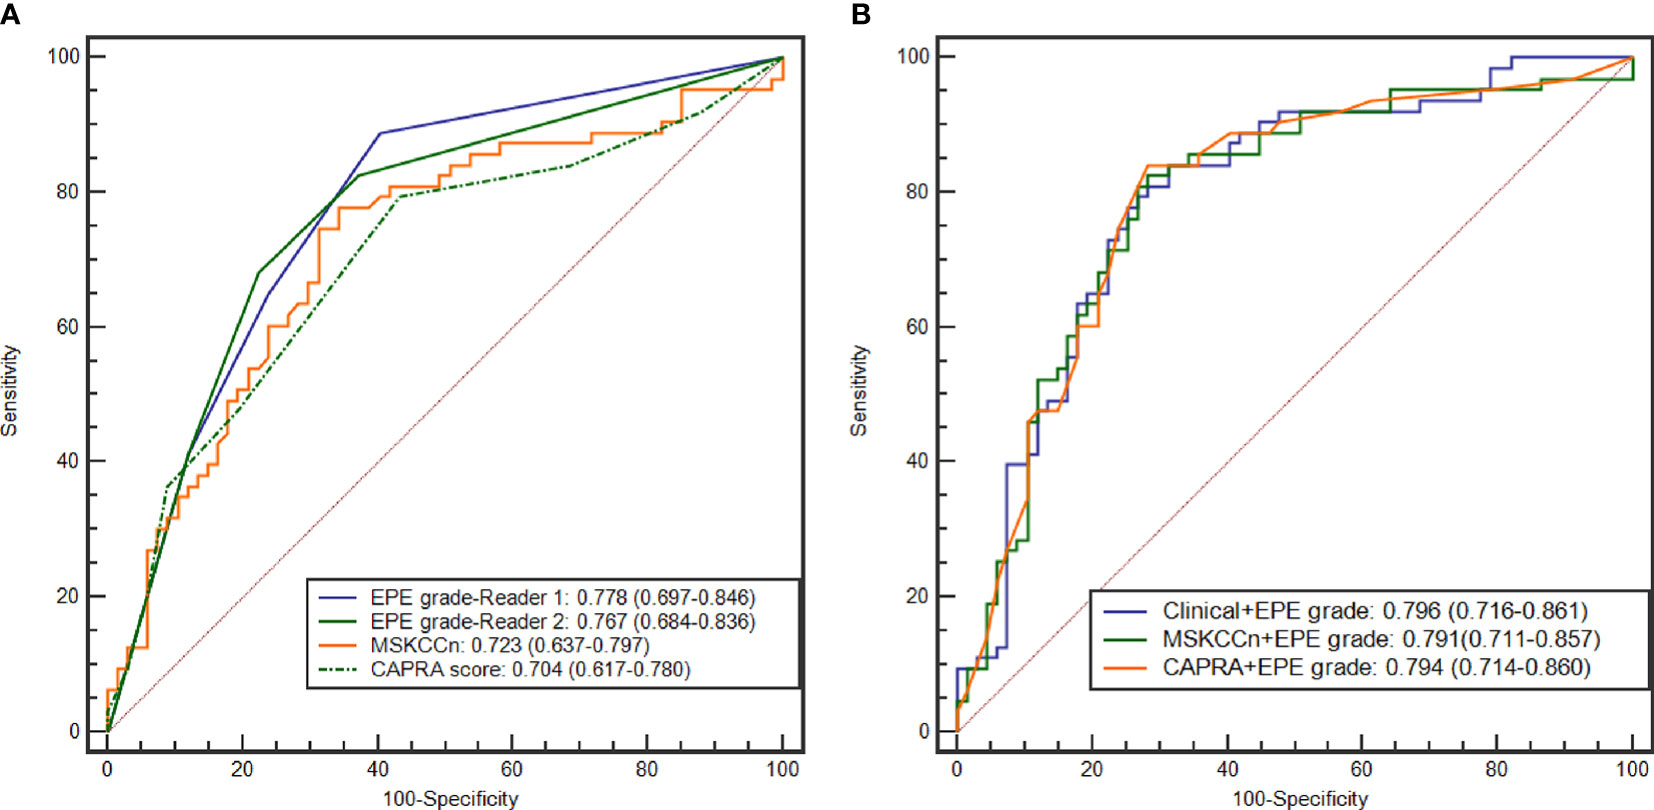
Figure 2 ROC curves of the EPE grade, MSKCCn, and CAPRA score (A), and the Clinical + EPE grade model, MSKCCn + EPE grade model, and CAPRA + EPE grade model (B) for diagnosing EPE. ROC, receiver operating characteristic; EPE, extraprostatic extension; MSKCCn, Memorial Sloan Kettering Cancer Center nomogram; CAPRA, Cancer of the Prostate Risk Assessment.
Diagnostic Performance of the Three Combined Models
The AUCs of the different combined models were comparable (P > 0.05 for each pair), and the values were 0.796 (95% CI: 0.716–0.861) for the Clinical + EPE grade model, 0.794 (95% CI: 0.714–0.860) for the CAPRA + EPE grade model, and 0.791 (95% CI: 0.711–0.857) for the MSKCCn + EPE grade model (Table 3 and Figure 2). Compared with using clinical models alone, the combination of EPE grade significantly improved their diagnostic performance (CAPRA vs. CAPRA + EPE grade, P = 0.014; MSKCCn vs. MSKCCn + EPE grade, P = 0.027). Nevertheless, there was no statistically significant difference between the three combined models and EPE grade by itself (all P > 0.05). CAPRA + EPE grade showed improved specificity over the CAPRA score (71.6% vs. 56.7%, P = 0.041), and the Clinical + EPE grade model showed improved specificity over the EPE grade (68.7% vs. 59.7%, P = 0.031). There was no statistically significant difference in sensitivity among the EPE grade, clinical models, and the three combined models (all P > 0.05).
Calibration Curves and Decision Curves of EPE Grade and Clinical Models
The calibration curves of the EPE grade and clinical models showed that these models are well-calibrated for EPE (Figure 3), and the Hosmer-Lemeshow test yielded a non-significant statistic (P = 0.394 for EPE grade, 0.780 for MSKCCn, and 0.281 for CAPRA). For the Clinical + EPE grade model, its Hosmer-Lemeshow test was statistically significant (P = 0.037), which indicated a poor model fit. As shown in the calibration plot (Figure 3D), the Clinical + EPE grade model was likely to underestimate the predicted risk. For the other combined models, the Hosmer-Lemeshow test showed no significant difference (P = 0.271 for MSKCCn + EPE grade, and 0.516 for CAPRA + EPE grade).
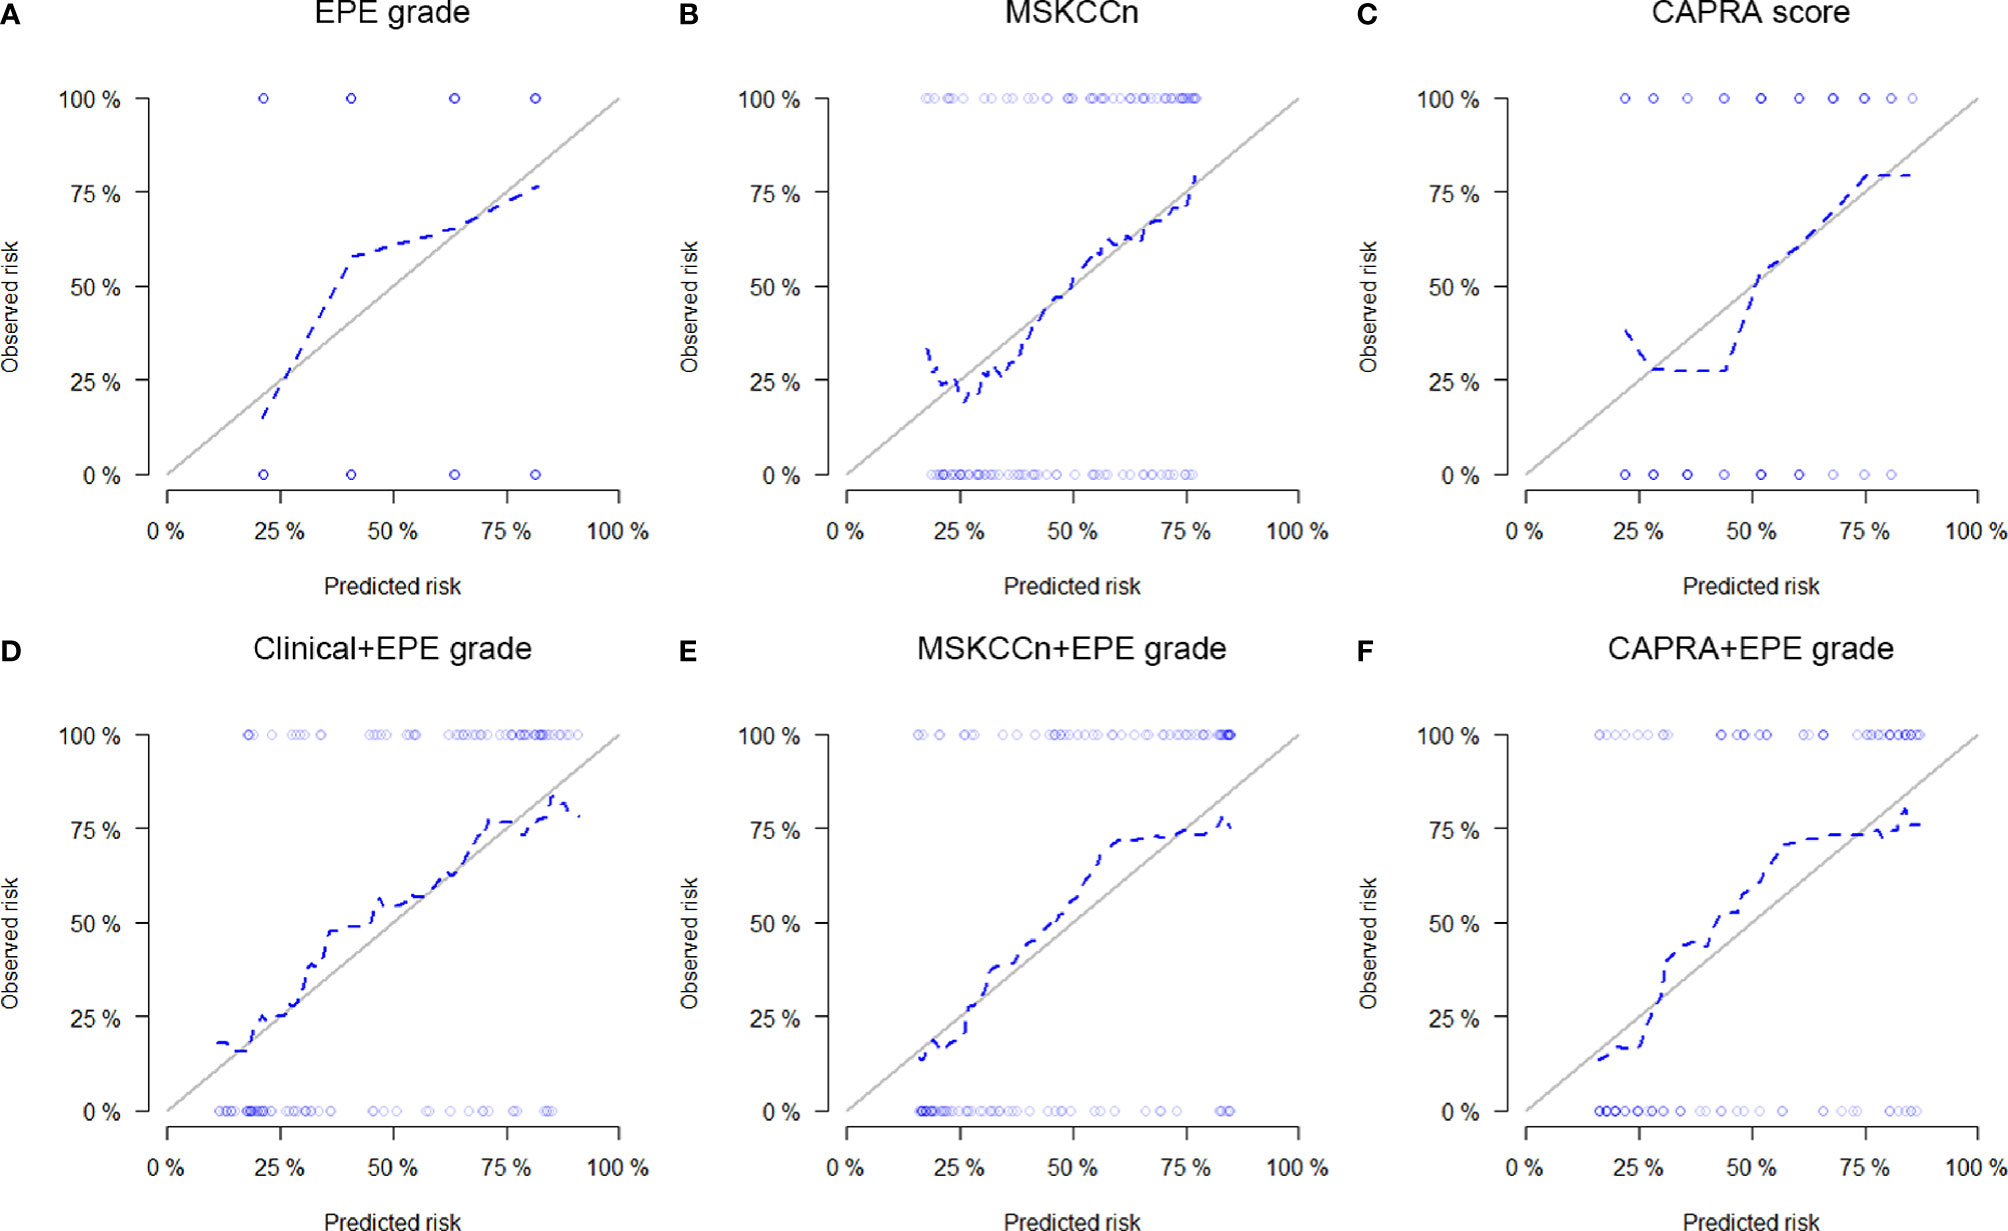
Figure 3 Calibration curves of the EPE grade (A), MSKCCn (B), CAPRA score (C), Clinical + EPE grade model (D), MSKCCn + EPE grade model (E), and CAPRA + EPE grade model (F) for evaluating EPE. The Clinical + EPE grade model showed a poor model fit with statistically significant Hosmer-Lemeshow test result (P = 0.037), while other models were well-calibrated for EPE with non-significant Hosmer-Lemeshow test results (all P > 0.05). EPE, extraprostatic extension; MSKCCn, Memorial Sloan Kettering Cancer Center nomogram; CAPRA, Cancer of the Prostate Risk Assessment.
In the decision curve analysis, EPE grade showed slightly higher net benefit than the MSKCCn and CAPRA score (Figure 4A), and the three combined models showed comparable net benefits (Figure 4B).
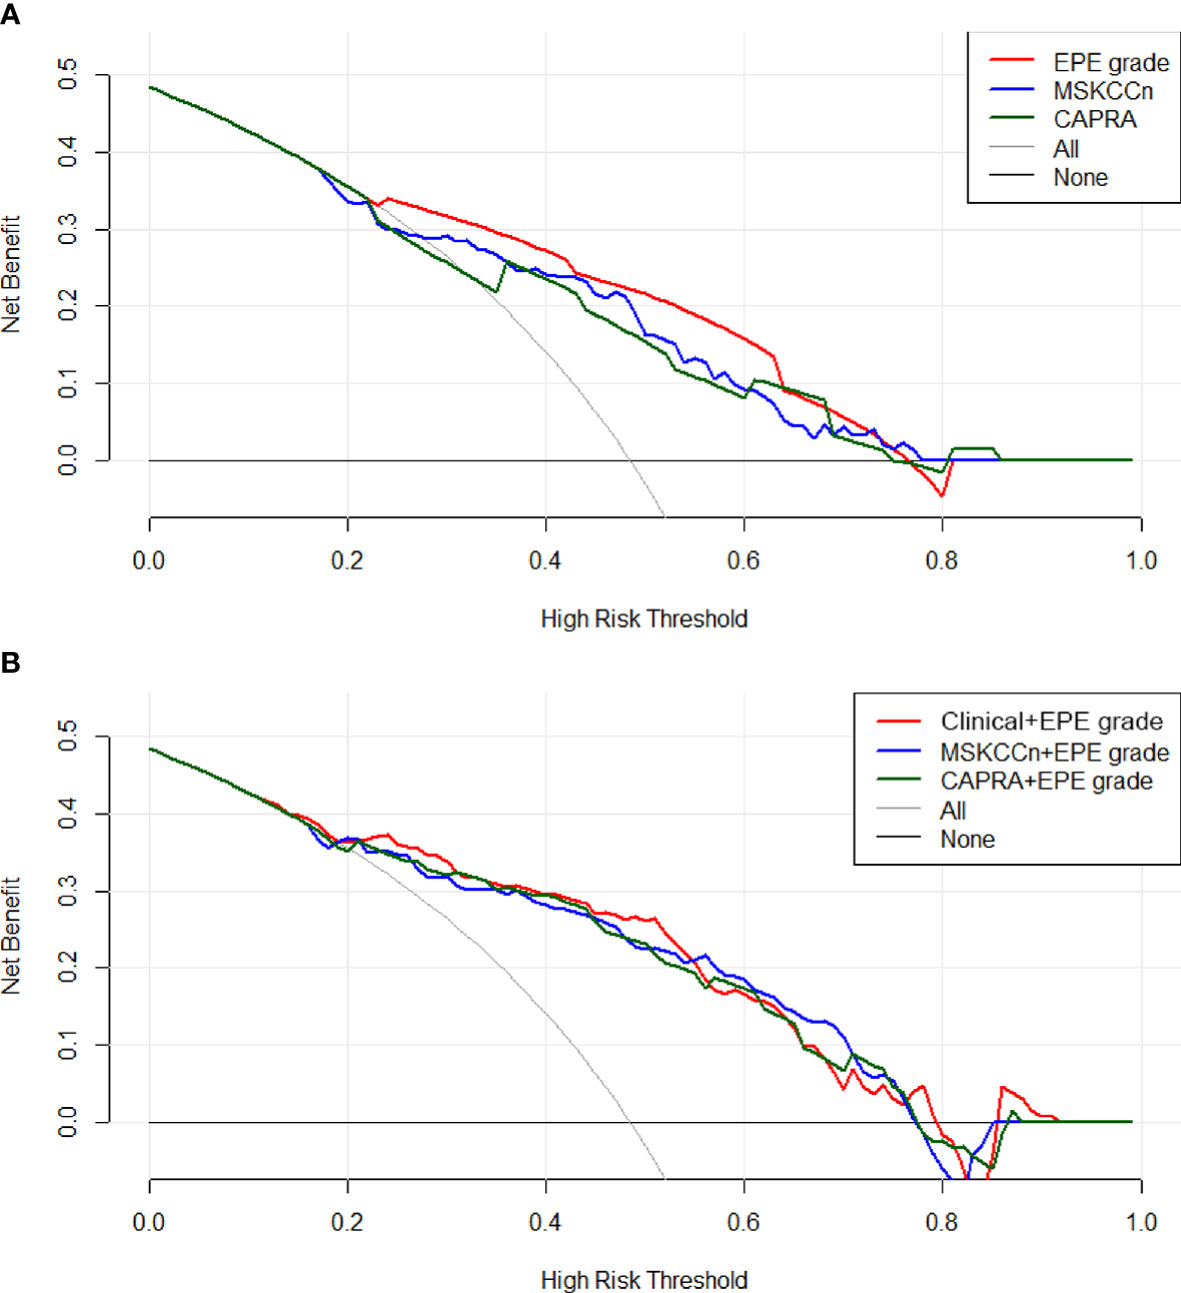
Figure 4 Decision curves of the EPE grade, MSKCCn, and CAPRA score (A), and the Clinical + EPE grade model, MSKCCn + EPE grade model, and CAPRA + EPE grade model (B) for diagnosing EPE. The EPE grade showed a higher net benefit than the MSKCCn and CAPRA score, and the three combined models showed comparable net benefits. EPE, extraprostatic extension; MSKCCn, Memorial Sloan Kettering Cancer Center nomogram; CAPRA, Cancer of the Prostate Risk Assessment.
Discussion
In this study, we externally validated the EPE grade on MRI and compared this grading system with existing clinical models, MSKCCn and the CAPRA score. The EPE grade possessed good and comparable diagnostic performance with the clinical models for assessing EPE, with excellent inter- and intrareader agreements and clinical utility. Besides, combining the EPE grade with clinical models improved their diagnostic performance.
Compared with previous MRI grading methods, EPE grade provided a standardized and simplified grading system for EPE detection. This grading system is based on only a few imaging features, making it easy to teach and learn (14). In our study, by using EPE grade, even the junior radiologist could perform the EPE evaluation with a good diagnostic performance, which to some extent reflected the simplicity and comprehensibility of the EPE grade. Reisæter et al. compared the EPE grade with a five-point Likert score for EPE and the prediction of biochemical recurrence-free survival, and the results showed that the EPE grade and the EPE Likert have an equivalent diagnostic performance with a similar degree of observer dependence (20). Park et al. (15) compared the diagnostic performance of MRI-based criteria (including EPE grade, European Society of Urogenital Radiology score, Likert scale, and capsular contact length) for the assessment of EPE, and these criteria showed good overall diagnostic performance, with AUC ranges of 0.77–0.81, 0.79–0.81, 0.78–0.79, and 0.78–0.85, respectively, with substantial intra- and interreader agreement. Further analysis showed that EPE grade had the highest correlation with histologic extent of EPE, and in this regard, the EPE grade resulted in a more reliable performance (15). In our study, we compared EPE grade with existing clinical models and found the EPE grade showed comparable diagnostic performance with them. Regarding the clinical utility of these models, EPE grade might be more helpful than MSKCCn and the CAPRA score. The good performance of the EPE grade may lie in the integrating of quantitative (curvilinear contact length) and qualitative variables (capsular bulge and frank EPE). In a recently published meta-analysis including thirteen articles with 2136 patients, the diagnostic performance of tumor capsular contact was good with a summary sensitivity and specificity of 0.79 and 0.67, respectively, and the AUC was 0.81 (21). Additionally, an important information provided by EPE grade and not offered by the clinical nomograms is EPE location which should help tailor surgical approach and potentially reduce margin positivity rates.
Regarding individualized treatment, there is a need to integrate clinical risk factors with MRI imaging features to more accurately predict the possibility of EPE (22, 23). Studies have shown that MRI features can improve the diagnostic performance of clinical-based models to predict EPE (11, 12). Morlacco et al. analyzed the diagnostic performance of using PT and CAPRA score alone, and with the application of MRI for detecting EPE, the AUC was 0.61 vs. 0.73 (without and with MRI) for PT and was 0.69 vs. 0.77 (without and with MRI) for the CAPRA score (11). In Rayn et al.’s research, the AUC was 0.78 for MRI, 0.70 for MSKCCn, and 0.66 for PT, and the AUC increased after combining with MRI and was 0.80 (P = 0.003) for MRI + MSKCCn and 0.80 (P < 0.001) for MRI + PT. In another study based on 73 PCa patients that aimed to compare the mpMRI, PT, MSKCCn, and CAPRA score in predicting EPE, only the combination of MRI with CAPRA provided a significantly higher AUC than using CAPRA alone (24). This trend can also be found in our study. After combining with EPE grade, the diagnostic performance of MSKCCn + EPE grade, and CAPRA + EPE grade increased significantly relative to using MSKCCn and the CAPRA score alone. The combination of the EPE grade increased both the PPV and NPV of these clinical models, which means that compared with using clinical models alone, take the EPE grade into account would be helpful for tumor control as well as preserve patients’ function. Besides, we also combined the PSAD and PI-RADS category with EPE grade to build our own combined model. The Clinical + EPE grade model showed a higher AUC than the other clinical models, but the calibration ability of the combined model is poor. Therefore, further improvement of this model is needed for individualized risk prediction.
MRI is a well-recognized method to improve clinical-based models’ performance in the prediction of EPE; nevertheless, a few studies have reported the incremental value of clinical variables to MRI criteria. Martini et al. (25) developed a side-specific predictive model based on clinical variables and MRI for EPE. The model’s AUC was higher than MRI (82.92% vs. 68.83%, not statistically demonstrated). However, in this study, EPE on mpMRI was a binary variable, which may not be suitable for EPE evaluation in clinical practice, since it is generally acknowledged that interpretations should estimate the likelihood of pathologic EPE (14). In our research, the combination of clinical models and variables to EPE grade just showed comparable diagnostic performance to using MRI criteria alone. Compared with the EPE grade, these combined models showed decreased NPV but increased PPV, this would benefit patients from receiving nerve-sparing surgery, but increase their risk of positive surgical margins and opportunity of post-surgery treatments. Compared with clinicopathological variables, MRI could provide more visible information for EPE evaluation, and thus it might be reasonable to assume that its performance is less likely to be affected by patient cohort differences. Apart from integrating clinical factors to increase the performance of EPE grade, risk stratification is another way worth trying to make this grading system more useful in patient management and decision making (26–28).
There are several limitations to our study. First, it was a retrospective single-center study, and prospective multi-center studies are needed to evaluate the effect of EPE grade in personalized decision making. Second, the diagnostic performance for side-specific EPE statues was not reported as previous research (29), since this study aimed to compare the EPE grade with existing and thoroughly investigated clinical nomograms which were not used for side-specific purpose. A thorough and direct comparison of per-lesion EPE grade and pathologic results will be conducted in our future studies. Finally, we have not analyzed the relationship of EPE grade with surgical margin status, which would be helpful for urologists to mitigate the occurrence of positive surgical margins.
In conclusion, the EPE grade showed good and comparable performance with clinical models for evaluating EPE with well clinical utility and excellent inter- and intrareader agreements. Additionally, combination with the EPE grade could improve the diagnostic performance of clinical models.
Data Availability Statement
The original contributions presented in the study are included in the article/Supplementary Material. Further inquiries can be directed to the corresponding authors.
Ethics Statement
The studies involving human participants were reviewed and approved by Institutional Review Board of Peking Union Medical College Hospital. Written informed consent for participation was not required for this study in accordance with the national legislation and the institutional requirements.
Author Contributions
Guarantor of the article: ZJ and HS. Conception and design: HS and LX. Collection and assembly of data: GZ, LX, XZ, and XB. Data analysis and interpretation: LX, GZ, WY, YX, and HS. All authors contributed to the article and approved the submitted version.
Funding
This study has received funding by the National Natural Science Foundation of China (grant no. 91859119), the Non-profit Central Research Institute Fund of Chinese Academy of Medical Sciences (grant no. 2019XK320028), the National Natural Science Foundation of China (grant no. 81901742), the Natural Science Foundation of Beijing Municipality (grant no. 7192176), the Central University Basic Scientific Research Business Expenses Special Funds (grant no. 3332018022), the National Public Welfare Basic Scientific Research Project of Chinese Academy of Medical Sciences (grant nos. 2019PT320008 and 2018PT32003). All the funding supported equally in the design of the study and collection, analysis, and interpretation of data and in writing the manuscript.
Conflict of Interest
The authors declare that the research was conducted in the absence of any commercial or financial relationships that could be construed as a potential conflict of interest.
Supplementary Material
The Supplementary Material for this article can be found online at: https://www.frontiersin.org/articles/10.3389/fonc.2021.655093/full#supplementary-material
References
1. Siegel RL, Miller KD, Jemal A. Cancer statistics, 2019. CA: Cancer J Clin (2019) 69:7–34. doi: 10.3322/caac.21551
2. Yossepowitch O, Briganti A, Eastham JA, Epstein J, Graefen M, Montironi R, et al. Positive surgical margins after radical prostatectomy: a systematic review and contemporary update. Eur Urol (2014) 65:303–13. doi: 10.1016/j.eururo.2013.07.039
3. Jeong BC, Chalfin HJ, Lee SB, Feng ZY, Epstein JI, Trock BJ, et al. The Relationship Between the Extent of Extraprostatic Extension and Survival Following Radical Prostatectomy. Eur Urol (2015) 67:342–6. doi: 10.1016/j.eururo.2014.06.015
4. Mikel Hubanks J, Boorjian SA, Frank I, Gettman MT, Houston Thompson R, Rangel LJ, et al. The presence of extracapsular extension is associated with an increased risk of death from prostate cancer after radical prostatectomy for patients with seminal vesicle invasion and negative lymph nodes. Urol Oncol (2014) 32:26 e1–7. doi: 10.1016/j.urolonc.2012.09.002
5. Bill-Axelson A, Holmberg L, Garmo H, Taari K, Busch C, Nordling S, et al. Radical Prostatectomy or Watchful Waiting in Prostate Cancer - 29-Year Follow-up. N Engl J Med (2018) 379:2319–29. doi: 10.1056/NEJMoa1807801
6. Somford DM, Hamoen EH, Futterer JJ, van Basten JP, Hulsbergen-van de Kaa CA, Vreuls W, et al. The predictive value of endorectal 3 Tesla multiparametric magnetic resonance imaging for extraprostatic extension in patients with low, intermediate and high risk prostate cancer. J Urol (2013) 190:1728–34. doi: 10.1016/j.juro.2013.05.021
7. Mottet N, Bellmunt J, Bolla M, Briers E, Cumberbatch MG, De Santis M, et al. EAU-ESTRO-SIOG Guidelines on Prostate Cancer. Part 1: Screening, Diagnosis, and Local Treatment with Curative Intent. Eur Urol (2017) 71:618–29. doi: 10.1016/j.eururo.2016.08.003
8. Cooperberg MR, Pasta DJ, Elkin EP, Litwin MS, Latini DM, Du Chane J, et al. The University of California, San Francisco Cancer of the Prostate Risk Assessment score: a straightforward and reliable preoperative predictor of disease recurrence after radical prostatectomy. J Urol (2005) 173:1938–42. doi: 10.1097/01.ju.0000158155.33890.e7
9. Ohori M, Kattan MW, Koh H, Maru N, Slawin KM, Shariat S, et al. Predicting the presence and side of extracapsular extension: a nomogram for staging prostate cancer. J Urol (2004) 171:1844–9; discussion 9. doi: 10.1097/01.ju.0000121693.05077.3d
10. Eifler JB, Feng Z, Lin BM, Partin MT, Humphreys EB, Han M, et al. An updated prostate cancer staging nomogram (Partin tables) based on cases from 2006 to 2011. BJU Int (2013) 111:22–9. doi: 10.1111/j.1464-410X.2012.11324.x
11. Morlacco A, Sharma V, Viers BR, Rangel LJ, Carlson RE, Froemming AT, et al. The Incremental Role of Magnetic Resonance Imaging for Prostate Cancer Staging before Radical Prostatectomy. Eur Urol (2017) 71:701–4. doi: 10.1016/j.eururo.2016.08.015
12. Rayn KN, Bloom JB, Gold SA, Hale GR, Baiocco JA, Mehralivand S, et al. Added Value of Multiparametric Magnetic Resonance Imaging to Clinical Nomograms for Predicting Adverse Pathology in Prostate Cancer. J Urol (2018) 200:1041–7. doi: 10.1016/j.juro.2018.05.094
13. Heidenreich A. Consensus Criteria for the Use of Magnetic Resonance Imaging in the Diagnosis and Staging of Prostate Cancer: Not Ready for Routine Use. Eur Urol (2011) 59:495–7. doi: 10.1016/j.eururo.2011.01.013
14. Mehralivand S, Shih JH, Harmon S, Smith C, Bloom J, Czarniecki M, et al. A Grading System for the Assessment of Risk of Extraprostatic Extension of Prostate Cancer at Multiparametric MRI. Radiology (2019) 290:709–19. doi: 10.1148/radiol.2018181278
15. Park KJ, Kim MH, Kim JK. Extraprostatic Tumor Extension: Comparison of Preoperative Multiparametric MRI Criteria and Histopathologic Correlation after Radical Prostatectomy. Radiology (2020) 296:87–95. doi: 10.1148/radiol.2020192133
16. D’Amico AV, Whittington R, Malkowicz SB, Schultz D, Blank K, Broderick GA, et al. Biochemical outcome after radical prostatectomy, external beam radiation therapy, or interstitial radiation therapy for clinically localized prostate cancer. JAMA (1998) 280:969–74. doi: 10.1001/jama.280.11.969
17. Memorial Sloan Kettering Cancer Center. Prediction Tools/Prostate Cancer Nomograms: PreRadical Prostatectomy [Online]. Available at: https://www.mskcc.org/nomograms/prostate/pre_op (Accessed June 28 2020).
18. Nketiah G, Elschot M, Kim E, Teruel JR, Scheenen TW, Bathen TF, et al. T2-weighted MRI-derived textural features reflect prostate cancer aggressiveness: preliminary results. Eur Radiol (2017) 27:3050–9. doi: 10.1007/s00330-016-4663-1
19. Youden WJ. Index for rating diagnostic tests. Cancer (1950) 3:32–5. doi: 10.1002/1097-0142(1950)3:1<32::aid-cncr2820030106>3.0.co;2-3
20. Reisæter LAR, Halvorsen OJ, Beisland C, Honoré A, Gravdal K, Losnegård A, et al. Assessing Extraprostatic Extension with Multiparametric MRI of the Prostate: Mehralivand Extraprostatic Extension Grade or Extraprostatic Extension Likert Scale? Radiology: Imaging Cancer (2020) 2:e190071. doi: 10.1148/rycan.2019190071
21. Kim TH, Woo S, Han S, Suh CH, Ghafoor S, Hricak H, et al. The Diagnostic Performance of the Length of Tumor Capsular Contact on MRI for Detecting Prostate Cancer Extraprostatic Extension: A Systematic Review and Meta-Analysis. Kor J Radiol (2020) 21:684–94. doi: 10.3348/kjr.2019.0842
22. Tay KJ, Gupta RT, Brown AF, Silverman RK, Polascik TJ. Defining the Incremental Utility of Prostate Multiparametric Magnetic Resonance Imaging at Standard and Specialized Read in Predicting Extracapsular Extension of Prostate Cancer. Eur Urol (2016) 70:211–3. doi: 10.1016/j.eururo.2015.10.041
23. Padhani AR, Petralia G. Radiologists Should Integrate Clinical Risk Factors with MRI Findings for Meaningful Prostate Cancer Staging. Radiology (2020) 296:96–7. doi: 10.1148/radiol.2020201082
24. Zanelli E, Giannarini G, Cereser L, Zuiani C, Como G, Pizzolitto S, et al. Head-to-head comparison between multiparametric MRI, the partin tables, memorial sloan kettering cancer center nomogram, and CAPRA score in predicting extraprostatic cancer in patients undergoing radical prostatectomy. J Magn Reson Imaging (2019) 50:1604–13. doi: 10.1002/jmri.26743
25. Martini A, Gupta A, Lewis SC, Cumarasamy S, Haines KG 3rd, Briganti A, et al. Development and internal validation of a side-specific, multiparametric magnetic resonance imaging-based nomogram for the prediction of extracapsular extension of prostate cancer. BJU Int (2018) 122:1025–33. doi: 10.1111/bju.14353
26. McClure TD, Margolis DJ, Reiter RE, Sayre JW, Thomas MA, Nagarajan R, et al. Use of MR imaging to determine preservation of the neurovascular bundles at robotic-assisted laparoscopic prostatectomy. Radiology (2012) 262:874–83. doi: 10.1148/radiol.11103504
27. Park BH, Jeon HG, Jeong BC, Seo SI, Lee HM, Choi HY, et al. Influence of magnetic resonance imaging in the decision to preserve or resect neurovascular bundles at robotic assisted laparoscopic radical prostatectomy. J Urol (2014) 192:82–8. doi: 10.1016/j.juro.2014.01.005
28. Schiavina R, Bianchi L, Borghesi M, Dababneh H, Chessa F, Pultrone CV, et al. MRI Displays the Prostatic Cancer Anatomy and Improves the Bundles Management Before Robot-Assisted Radical Prostatectomy. J Endourol (2018) 32:315–21. doi: 10.1089/end.2017.0701
Keywords: prostatic neoplasms, magnetic resonance imaging, extraprostatic extension, risk assessment, pathological grade
Citation: Xu L, Zhang G, Zhang X, Bai X, Yan W, Xiao Y, Sun H and Jin Z (2021) External Validation of the Extraprostatic Extension Grade on MRI and Its Incremental Value to Clinical Models for Assessing Extraprostatic Cancer. Front. Oncol. 11:655093. doi: 10.3389/fonc.2021.655093
Received: 18 January 2021; Accepted: 17 March 2021;
Published: 01 April 2021.
Edited by:
Xuefeng Qiu, Nanjing Drum Tower Hospital, ChinaReviewed by:
Mengxia Chen, Nanjing Drum Tower Hospital, ChinaYu Fan, Peking University First Hospital, China
Copyright © 2021 Xu, Zhang, Zhang, Bai, Yan, Xiao, Sun and Jin. This is an open-access article distributed under the terms of the Creative Commons Attribution License (CC BY). The use, distribution or reproduction in other forums is permitted, provided the original author(s) and the copyright owner(s) are credited and that the original publication in this journal is cited, in accordance with accepted academic practice. No use, distribution or reproduction is permitted which does not comply with these terms.
*Correspondence: Hao Sun, c3VuaGFvX3JvYmVydEAxMjYuY29t; Zhengyu Jin, amluenlAcHVtY2guY24=
†These authors have contributed equally to this work