 Chaobin He
 Chongyu Zhao
 Jiawei Lu
 Xin Huang
 Cheng Chen
 Xiaojun Lin
- 1Department of Pancreatobiliary Surgery, State Key Laboratory of Oncology in South China, Collaborative Innovation Center for Cancer Medicine, Sun Yat-sen University Cancer Center, Guangzhou, China
- 2Department of Oncology, The Second Hospital of Dalian Medical University, Dalian, China
- 3Department of Cardiology, The First Affiliated Hospital of Dalian Medical University, Dalian, China
Background: Accumulating evidence has indicated the vital role of inflammation-based score (IBS) in predicting the prognostic outcome of cancer patients. Otherwise, their value in intrahepatic cholangiocarcinoma (iCCA) remains indistinct. The present study aimed to evaluate whether IBSs were related to survival outcomes in iCCA patients.
Method: Clinical characteristics were retrospectively collected in 399 patients diagnosed with iCCA from cohorts of Sun Yat-sen University Cancer Center (SYSUCC) and the First Hospital of Dalian Medical University (FHDMU). The survival curves were constructed with the Kaplan-Meier method and compared with the log-rank test. Univariate and multivariate analyses were conducted to determine the prognostic factors of overall survival (OS) and progression-free survival (PFS). The concordance index and the area under the time-dependent receiver operating characteristic (ROC) curves (AUROCs) were used to compare the predictive value of inflammation-based scores in terms of survival outcomes.
Results: The significant survival differences in OS and DFS were observed when patients were stratified by the modified Glasgow Prognostic Score (mGPS) (p<0.001). Multivariate analysis demonstrated that higher mGPS score was independently associated with poor OS and DFS (p<0.001). The predictive accuracy of the mGPS was superior to other IBSs (all p<0.001) in survival prediction in iCCA patients. The findings were further supported by the external validation cohort.
Conclusion: The mGPS is a sensitive, efficient, simple and widely applicable preoperative prognostic factor for iCCA patients. Thus, more effective therapy and frequent surveillance should be conducted after surgical resection in iCCA patients with higher mGPS scores.
Background
Intrahepatic cholangiocarcinoma (iCCA) is the second most common malignant tumor ranking after hepatocellular carcinoma (1). Although iCCA patients in different stages can be treated with various modalities, including surgery resection, chemotherapy, and radiation therapy, the overall incidence and mortality have shown a worldwide increase in the past decades (1, 2). Even though surgical resection provided the best chances to obtain prolonged survival, the median progression-free survival (PFS) time was reported to be merely 12 to 36 months in patients with resectable iCCA (3). To optimize risk-benefit assessments and stratify the patients for more individualized treatment, there is an urgent demand to seek an objective, sensitive and reliable prognostic marker for patients with iCCA. Currently, common prognostic markers, such as tumor margins, tumor differentiation, and lymph node metastases, are determined only after surgical resection (2). Therefore, there is continuing momentum in finding a practical pre-operative prognostic marker that could facilitate accurate patient stratification before surgery and improve therapeutic outcomes.
Inflammation, as a new hall marker of cancer (4), plays a vital role in the progression of tumors (5). Tumors produce inflammatory chemokines and cytokines and are locally infiltrated by leucocytes (6). Moreover, the activation of the ongoing systemic chronic inflammatory response will further lead to cachexia (6). According to these pieces of evidence, many inflammation-based scores (IBSs) were proved to be prognostic in various tumors, including Glasgow Prognostic Score (GPS) and modified Glasgow Prognostic Score (mGPS) (7), Prognostic Index (PI) (8), Prognostic Nutritional Index (PNI) (9), systemic immune-inflammation index (SII) (10), neutrophil to lymphocyte ratio (NLR) (11), platelet to lymphocyte ratio (PLR) (12), and lymphocyte to monocyte ratio (LMR) (13). Nonetheless, the research about reliable and valid inflammation-based scores in patients with iCCA after resection remains supplemented. Besides, most previous studies were conducted in a single center with a small number of patients and were mostly concentrated on a certain single IBS (14–17). Thus, for evaluating the validity of the IBSs in iCCA patients, a multicenter study with a large volume of patients would be necessary and imperative. According to these findings, our study aimed to find the best combination of inflammatory factors that could predict survival outcomes for iCCA patients after surgical resection.
Methods
Study Design and Patient Materials
A total of 399 patients pathologically diagnosed with iCCA from two cohorts were finally enrolled in the present study [292 patients from Sun Yat-sen University Cancer Center (SYSUCC) between January 2000 and December 2018 as the primary cohort and another 107 patients from the first affiliated hospital of Dalian Medical University (FHDMU) between May 2013 and December 2019 as the validation cohort]. The enrolling flowchart of patients was presented in Figure 1. Clinical characteristics were retrospectively aggregated from the electronic medical record and were exhibited in Table 1. This study obtained the written informed consent from all the patients and was approved by the ethics committees of two participating centers.
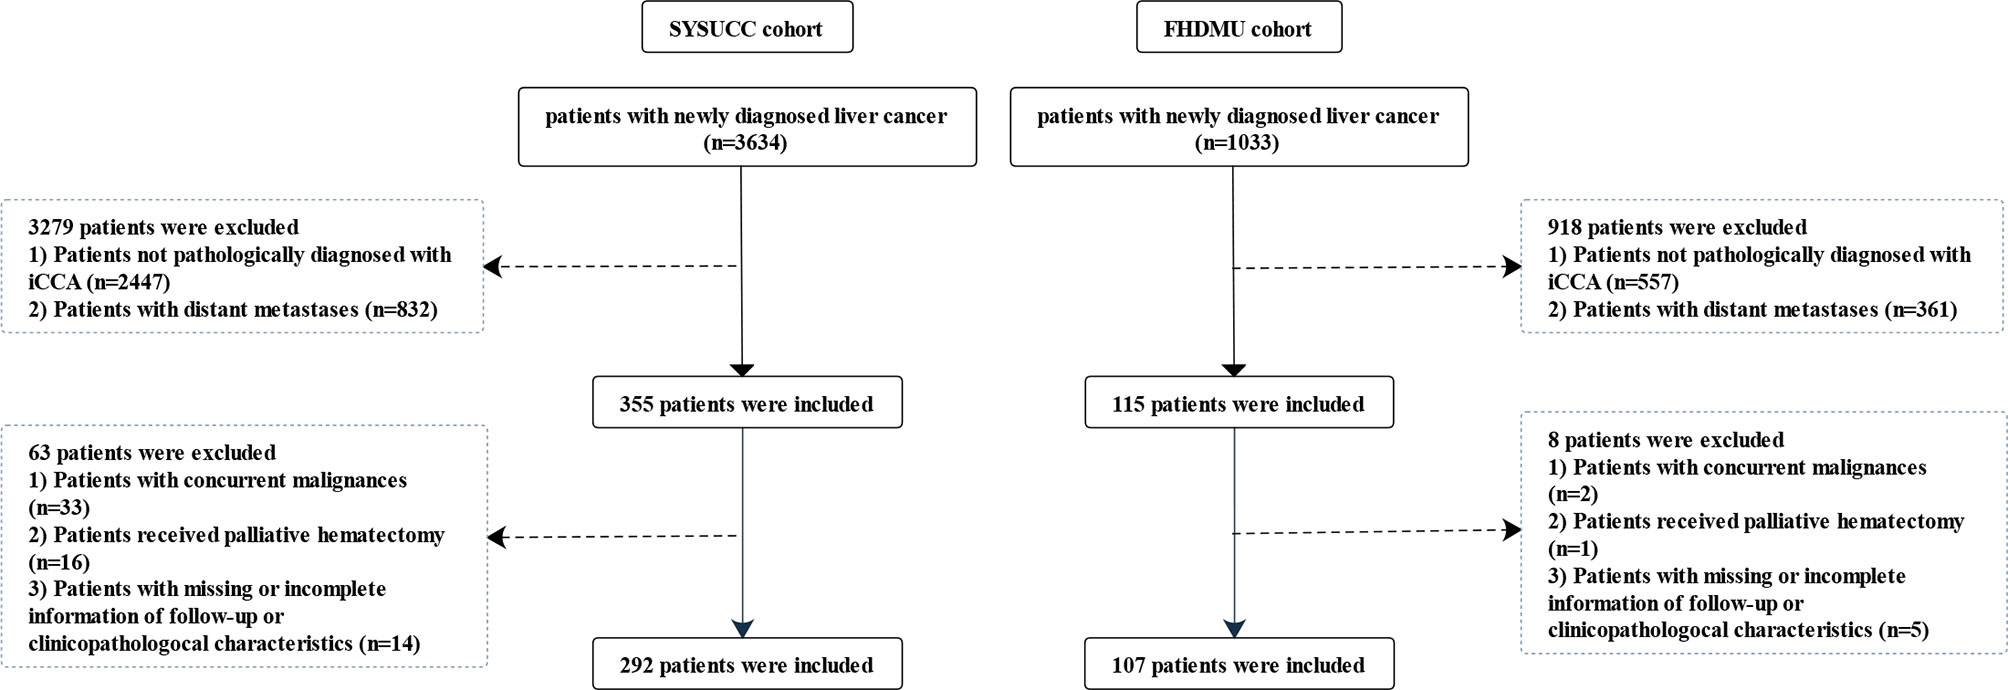
Figure 1 Flow chart of the patient enrolling process.
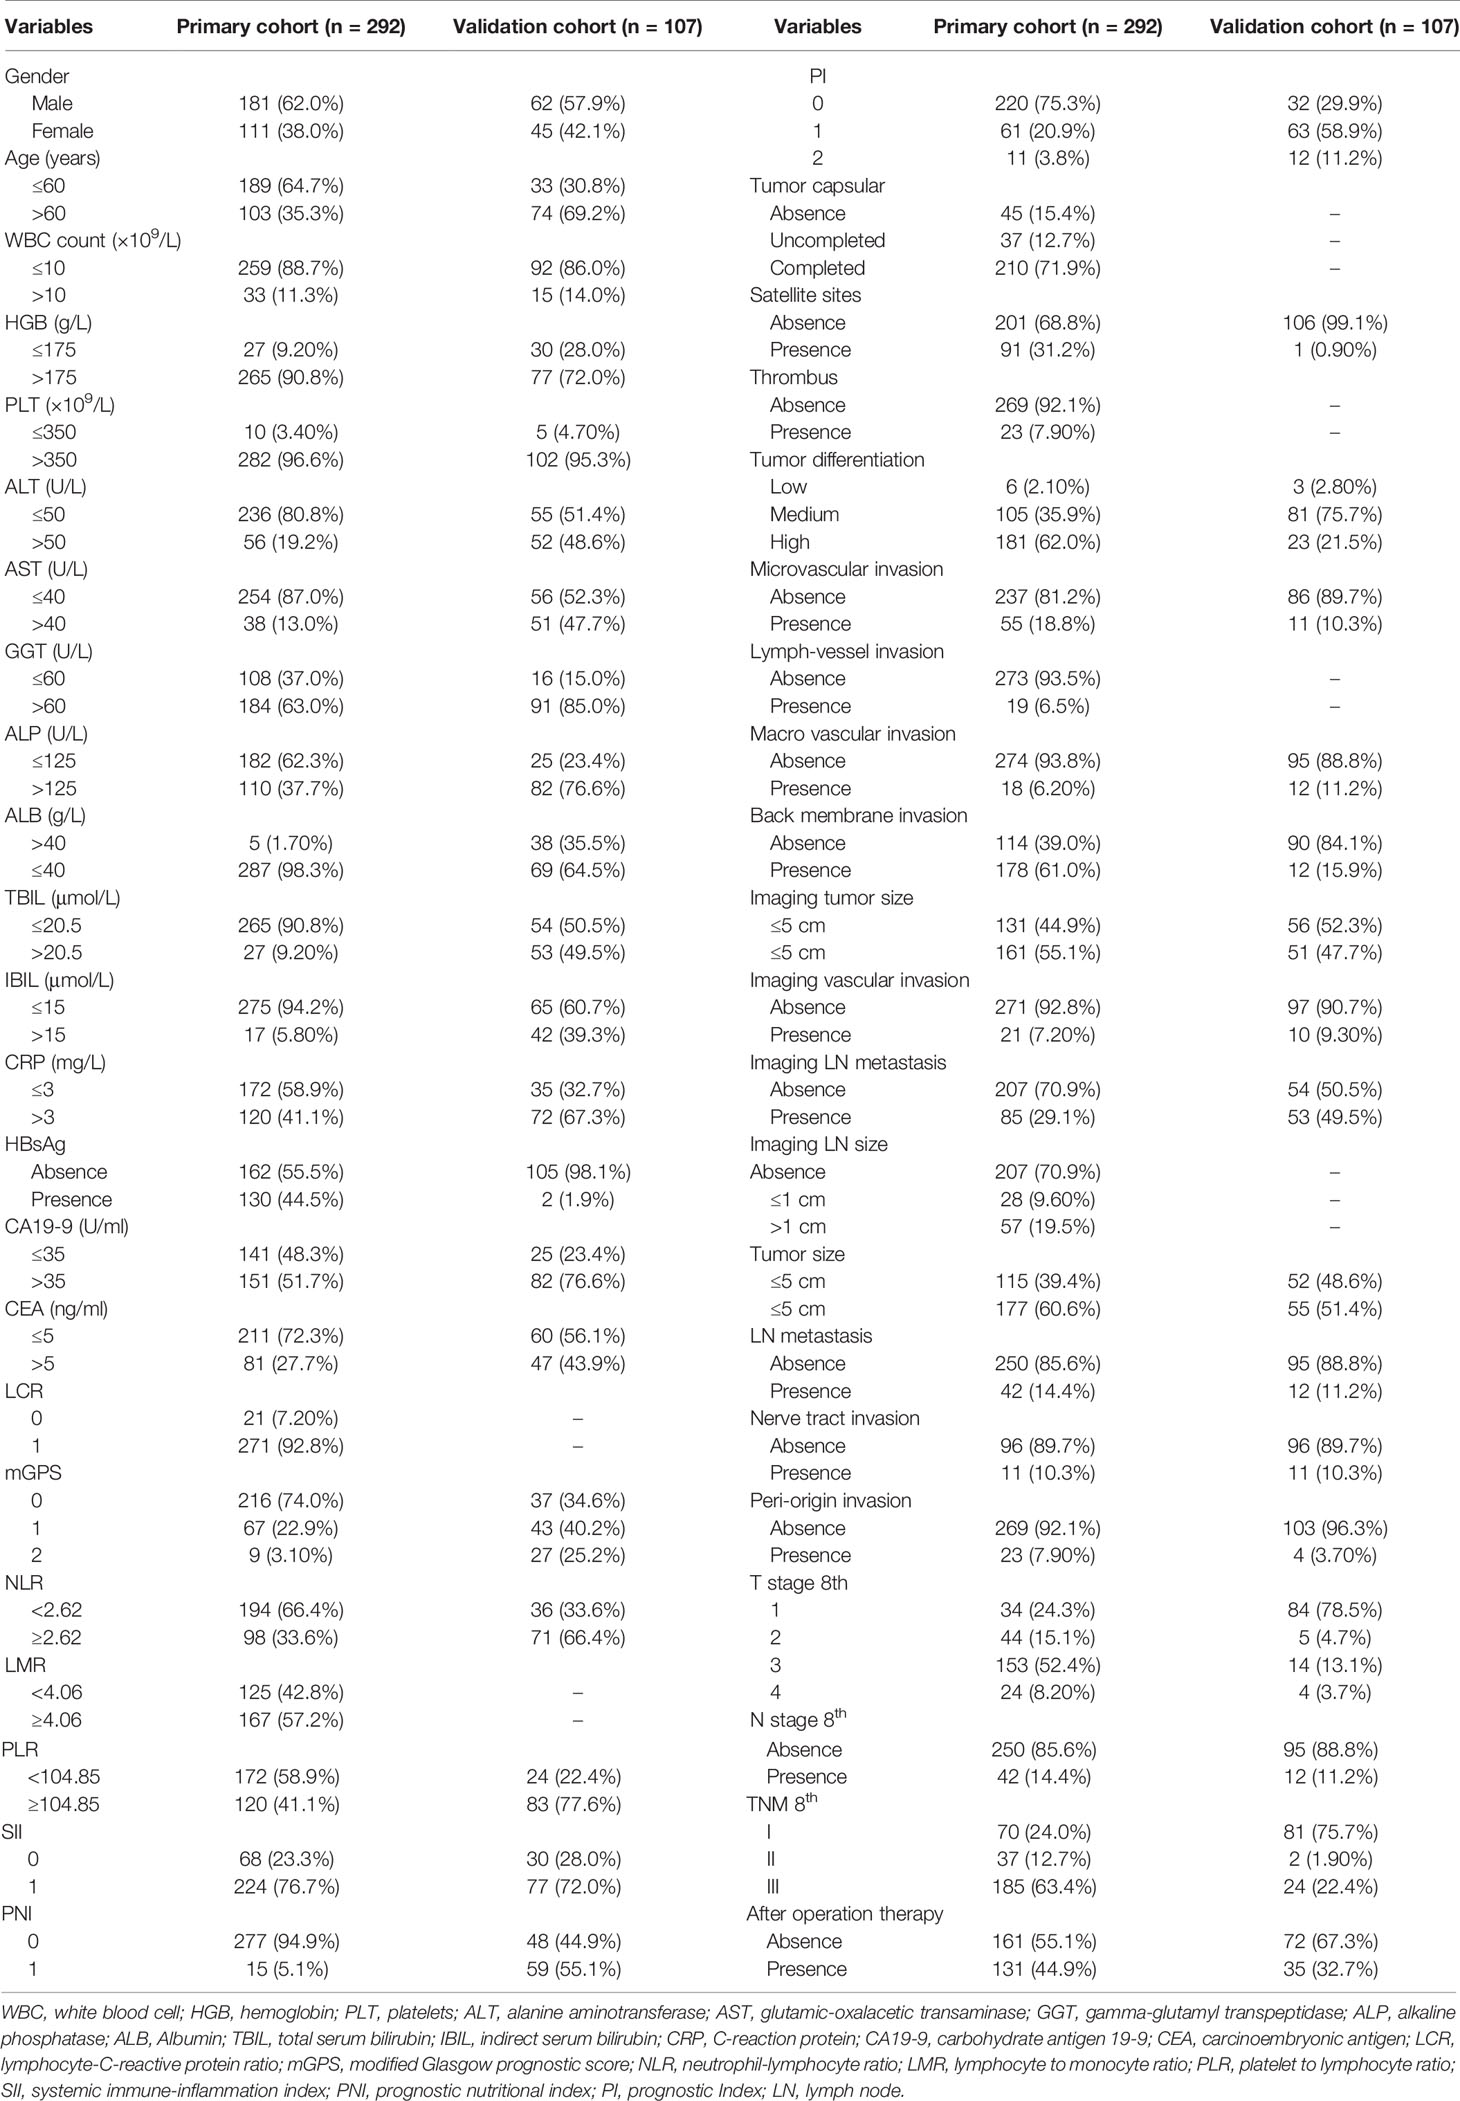
Table 1 Clinical, radiological, and pathological characteristics of the SYSUCC cohort and FHDMU cohort.
Survival Outcomes and Follow-Up
The study’s outcome variables, overall survival (OS) and PFS, were calculated from the date of surgery to the date of death and tumor progression, respectively, or the last follow-up. The first post-operative follow-up was conducted at 30 days after surgical resection, then every three months for the first year, and every six months until death or dropout. Follow-up data of two cohorts were retrieved on November 30, 2020.
Standard Management of iCCA Patients
The indications to resection and contraindications were the same in two centers of this study. The following indications to resection were followed: 1) Clinically diagnosed with iCCA according to the laboratory measurements and the imaging examinations. 2) The tumor was resectable. 3) No distant lymph-node metastasis or distant organ metastasis were observed. The contraindications included inoperable cardiopulmonary dysfunction, large volume of ascites and cachexy. Preoperative blood samples were routinely collected 1 week before surgery or at the preoperative outpatient visit. Routine laboratory measurements of differential leukocyte count and classification, including C-reactive protein (CRP), hemoglobin (HGB), platelet (PLT), tumor biomarkers (alpha-fetoprotein [AFP], carbohydrate antigen 19-9 [CA19-9], carcinoma embryonic antigen [CEA]) and blood biochemistry (serum albumin [ALB], alanine transaminase [ALT], glutamic-oxalacetic transaminase [AST], alkaline phosphatase [ALP], gamma-glutamyl transpeptidase [GGT], indirect bilirubin [IBIL], and total bilirubin [TBIL]) were carried out. The preoperative imaging evaluations for iCCA included abdomen computed tomography (CT), chest CT, pelvis CT and magnetic resonance imaging. Those patients with jaundice or dilated bile ducts routinely underwent biliary drainage. Once the regional LN metastasis was implicated in the preoperative imaging evaluations or suspected during surgery, all resectable regional LNs were dissected. The postoperative pathological stage of iCCA was classified according to the eighth AJCC TNM staging system. Moreover, the adjuvant chemotherapy was routinely implemented in the patients with more advanced or aggressive tumors, particularly those with LN metastasis.
Inflammation-Based Scores
According to our previous study (18, 19) related to the survival predicting performance of IBSs, NLR, PLR, LCR, LMR, PI, GPS, mGPS, PNI, and SII were included and calculated in this multicohort study to identify the IBS with highest accuracy to predict poor OS and PFS in iCCA patients. The details of IBSs were described in Table 2.
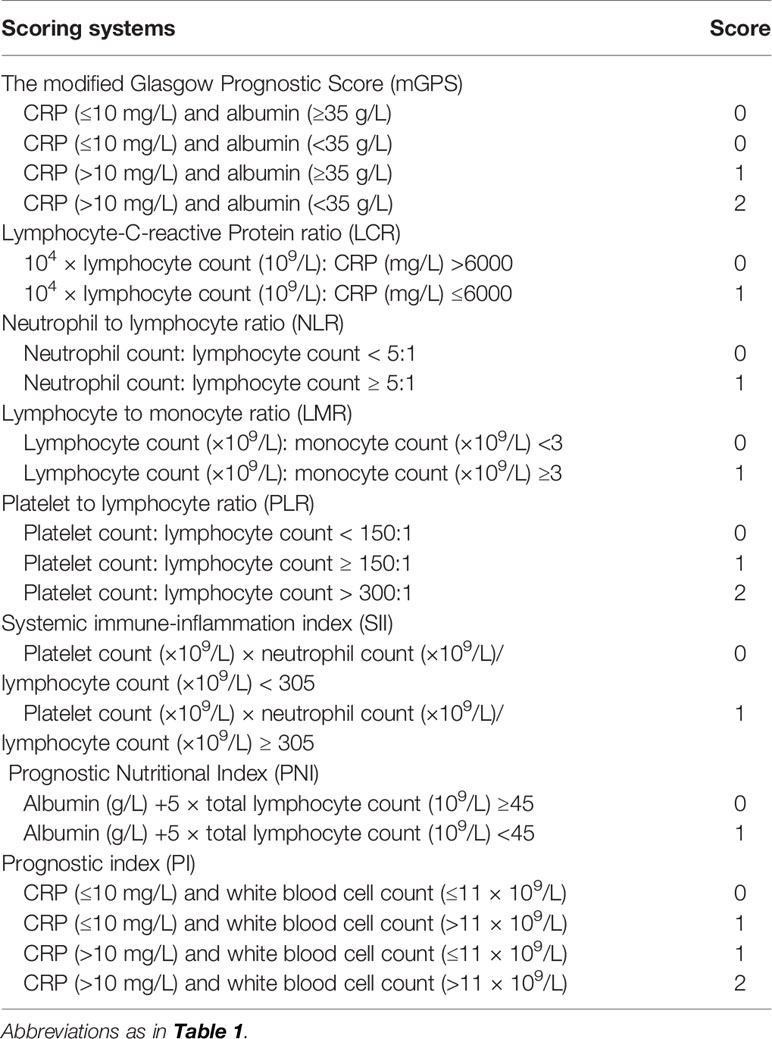
Table 2 Inflammation-based prognostic scoring systems.
Statistical Analysis
Continuous variables were reported with median and interquartile range. Categorical variables were reported with whole numbers and proportions. Proportions were compared using the chi-square test or the Fisher Exact test. Distributions of continuous variables were compared using the Mann-Whitney U test. Maximally selected rank statistic from the R package was employed to identify the optimal cutoff points of NLR, PLR and LMR. Survival curves were generated using the Kaplan-Meier method and compared with the log-rank test. The Cox regression model was used to perform the multivariate analysis of the predictive factors of OS and PFS. Time-dependent receiver operating characteristic curves (ROC) were analyzed to compare the prognostic ability of these eight inflammation-based scores. The concordance index (C-index) and the area under the ROC curves (AUROCs) were performed using R software version 3.5.0 (The R Foundation for Statistical Computing, Vienna, Austria. http://www.rproject.org). All statistical inferences were based on two-sided p values, with values <0.05 taken to indicate statistical significance.
Results
Patient Characteristics
A total of 399 patients pathological diagnosed with iCCA from two different patient cohorts were enrolled in this study. In the primary cohort, 181 male (62.0%) and 62 female (57.9%) iCCA patients with a median age of 56 years (range, 20–77 years) were enrolled. There were 70 (24.0%) patients diagnosed as TNM stage I, 37 (12.7%) patients as stage II, and 185 (63.4%) as stage III, respectively. Moreover, a majority of patients were assigned into LCR 0 (271, 92.8%), NLR< 2.62 (194, 66.4%), LMR≥ 4.06 (167, 57.2%), PLR< 104.85 (172, 58.9%), SII 1 (224, 76.7%), PNI 0 (277, 94.9%), and PI 0 (220, 75.3%), respectively. Specially, 216 (74.0%) patients had an mGPS of 0, 67 (22.9%) patients had an mGPS of 1, and 9 patients (3.1%) had an mGPS of 2. The validation cohort consisted of 62 males (57.9%) and 45 females (42.1%) with a median age of 64 years (range, 32–88 years). Slightly different from the primary cohort, a majority of patients were assigned into NLR≥2.62 (71, 66.4%), PLR≥ 104.85 (83, 77.6%), SII 1 (77, 72.0%), PNI 1 (59, 55.1%), and PI 1 (63, 58.9%) in the validation cohort, respectively. No significant differences were observed in baseline characteristics between the included patients. Further hematologic, imaging and pathological characteristics are presented in Table 1.
Survival Outcomes According to IBSs
The median OS of patients were 39.47 months (95% CI, 31.03–49.87 months) in the primary cohort, and 16.23 months (95% CI, 12.23–24.10 months) in the validation cohort, respectively. The median PFS was 11.23 months (95% CI, 8.87–14.13 months) in the primary cohort, and 12.87 months (95% CI, 10.10–16.97 months) in the validation cohort, respectively. In the primary cohort, mGPS showed an outstanding prediction of both OS (1-year OS rates: 94.4%, 29.2% and 0%; 2-year OS rates: 81.8%, 11.7%, and 0%; 3-year OS rates: 65.8%, 6.23%, 0%) and PFS (1-year PFS rates: 62.9%, 6.1%, and 0%; 2-year PFS rates: 45.8%, 6.1%, and 0%; 3-year PFS rates: 39.4%, 6.1%, 0%). Additionally, poor OS was obtained in patients with higher values of PI and NLR (all P<0.001) and lower values of LMR (P=0.023). Meanwhile, patients with higher values of PI (P<0.001), NLR (P=0.002), and lower values of LMR (P=0.045) showed poor PFS as well. All the details of OS curve and PFS curves in the primary cohort were shown in Figures 2, 3, respectively.
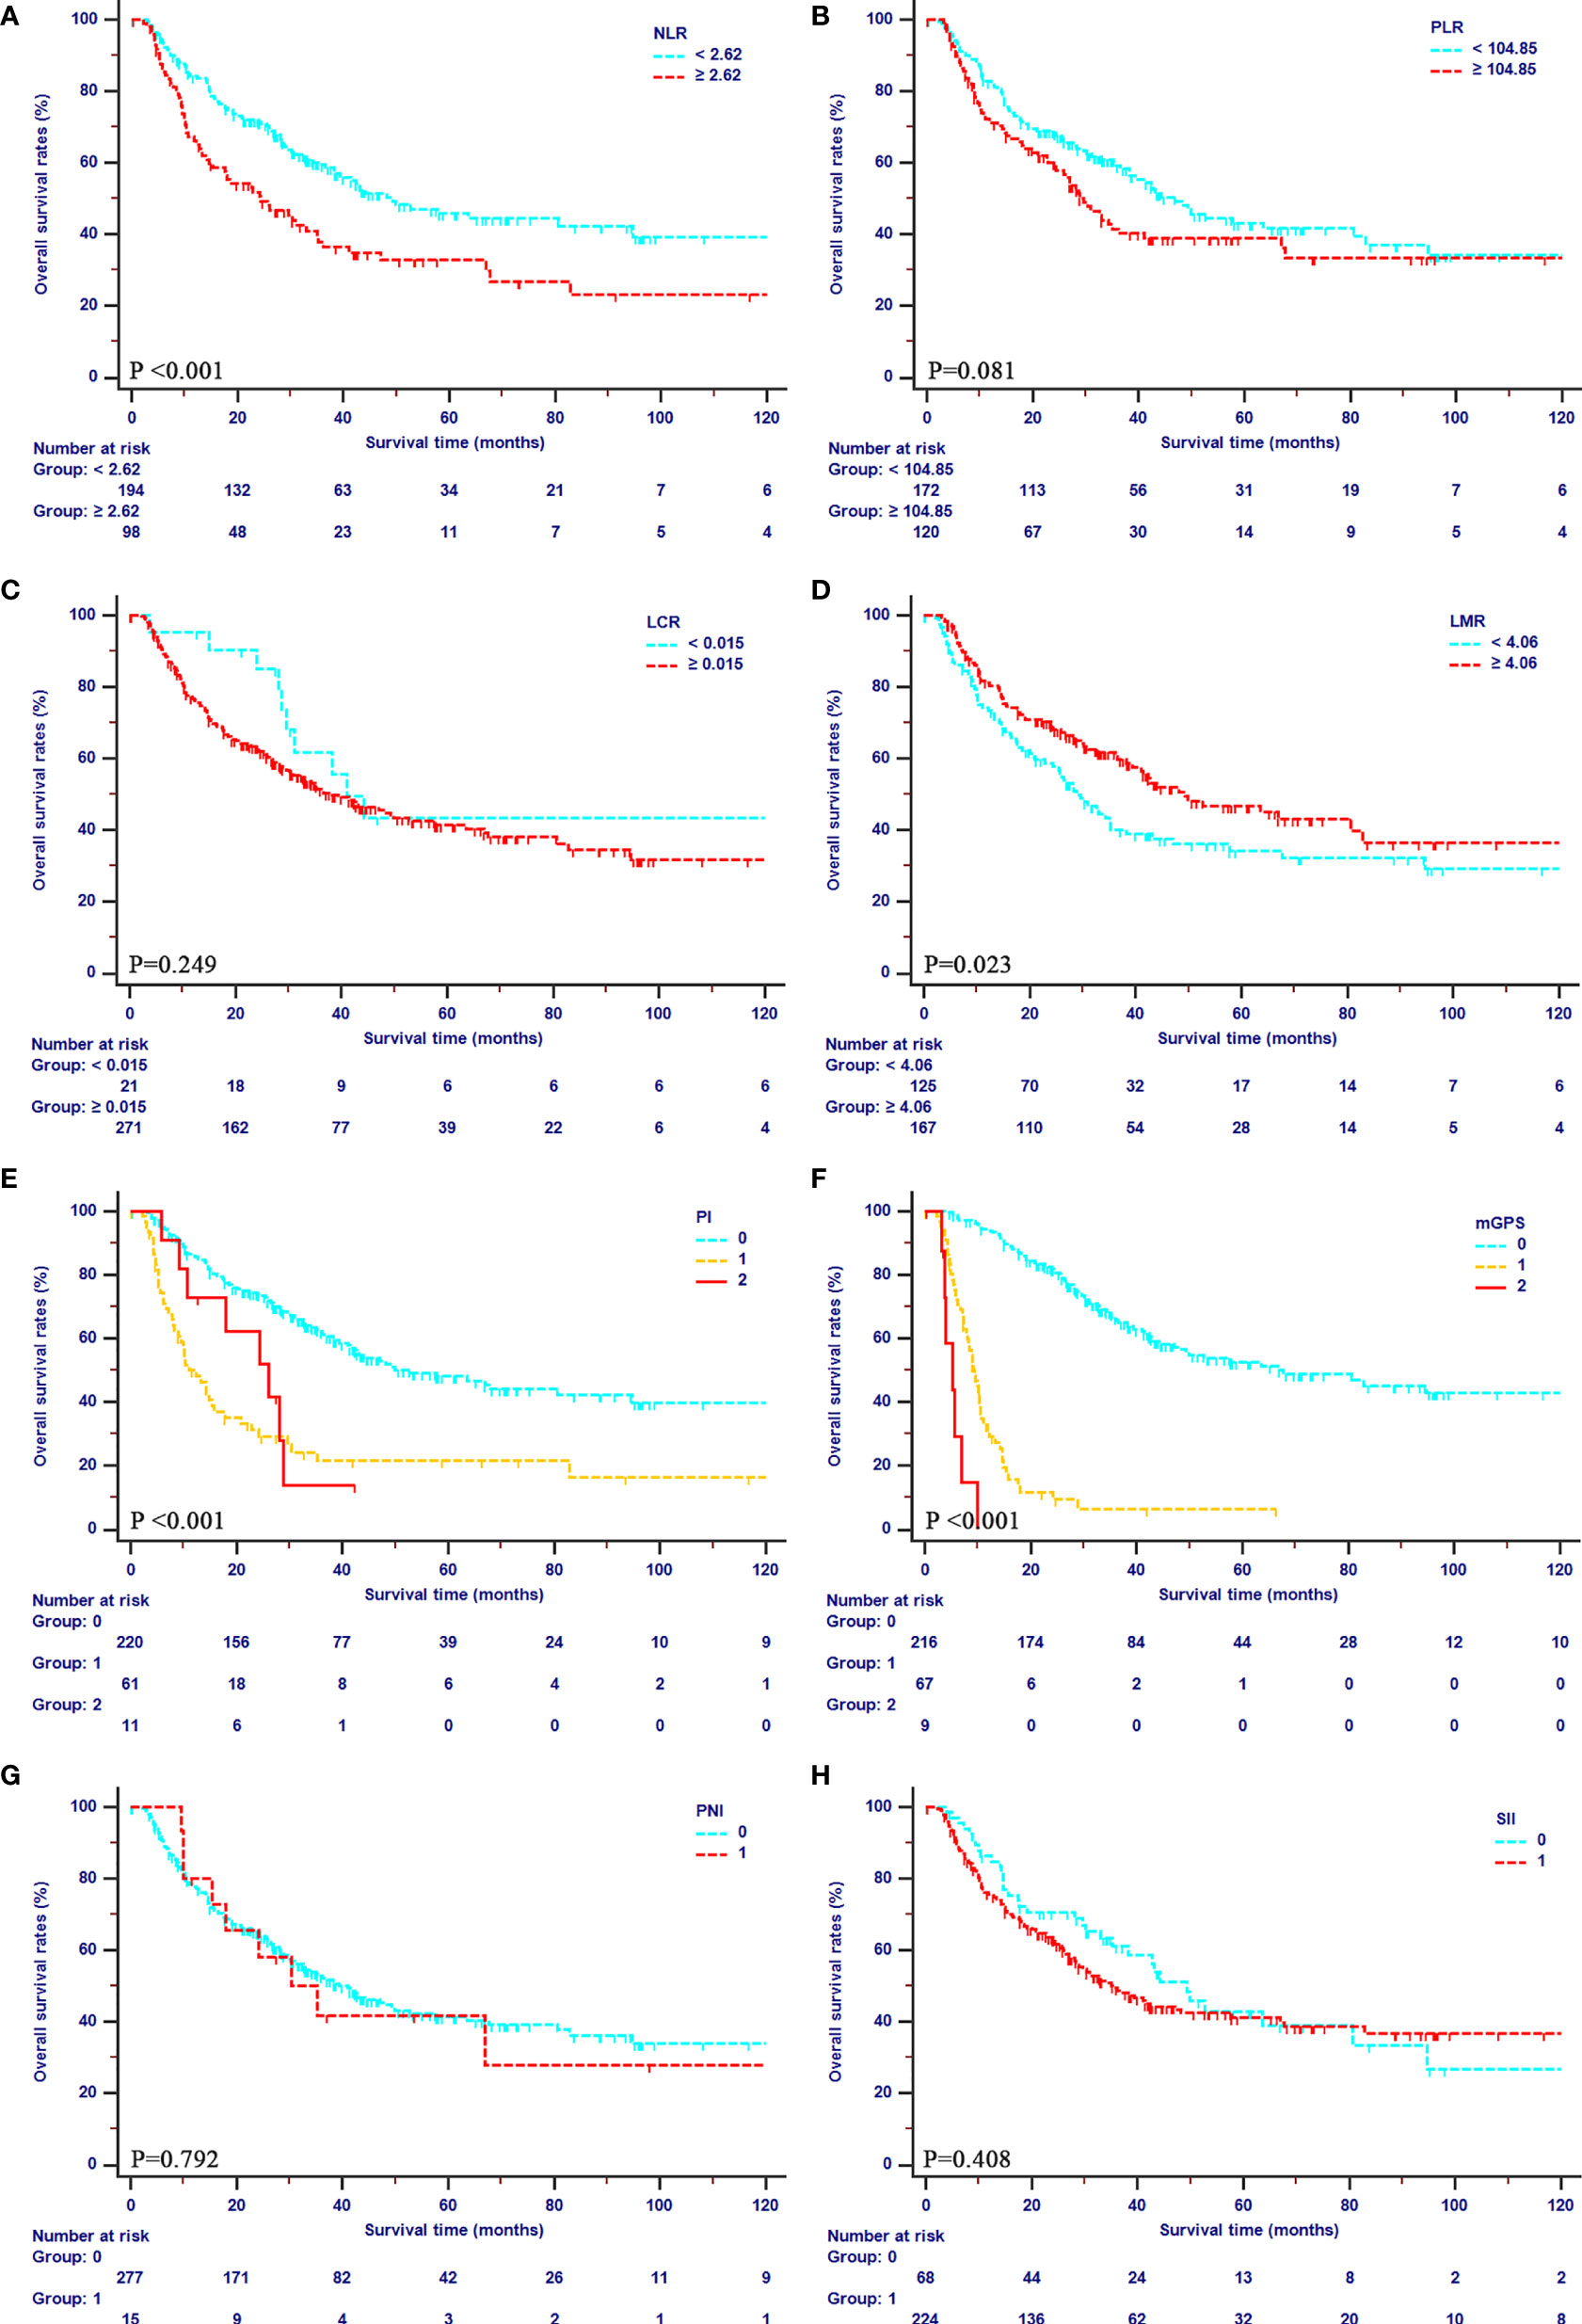
Figure 2 Kaplan-Meier curves for OS in patients with iCCA in the SYSUCC cohort stratified by the inflammation-based score systems. (A), NLR; (B), PLR; (C), LCR; (D), LMR; (E), PI; (F), mGPS; (G), PNI; (H), SII.
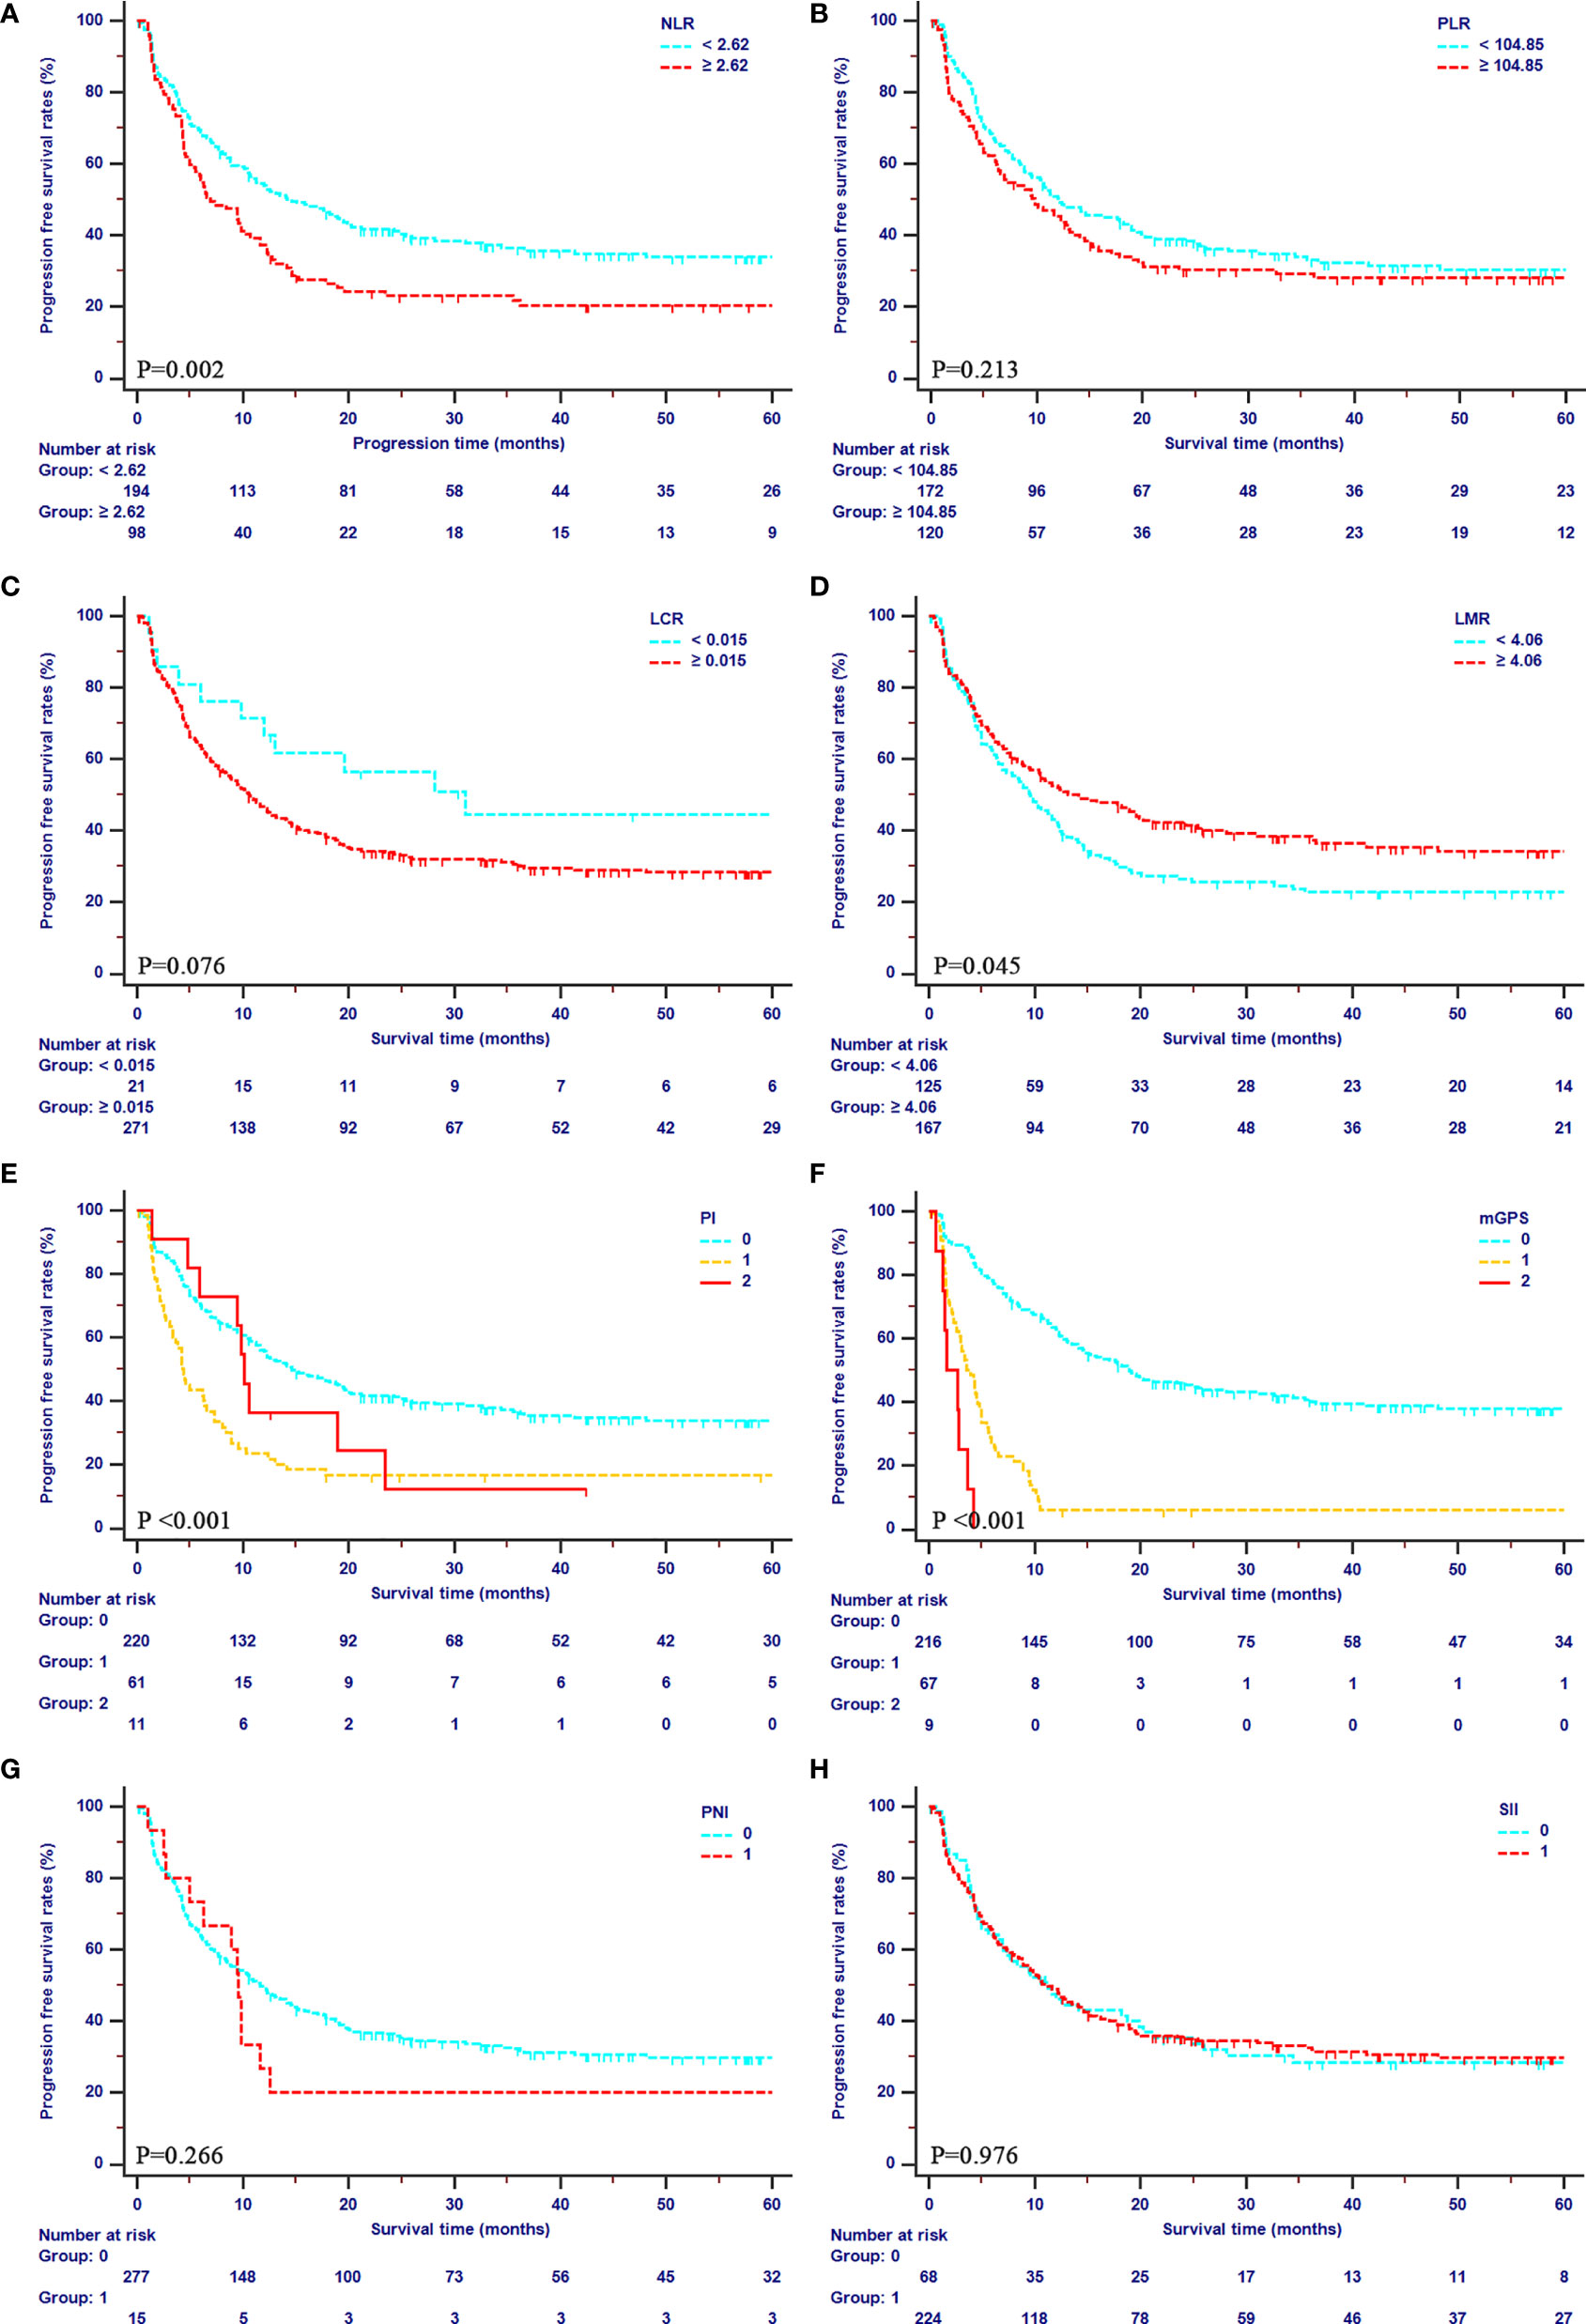
Figure 3 Kaplan-Meier curves for PFS in patients with iCCA in the SYSUCC cohort stratified by the inflammation-based score systems. (A), NLR; (B), PLR; (C), LCR; (D), LMR; (E), PI; (F), mGPS; (G), PNI; (H), SII.
Prognostic Factors for Survival Outcomes
For our primary cohort, the univariate analysis identified 22 hematological, pathological, and radiological elements and IBSs as prognostic factors for OS and PFS (Table 2). Additionally, the Cox-regression analysis was conducted to distinguish the independent risk factors of OS and PFS. In the multivariate analysis, only CA19-9 (HR, 1.568; 95% CI, 1.071–2.296; P = 0.021), CEA (HR, 1.677; 95% CI, 1.112–2.528; P = 0.014), mGPS (HR, 37.929; 95% CI, 12.609–113.367; P < 0.001), PI (HR, 0.187; 95% CI, 0.059–0.593; P = 0.004), imaging 9th LN metastasis (HR, 3.179; 95% CI, 1.092–9.256; P = 0.034), and after operation therapy (HR, 1.941; 95% CI, 1.345–2.778; P < 0.001) displayed statistical difference of OS, and the factors independently associated with PFS were: CA19-9 (HR, 1.586; 95% CI, 1.140–2.208; P = 0.006), mGPS (P < 0.001), PI (P < 0.001), imaging LN metastasis (HR, 1.462; 95% CI, 1.168–1.829; P < 0.001), and after operation therapy (HR, 3.571; 95% CI, 1.878–5.150; P < 0.001) (Table 3).
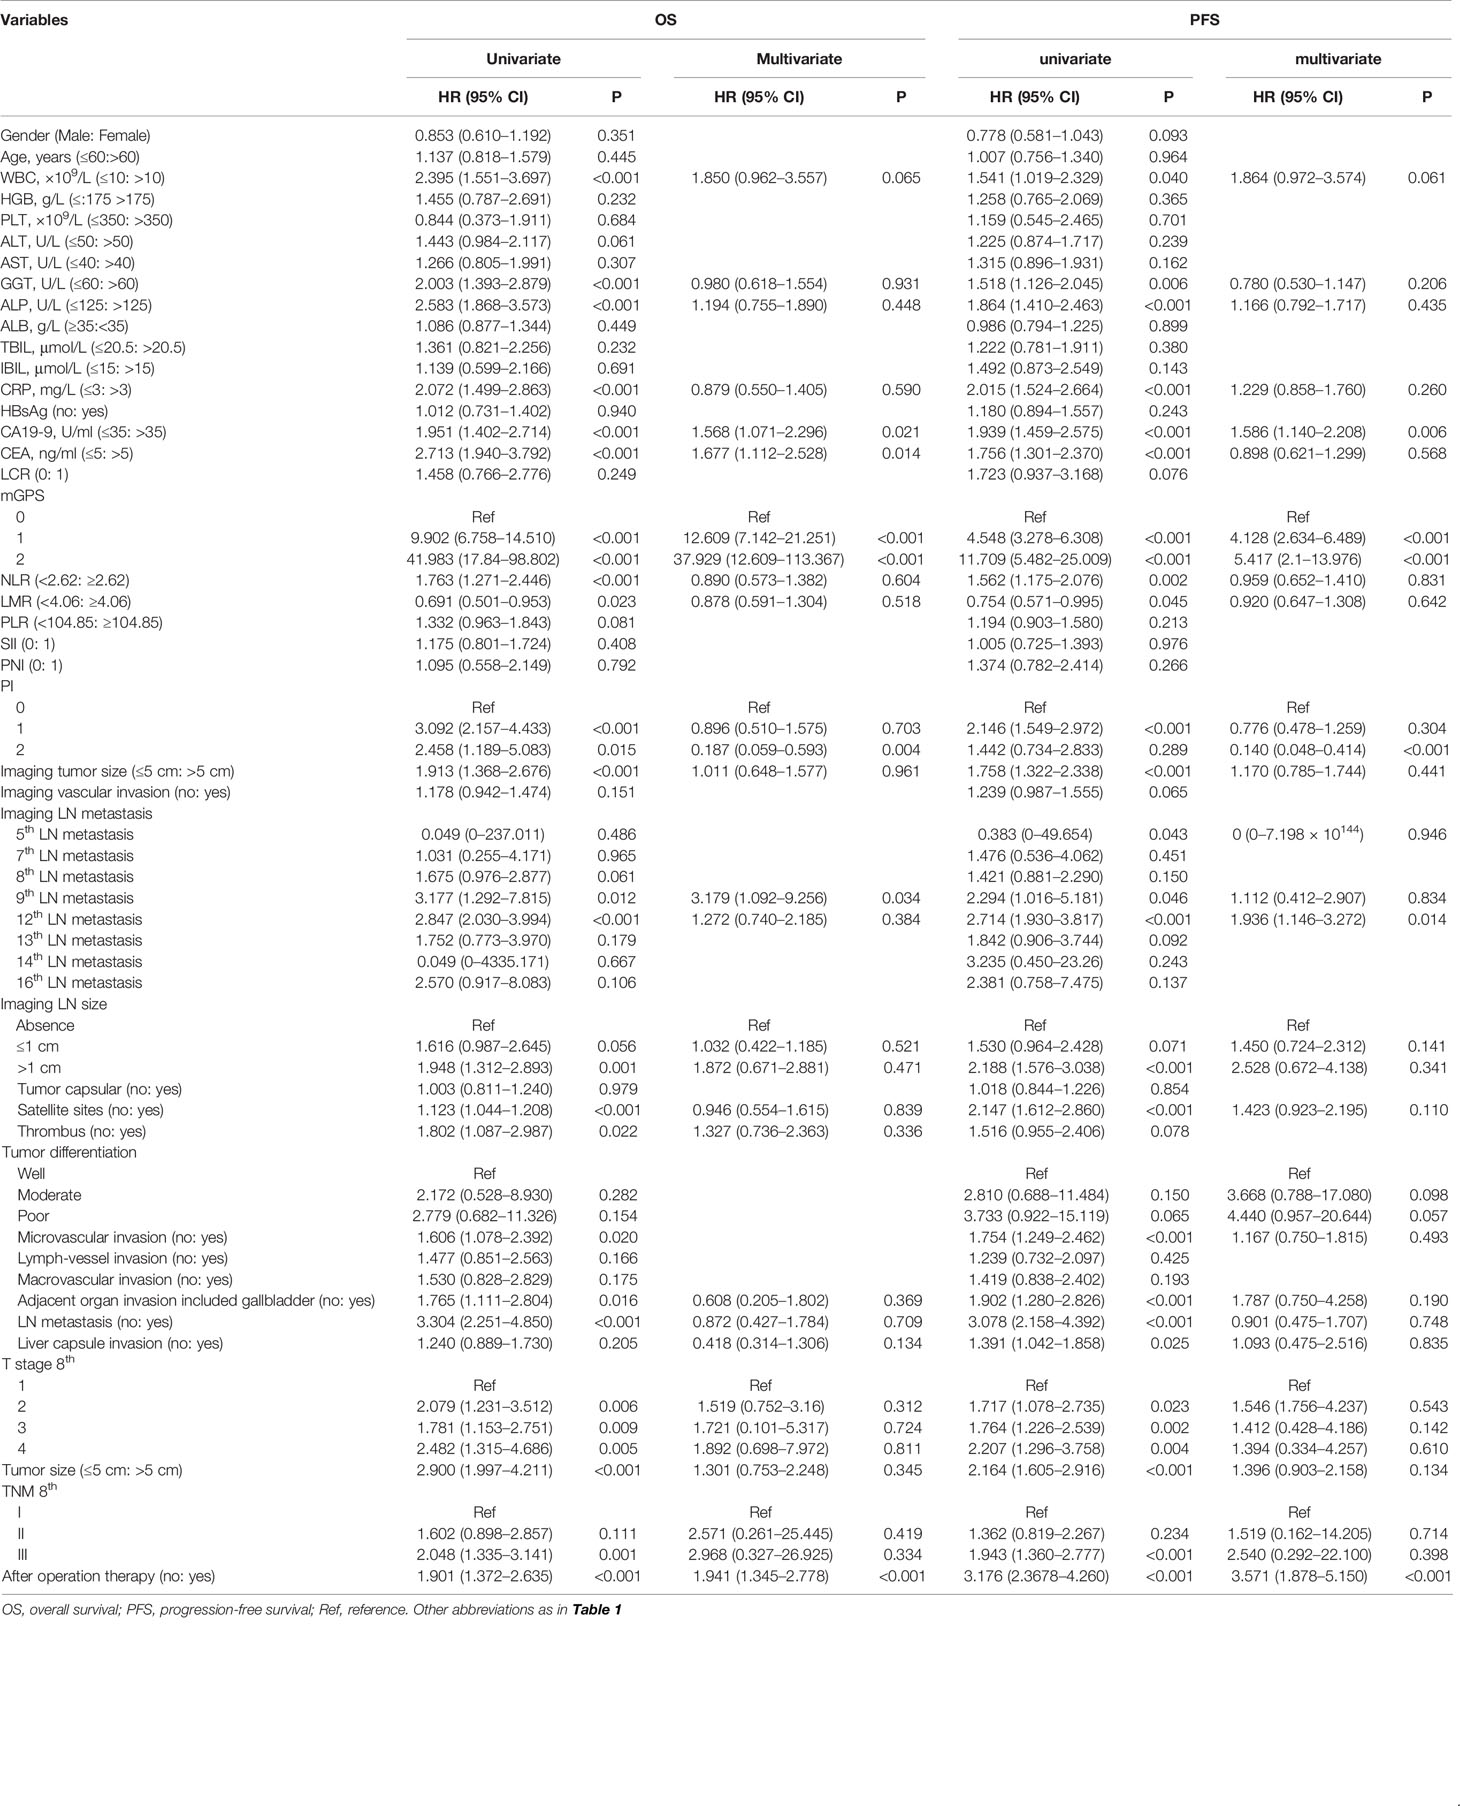
Table 3 Univariate and multivariate analyses of prognostic factors of OS and PFS in the SYSUCC cohort.
The External Validation of Significant Prognostic Factors
According to the statistic results in the primary cohort, an external validation was conducted. The significant prognostic factors, which were defined in the primary cohort, were validated in the FHDMU cohort. The multivariate analysis based on the validation cohort indicated that only mGPS was an independent prognostic factor for both OS and PFS (Table 4). In addition, survival was also well separated by mGPS in the external validation cohort (OS, 1-year rates: 79.8%, 52.2%, and 45.4%; 2-year rates: 63.9%, 24.2%, and 15.2%; 3-year rates: 60.1%, 16.1%, 12.6%; P < 0.001; PFS, 1-year rates: 66.3%, 42.4%, and 45.6%; 2-year rates: 51.9%, 23.0%, and 16.7%; 3-year rates: 39.7%, 11.5%, 8.34%; P = 0.003) (Supplementary Figure 1).
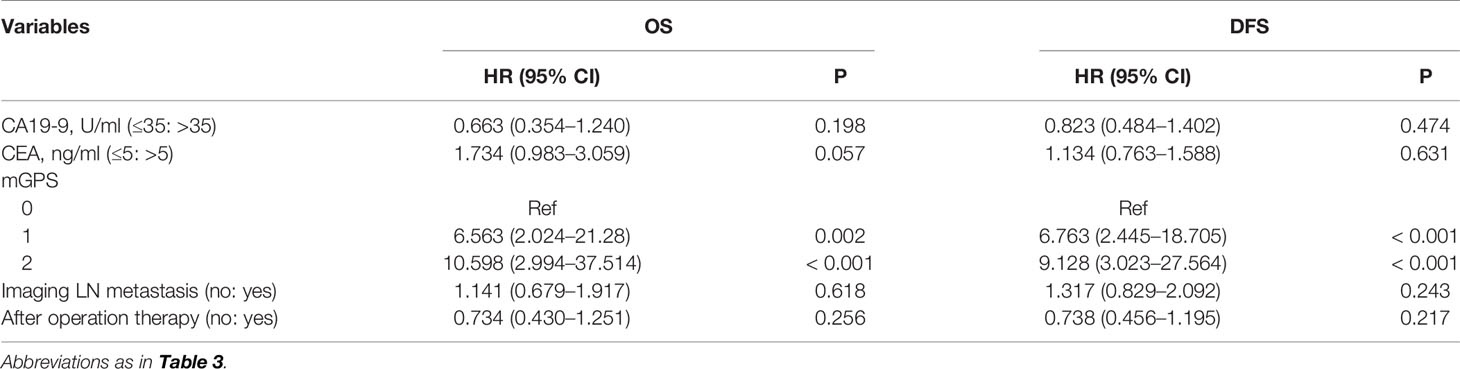
Table 4 External validation of significant prognostic factors in primary cohort.
Comparison of the Predictive Power of IBSs on Survival Outcomes in Two Cohorts
ROC curves and AUROC values were analyzed to contrast the prognostic capacity of eight IBSs in both primary (Figure 4 and Table 5) and validation cohort (Figure S2 and Table 5). The ROC curves were depicted at the 1-, 2-, 3-year follow-ups. C-index was calculated to compare the prognostic power of mGPS to other IBSs. In our primary cohort, the AUROC values of mGPS with OS (1-year 0.897, 2-year 0.813, 3-year 0.743) and PFS (1-year 0.728, 2-year 0.673, 3-year 0.661) were significantly higher than those of any other IBSs (OS: HR, 0.721; 95% CI, 0.705–0.737; all P < 0.001; PFS: HR, 0.645; 95% CI, 0.631–0.659, all P<0.001). The results of the validation cohort presented likewise similarly (OS: HR, 0.651; 95% CI, 0.585–0.717; all P < 0.001; PFS: HR, 0.623; 95% CI, 0.561–0.685; all P<0.005). Thus, the mGPS presented a more powerful prognostic prediction than other IBSs and could divide iCCA patients into subgroups with different survival outcomes more precisely.

Figure 4 Comparisons of the ROC curves for OS and PFS in the SYSUCC cohort among the inflammation-based score systems. ROC curves of OS at 1 (A), 2 (B), and 3 years (C). ROC curves of PFS at 1 (D), 2 (E), and 3 years (F).
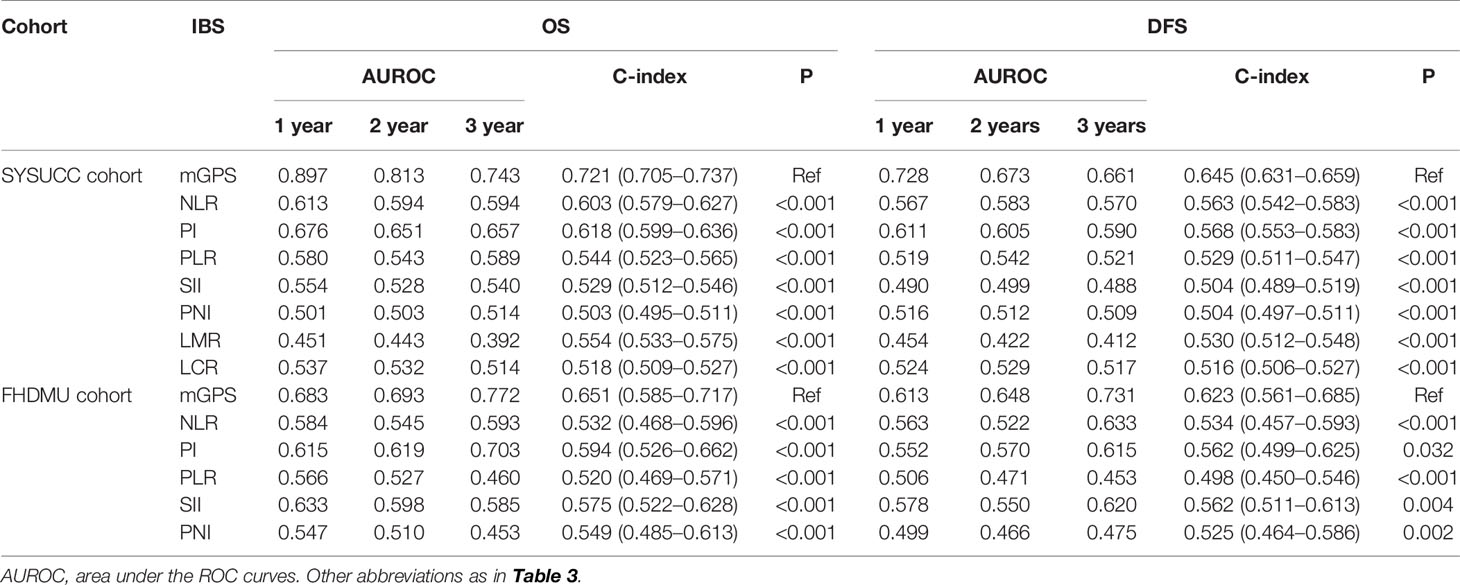
Table 5 Comparisons of the AUROC values and C-index with mGPS and other IBSs.
Discussion
Over the past decades, various progresses have been made in prophylaxis and treatment of cholangiocarcinoma (1, 2). Nevertheless, the OS and PFS of iCCA patients remained poor (3). For the prediction of prognosis, the TNM grade system has been applied as the mainstream prognostic assessment system since it was presented. However, the TNM grades can only be calculated according to the postoperative pathological factors, and the systemic inflammation level was not included in the TNM grade system. As a result, the TNM grade system cannot make a preoperative overall assessment to guide the therapeutic strategy. To fill this gap, there has been an urgent demand to explore and validate a pre-operative potential prognostic factor for patients with iCCA. IBS, as a combination inflammation index, can objectively reflect the level of inflammation, and further indicate the prognostic and outcomes of cancer patients.
The present study compared the prognostic efficacy of eight common IBSs in patients with iCCA. The univariate and multivariate analyses were further performed to verify the prognostic factors. The mGPS was identified as a significant prognostic factor for predicting OS and PFS in both SYSUCC and FHDMU cohort. Moreover, it was shown that mGPS was superior to the other IBS indexes for predicting the OS and PFS of iCCA patients. It is worth noting that classical pathological elements and TNM staging system made no significant association with the OS and PFS in this study. The probable reasons for the outcome are as follows. First, the powerful predictive performance of mGPS for OS and PFS might mask the role of pathological elements in the multivariate analysis. As a result, the pathological factors showed no significant difference in multivariate analysis. However, that was not intended to deny the predictive effect of pathological elements. As our univariate analysis presented, the TNM staging system was still a statistically significant predictor of prognosis (P = 0.003 in OS, P<0.001 in PFS). Second, the TNM system is a continuously updating and evolving standard with its graded prognostic effect remains controversial. For instance, invasive liver capsule may not adequately reflect the pathogenesis of iCCA tumor, due to the influence of tumor location and tumor size (20). Additionally, the definition of category T3 could barely indicate the biological extent of iCCA tumor (21). Moreover, the number of lymph nodes determined by preoperative imaging examinations and intraoperative findings cannot objectively indicate lymph node metastasis, which may further lead to misjudgment or underestimation of N stage (20, 21). In addition, a further analysis was conducted to elucidate the relationship between mGPS and some clinical and pathological characteristics (Supplementary Table 1). The results demonstrated that there was a significant correlation between mGPS and tumor marker (CA19-9, CEA), satellite sites, microvascular invasion, tumor size, lymph node metastasis and TNM stages. These characteristics were significantly related to the poor survival outcomes. Different from these factors, mGPS could be assessed preoperatively. It was worth noting that the CRP level was the key point between mGPS 0 group and mGPS 1/2 groups. In the present study, mGPS 0 group presented a better survival outcome than mGPS1/2 group did. This could also certify the vital role which inflammation played in tumor progression.
The GPS staging system was firstly established in inoperable non-small-cell lung cancer (22), with two major evaluative dimensions: serum ALB and CRP. Serum ALB may indicate the general status as well as the amount of lean tissue of cancer patients. Furthermore, hypoalbuminemia is also associated with cachexia. ALB has been shown to be a prognostic marker in gastric cancer (23) and pancreatic cancer (24), and the role of albumin as a marker of inflammation has been underscored by recent research in malignancy (25). In addition, iCCA, as a type of liver cancer, can weaken the synthesis function of the liver, further leading to the hypoalbuminemia. On the other hand, CRP is not only a sensitive indicator of the systemic inflammatory response. Accumulating evidence indicated the role of CRP in the tumor development and metastasis (26, 27). Theoretically, high CRP level may be due to the production of cytokines from tumor cells (26). As an acute-phase protein, CRP together with IL-6, TNF, and other cytokines further initiates or sustains the systemic inflammatory response (27). Then, inflammation promotes the tumor proliferation, angiogenesis, invasion, and metastasis as a feedback loop (4). It has been confirmed that high level of CRP was correlated with unfavorable survival in esophageal carcinoma (28), colorectal carcinoma (29), as well as multiple myeloma (30). Moreover, as a commonly used index, CRP has high sensitivity and cost-effectiveness and is easily obtained in clinical practice.
With the increasing numbers of studies about GPS and survival in patients with cancers, researchers found that hypoalbuminemia regularly occurred with elevated CRP levels (31). Moreover, the survival outcomes of patients with hypoalbuminemia alone were significantly better than patients with elevated CRP levels, indicating that CRP played a more important role in survival prediction. In case of that, GPS was modified into mGPS (32). Since then, the modified GPS has been occupied in colorectal cancer (32), hepatocellular carcinoma, esophageal cancer (33), and ovarian cancer (34) and simultaneously presented robust prognostic prediction. Significantly, this is the very first study which evaluating the prognostic prediction of the common IBSs in iCCA patients. In this large, multicenter cohort study, we compared the survival curves of these eight frequently used IBSs. Surprisingly, mGPS was not only the independent prognostic factor of OS (P < 0.001) and PFS (P < 0.001) in both of our cohorts, it presented the most powerful performance of prognostic prediction in the common IBSs (all P < 0.005). Similarly, mGPS also presented prominent prognostic manifestations in perihilar cholangiocarcinoma (35) and biliary tract cancer (36) in previous studies. Furthermore, by contrast with the pathological prognostic factors, mGPS, as an inflammation-based score, could make the pre-operative prediction of cancer patients to facilitate accurate stratification and further improve the survival outcomes. Besides, assessments of serum albumin and CRP are simple and inexpensive compared to genetic assessments, which are complicated and expensive.
According to the results of the present study, the treatment strategies of patients with higher mGPS should be optimized. Clinical staff should be especially caution about the indications and contraindications of operation and take careful consideration about the overall healthy situation of these patients. The shorter follow-up intervals were conducive to earlier detection of tumor recurrence or progression. And this would further provide an opportunity for early medical intervention in recurrence. Moreover, the inclusion of routine postoperative chemotherapy in the overall treatment strategies may be beneficial.
Certain limitations of the present study merit discussion. First, the retrospective nature is a potential limitation; we enrolled two cohorts from different regions to restrain this limitation. Second, improvements in perioperative management and treatment methods may lead to the heterogeneous antitumor treatments of our patients’ cohorts and further interfere with the result of the present study. Third, the underlying mechanism of mGPS and poor survival outcome has not been fully demonstrated. Finally, further extensive trans-regional studies were needed to verify the prognostic power of mGPS in iCCA patients.
In conclusion, the present study, we identified mGPS as a sensitive, efficient, simple, rapid, and widely applicable preoperative prognostic factor for iCCA patients. Elevated mGPS scores indicated poor prognosis for these patients. Thus, more effective therapy and frequent surveillance after treatment should be conducted for the iCCA patients with higher mGPS scores.
Data Availability Statement
The raw data supporting the conclusions of this article will be made available by the authors, without undue reservation.
Ethics Statement
The studies involving human participants were reviewed and approved by the institutional review board of Sun Yat-sen University Cancer Center and the first affiliated hospital of Dalian Medical University. The patients/participants provided their written informed consent to participate in this study.
Author Contributions
Study concept: XL. Study design: CH, CZ, and JL. Drafting of the manuscript: CH, CZ, and JL. Data collecting: CH, CZ, JL, CC, and XH. Data analysis: CH, CZ, JL, and XH. Critical revision of the manuscript: XL. All authors contributed to the article and approved the submitted version.
Funding
This study was supported by the funding of Guangdong Basic and Applied Basic Research Foundation (2020A1515110954) and the funding of Sun Yat-sen University Grant for Medical Humanities Practice and Teaching (no. 23000-18008023).
Conflict of Interest
The authors declare that the research was conducted in the absence of any commercial or financial relationships that could be construed as a potential conflict of interest.
Acknowledgments
We acknowledge the Medical Records Department of Sun Yat-sen University Cancer Center for collecting the survival data of the patients. We thank the patients who were included in this study.
Supplementary Material
The Supplementary Material for this article can be found online at: https://www.frontiersin.org/articles/10.3389/fonc.2021.672607/full#supplementary-material
Supplementary Figure 1 | Kaplan-Meier curves for OS (A) and PFS (B) in patients with iCCA in the FHDMU cohort stratified by the mGPS.
Supplementary Figure 2 | Comparisons of the ROC curves for OS and PFS in the FHDMU cohort among the inflammation-based score systems. ROC curves of OS at 1 (A), 2 (B), and 3 years (C). ROC curves of PFS at 1 (D), 2 (E), and 3 years (F).
References
1. Rizvi S, Khan SA, Hallemeier CL, Kelley RK, Gores GJ. Cholangiocarcinoma - Evolving Concepts and Therapeutic Strategies. Nat Rev Clin Oncol (2018) 15(2):95–111. doi: 10.1038/nrclinonc.2017.157
2. Razumilava N, Gores GJ. Cholangiocarcinoma. Lancet (9935) 2014:2168–79:383. doi: 10.1016/S0140-6736(13)61903-0
3. Bridgewater J, Galle PR, Khan SA, Llovet JM, Park JW, Patel T, et al. Guidelines for the Diagnosis and Management of Intrahepatic Cholangiocarcinoma. J Hepatol (2014) 60(6):1268–89. doi: 10.1016/j.jhep.2014.01.021
4. Hanahan D, Weinberg RA. Hallmarks of Cancer: The Next Generation. Cell (2011) 144(5):646–74. doi: 10.1016/j.cell.2011.02.013
5. Diakos CI, Charles KA, McMillan DC, Clarke SJ. Cancer-Related Inflammation and Treatment Effectiveness. Lancet Oncol (2014) 15(11):e493–503. doi: 10.1016/S1470-2045(14)70263-3
6. Grivennikov SI, Greten FR, Karin M. Immunity, Inflammation, and Cancer. Cell (2010) 140(6):883–99. doi: 10.1016/j.cell.2010.01.025
7. Wang C, He W, Yuan Y, Zhang Y, Li K, Zou R, et al. Comparison of the Prognostic Value of Inflammation-Based Scores in Early Recurrent Hepatocellular Carcinoma After Hepatectomy. Liver Int (2020) 40(1):229–39. doi: 10.1111/liv.14281
8. Kasymjanova NM G, Agulnik JS, V. Cohen MD. The Predictive Value of Pre-Treatment Inflammatory Markers in Advanced Non-Small-Cell Lung Cancer. Biomarkers IN Oncol (2010) 17:52. doi: 10.3747/co.v17i4.567
9. Miao J, Xiao W, Wang L, Han F, Wu H, Deng X, et al. The Value of the Prognostic Nutritional Index (PNI) in Predicting Outcomes and Guiding the Treatment Strategy of Nasopharyngeal Carcinoma (NPC) Patients Receiving Intensity-Modulated Radiotherapy (IMRT) With or Without Chemotherapy. J Cancer Res Clin Oncol (2017) 143(7):1263–73. doi: 10.1007/s00432-017-2360-3
10. Hu B, Yang XR, Xu Y, Sun YF, Sun C, Guo W, et al. Systemic Immune-Inflammation Index Predicts Prognosis of Patients After Curative Resection for Hepatocellular Carcinoma. Clin Cancer Res (2014) 20(23):6212–22. doi: 10.1158/1078-0432.CCR-14-0442
11. Templeton AJ, McNamara MG, Seruga B, Vera-Badillo FE, Aneja P, Ocana A, et al. Prognostic Role of Neutrophil-to-Lymphocyte Ratio in Solid Tumors: A Systematic Review and Meta-Analysis. J Natl Cancer Inst (2014) 106(6):dju124. doi: 10.1093/jnci/dju124
12. Cannon NA, Meyer J, Iyengar P, Ahn C, Westover KD, Choy H, et al. Neutrophil-Lymphocyte and Platelet-Lymphocyte Ratios as Prognostic Factors After Stereotactic Radiation Therapy for Early-Stage Non-Small-Cell Lung Cancer. J Thorac Oncol (2015) 10(2):280–5. doi: 10.1097/JTO.0000000000000399
13. Chan JC, Chan DL, Diakos CI, Engel A, Pavlakis N, Gill A, et al. The Lymphocyte-to-Monocyte Ratio is a Superior Predictor of Overall Survival in Comparison to Established Biomarkers of Resectable Colorectal Cancer. Ann Surg (2017) 265(3):539–46. doi: 10.1097/SLA.0000000000001743
14. Zhang Y, Shi SM, Yang H, Yang LX, Wang Z, Li XD, et al. Systemic Inflammation Score Predicts Survival in Patients With Intrahepatic Cholangiocarcinoma Undergoing Curative Resection. J Cancer (2019) 10(2):494–503. doi: 10.7150/jca.26890
15. Wu Y, Ren F, Chai Y, Xue Z, Shen C, Zhang X, et al. Prognostic Value of Inflammation-Based Indexes for Intrahepatic Cholangiocarcinoma Following Curative Resection. Oncol Lett (2019) 17(1):165–74. doi: 10.3892/ol.2018.9618
16. Lin J, Fang T, Zhu M, Xu X, Zhang J, Zheng S, et al. Comparative Performance of Inflammation-Based Prognostic Scores in Patients Operated for Intrahepatic Cholangiocarcinoma. Cancer Manag Res (2019) 11:9107–19. doi: 10.2147/CMAR.S198959
17. Cho H, Yoo C, Kim KP, Jeong JH, Kang J, Chang HM, et al. Prognostic Implication of Inflammation-Based Prognostic Scores in Patients With Intrahepatic Cholangiocarcinoma Treated With First-Line Gemcitabine Plus Cisplatin. Invest New Drugs (2018) 36(3):496–502. doi: 10.1007/s10637-017-0548-7
18. Sun S, He C, Wang J, Huang X, Wu J, Li S. The Prognostic Significance of Inflammation-Based Scores in Patients With Ampullary Carcinoma After Pancreaticoduodenectomy. BMC Cancer (2020) 20(1):981. doi: 10.1186/s12885-020-07482-0
19. He CB, Lin XJ. Inflammation Scores Predict the Survival of Patients With Hepatocellular Carcinoma Who Were Treated With Transarterial Chemoembolization and Recombinant Human Type-5 Adenovirus H101. PLoS One (2017) 12(3):e0174769. doi: 10.1371/journal.pone.0174769
20. Spolverato G, Bagante F, Weiss M, Alexandrescu S, Marques HP, Aldrighetti L, et al. Comparative Performances of the 7th and the 8th Editions of the American Joint Committee on Cancer Staging Systems for Intrahepatic Cholangiocarcinoma. J Surg Oncol (2017) 115(6):696–703. doi: 10.1002/jso.24569
21. Kang SH, Hwang S, Lee YJ, Kim KH, Ahn CS, Moon DB, et al. Prognostic Comparison of the 7th and 8th Editions of the American Joint Committee on Cancer Staging System for Intrahepatic Cholangiocarcinoma. J Hepatobiliary Pancreat Sci (2018) 25(4):240–8. doi: 10.1002/jhbp.543
22. Forrest LM, McMillan DC, McArdle CS, Angerson WJ, Dunlop DJ. Evaluation of Cumulative Prognostic Scores Based on the Systemic Inflammatory Response in Patients With Inoperable Non-Small-Cell Lung Cancer. Br J Cancer (2003) 89(6):1028–30. doi: 10.1038/sj.bjc.6601242
23. Lien YC, Hsieh CC, Wu YC, Hsu HS, Hsu WH, Wang LS, et al. Preoperative Serum Albumin Level is a Prognostic Indicator for Adenocarcinoma of the Gastric Cardia. J Gastrointest Surg (2004) 8(8):1041–8. doi: 10.1016/j.gassur.2004.09.033
24. Siddiqui A, Heinzerling J, Livingston EH, Huerta S. Predictors of Early Mortality in Veteran Patients With Pancreatic Cancer. Am J Surg (2007) 194(3):362–6. doi: 10.1016/j.amjsurg.2007.02.007
25. Friedman AN, Fadem SZ. Reassessment of Albumin as a Nutritional Marker in Kidney Disease. J Am Soc Nephrol (2010) 21(2):223–30. doi: 10.1681/ASN.2009020213
26. Hashimoto K, Ikeda Y, Korenaga D, Tanoue K, Hamatake M, Kawasaki K, et al. The Impact of Preoperative Serum C-Reactive Protein on the Prognosis of Patients With Hepatocellular Carcinoma. Cancer (2005) 103(9):1856–64. doi: 10.1002/cncr.20976
27. Sieghart W, Pinter M, Hucke F, Graziadei I, Schoniger-Hekele M, Muller C, et al. Single Determination of C-Reactive Protein at the Time of Diagnosis Predicts Long-Term Outcome of Patients With Hepatocellular Carcinoma. Hepatology (2013) 57(6):2224–34. doi: 10.1002/hep.26057
28. Ikeda M, Natsugoe S, Ueno S, Baba M, Aikou T. Significant Host- and Tumor-Related Factors for Predicting Prognosis in Patients With Esophageal Carcinoma. Ann Surg (2003) 238(2):197–202. doi: 10.1097/01.sla.0000080822.22415.cb
29. McMillan DC, Canna K, McArdle CS. Systemic Inflammatory Response Predicts Survival Following Curative Resection of Colorectal Cancer. Br J Surg (2003) 90(2):215–9. doi: 10.1002/bjs.4038
30. Terpos E, Szydlo R, Apperley JF, Hatjiharissi E, Politou M, Meletis J, et al. Soluble Receptor Activator of Nuclear Factor Kappab Ligand-Osteoprotegerin Ratio Predicts Survival in Multiple Myeloma: Proposal for a Novel Prognostic Index. Blood (2003) 102(3):1064–9. doi: 10.1182/blood-2003-02-0380
31. Al Murri AM, Bartlett JM, Canney PA, Doughty JC, Wilson C, McMillan DC. Evaluation of an Inflammation-Based Prognostic Score (GPS) in Patients With Metastatic Breast Cancer. Br J Cancer (2006) 94(2):227–30. doi: 10.1038/sj.bjc.6602922
32. McMillan DC, Crozier JE, Canna K, Angerson WJ, McArdle CS. Evaluation of an Inflammation-Based Prognostic Score (GPS) in Patients Undergoing Resection for Colon and Rectal Cancer. Int J Colorectal Dis (2007) 22(8):881–6. doi: 10.1007/s00384-006-0259-6
33. Walsh SM, Casey S, Kennedy R, Ravi N, Reynolds JV. Does the Modified Glasgow Prognostic Score (Mgps) Have a Prognostic Role in Esophageal Cancer? J Surg Oncol (2016) 113(7):732–7. doi: 10.1002/jso.24225
34. Roncolato FT, Berton-Rigaud D, O’Connell R, Lanceley A, Sehouli J, Buizen L, et al. Validation of the Modified Glasgow Prognostic Score (Mgps) in Recurrent Ovarian Cancer (ROC) - Analysis of Patients Enrolled in the GCIG Symptom Benefit Study (SBS). Gynecol Oncol (2018) 148(1):36–41. doi: 10.1016/j.ygyno.2017.10.019
35. Okuno M, Ebata T, Yokoyama Y, Igami T, Sugawara G, Mizuno T, et al. Evaluation of Inflammation-Based Prognostic Scores in Patients Undergoing Hepatobiliary Resection for Perihilar Cholangiocarcinoma. J Gastroenterol (2016) 51(2):153–61. doi: 10.1007/s00535-015-1103-y
36. Janssen H, Cornillet M, Bjorkstrom NK, Sturesson C, Sparrelid E. Prognostic Value of Preoperative Inflammatory Markers in Resectable Biliary Tract Cancer - Validation and Comparison of the Glasgow Prognostic Score and Modified Glasgow Prognostic Score in a Western Cohort. Eur J Surg Oncol (2020) 46(5):804–10. doi: 10.1016/j.ejso.2019.12.008
Keywords: intrahepatic cholangiocarcinoma, Modified Glasgow Prognostic Scores, overall survival, progression-free survival, prognosis
Citation: He C, Zhao C, Lu J, Huang X, Chen C and Lin X (2021) Evaluation of Preoperative Inflammation-Based Prognostic Scores in Patients With Intrahepatic Cholangiocarcinoma: A Multicenter Cohort Study. Front. Oncol. 11:672607. doi: 10.3389/fonc.2021.672607
Received: 26 February 2021; Accepted: 31 May 2021;
Published: 17 June 2021.
Edited by:
Domenico Tamburrino, San Raffaele Hospital (IRCCS), ItalyReviewed by:
Luca Vigano, University of Milan, ItalyFederica Cipriani, San Raffaele Scientific Institute (IRCCS), Italy
Gianluca Rompianesi, University of Naples Federico II, Italy
Copyright © 2021 He, Zhao, Lu, Huang, Chen and Lin. This is an open-access article distributed under the terms of the Creative Commons Attribution License (CC BY). The use, distribution or reproduction in other forums is permitted, provided the original author(s) and the copyright owner(s) are credited and that the original publication in this journal is cited, in accordance with accepted academic practice. No use, distribution or reproduction is permitted which does not comply with these terms.
*Correspondence: Xiaojun Lin, bGlueGpAc3lzdWNjLm9yZy5jbg==
†These authors have contributed equally to this work