 Xien Yang
 Quanhong Ou
 Kai Qian2
 Gang Liu
- 1School of Physics and Electronic Information, Yunnan Normal University, Kunming, China
- 2Department of Thoracic Surgery, The First People’s Hospital of Yunnan Province, Kunming, China
- 3Department of Clinical Laboratory, Affiliated Hospital of Zunyi Medical University, Zunyi, China
- 4Department of Internal Medicine, The Second Affiliated Hospital of Zunyi Medical University, Zunyi, China
- 5School of Physics and Electronic Engineering, Qujing Normal University, Qujing, China
Lung cancer is the leading cause of cancer-related death in the world. Early diagnosis has great significance for the survival of patients with lung cancer. In this paper, attenuated total reflectance Fourier transform infrared (ATR-FTIR) spectroscopy combined with chemometrics was used to study the serum samples from patients with lung cancer and healthy people. The results of spectral band area comparison showed that the concentrations of protein, lipid and nucleic acids molecules in serum of patients with lung cancer were increased compared with those in healthy people. The original spectra were preprocessed to improve the accuracy of principal component regression (PCR) and partial least squares-discriminant analysis (PLS-DA) models. PLS-DA results for first derivative spectral data in nucleic acids (1250-1000cm-1) band showed 80% sensitivity, 91.89% specificity and 87.10% accuracy with high of 0.8949 and of 0.8153, low RMSEC of 0.3136 and RMSEV of 0.4180. It is shown that ATR-FTIR spectroscopy combined with chemometrics might be developed as a simple method for clinical screening and diagnosis of lung cancer.
Introduction
Lung cancer is the leading cause of cancer-related death in the world. It causes more than 2.2 million new cancer cases and 1.8 million deaths, accounting for 18% of all cancer deaths in 2020 (1). The cause of lung cancer is largely attributed to smoking and genetic inheritance (2, 3). Lung cancer lacks early diagnostic biomarkers. Most patients with lung cancer are already in advanced stage when diagnosed. The treatment effect of patients with advanced lung cancer is poor, and the survival rate is still expected to be less than 15% (4, 5). Therefore, early diagnosis has great significance for the survival of patients with lung cancer.
The traditional clinical diagnosis method is based on the histological examination of tumor tissue samples, but it is invasive and difficult to repeatedly biopsy for dynamic monitoring (6). Common screening methods, such as chest X-rays (CXR), magnetic resonance imaging (MRI) and low-dose computed tomography (LDCT), have some disadvantages. CXR examination cannot fully show early lung lesions with high false negatives. MRI has low sensitivity and cannot be used in patients with particular metal-based implants, pacemakers, and those suffering from acute claustrophobia (7). LDCT has high rates of false-positive results and adverse effects caused by exposure to hazardous radiation (4, 8–10). The existing light-induced theranostic platforms also have several limitations such as tissue absorption and limited imaging (11). Therefore, there is a need for a sample diagnostic method for the diagnosis of lung cancer.
In recent years, vibrational spectroscopic techniques such as Fourier transform infrared (FTIR) spectroscopy and Raman spectroscopy have been widely used in biological samples due to their low cost and small sample consumption (12). Unfortunately, Raman spectroscopy has some limitations because of its strong fluorescence background and weak signal. However, these limitations are not associated with infrared spectroscopy (13). There have been reported that infrared spectroscopy was used to analyze the lung tissue. Bangaoil et al. classified malignant and benign lung tissue sections using infrared spectroscopy combined with principal component analysis (PCA) and hierarchical cluster analysis (HCA). The finally analysis results were consistent with histopathological conclusions (14). Kaznowska et al. studied the tissue samples from healthy people and patients with lung cancer using infrared spectroscopy, and found the corresponding wavenumber changes of the functional groups in lipids, carbohydrates, proteins, DNA and phospholipids (15). However, the tissue samples in these studies still need to be collected from surgery, which is highly invasive. Wang et al. studied the FTIR spectra of serum samples by drying the serum on BaF2 window under vacuum, and found that there were differences in the protein secondary structure of serum between the patients with lung cancer and healthy people (16). However, there is still a lot of work to be done in the practical application of infrared spectroscopy in the clinical diagnosis of lung cancer.
In this paper, ATR-FTIR spectroscopy combined with chemometrics was used to study the serum samples from patients with lung cancer and healthy people in order to explore a simple diagnostic method for lung cancer and lay the foundation for the clinical application of infrared spectroscopy in the diagnosis of lung cancer in the future.
Materials and Methods
Samples Preparation
Serum samples were provided by The First People’s Hospital of Yunnan Province. All subjects had given informed consent to be included before they participated in the study. The study was conducted in accordance with the Declaration of Helsinki, and the protocol was approved by the Ethics Committee of Yunnan Normal University (Number: ynnuethic2021-13). Serum samples from 92 patients with lung cancer and 155 samples from healthy people were collected. The information of patients with lung cancer and healthy people was listed in Table 1. 50μl serum samples was placed on a glass slide and dried in a vacuum oven at room temperature (25°C) for 40 minutes. The purpose of vacuum pumping is to accelerate the drying speed. Drying in the vacuum drying oven can ensure that the sample will not be polluted and oxidized, and the organic substance will not be destroyed within 40 minutes. Then the serum was removed from the slide for measuring ATR-FTIR spectrum. Before sampling, the glass slides were soaked with aqua regia for 1 hour, washed with water and then soaked in acetone for 1 hour, and finally washed with ultrapure water and dried for use.

Table 1 The information of patients with lung cancer and healthy people.
ATR-FTIR Spectroscopy
ATR-FTIR spectra were measured in the range of 4000-600cm-1 by a Frontier spectrometer (Perkin Elmer, UK), coupled with an ATR accessory and a deuterated triglycine sulfate (DTGS) detector. Each spectrum was an accumulation of 32 scans at a resolution of 4cm-1. The dried serum sample was transferred to the crystal plate, and then pressed with pressure tip to ensure the best contact with the crystal surface. The air background spectrum was recorded before each sample scan and automatically deducted when the sample was tested. After each measurement, the crystal surface was cleaned with ethanol and ultrapure water, and then dried with a dust-free paper. Three IR spectra were collected for each serum sample and the resulting spectra were averaged using OMNIC 8.2 software (Thermo Scientific).
Spectral Data Preprocessing
The influence of noise and irrelevant information can be eliminated by proper preprocessing of the original spectra. This increases the accuracy of the analytical model and improves the signal-to-noise ratio (17). Baseline correction (BL) is a necessary processing method in infrared spectroscopy, which is helpful for further qualitative or quantitative analysis (18). Savitzky-Golay (SG) smoothing is adopted to increase the spectral quality by eliminating random noise. Derivative processing can eliminate background interference and spectral overlap, and minimize baseline drift caused by the differences in optical setups (19). Multiplicative scatter correction (MSC) is aimed to effectively eliminate the influence of scattering and improve the spectral information to obtain a relatively ideal spectrum (20). Standard normal variate (SNV) is used to reduce baseline shifting or tilt due to scattering and the change of light distance (21). It subtracts the average intensity from the spectral intensity to achieve offset correction, and then divides the standard deviation to reduce the multiplicative effect (22).
Spectral Band Area Analysis
The spectral band area was measured using OriginPro 9.1 software (OriginLab Corporation, Northampton, MA). The obtained results were presented as mean ± SEM (standard mean error). For statistics, independent sample t test was processed using SPSS 19 software (SPSS, Inc., Chicago, IL) and GraphPad Prim 9.0 (GraphPad Software Inc., CA, USA). The statistical significance was signified as less than or equal to p < 0.05*, p < 0.01**, p < 0.001***, and p < 0.0001****.
Chemometrics Analysis
Principal component regression (PCR) and partial least squares-discriminant analysis (PLS-DA) were performed to analyze the spectral data using Unscrambler X 10.4 software (Camo Software AS, Oslo, Norway). PCR is a regression analysis based on PCA (23). It decomposes the X matrix by PCA, and then takes the transformed new variables as predictive variables for multiple linear regression (MLR) (24). PLS-DA is a linear supervised classification technique combining partial least squares (PLS) regression with linear discriminant analysis (LDA) (25). It can find variables and directions from the multivariate space to distinguish the categories in the calibration set (26).
After preprocessing the spectral data, they were randomly divided into calibration set (69 serum samples from patients with lung cancer and 116 serum samples from healthy people) and validation set (23 serum samples from patients with lung cancer and 39 serum samples from healthy people) according to the ratio of 3:1 for model work. The performance of the regression model was evaluated by calculating the square of the correlation coefficient (R2) and the root mean square error (RMSE) (27). The sensitivity, specificity and accuracy were used to evaluate the judgment ability of the diagnostic model. The corresponding formula is as follows:
Results and Discussion
ATR-FTIR Spectra of Serum
Figure 1 shows the IR spectra after baseline correction and SG smoothing (9-point) of serum samples from patients with lung cancer and healthy people. The average IR spectra of them are shown in Figure 2. It can be seen that the main components of serum are protein, lipid and nucleic acids. The amide I protein (1700-1600cm−1) band mainly originated from the α-helix structure at 1646cm-1 (28). The amide II protein (1560-1500cm−1) band mainly originated from the N-H functional group at 1542cm-1 (29). The peak at 1740cm−1 was attributed to the C=O stretching vibration from ester carbonyl in triglycerides (25). The spectral band of 3000-2800cm−1 was mainly correlated with the lipid-related C-H asymmetric stretching vibration of CH3 at 2959cm-1 and CH2 at 2930cm-1 (30, 31). The spectral band of 1250-1000cm−1 was correlated with the P=O asymmetric stretching vibration at 1243cm-1 and symmetric stretching vibration at 1079cm-1 of in nucleic acids (32). It could be observed that the absorbance of average IR spectrum in serum from patients with lung cancer was significantly increased at nucleic acids band compared with healthy people. However, there were no significant differences in amide I, amide II and lipid bands in average IR spectra.
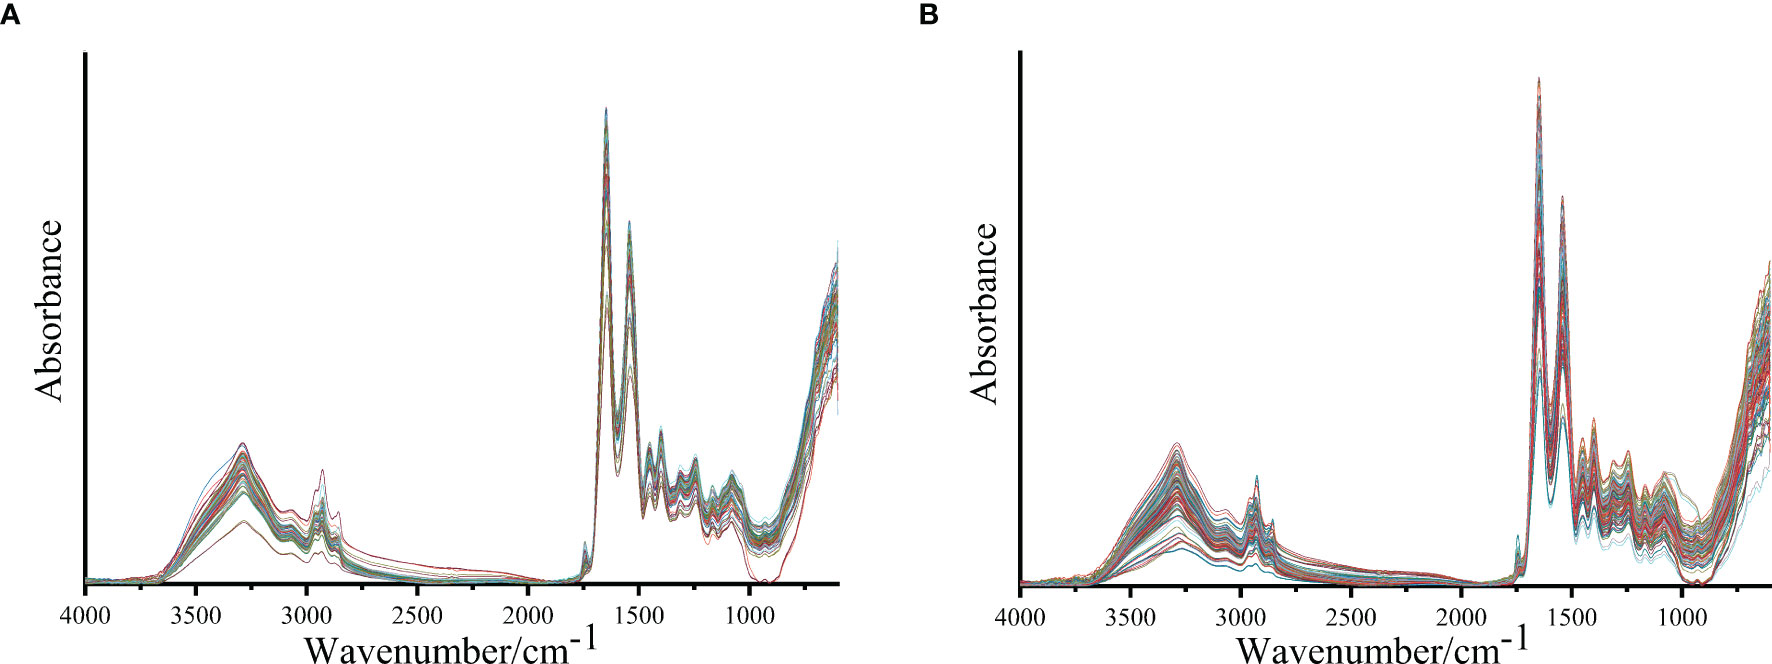
Figure 1 The IR spectra after baseline correction and SG smoothing (9-point) of serum samples from patients with lung cancer (A) and healthy people (B).
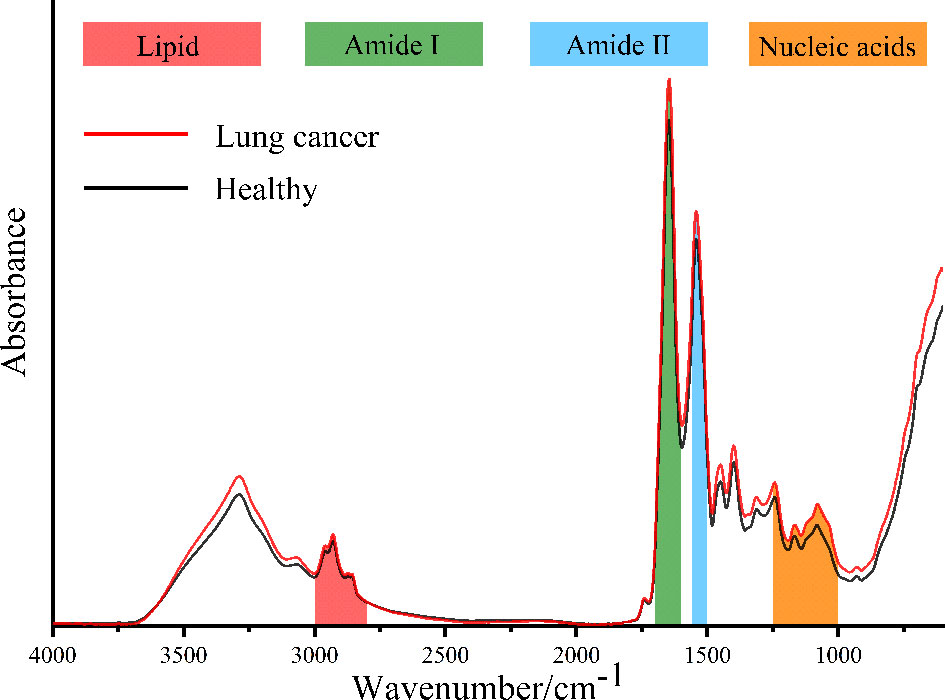
Figure 2 The average IR spectra of the serum from patients with lung cancer and healthy people.
Comparison of Spectral Band Area
To further analyze the differences between serum of patients with lung cancer and healthy people in these four bands, we showed the statistical analysis results of the spectral band area of serum samples in Figure 3. It can be observed that the spectral band area of patients with lung cancer was significantly increased in amide I, amide II and nucleic acids bands compared with healthy people (p < 0.0001). Although the increased area in lipid band was not significant compared with the other three bands, there was still a statistical difference between the two groups of serum samples (p < 0.05). According to Beer-Lambert law, the increase of the absorbance of the spectral band indicates the increase of the corresponding functional group concentration (31). Therefore, the concentrations of protein, lipid and nucleic acids molecules in serum of patients with lung cancer were increased compared with those in healthy people. This may be due to the aerobic glycolysis in cancer cells that produces a large number of biosynthetic intermediates such as lipid, protein and nucleotide, which are used for the growth and proliferation of cancer cells (33).
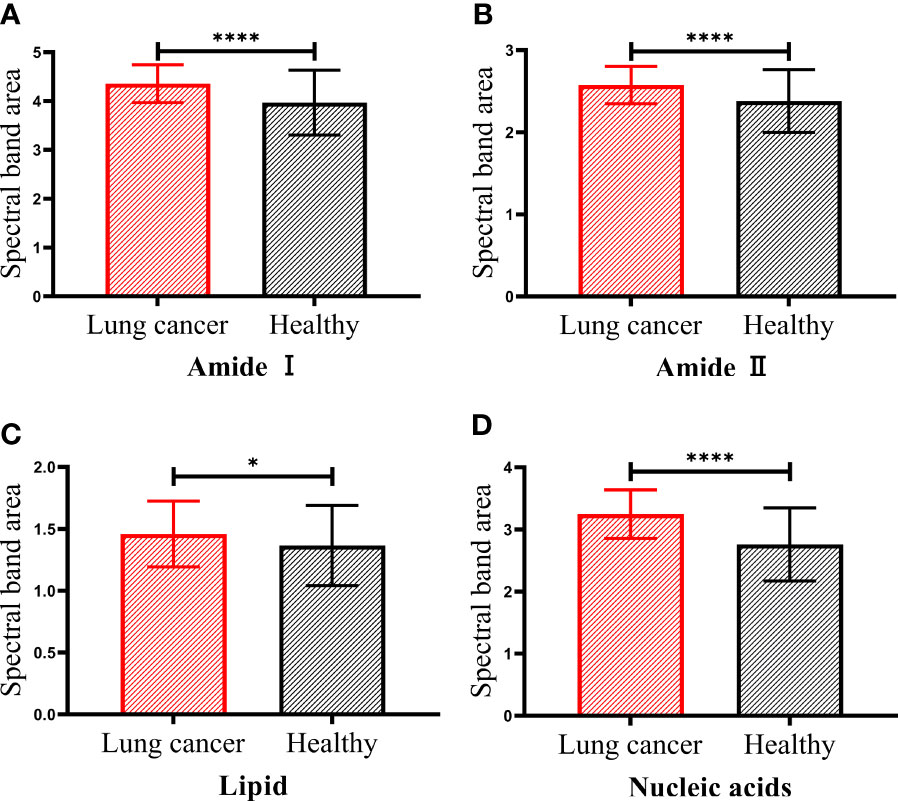
Figure 3 The spectral band area of patients with lung cancer and healthy people. Amide I protein (1700-1600cm−1) band (A), Amide II protein (1560-1500cm−1) band (B), lipid (3000-2800cm−1) band (C) and nucleic acids (1250-1000cm−1) band (D). The statistical significance was signified as less than or equal to p < 0.05* and p < 0.0001****.
Chemometrics Analysis
In order to evaluate the classification effect of these four bands on serum of patients with lung cancer and healthy people, PCR and PLS-DA were performed on the spectral data after preprocessing using full cross-validation. A model with a low value of RMSE and a high value of R2 closer to 1 is considered to be a good model (24, 34).
Tables 2, 3 show the calibration and validation results of PCR and PLS-DA. Although good classification accuracy appeared under the PCR model, the values of R2 and RMSE were lower than those of PLS-DA. The PLS-DA model for first derivative spectral data in nucleic acids band (1250-1000cm-1) showed the best calibration model with of 0.8949 and RMSEC of 0.3136. The values of and RMSEV in its corresponding validation model were 0.8153 and 0.4180, respectively. The results of this model showed 80% sensitivity, 91.89% specificity and 87.70% accuracy.
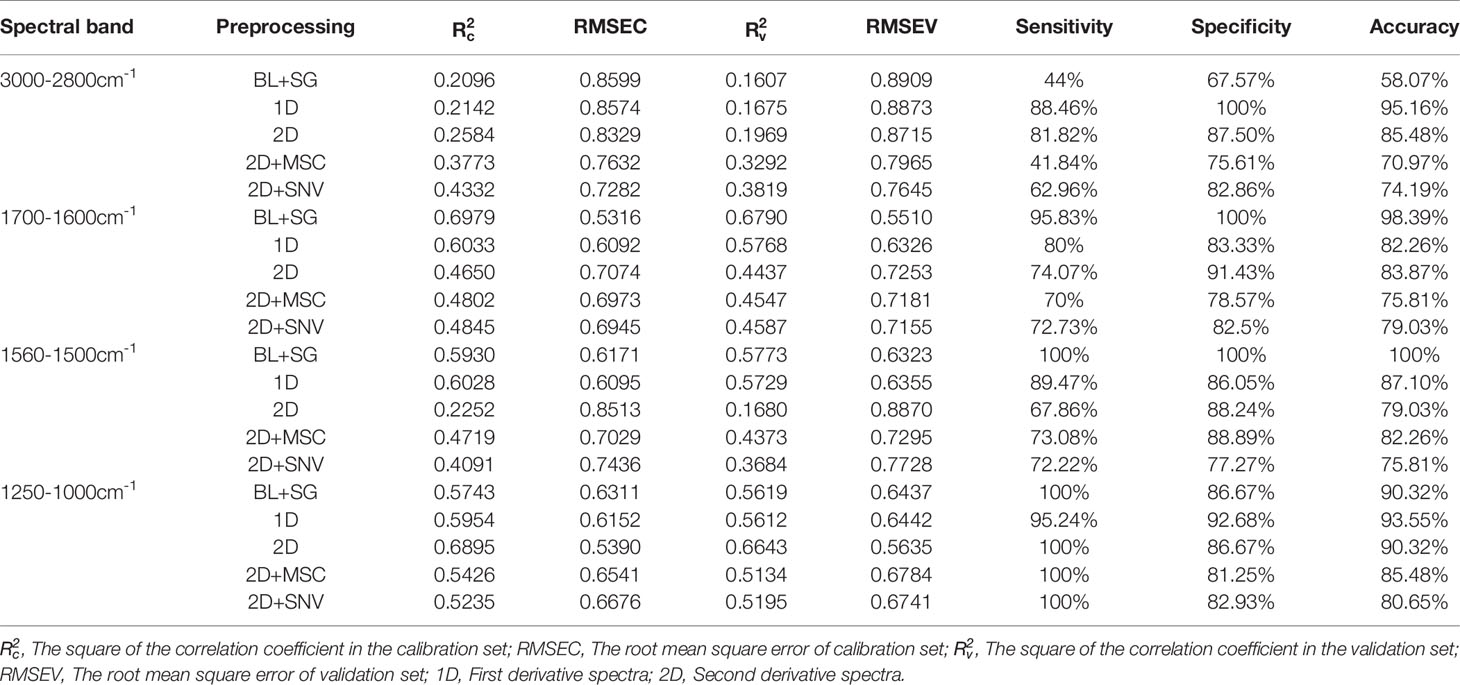
Table 2 Calibration and validation results of PCR for the spectral data after preprocessing.
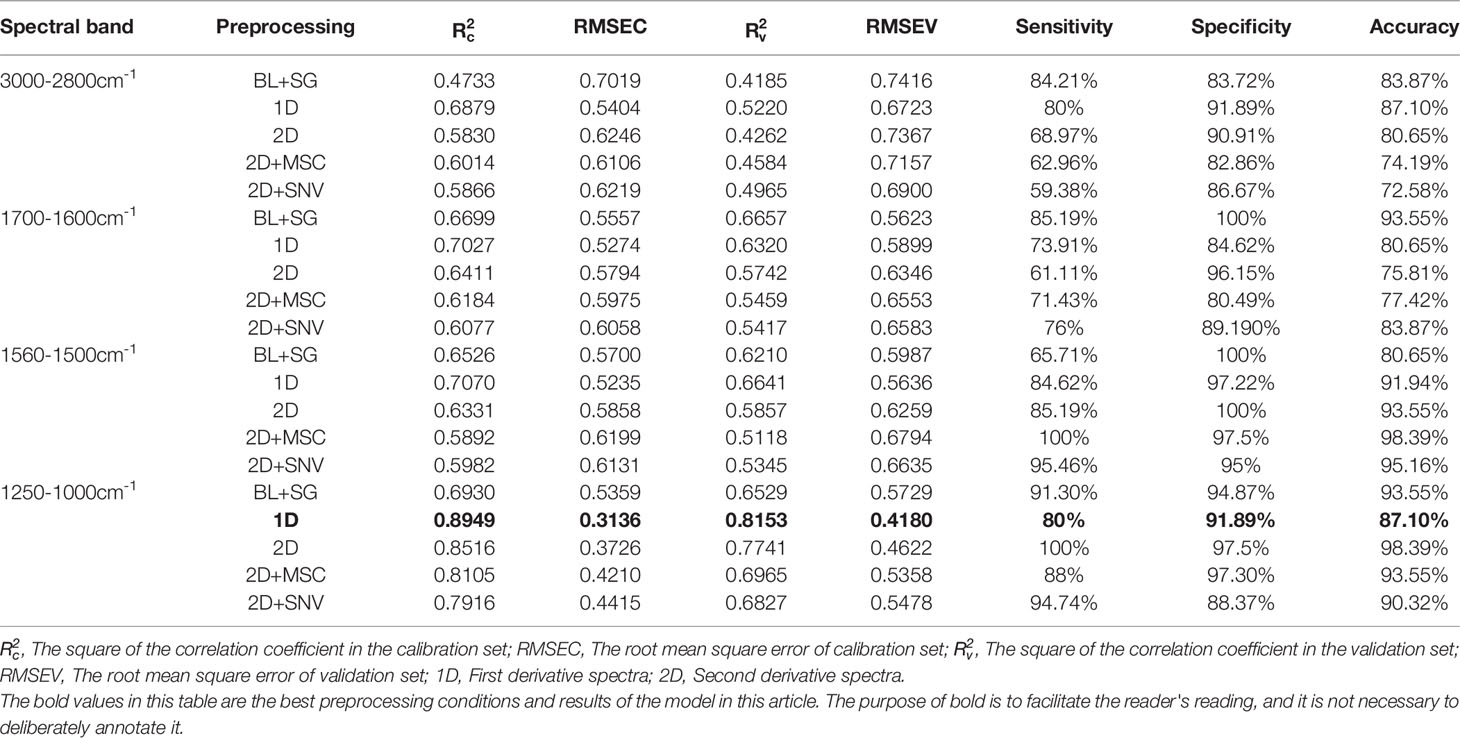
Table 3 Calibration and validation results of PLS-DA for the spectral data after preprocessing.
Figure 4 shows the score plot of Factor-1 and Factor-2 using PLS-DA model for first derivative spectral data in nucleic acids (1250-1000cm−1) band. The first two factors indicate that 65% (X1 36%, X2 27%) of the X variance, explains 58% (Y1 50%, Y2 8%) of the sample classification level. It can be seen that serum samples are distributed into two clusters along the Factor-1. The red cluster is mainly composed of serum samples from patients with lung cancer, and the black cluster is mainly composed of serum samples from healthy people. In this model, 80% of patients with lung cancer were correctly identified, 91.89% of healthy people were correctly separated, and the total accuracy rate was 87.10%.
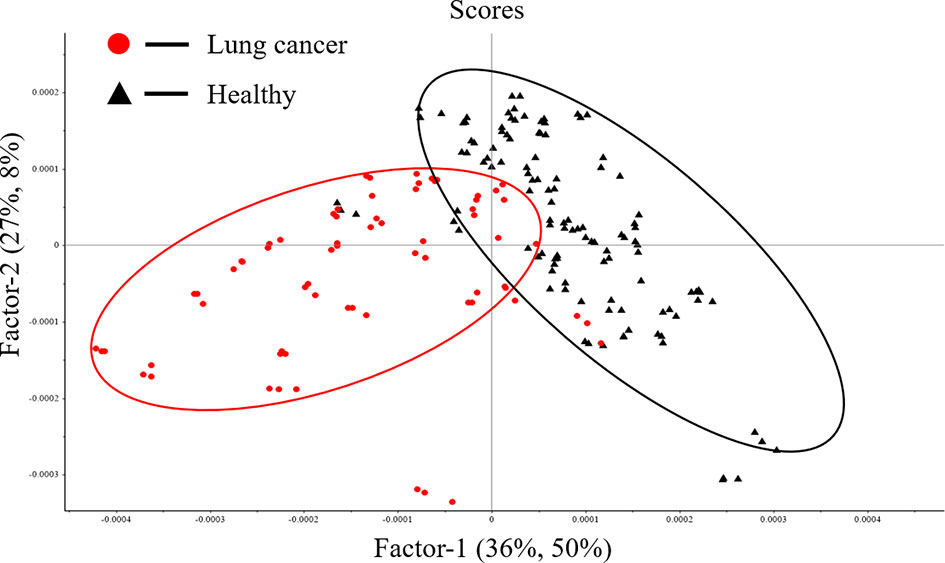
Figure 4 Score plot of Factor-1 and Factor-2.
Figure 5 shows the loading plot of Factor-1 for identifying the peaks with high weights in classifying samples. There are positively weighted peaks around 1176cm-1, 1130cm-1, 1085cm-1 and 1043cm-1, of which 1176cm-1 was related to the vibration band of sugar-phosphate, 1130cm-1 was assigned to the C=O stretching vibration of ribose in RNA (32), 1085cm-1 was ascribed to the symmetric phosphate vibrations (35), 1043cm-1 was attributed to the stretching vibration and bending vibration of C-O in carbohydrates (14). Two positively weighted peaks at 1226cm-1 and 1026cm-1, of which 1226cm-1 was due to the asymmetric stretching vibration of in nucleic acids (36), 1026cm-1 was related to the stretching vibration of C-O and bending vibration of C-H in aromatic amino acids (37). Therefore, the loading plot of Factor-1 showed that in nucleic acids play a key role in distinguishing the serum patients with lung cancer from that of healthy people. This may be due to DNA damage caused by oxidative chemical mutagenic aberrations in serum of patients with lung cancer (38).
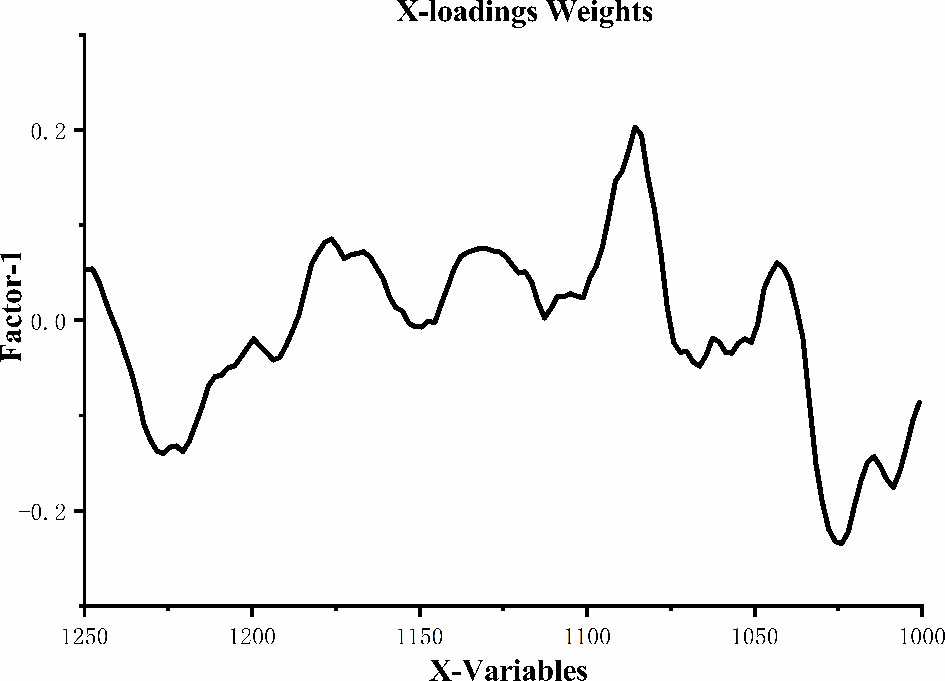
Figure 5 Loading plot of Factor-1.
Conclusions
ATR-FTIR spectroscopy combined with chemometrics was used to study the serum of patients with lung cancer and healthy people. The results of spectral band area comparison showed that the concentrations of protein, lipid and nucleic acids molecules in serum of patients with lung cancer were increased compared with those in healthy people. PCR and PLS-DA were performed on the spectral data after different preprocessing. PLS-DA model for first derivative spectral data in nucleic acids (1250-1000cm-1) band is the best model with high of 0.8949 and of 0.8153, low RMSEC of 0.3136 and RMSEV of 0.4180. The corresponding PLS-DA results showed 80% sensitivity, 91.89% specificity and 87.70% accuracy. The results showed that ATR-FTIR spectroscopy combined with chemometrics could effectively distinguish the serum of patients with lung cancer from that of healthy people.
Data Availability Statement
The raw data supporting the conclusions of this article will be made available by the authors, without undue reservation.
Ethics Statement
The protocol was approved by the Ethics Committee of Yunnan Normal University (Number: ynnuethic2021-13). The patients/participants provided their written informed consent to participate in this study.
Author Contributions
XY designed the project and completed all the research. KQ, JY, ZB, and WY provided medical instruction. XY, QO, YS, and GL wrote the manuscript. All authors contributed to the article and approved the submitted version.
Funding
This work was supported by the National Natural Science Foundation of China (Grant No. 31760341), Yunnan province University Science and Technology Innovation Team Support Scheme.
Conflict of Interest
The authors declare that the research was conducted in the absence of any commercial or financial relationships that could be construed as a potential conflict of interest.
Publisher’s Note
All claims expressed in this article are solely those of the authors and do not necessarily represent those of their affiliated organizations, or those of the publisher, the editors and the reviewers. Any product that may be evaluated in this article, or claim that may be made by its manufacturer, is not guaranteed or endorsed by the publisher.
Acknowledgments
The authors are grateful for these financial supports.
References
1. Sung H, Ferlay J, Siegel RL, Laversanne M, Soerjomataram I, Jemal A, et al. Global Cancer Statistics 2020: GLO-BOCAN Estimates of Incidence and Mortality Worldwide for 36 Cancers in 185 Countries. CA Cancer J Clin (2021) 71(3):209–49. doi: 10.3322/caac.21660
2. Siegel RL, Miller KD, Fuchs HE, Jemal A. Cancer Statistics, 2021. CA Cancer J Clin (2021) 71(1):7–33. doi: 10.3322/caac.21654
3. Tao J, Jatoi A, Crawford J, Lam WWT, Ho JC, Wang X, et al. Role of Dietary Carboh-Ydrates on Risk of Lung Cancer. Lung Cancer (2021) 155:87–93. doi: 10.1016/j.lungcan.2021.03.009
4. Xu K, Zhang C, Du T, Gabriel ANA, Wang X, Li X, et al. Progress of Exosomes in the Diagnosis and Treatment of Lung Cancer. BioMed Pharmacother (2021) 134:111111. doi: 10.1016/j.biopha.2020.111111
5. Schabath MB, Cote ML. Cancer Progress and Priorities: Lung Cancer. Cancer Epidemiol Biomarkers Prev (2019) 28(10):1563–79. doi: 10.1158/1055-9965.EPI-19-0221
6. Cui S, Cheng Z, Qin W, Jiang L. Exosomes as a Liquid Biopsy for Lung Cancer. Lung Cancer (2018) 116:46–54. doi: 10.1016/j.lungcan.2017.12.012
7. Tuo W, Xu Y, Fan Y, Li J, Qiu M, Xiong X, et al. Biomedical Applications of Pt(II) Metallacycle/Metallacage-Based Agents: From Mono-Chemotherapy to Versatile Imaging Contrasts and Theranostic Platforms. Coord Chem Rev (2021) 443:214017. doi: 10.1016/j.ccr.2021.214017
8. Gao X, Guo L, Li J, Thu HE, Hussain Z. Nanomedicines Guided Nanoimaging Probes and Nanotherapeutics for Early Detection of Lung Cancer and Abolishing Pulmonary Metastasis: Critical Appraisal of Newer Developments and Challenges to Clinical Transition. J Control Release (2018) 292:29–57. doi: 10.1016/j.jconrel.2018.10.024
9. Thakur SK, Singh DP, Choudhary J. Lung Cancer Identification: A Review on Detection and Classification. Cancer Metastasis Rev (2020) 39(3):989–98. doi: 10.1007/s10555-020-09901-x
10. Zhang Y, Zhang X, Yang H, Yu L, Xu Y, Sharma A, et al. Advanced Biotechnology-Assisted Precise Sonodynamic Therapy. Chem Soc Rev (2021). doi: 10.1039/d1cs00403d
11. Xu Y, Zhang Y, Li J, An J, Li C, Bai S, et al. NIR-II Emissive Multifunctional AIEgen With Single Laser-Activated Synergistic Photodynamic/Photothermal Therapy of Cancers and Pathogens. Biomaterials (2020) 259:120315. doi: 10.1016/j.biomaterials.2020.120315
12. Morais CLM, Lima KMG, Singh M, Martin FL. Tutorial: Multivariate Classification for Vibrational Spectroscopy in Biological Samples. Nat Protoc (2020) 15(7):2143–62. doi: 10.1038/s41596-020-0322-8
13. Wang R, Wang Y. Fourier Transform Infrared Spectroscopy in Oral Cancer Diagnosis. Int J Mol Sci (2021) 22(3):1206. doi: 10.3390/ijms22031206
14. Bangaoil R, Santillan A, Angeles LM, Abanilla L, Lim A Jr., Ramos MC, et al. ATR-FTIR Spectroscopy as Adjunct Method to the Microscopic Examination of Hematoxylin and Eosin-Stained Tissues in Diagnosing Lung Cancer. PloS One (2020) 15(5):e0233626. doi: 10.1371/journal.pone.0233626
15. Kaznowska E, Depciuch J, Lach K, Kolodziej M, Koziorowska A, Vongsvivut J, et al. The Classification of Lung Cancers and Their Degree of Malignancy by FTI-R, PCA-LDA Analysis, and a Physics-Based Computational Model. Talanta (2018) 186:337–45. doi: 10.1016/j.talanta.2018.04.083
16. Wang X, Shen X, Sheng D, Chen X, Liu X. FTIR Spectroscopic Comparison of Serum From Lun-G Cancer Patients and Healthy Persons. Spectrochim Acta A Mol Biomol Spectrosc (2014) 122:193–7. doi: 10.1016/j.saa.2013.11.049
17. Hu J, Ma X, Liu L, Wu Y, Ouyang J. Rapid Evaluation of the Quality of Chestnuts Using Near-Infrared Reflectance Spectroscopy. Food Chem (2017) 231:141–7. doi: 10.1016/j.foodchem.2017.03.127
18. Shen X, Xu L, Ye S, Hu R, Jin L, Xu H, et al. Automatic Baseline Correction Method for the Open-Path Fourier Transform Infrared Spectra by Using Simple Iterative Averaging. Opt Express (2018) 26(10):A609–14. doi: 10.1364/OE.26.00A609
19. Shi T, Liu H, Chen Y, Fei T, Wang J, Wu G. Spectroscopic Diagnosis of Arsenic Contaminat-Ion in Agricultural Soils. Sensors (Basel) (2017) 17(5):1036. doi: 10.3390/s17051036
20. Zhang Z, Shang H, Wang H, Zhang Q, Yu S, Wu Q, et al. Hyperspectral Imaging for the Nondestructive Quality Assessment of the Firmness of Nanguo Pears Under Different Freezing/Thaw-Ing Conditions. Sensors (Basel) (2019) 19(14):3124. doi: 10.3390/s19143124
21. Manfredi M, Robotti E, Quasso F, Mazzucco E, Calabrese G, Marengo E. Fast Classification of Hazelnut Cultivars Through Portable Infrared Spectroscopy and Chemometrics. Spectrochim Acta A Mol Biomol Spectrosc (2018) 189:427–35. doi: 10.1016/j.saa.2017.08.050
22. Mishra P, Marini F, Biancolillo A, Roger JM. Improved Prediction of Fuel Properties With Near-Infrared Spectroscopy Using a Complementary Sequential Fusion of Scatter Correction Techniques. Talanta (2021) 223(Pt 1):121693. doi: 10.1016/j.talanta.2020.121693
23. Costa VC, de Mello ML, Babos DV, Castro JP, Pereira-Filho ER. Calibration Strategies for Determination of Pb Content in Recycled Polypropylene From Car Batteries Using Laser-Induced Breakdown Spectroscopy (LIBS). Microchem J (2020) 159:105558. doi: 10.1016/j.microc.2020.105558
24. Jamwal R, Amit, Kumari S, Balan B, Kelly S, Cannavan A, et al. Rapid and non-Destr-Uctive Approach for the Detection of Fried Mustard Oil Adulteration in Pure Mustard Oil via ATR-FTIR Spectroscopy-Chemometrics. Spectrochim Acta A Mol Biomol Spectrosc (2021) 244:118822. doi: 10.1016/j.saa.2020.118822
25. Kharbach M, Yu H, Kamal R, Barra I, Marmouzi I, Cherrah Y, et al. New Insights Into the Argan Oil Categories Characterization: Chemical Descriptors, FTI-R Fingerprints, and Chemometric Approaches. Talanta (2021) 225:122073. doi: 10.1016/j.talanta.2020.122073
26. Rohman A, Windarsih A. The Application of Molecular Spectroscopy in Combination With Chem-Ometrics for Halal Authentication Analysis: A Review. Int J Mol Sci (2020) 21(14):5155. doi: 10.3390/ijms21145155
27. Dourou D, Grounta A, Argyri AA, Froutis G, Tsakanikas P, Nychas GE, et al. Rapid Microbial Quality Assessment of Chicken Liver Inoculated or Not With Salmonella Using FTIR Spectroscopy and Machine Learning. Front Microbiol (2020) 11:623788. doi: 10.3389/fmicb.2020.623788
28. Tan L, Hong P, Yang P, Zhou C, Xiao D, Zhong T. Correlation Between the Water Solubility and Secondary Structure of Tilapia-Soybean Protein Co-Precipitates. Molecules (2019) 24(23):4337. doi: 10.3390/molecules24234337
29. Freitas AG, Magalhaes BE, Minho LA, Leao DJ, Santos LS, Albuquerque Fernandes SA. FTIR Spectroscopy With Chemometrics for Determination of Tylosin Residues in Mil-K. J Sci Food Agric (2021) 101(5):1854–60. doi: 10.1002/jsfa.10799
30. Rakib F, Al-Saad K, Ahmed T, Ullah E, Barreto GE, Md Ashraf G, et al. Biomolecular Alterations in Acute Traumatic Brain Injury (TBI) Using Fourier Transform Infrared (FTIR) Imaging Spectroscopy. Spectrochim Acta A Mol Biomol Spectrosc (2021) 248:119189. doi: 10.1016/j.saa.2020.119189
31. Guleken Z, Unubol B, Bilici R, Saribal D, Toraman S, Gunduz O, et al. Investig-Ation of the Discrimination and Characterization of Blood Serum Structure in Patients With Opioid Use Disorder Using IR Spectroscopy and PCA-LDA Analysis. J Pharm BioMed Anal (2020) 190:113553. doi: 10.1016/j.jpba.2020.113553
32. Roy S, Perez-Guaita D, Bowden S, Heraud P, Wood BR. Spectroscopy Goes Viral: Diagnosis of Hepatitis B and C Virus Infection From Human Sera Using ATR-FTIR Spectroscopy. Clin Spectrosc (2019) 1:100001. doi: 10.1016/j.clispe.2020.100001
33. Liu G, Summer R. Cellular Metabolism in Lung Health and Disease. Annu Rev Physiol (2019) 81:403–28. doi: 10.1146/annurev-physiol-020518-114640
34. Junhom C, Weerapreeyakul N, Tanthanuch W, Thumanu K. Partial Least Squares Regression and Fourier Transform Infrared (FTIR) Microspectroscopy for Prediction of Resistance in Hepatocellular Car-Cinoma HepG2 Cells. Exp Cell Res (2017) 351(1):82–90. doi: 10.1016/j.yexcr.2016.12.027
35. Tyagi G, Pradhan S, Srivastava T, Mehrotra R. Nucleic Acid Binding Properties of Allicin: Spectr-Oscopic Analysis and Es-Timation of Anti-Tumor Potential. Biochim Biophys Acta (2014) 1840(1):350–6. doi: 10.1016/j.bbagen.2013.09.007
36. Wongwattanakul M, Hahnvajanawong C, Seubwai W, Leelayuwat C, Limpaiboon T, Jearanaikoon P. Potential Pre-Diction of Patient Survival and Chemotherapeutic Sensitivity in Cholangiocarcinoma Using FTIR Microspectroscopy. J Mol Struct (2018) 1166:416–21. doi: 10.1016/j.molstruc.2018.04.044
37. Gieroba B, Przekora A, Kalisz G, Kazimierczak P, Song CL, Wojcik M, et al. Collagen Maturity and Mineralization in Mesenchymal Stem Cells Cultured on the Hydroxyapatite-Based Bone Scaffold Analyzed by ATR-FTIR Spectroscopic Imaging. Mater Sci Eng: C (2021) 119:111634. doi: 10.1016/j.msec.2020.111634
Keywords: lung cancer, serum, ATR-FTIR spectroscopy, Beer-Lambert law, chemometrics
Citation: Yang X, Ou Q, Qian K, Yang J, Bai Z, Yang W, Shi Y and Liu G (2021) Diagnosis of Lung Cancer by ATR-FTIR Spectroscopy and Chemometrics. Front. Oncol. 11:753791. doi: 10.3389/fonc.2021.753791
Received: 12 August 2021; Accepted: 15 September 2021;
Published: 30 September 2021.
Edited by:
Haibin Shi, Soochow University, ChinaReviewed by:
Xihui Bian, Tianjin Polytechnic University, ChinaYao Sun, Central China Normal University, China
Copyright © 2021 Yang, Ou, Qian, Yang, Bai, Yang, Shi and Liu. This is an open-access article distributed under the terms of the Creative Commons Attribution License (CC BY). The use, distribution or reproduction in other forums is permitted, provided the original author(s) and the copyright owner(s) are credited and that the original publication in this journal is cited, in accordance with accepted academic practice. No use, distribution or reproduction is permitted which does not comply with these terms.
*Correspondence: Gang Liu, Z2xpdTY2QDE2My5jb20=