 Jun Tian
 Feixiang Teng1
- 1Department of Basic Medication, Jiangsu Vocational College of Medicine, Yancheng, China
- 2Department of Medical Imaging, Jiangsu Vocational College of Medicine, Yancheng, China
Purpose: To systematically assess the multiparametric MRI clear cell likelihood score (ccLS) algorithm for the classification of small renal masses (SRM).
Methods: We conducted an electronic literature search on Web of Science, MEDLINE (Ovid and PubMed), Cochrane Library, EMBASE, and Google Scholar to identify relevant articles from 2017 up to June 30, 2022. We included studies reporting the diagnostic performance of the ccLS for characterization of solid SRM. The bivariate model and hierarchical summary receiver operating characteristic (HSROC) model were used to pool sensitivity, specificity, positive likelihood ratio (LR+), negative likelihood ratio (LR−), and diagnostic odds ratio (DOR). The quality evaluation was performed with the Quality Assessment of Diagnostic Accuracy Studies-2 tool.
Results: A total of 6 studies with 825 renal masses (785 patients) were included in the current meta-analysis. The pooled sensitivity and specificity for cT1a renal masses were 0.80 (95% CI 0.75–0.85) and 0.74 (95% CI 0.65–0.81) at the threshold of ccLS ≥4, the pooled LR+, LR−, and DOR were 3.04 (95% CI 2.34-3.95), 0.27 (95% CI 0.22–0.33), and 11.4 (95% CI 8.2-15.9), respectively. The area under the HSROC curve was 0.84 (95% CI 0.81–0.87). For all cT1 renal masses, the pooled sensitivity and specificity were 0.80 (95% CI 0.74–0.85) and 0.76 (95% CI 0.67–0.83).
Conclusions: The ccLS had moderate to high accuracy for identifying ccRCC from other RCC subtypes and with a moderate inter-reader agreement. However, its diagnostic performance remain needs multi-center, large cohort studies to validate in the future.
Introduction
Over the past couple of decades, the incidence of renal cell carcinoma (RCC) has steadily increased in the United States and worldwide, in which cross-sectional imaging is play an important role (1–4). Indeed, as many as 70% of RCCs are detected incidentally for unrelated medical conditions (5). Higher detection of small renal lesions results in at least 80% increase in the number of surgical resections but does not bring considerable benefit to cancer-specific mortality at the population level (6, 7). Additionally, many renal masses exhibit an indolent behavior or grow very slowly and need no intervention (8, 9). Renal mass biopsies are recommended by several groups to facilitate personalized management; however, its nondiagnostic is up to 20% and not feasible in all patients (10). Thus, using non-invasive imaging examinations such as MRI and CT represents an alternative to biopsy to assist location, staging, and management of renal masses (1, 11, 12).
For cystic renal masses, the Bosniak classification provides standardized risk stratification and has been widely utilized in clinical practice for decades (13, 14). With respect to small solid renal masses, however, there is no widely accepted standardized risk stratification up to date, even though many studies demonstrated that imaging techniques such as US, CT, and MRI may play an important role in prediction of tumor histologic findings (15). Clear cell RCC (ccRCC) is the most common subtype of various RCC, accounting for more than half of cases and associated with worse outcome as compared to papillary and chromophobe tumors (16, 17). In addition, ccRCC is the most common cause of disease progression and metastasis in patients under active surveillance based on the combination of characteristics (18). In 2017, Canvasser et al. proposed the five-category Likert scale named ccLS to evaluate whether an SRM being a ccRCC (from 1 point=very unlikely to 5 points=very likely) (19). To date, several published studies have reported that this scoring system performed well in clinical practice; however, this algorithm has not been systematically assessed. Therefore, the purpose of this study was to evaluate the overall performance of the ccLS algorithm for the classification of ccRCC.
Methods
This meta-analysis and systematic review was conducted according to the Preferred Reporting Items for Systematic Reviews and Meta-Analysis (PRISMA) statement, with a predefined review and data extraction protocol (20). The primary outcome of our study was the diagnostic accuracy of the ccLS for identifying the cT1a (≤4 cm) solid renal masses. Additionally, considering that some studies applied the ccLS to cT1b (>4 cm and ≤7 cm) masses, we would assess the diagnostic performance of this algorithm for all cT1 (≤7 cm) renal masses.
Search strategy and selection criteria
We conducted a systematic search of PubMed, EMBASE, Cochrane Library, Web of Science, and Google Scholar online scientific publication databases to identify articles published between January 2017 and June 2022, by using Medical Subject Headings (MeSH) and restricted language to English. The following terms and synonyms was used for literature searching: ([kidney] OR (renal) OR (nephron)] AND [(cancer) OR (mass*) OR (lesion)] AND ([ccLS] OR [clear cell likelihood score]). We supplemented our searches by manually screening the bibliographies of reviews and eligible articles. Two reviewers (T.J. and T.F.X.) evaluated the results of the literature search independently, and discrepancies were resolved by discussion with a third reviewer (Z.H.).
Inclusion and exclusion criteria
We included studies that satisfied all of the following criteria: 1) using the ccLS for characterization of ccRCC; 2) providing sufficient details for reconstruction of 2×2 contingency tables for determination of the diagnostic accuracy; and 3) with biopsy or surgical pathological results as the reference standard. We excluded studies that met any of the following criteria: 1) not using the ccLS but other scoring systems or subjective assessment; 2) case reports or case series involving less than 20 participants; 3) with insufficient data to assess the diagnostic performance; 4) meta-analyses, guidelines, editorials, reviews, and letters; and 5) with partially overlapping patient populations.
Data extraction and quality assessment
We extracted the following information from included studies with a standardized form: 1) demographic and clinical characteristics such as sample size of patients and masses, patient age, male-to-female ratio, and tumor size; 2) study characteristics such as authors, study design, year of publication, country and period of the study conducted, number of readers and their experience, inter-reader agreement, blinding to final results, and reference standard; and 3) technical characteristics such as MRI sequences and magnetic field strength. We employed the Quality Assessment of Diagnostic Accuracy Studies–2 to evaluate the study quality (21), in which the risk of bias for each study was assessed according to four domains: patient selection, method of the index test, reference standard, and flow and timing. Data extraction and quality assessment was carried out by two reviewers (T.J. and T.F.X.) independently.
Data synthesis and statistical analysis
The bivariate model and HSROC model were used to pool the summary estimate of sensitivity, specificity, LR+, LR−, DOR, and their 95% confidence intervals (CIs) (22, 23). In addition, we constructed the forest plots and HSROC curve to graphically present the results. The Deeks’ funnel plot was used to evaluate the publication bias, and the Deeks’ asymmetry test was used to decide statistical significance (24). The degree of heterogeneity between studies was measured with Cochran Q statistics and Higgins I2: for value of 0%-40%, not important; for value of 30%-60%, moderate; for value of 50%-90%, substantial; for value of 75%-100%, considerable (25). The “metandi” and “midas” modules in STATA 16.0 (StataCorp, Texas, USA) were used for all analyses, with a P <0.05 indicating statistically significant.
Results
Literature search and data extraction
The flow chart of the literature selection process is presented in Figure 1. Our search strategy yielded 137 results initially, of which 39 were removed due to duplicates. After screening the titles and abstracts, a total of 65 results were excluded. Full-text reviewing was performed among the remaining 33 potential results and 27 were excluded for insufficient data (n=5), not in the field of interest (n=22). Ultimately, a total of 6 studies involving 785 patients were included in this meta-analysis (19, 26–30).
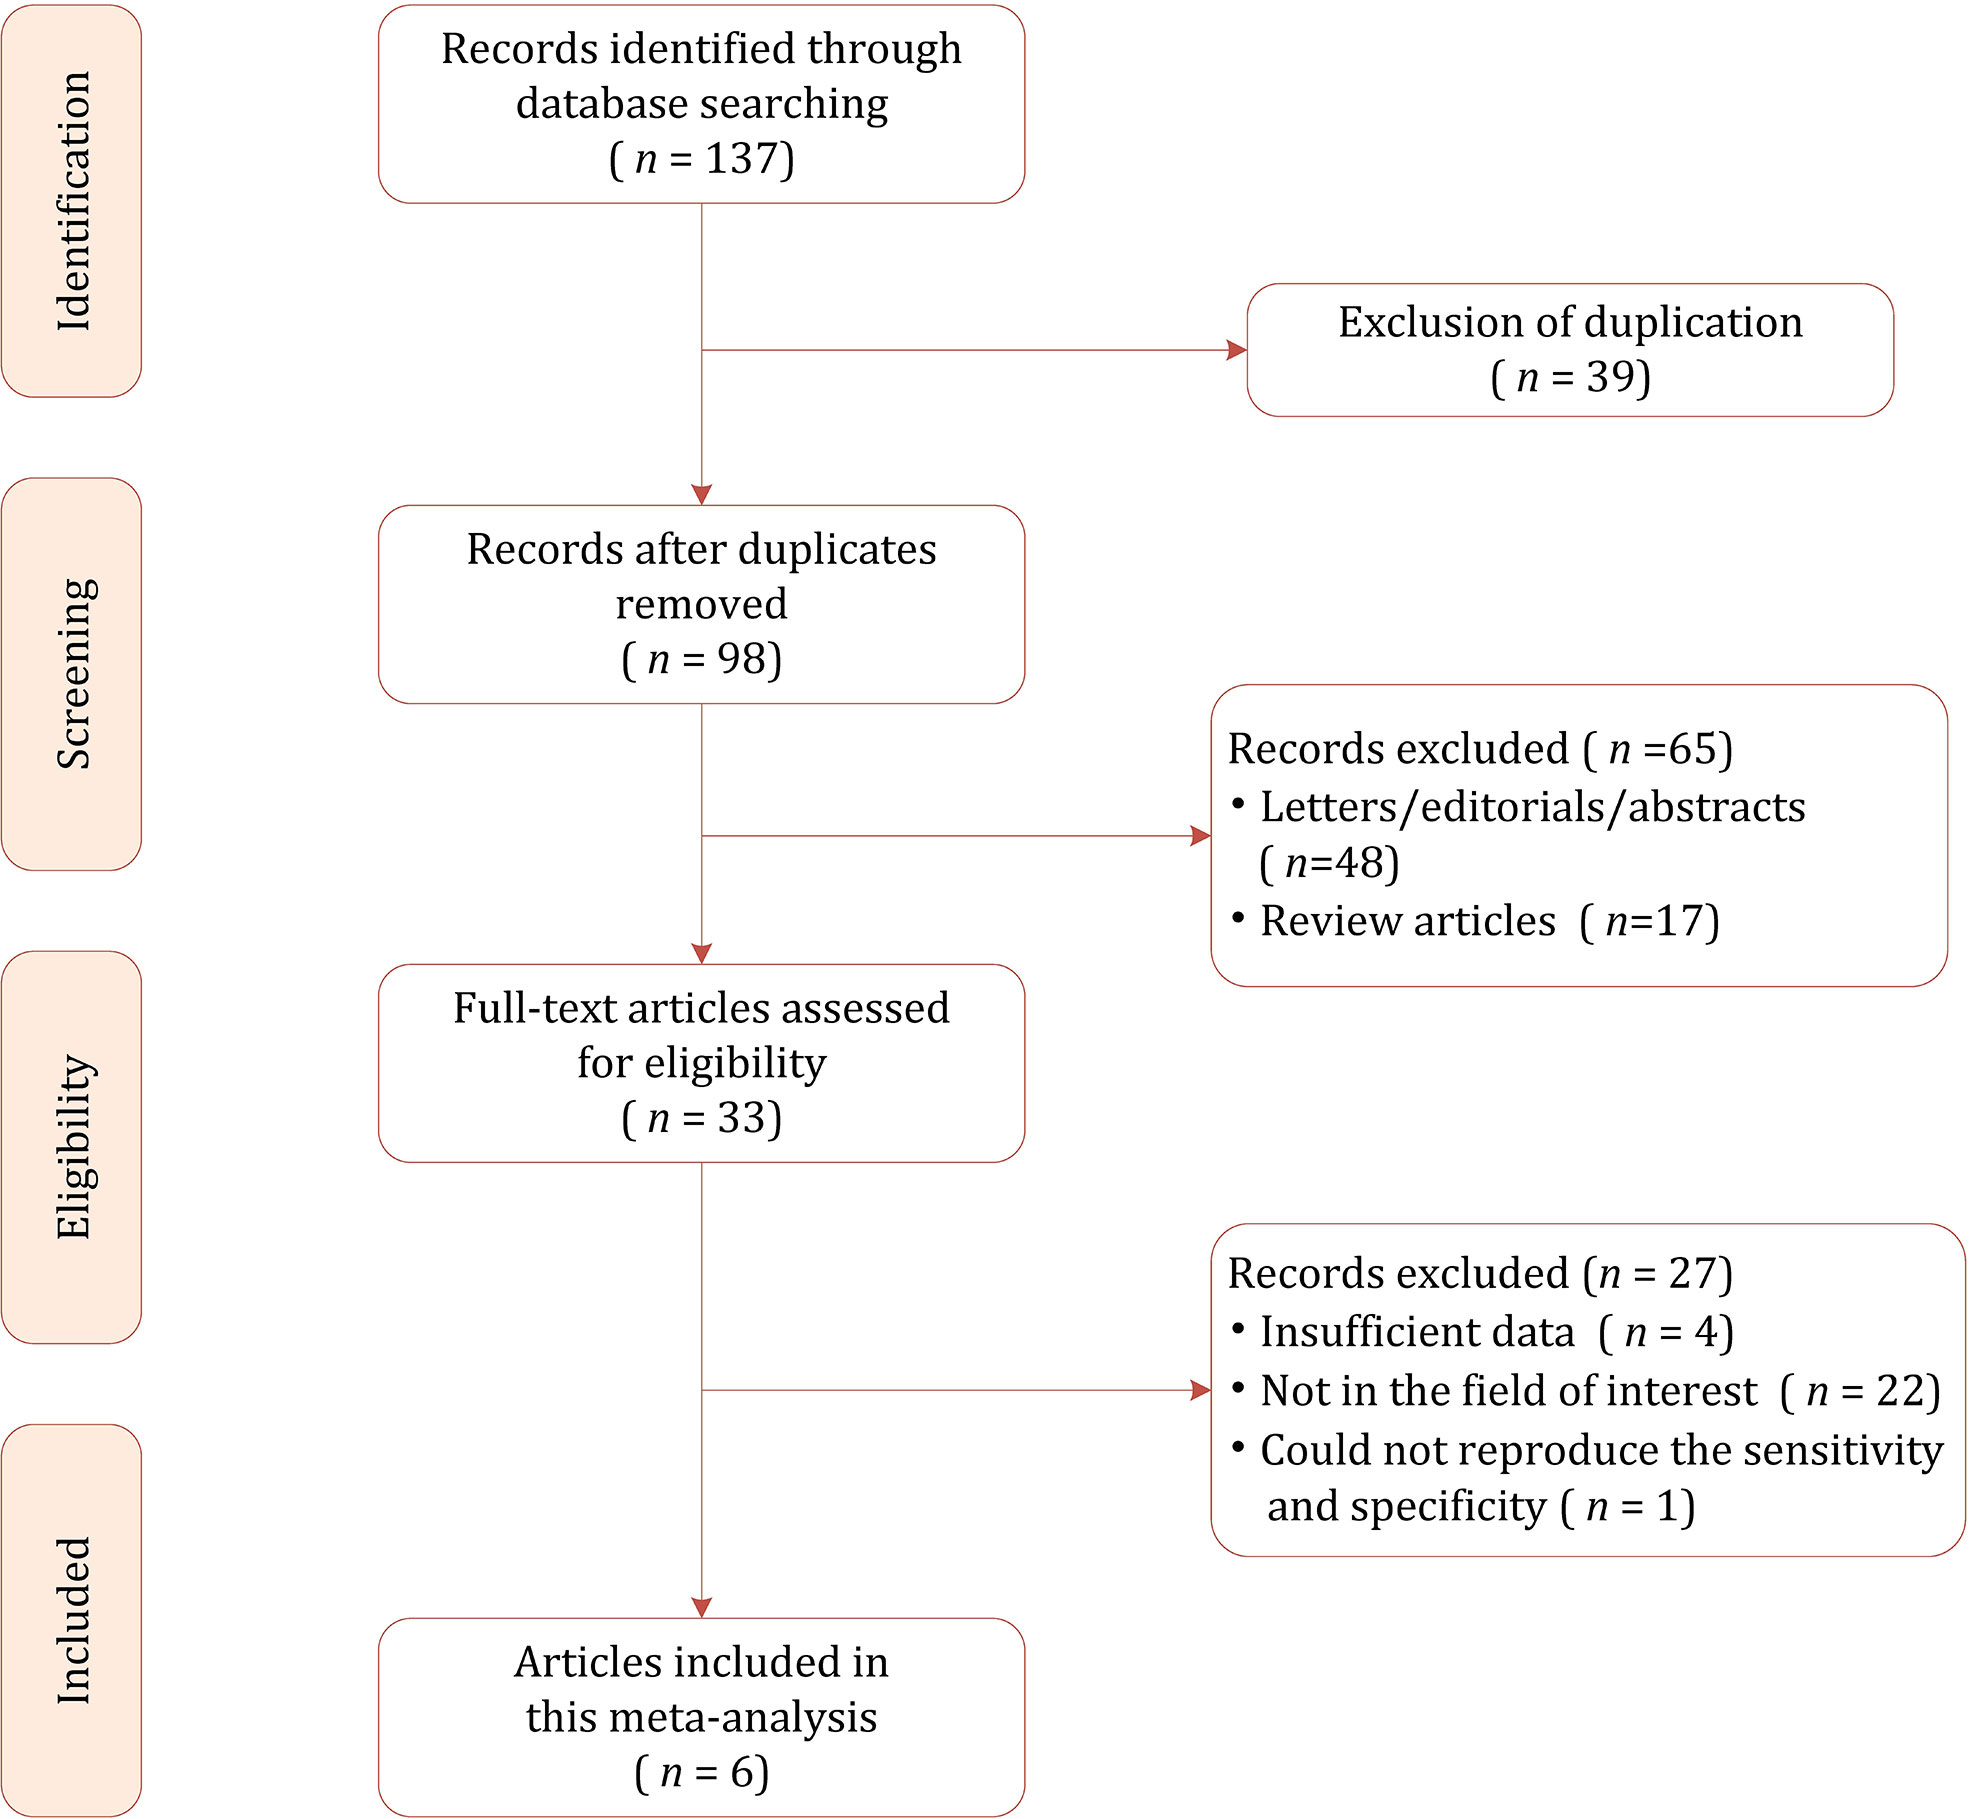
Figure 1 Study selection process for this systematic review and meta-analysis.
Characteristics of the included studies
The detailed demographic and study characteristics are summarized in Tables 1 and 2. Regarding study design, nearly all studies were retrospective, and the sample size of the study population ranged from 57 to 241 patients. The mean age for patients ranged from 57 to 67 years, with an average tumor size of 24-38 mm. The proportion of ccRCC among studies was 41.7%-65.7%. Regarding the number of radiologists, 1 study reported that images were interpreted by only one reader (28), whereas in the remaining 5 studies images were interpreted by at least 3 readers. The reported radiologists’ experience ranged from 1 to 30 years, with inter-reader agreement measured with kappa value of 0.53-0.65. Regarding cutoff values, 3 studies reported that the results were derived from the threshold of ccLS ≥4 (26, 28, 30), whereas the remaining 3 studies reported results from both ccLS ≥3 and ccLS≥4 (19, 27, 29). Concerning technique characteristics, nearly all studies reported that the images acquired from 1.5T or 3.0 T MRI; however, in one study the field strength was not reported (28). As for MRI protocol, only 3 studies used all sequences of T1, T2, dynamic contrast-enhanced (DCE), and diffusion-weighted imaging (DWI) (27, 29, 30). Concerning the reference standard, surgical resection pathological results were used in 4 studies, in the remaining 2 studies the biopsy results also were used in case of pathological results were not available (26, 27).
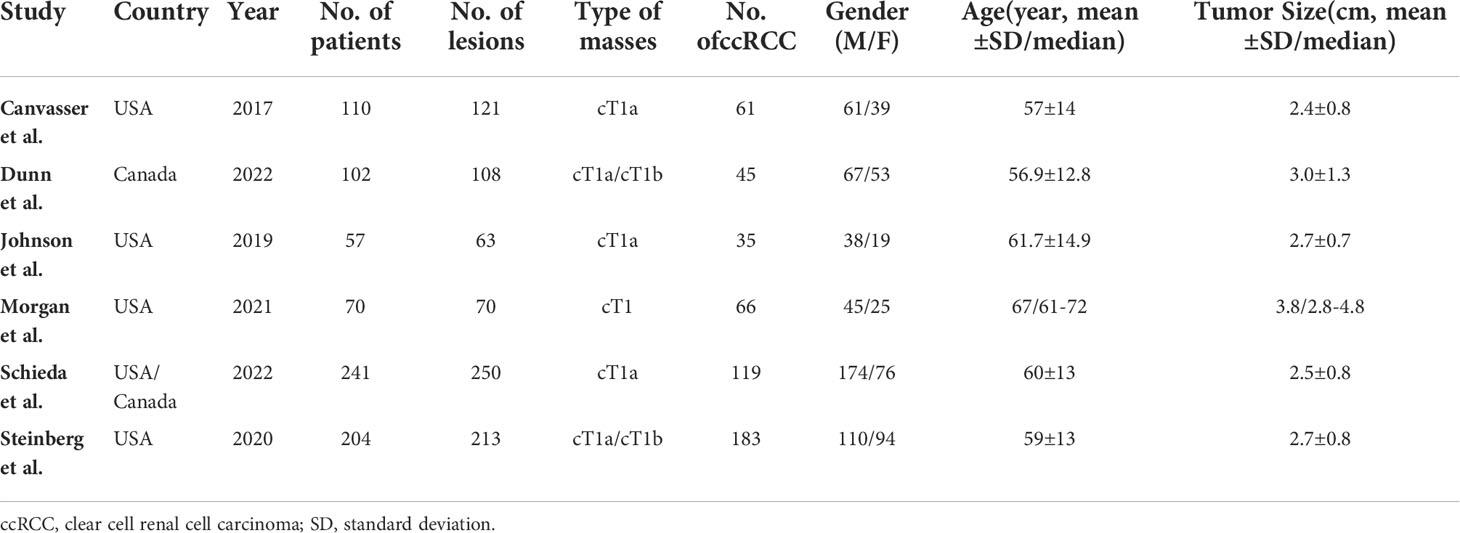
Table 1 Demographic Characteristics of Included Studies.
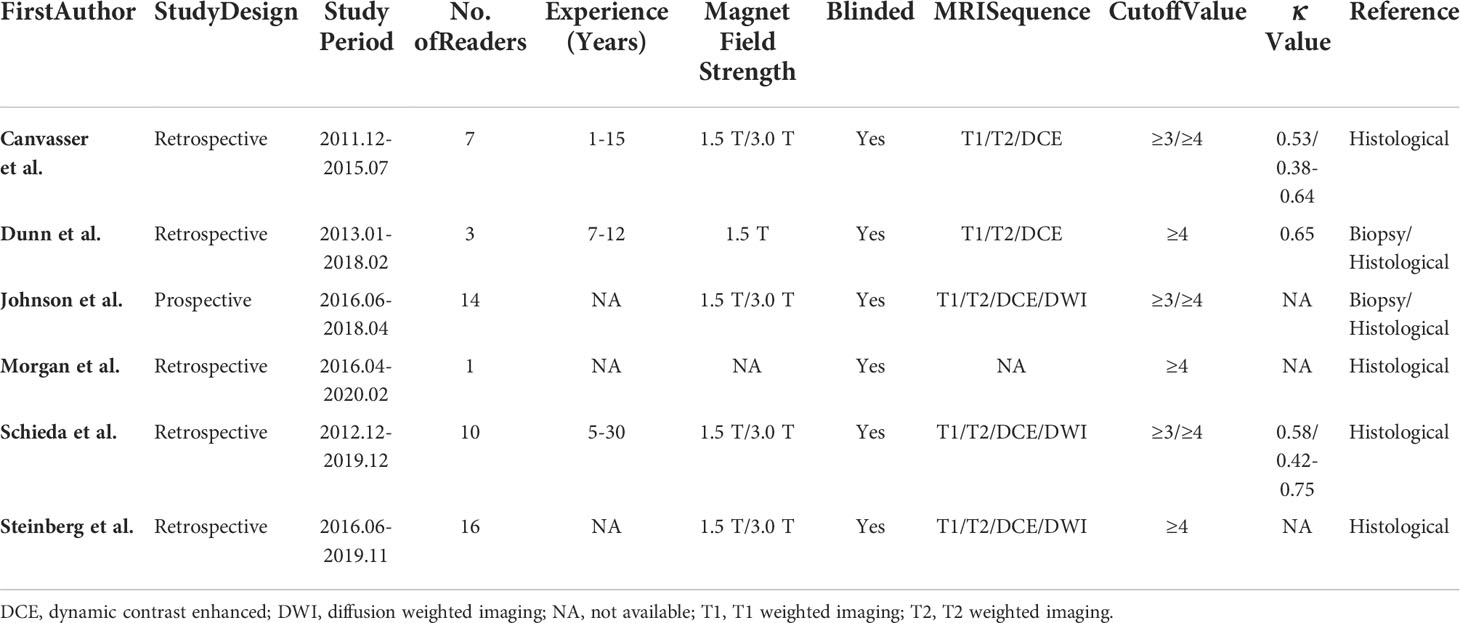
Table 2 Study Characteristics of Included Studies.
Quality assessment
The overall quality assessment of the included studies was high. With respect to the type of renal masses, 1 study included all of the cT1 renal masses, thus was assigned as high risk of bias. In more than half studies, the analysis was restricted to masses with confirmed pathological results, which may lead to selection and verification biases as those masses under surveillance and did not undergo histological confirmation were not included. For the reference standard domain, in 2 studies the biopsy results were also used as the reference standard. Concerning the flow and timing domain, all included studies were assigned low risk of bias, detailed quality assessment is presented in Figure 2.
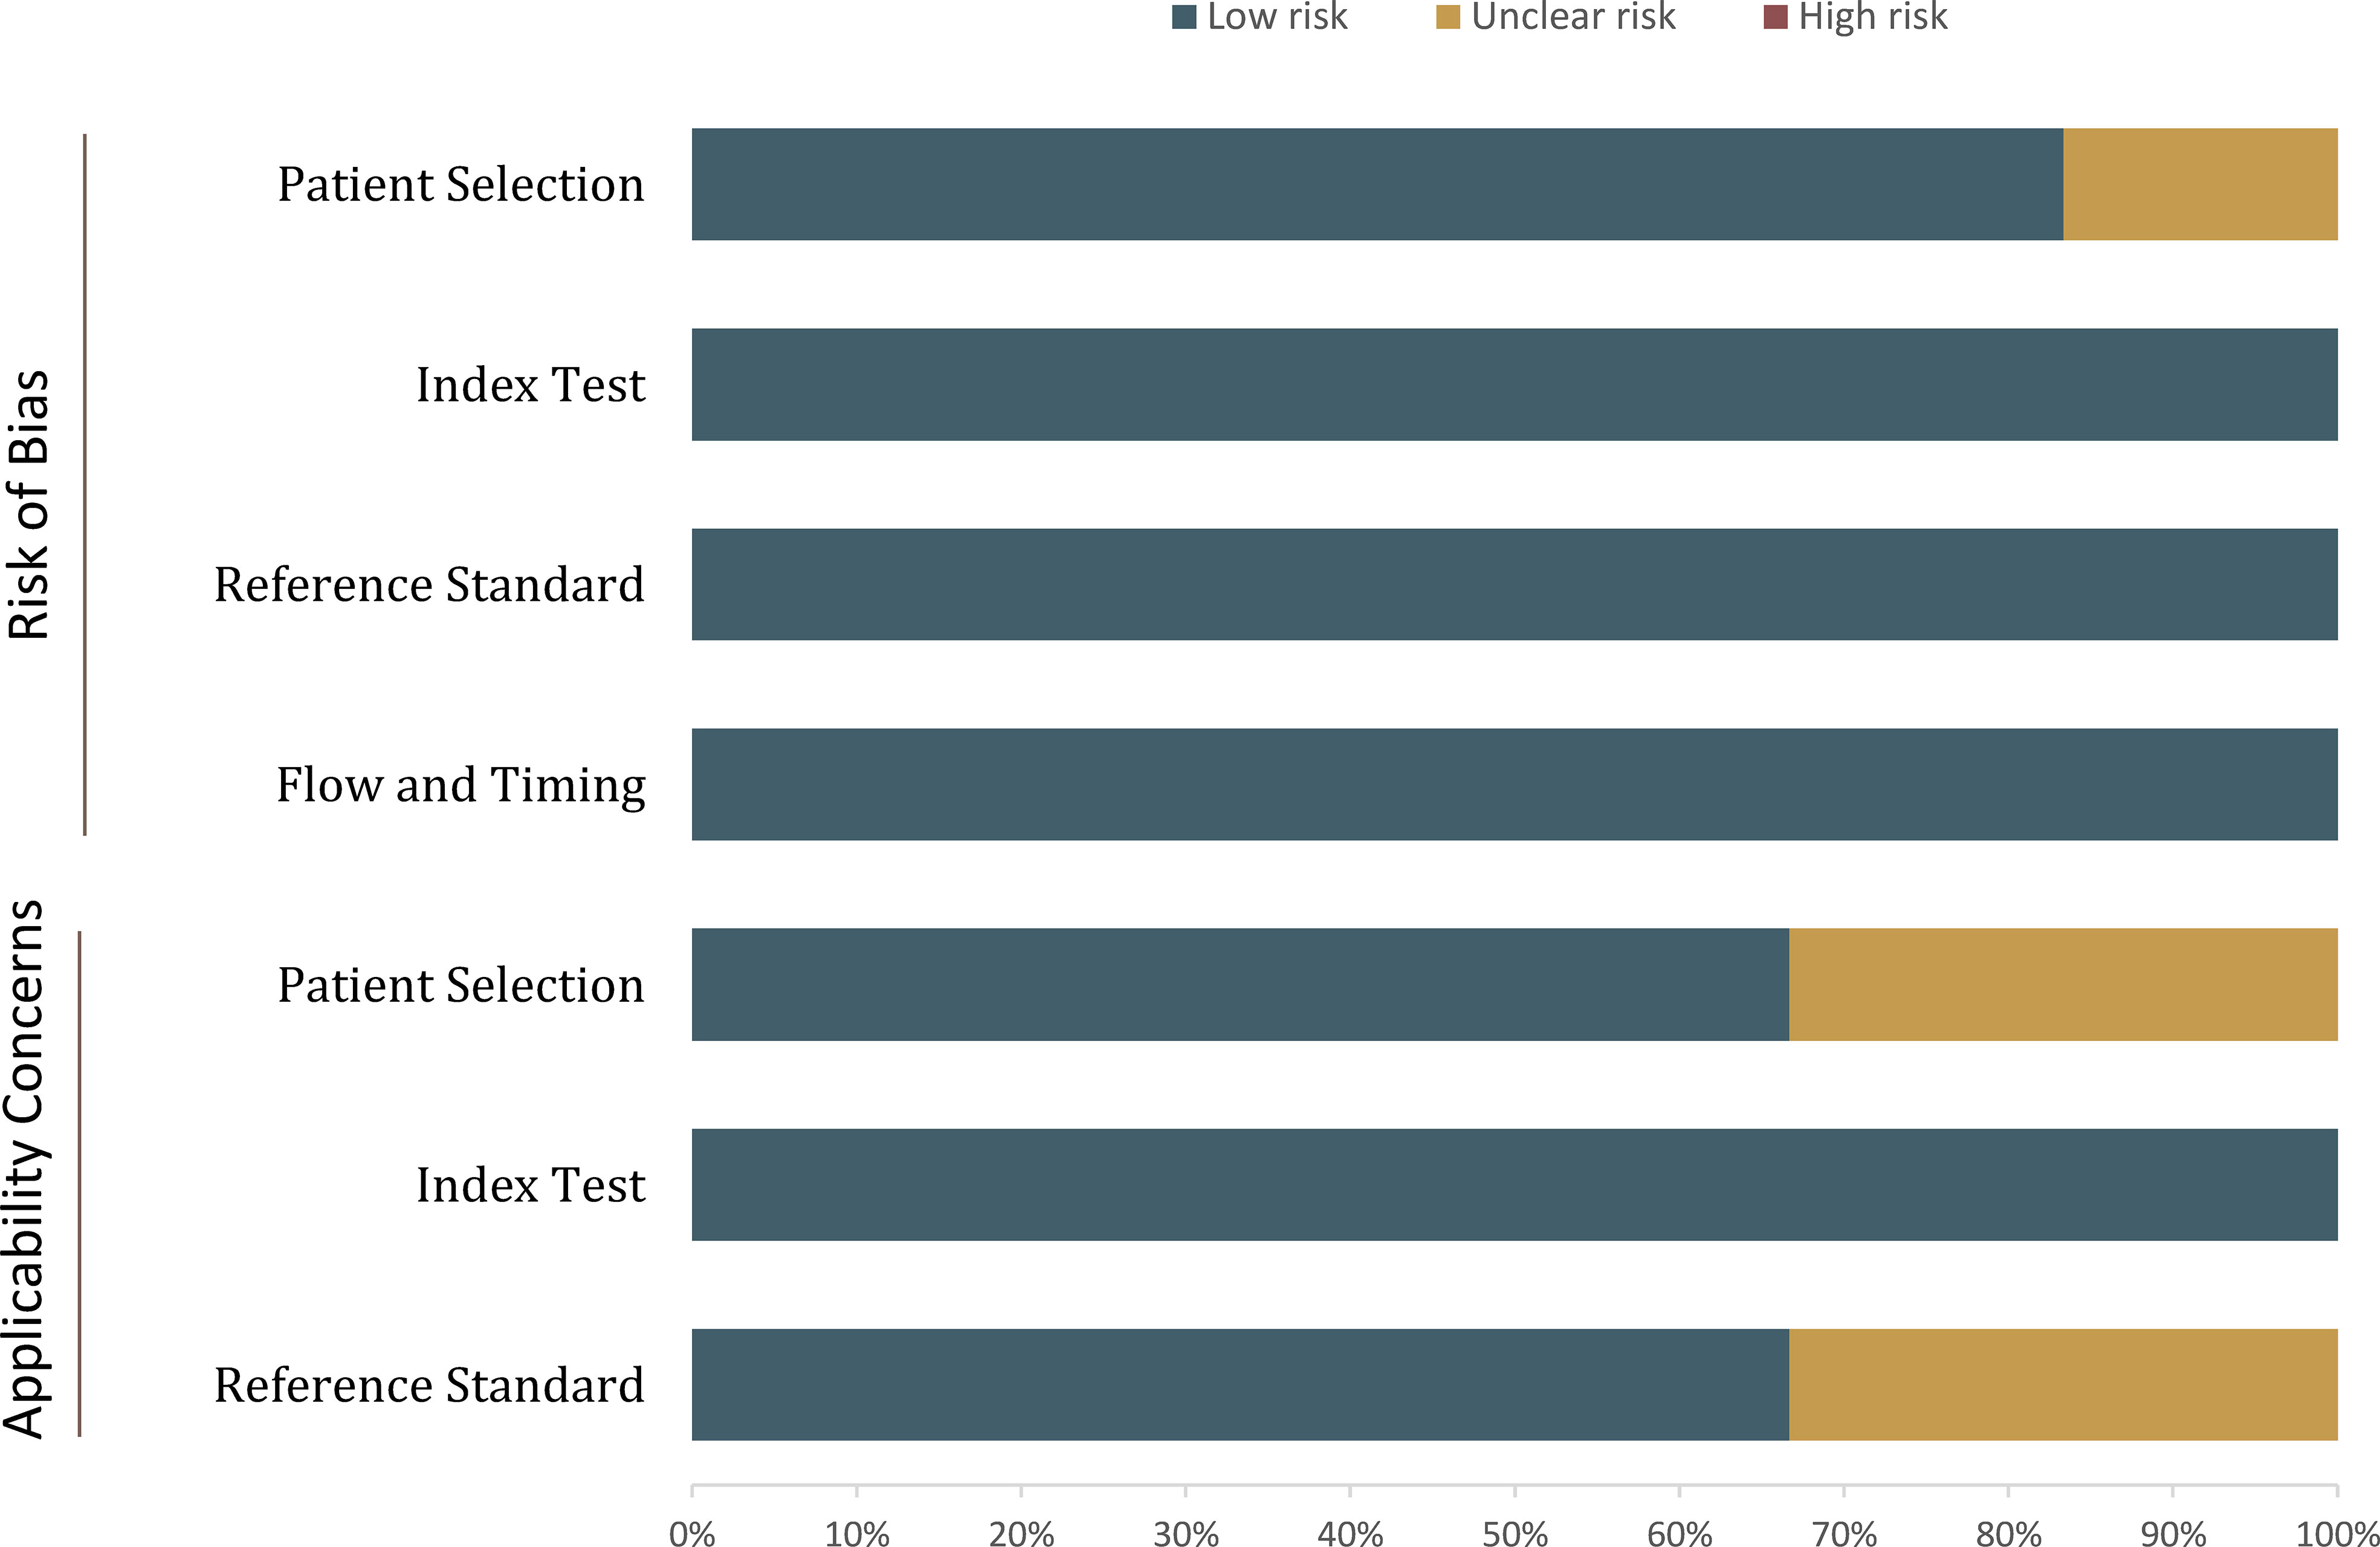
Figure 2 Grouped bar charts show the risk of bias and concerns for applicability of included studies.
Diagnostic performance of the ccLS for renal masses
For 5 studies using the ccLS for risk stratification of cT1a ccRCC, the sensitivity and specificity were 0.75-0.89 and 0.58-0.82 for individual studies. The summary estimates of sensitivity and specificity for cT1a renal masses were 0.80 (95% CI 0.75-0.85) and 0.74 (95% CI 0.65-0.81), respectively, with the area under HSROC of 0.84 (95% CI 0.81-0.87). Coupled forest plots are presented in Figure 3. The pooled LR+, LR−, and DOR were 3.04 (95% CI 2.34-3.95), 0.27 (95% CI 0.22–0.33), and 11.4 (95% CI 8.2-15.9), respectively (Figure 4). The Q test revealed substantial heterogeneity presented throughout studies (P<0.05), and Higgins I2 statistics also indicated substantial heterogeneity in terms of both sensitivity (I 2 =51.6%) and specificity (I2 = 75.9%). In the HSROC curve, a large difference between the 95% confidence region and the 95% prediction region suggested substantial heterogeneity among studies (Figure 5). The Deeks funnel plot is presented in Figure 6, the P value of 0.15 for the slope coefficient indicated that the likelihood of publication bias was not statistically significant.
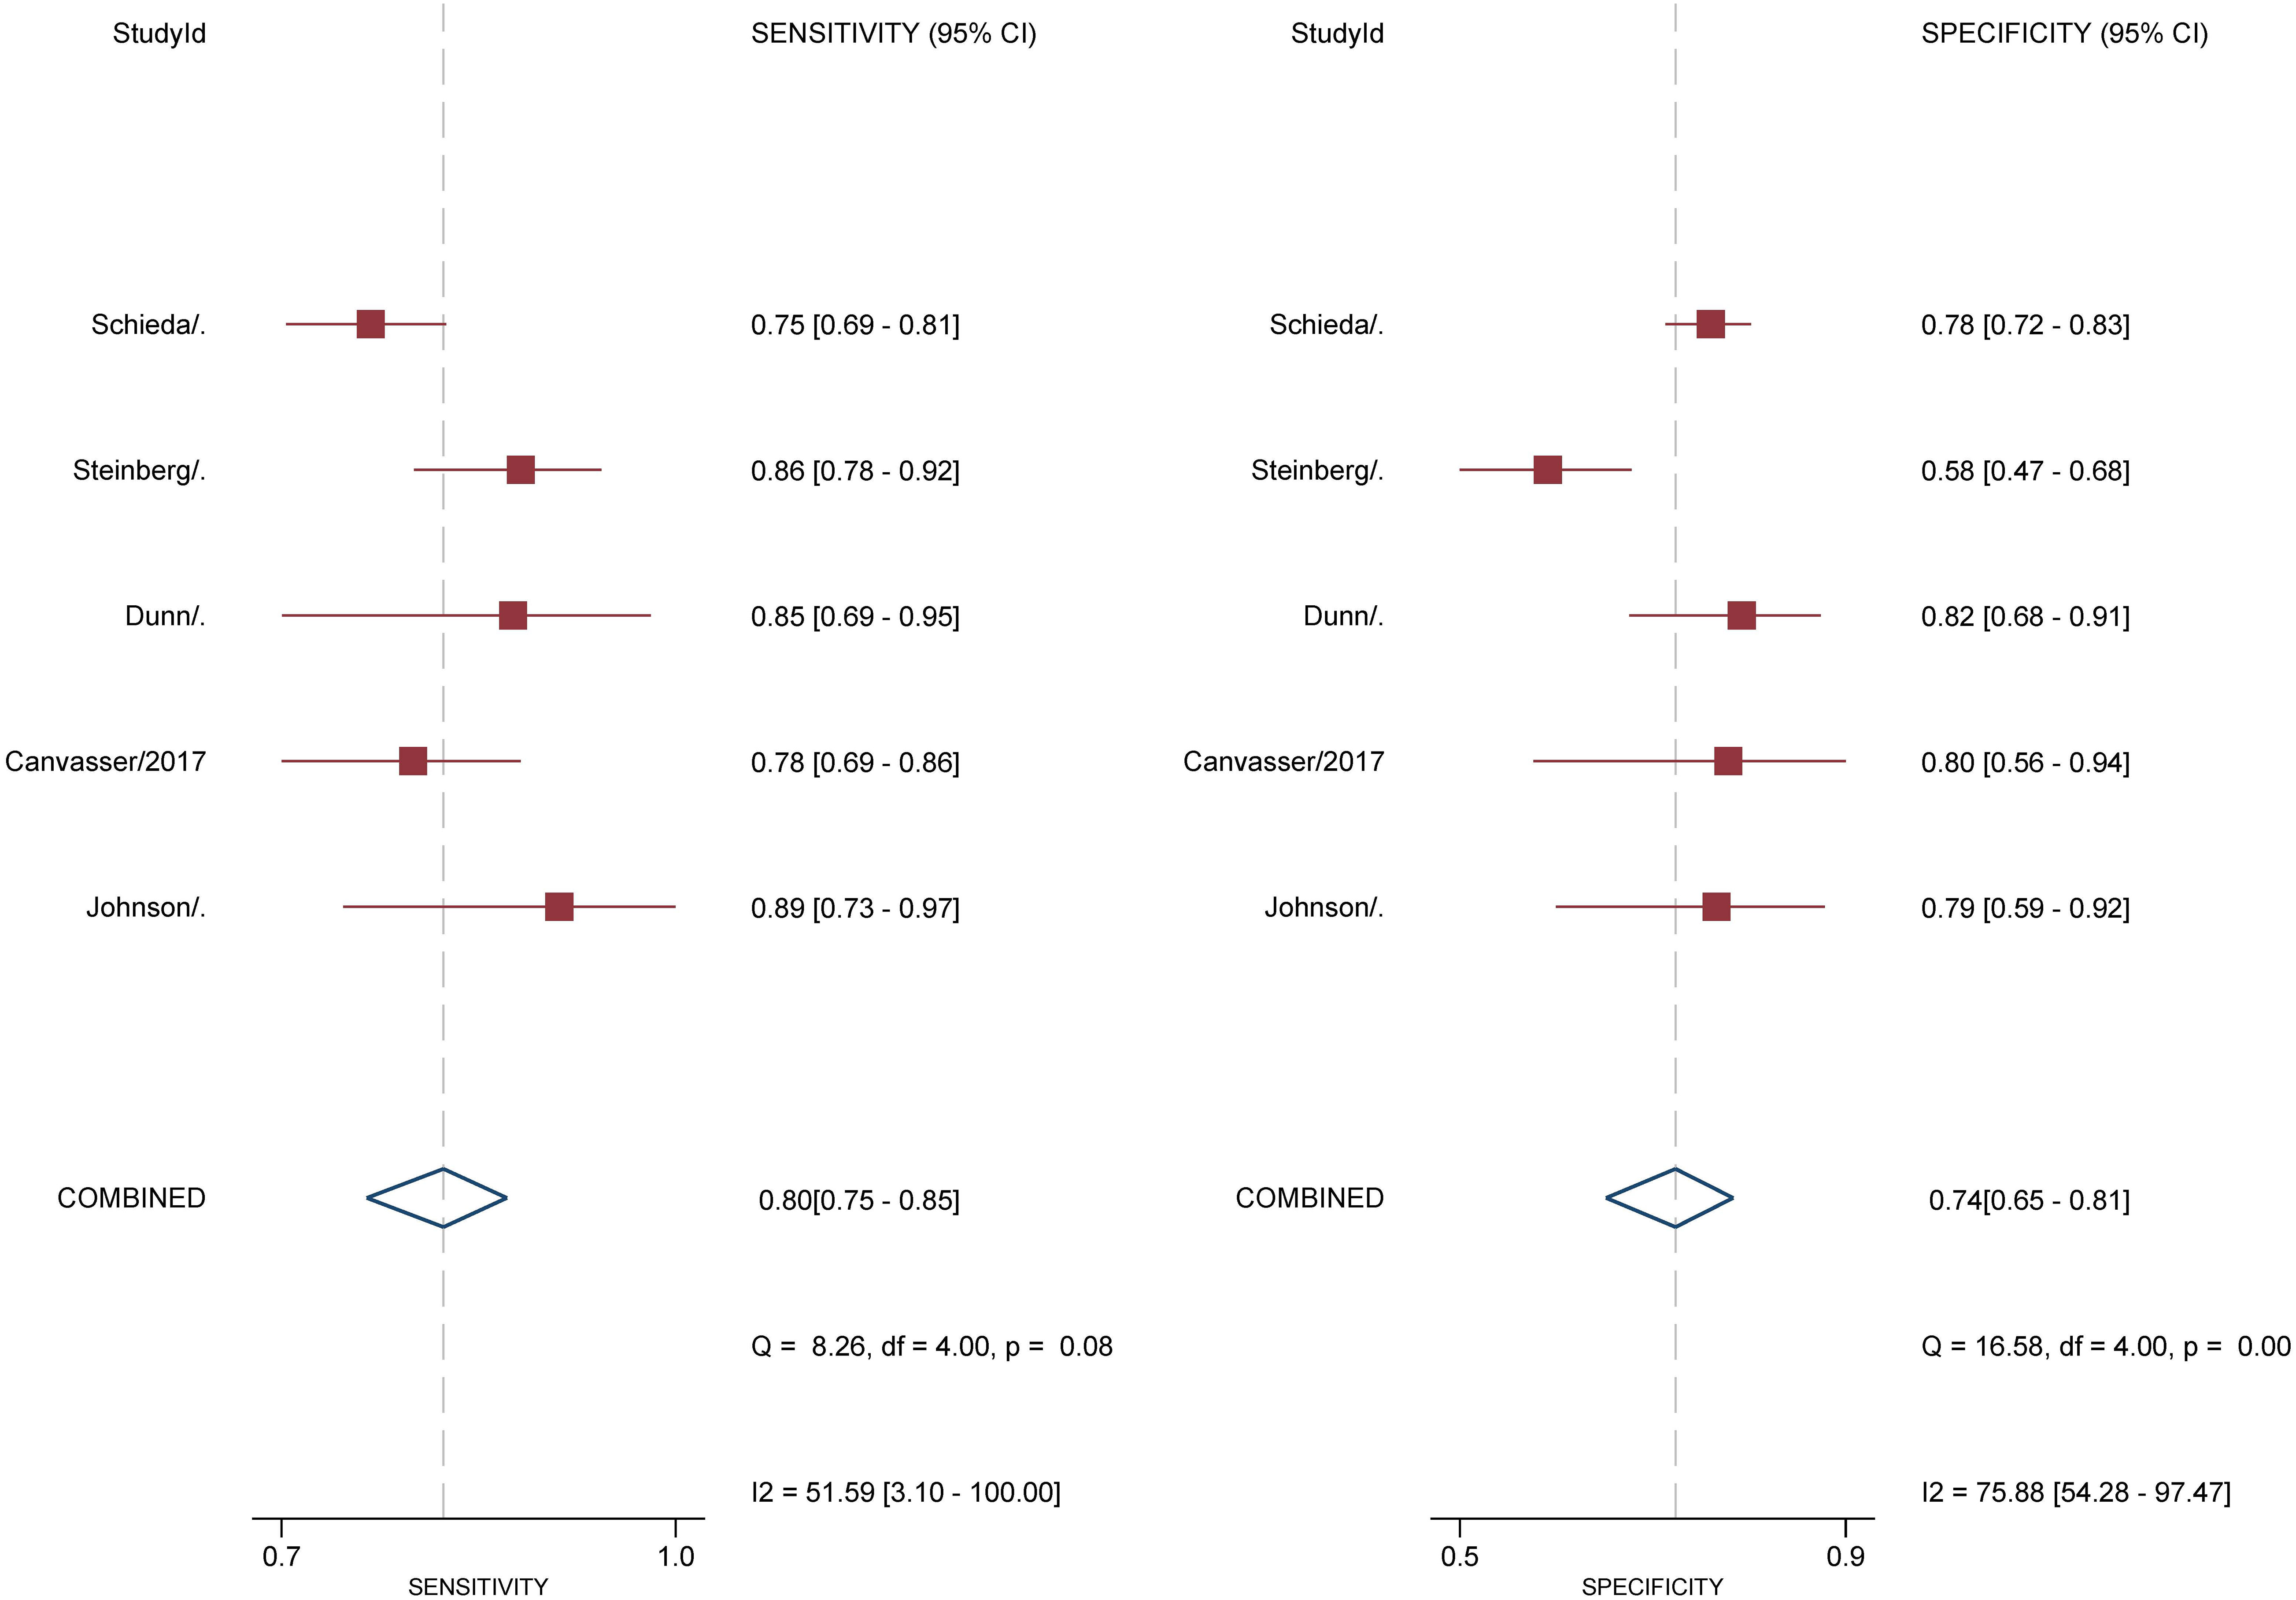
Figure 3 Coupled forest plot of pooled sensitivity and specificity. Numbers are pooled estimates with 95% CI in parentheses. Corresponding heterogeneity statistics are provided at bottom right corners. Horizontal lines indicate 95% confidence intervals.
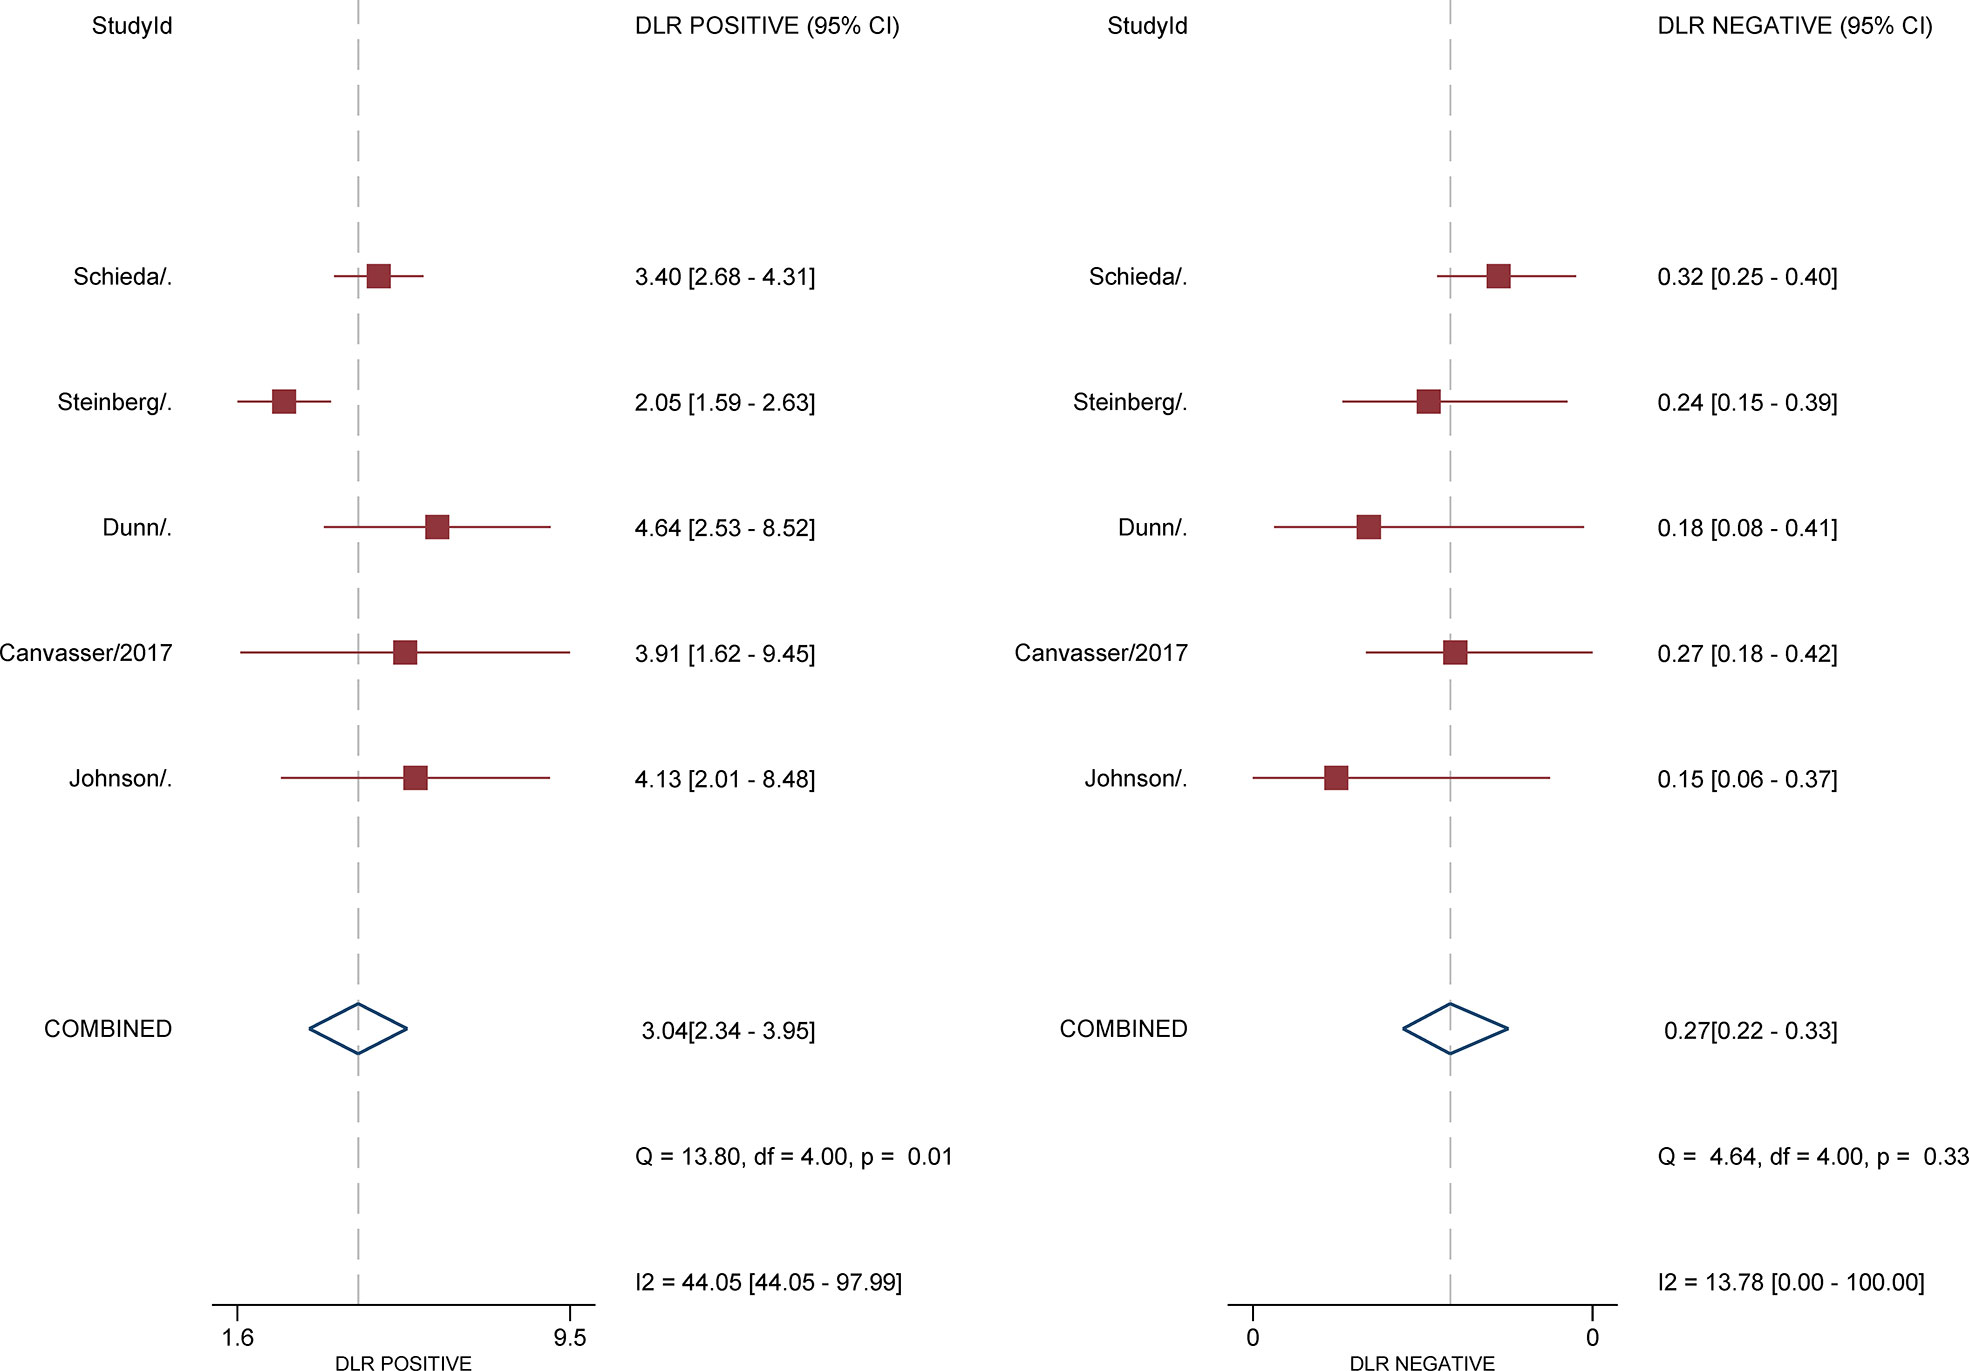
Figure 4 Coupled forest plot of pooled negative and positive likelihood ratios.
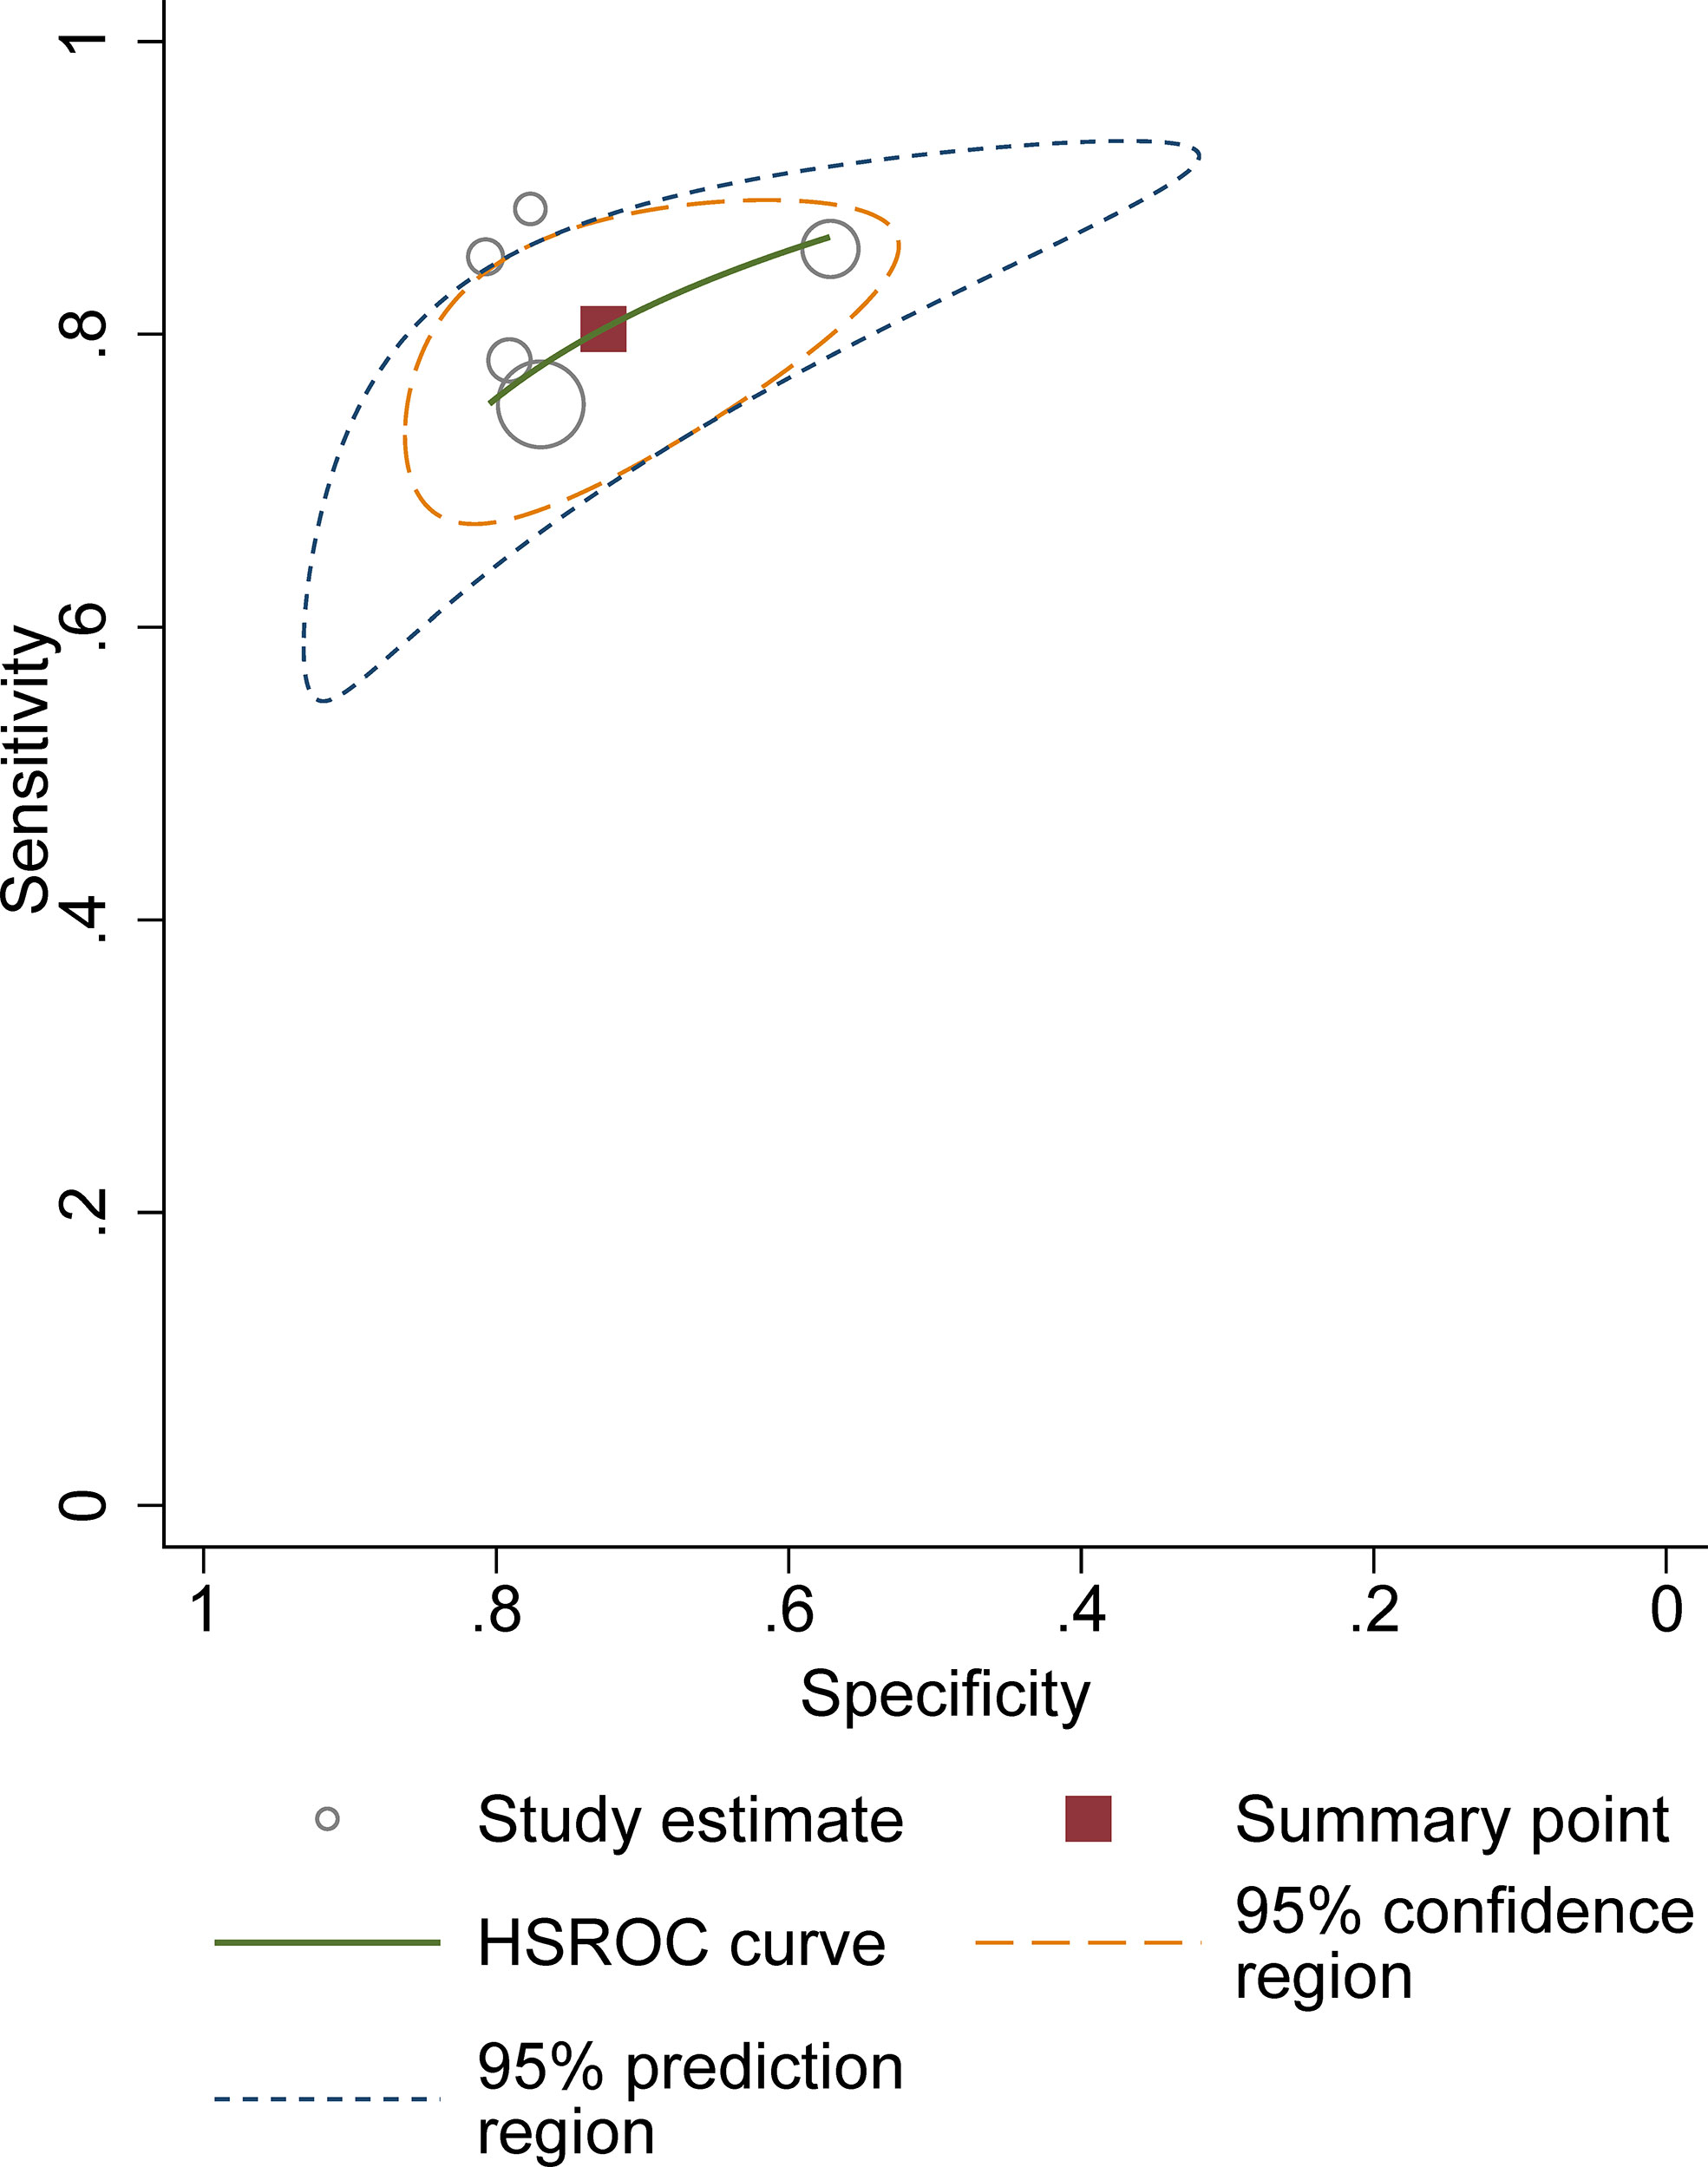
Figure 5 Hierarchic summary receiver operating characteristic plots with summary point and 95% confidence area for the overall.
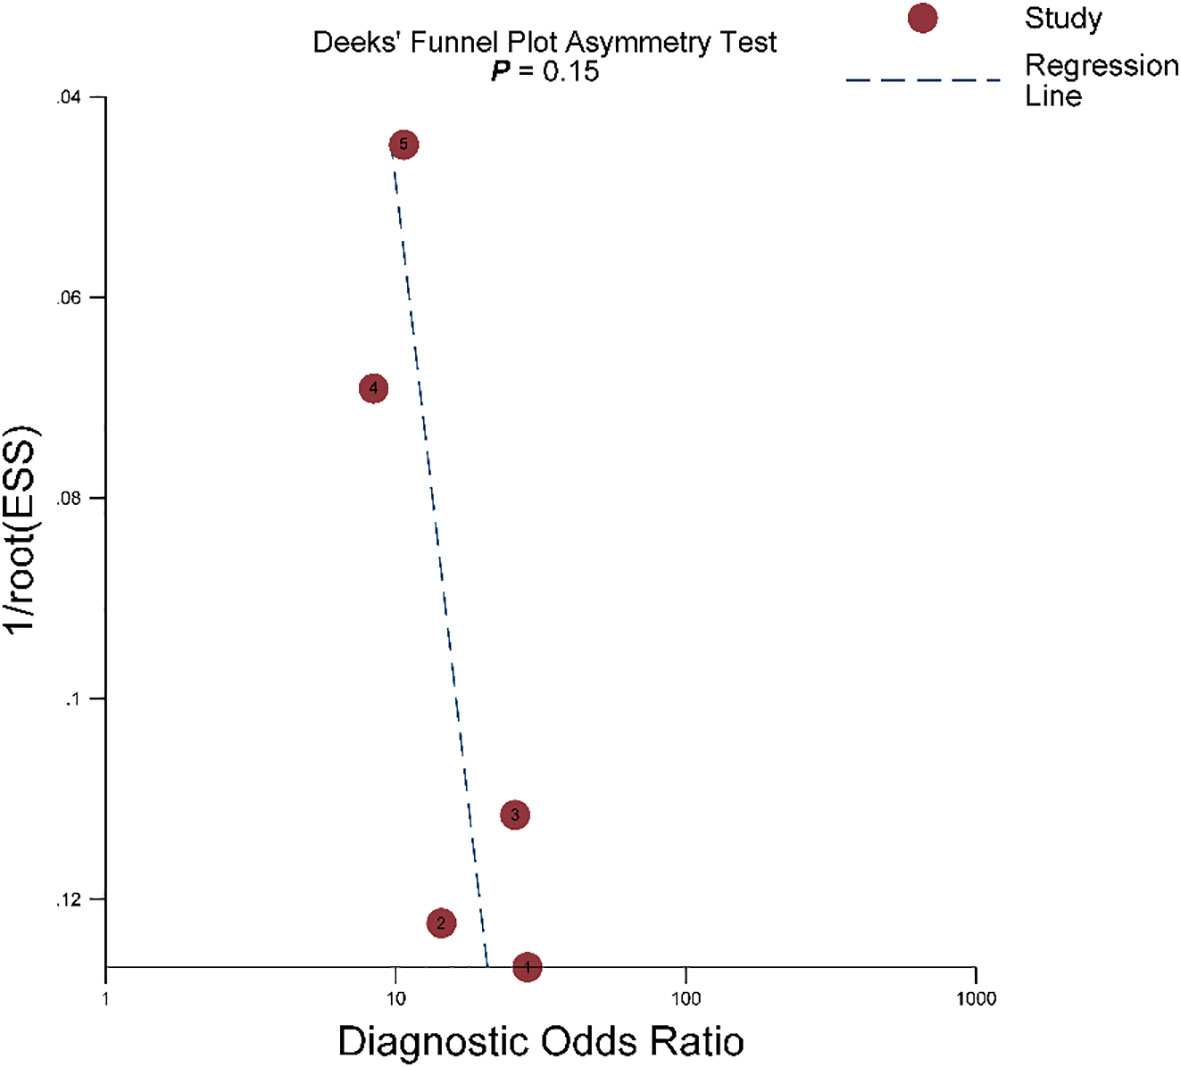
Figure 6 The Deeks’ funnel plot.
In the light of 3 studies providing the results of using the ccLS for stratification of cT1b renal masses, we then pooled the sensitivity and specificity of diagnostic accuracy for these lesions. The calculated summary estimates were comparable with cT1a masses, with pooled sensitivity and specificity of 0.83 (95% CI 0.71-0.89) and 0.78 (95% CI 0.58-0.91), respectively. For all cT1 renal masses (cT1a and cT1b), the pooled sensitivity and specificity were 0.80 (95% CI 0.74–0.85) and 0.76 (95% CI 0.67–0.83), with the calculated area under HSROC of 0.85 (0.82-0.88).
Discussion
In this study, we systematically assessed the diagnostic performance of the ccLS for the classification of solid SRMs. Based on 6 studies, the pooled sensitivity and specificity at the threshold of ccLS ≥4 were 0.80 and 0.74, demonstrating moderate accuracy for cT1a renal masses. Despite the primary goal of ccLS is for classification of cT1a masses, some studies have applied it to cT1b masses. Our study suggested that the ccLS could also work well for all cT1 masses, with sensitivity and specificity of 0.80 and 0.76, respectively. Nevertheless, due to the small sample the diagnostic performance of the ccLS for all cT1 still needs large prospective multi-center studies to validate in the future. Reproducibility is critical for the standardized scoring system, as it relates to reducing the variability of interpretation between readers and improving the classification of solid SRMs. In the current meta-analysis, the included studies reported moderate inter-reader agreement between radiologists, with kappa value of 0.53-0.65.
At present, both the American Urologic Association and the American Society of Clinical Oncology recommend active surveillance as an initial management option for small renal masses, which is based on the fact that although approximately 80%-85% of small renal masses are malignant, only a minority showed the aggressive histologic features associated with disease progression and metastasis (31). Moreover, considering the patient morbidity and healthcare costs, active surveillance has been regarded as a viable management option for incidental small renal masses (18). Nevertheless, for ccRCC, the most common cause of disease progression and metastasis, active surveillance may occasionally yield unfavorable outcomes (16). Therefore, the need for better risk stratification strategies for indeterminate small solid renal masses is the main barrier to the wide acceptance of active surveillance in clinical practice (11). The emergence of the ccLS algorithm provides an encouraging start of standardization for solid renal mass, which represents the routine viewing approach from radiologists with less experience. According to the ccLS, assessment of the renal masses includes two primary steps: eligibility criteria, ensuring the absence of macroscopic fat and at least mild (defined as 25%) contrast enhancement; and major criteria, assessing signal on T2-weighted MRI scans, corticomedullary contrast-enhancement degree, and presence of intra-lesion microscopic fat (32). In addition to offer an algorithm for assessing the likelihood of renal masses being ccRCC, Rasmussen et al. found that SRMs assigned ccLS category 4–5 grew at a faster rate than those assigned ccLS category 1–2 or ccLS category 3, which could help avoid pathologic confirmation through biopsy in many patients before recommending active surveillance or other intervention (33).
As compared with CT, MRI provides excellent soft-tissue contrast to differentiate those solid from cystic masses when enhancement is questionable on CT, especially for lesions between 10 and 20 HU (34). Furthermore, with DCE and functional information such as DWI, MRI can provide specific information regarding tumor histology, to acquire multiple postcontrast phases routinely without ironizing radiation (35). Although using the ccLS algorithm yielded similar diagnostic accuracy to radiologists’ personal experience, this standardized workflow can assist radiologists with less experience to assess small SRMs with MRI (36). Moreover, the reported inter-reader agreement for this classification seemed moderate and comparable with other existing standardized scoring systems such as PI-RADS and TI-RADS (37, 38). Despite the ccLS has been assessed in several institutions, some improvements should be taken into account in the future version, e.g., the ccLS does not consider the other 2 RCC subtypes of papillary and chromophobe (32).
Our study has limitations that deserve mention. First, regarding study design, nearly all studies included were retrospective, which led to high risk of bias in terms of the patient selection domain. Nonetheless, considering that there was only one study of prospective, it was unfeasible to pool data for a single study. Second, considerable heterogeneity was observed between studies, which may lower the applicability of our study. Nevertheless, it is unfeasible to conduct meta-regression to explore the source of heterogeneity because merely 6 studies were included. However, the methodology for this meta-analysis was conducted strictly according to the Cochrane Collaboration guideline. Third, all studies did not report the results of experienced and inexperienced readers separately, therefore whether ccLS could work well among radiologists with less unknown is still unknown.
Conclusion
Use of the ccLS algorithm could yield moderate sensitivity and specificity for evaluation of ccRCC, with a moderate inter-reader agreement. Considering the complex subtype of RCC, the ccLS offers an encouraging start of standardization for the assessment of ccRCC. However, its diagnostic performance needs multi-center large cohort studies to validate in the future.
Data availability statement
The original contributions presented in the study are included in the article/supplementary material. Further inquiries can be directed to the corresponding author.
Author contributions
All authors listed have made a substantial, direct, and intellectual contribution to the work, and approved it for publication.
Conflict of interest
The authors declare that the research was conducted in the absence of any commercial or financial relationships that could be construed as a potential conflict of interest.
Publisher’s note
All claims expressed in this article are solely those of the authors and do not necessarily represent those of their affiliated organizations, or those of the publisher, the editors and the reviewers. Any product that may be evaluated in this article, or claim that may be made by its manufacturer, is not guaranteed or endorsed by the publisher.
References
1. Heilbrun ME, Remer EM, Casalino DD, Beland MD, Bishoff JT, Blaufox MD, et al. ACR appropriateness criteria indeterminate renal mass. J Am Coll Radiol (2015) 12:333–41. doi: 10.1016/j.jacr.2014.12.012
2. Meyer HJ, Pfeil A, Schramm D, Bach AG, Surov A. Renal incidental findings on computed tomography: Frequency and distribution in a large non selected cohort. Med (Baltimore) (2017) 96:e7039. doi: 10.1097/MD.0000000000007039
3. O’Connor SD, Pickhardt PJ, Kim DH, Oliva MR, Silverman SG. Incidental finding of renal masses at unenhanced CT: Prevalence and analysis of features for guiding management. AJR Am J Roentgenol (2011) 197:139–45. doi: 10.2214/AJR.10.5920
4. Volpe A, Panzarella T, Rendon RA, Haider MA, Kondylis FI, Jewett MAS. The natural history of incidentally detected small renal masses. Cancer (2004) 100:738–45. doi: 10.1002/cncr.20025
5. Laguna MP, Algaba F, Cadeddu J, Clayman R, Gill I, Gueglio G, et al. Current patterns of presentation and treatment of renal masses: A clinical research office of the endourological society prospective study. J Endourol (2014) 28:861–70. doi: 10.1089/end.2013.0724
6. Cooperberg MR, Mallin K, Ritchey J, Villalta JD, Carroll PR, Kane CJ. Decreasing size at diagnosis of stage 1 renal cell carcinoma: Analysis from the national cancer data base, 1993 to 2004. J Urol (2008) 179:2131–5. doi: 10.1016/j.juro.2008.01.097
7. Hollingsworth JM, Miller DC, Daignault S, Hollenbeck BK. Rising incidence of small renal masses: A need to reassess treatment effect. J Natl Cancer Inst (2006) 98:1331–4. doi: 10.1093/jnci/djj362
8. Chawla SN, Crispen PL, Hanlon AL, Greenberg RE, Chen DYT, Uzzo RG. The natural history of observed enhancing renal masses: Meta-analysis and review of the world literature. J Urol (2006) 175:425–31. doi: 10.1016/S0022-5347(05)00148-5
9. Finelli A, Cheung DC, Al-Matar A, Evans AJ, Morash CG, Pautler SE, et al. Small renal mass surveillance: Histology-specific growth rates in a biopsy-characterized cohort. Eur Urol (2020) 78:460–7. doi: 10.1016/j.eururo.2020.06.053
10. Lim CS, Schieda N, Silverman SG. Update on indications for percutaneous renal mass biopsy in the era of advanced CT and MRI. AJR Am J Roentgenol (2019) 212:1187–96. doi: 10.2214/AJR.19.21093
11. Schieda N, Krishna S, Pedrosa I, Kaffenberger SD, Davenport MS, Silverman SG. Active surveillance of renal masses: The role of radiology. Radiology (2022) 302:11–24. doi: 10.1148/radiol.2021204227
12. Sun MRM, Ngo L, Genega EM, Atkins MB, Finn ME, Rofsky NM, et al. Renal cell carcinoma: dynamic contrast-enhanced MR imaging for differentiation of tumor subtypes–correlation with pathologic findings. Radiology (2009) 250:793–802. doi: 10.1148/radiol.2503080995
13. Bosniak MA. The bosniak renal cyst classification: 25 years later. Radiology (2012) 262:781–5. doi: 10.1148/radiol.11111595
14. Silverman SG, Pedrosa I, Ellis JH, Hindman NM, Schieda N, Smith AD, et al. Bosniak classification of cystic renal masses, version 2019: An update proposal and needs assessment. Radiology (2019) 292:475–88. doi: 10.1148/radiol.2019182646
15. Sasiwimonphan K, Takahashi N, Leibovich BC, Carter RE, Atwell TD, Kawashima A. Small (<4 cm) renal mass: Differentiation of angiomyolipoma without visible fat from renal cell carcinoma utilizing MR imaging. Radiology (2012) 263:160–8. doi: 10.1148/radiol.12111205
16. Cheville JC, Lohse CM, Zincke H, Weaver AL, Blute ML. Comparisons of outcome and prognostic features among histologic subtypes of renal cell carcinoma. Am J Surg Pathol (2003) 27:612–24. doi: 10.1097/00000478-200305000-00005
17. Hötker AM, Karlo CA, Zheng J, Moskowitz CS, Russo P, Hricak H, et al. Clear cell renal cell carcinoma: Associations between CT features and patient survival. AJR Am J Roentgenol (2016) 206:1023–30. doi: 10.2214/AJR.15.15369
18. Lopes Vendrami C, Parada Villavicencio C, DeJulio TJ, Chatterjee A, Casalino DD, Horowitz JM, et al. Differentiation of solid renal tumors with multiparametric MR imaging. Radiogr Rev Publ Radiol Soc N Am Inc (2017) 37:2026–42. doi: 10.1148/rg.2017170039
19. Canvasser NE, Kay FU, Xi Y, Pinho DF, Costa D, de Leon AD, et al. Diagnostic accuracy of multiparametric magnetic resonance imaging to identify clear cell renal cell carcinoma in cT1a renal masses. J Urol (2017) 198:780–6. doi: 10.1016/j.juro.2017.04.089
20. Liberati A, Altman DG, Tetzlaff J, Mulrow C, Gøtzsche PC, Ioannidis JPA, et al. The PRISMA statement for reporting systematic reviews and meta-analyses of studies that evaluate healthcare interventions: explanation and elaboration. Epidemiol Biostat Public Health (2009) 6:e1–e34. doi: 10.1136/bmj.b2700
21. Whiting PF. QUADAS-2: A revised tool for the quality assessment of diagnostic accuracy studies. Ann Intern Med (2011) 155:529. doi: 10.7326/0003-4819-155-8-201110180-00009
22. Reitsma JB, Glas AS, Rutjes AWS, Scholten RJPM, Bossuyt PM, Zwinderman AH. Bivariate analysis of sensitivity and specificity produces informative summary measures in diagnostic reviews. J Clin Epidemiol (2005) 58:982–90. doi: 10.1016/j.jclinepi.2005.02.022
23. Rutter CM, Gatsonis CA. A hierarchical regression approach to meta-analysis of diagnostic test accuracy evaluations. Stat Med (2001) 20:2865–84. doi: 10.1002/sim.942
24. Deeks JJ. Systematic reviews of evaluations of diagnostic and screening tests. BMJ (2001) 323:157–62. doi: 10.1136/bmj.323.7305.157
25. Higgins JPT, Altman DG, Gøtzsche PC, Jüni P, Moher D, Oxman AD, et al. The cochrane collaboration’s tool for assessing risk of bias in randomised trials. BMJ (2011) 343:889–93. doi: 10.1136/bmj.d5928
26. Dunn M, Linehan V, Clarke SE, Keough V, Nelson R, Costa AF. Diagnostic performance and interreader agreement of the MRI clear cell likelihood score for characterization of cT1a and cT1b solid renal masses: An external validation study. Am J Roentgenol (2022) 1–11. doi: 10.2214/AJR.22.27378
27. Johnson BA, Kim S, Steinberg RL, de Leon AD, Pedrosa I, Cadeddu JA. Diagnostic performance of prospectively assigned clear cell likelihood scores (ccLS) in small renal masses at multiparametric magnetic resonance imaging. Urol Oncol (2019) 37:941–6. doi: 10.1016/j.urolonc.2019.07.023
28. Morgan T, Dai J, Kommidi V, Kusin S, Pedrosa I, Cadeddu J. Mp49-02 clear cell likelihood scores (ccls) on multiparametric mri decreases benign pathology rates in patients with chronic kidney disease (ckd) being considered for extirpative nephron sparing surgery (nss). J Urol (2021) 206:e874–5. doi: 10.1097/JU.0000000000002075.02
29. Schieda N, Davenport MS, Silverman SG, Bagga B, Barkmeier D, Blank Z, et al. Multicenter evaluation of multiparametric MRI clear cell likelihood scores in solid indeterminate small renal masses. Radiology (2022) 303:590–9. doi: 10.1148/radiol.211680
30. Steinberg RL, Rasmussen RG, Johnson BA, Ghandour R, De Leon AD, Xi Y, et al. Prospective performance of clear cell likelihood scores (ccLS) in renal masses evaluated with multiparametric magnetic resonance imaging. Eur Radiol (2021) 31:314–24. doi: 10.1007/s00330-020-07093-0
31. Campbell SC, Clark PE, Chang SS, Karam JA, Souter L, Uzzo RG. Renal mass and localized renal cancer: Evaluation, management, and follow-up: AUA guideline: Part I. J Urol (2021) 206:199–208. doi: 10.1097/JU.0000000000001911
32. Pedrosa I, Cadeddu JA. How we do it: Managing the indeterminate renal mass with the MRI clear cell likelihood score. Radiology (2022) 302:256–69. doi: 10.1148/radiol.210034
33. Rasmussen RG, Xi Y, Sibley RC, Lee CJ, Cadeddu JA, Pedrosa I. Association of clear cell likelihood score on MRI and growth kinetics of small solid renal masses on active surveillance. AJR Am J Roentgenol (2022) 218:101–10. doi: 10.2214/ajr.21.25979
34. Kay FU, Pedrosa I. Imaging of solid renal masses. Radiol Clin North Am (2017) 55:243–58. doi: 10.1016/j.rcl.2016.10.003
35. Schieda N, Davenport MS, Pedrosa I, Shinagare A, Chandarana H, Curci N, et al. Renal and adrenal masses containing fat at MRI: Proposed nomenclature by the society of abdominal radiology disease-focused panel on renal cell carcinoma. J Magn Reson Imaging JMRI (2019) 49:917–26. doi: 10.1002/jmri.26542
36. Mileto A, Potretzke TA. Standardized evaluation of small renal masses using the MRI clear cell likelihood score. Radiology (2022) 303:600–2. doi: 10.1148/radiol.220054
37. Li W, Wang Y, Wen J, Zhang L, Sun Y. Diagnostic performance of American college of radiology TI-RADS: A systematic review and meta-analysis. Am J Roentgenol (2020) 216:38–47. doi: 10.2214/AJR.19.22691
Keywords: clear cell likelihood score, MRI, classification, meta-analysis, small renal mass
Citation: Tian J, Teng F, Xu H, Zhang D, Chi Y and Zhang H (2022) Systematic review and meta-analysis of multiparametric MRI clear cell likelihood scores for classification of small renal masses. Front. Oncol. 12:1004502. doi: 10.3389/fonc.2022.1004502
Received: 27 July 2022; Accepted: 11 October 2022;
Published: 26 October 2022.
Edited by:
Harm Van Melick, St. Antonius Hospital, NetherlandsReviewed by:
Asif Yildirim, Istanbul Medeniyet University, Turkey;Barun Bagga, Langone Medical Center, New York University, United StatesCopyright © 2022 Tian, Teng, Xu, Zhang, Chi and Zhang. This is an open-access article distributed under the terms of the Creative Commons Attribution License (CC BY). The use, distribution or reproduction in other forums is permitted, provided the original author(s) and the copyright owner(s) are credited and that the original publication in this journal is cited, in accordance with accepted academic practice. No use, distribution or reproduction is permitted which does not comply with these terms.
*Correspondence: Hu Zhang, MTEzNjhAanNtYy5lZHUuY24=