 Jinye Xu
 Jianghui Zhou1,2
 Yusheng Shu
- 1Clinical Medical College, Yangzhou University, Yangzhou, China
- 2Department of Thoracic Surgery, Northern Jiangsu People’s Hospital Affiliated to Yangzhou University, Yangzhou, China
Background: Prediction of prognosis for patients with esophageal cancer(EC) is beneficial for their postoperative clinical decision-making. This study’s goal was to create a dependable machine learning (ML) model for predicting the prognosis of patients with EC after surgery.
Methods: The files of patients with esophageal squamous cell carcinoma (ESCC) of the thoracic segment from China who received radical surgery for EC were analyzed. The data were separated into training and test sets, and prognostic risk variables were identified in the training set using univariate and multifactor COX regression. Based on the screened features, training and validation of five ML models were carried out through nested cross-validation (nCV). The performance of each model was evaluated using Area under the curve (AUC), accuracy(ACC), and F1-Score, and the optimum model was chosen as the final model for risk stratification and survival analysis in order to build a valid model for predicting the prognosis of patients with EC after surgery.
Results: This study enrolled 810 patients with thoracic ESCC. 6 variables were ultimately included for modeling. Five ML models were trained and validated. The XGBoost model was selected as the optimum for final modeling. The XGBoost model was trained, optimized, and tested (AUC = 0.855; 95% CI, 0.808-0.902). Patients were separated into three risk groups. Statistically significant differences (p < 0.001) were found among all three groups for both the training and test sets.
Conclusions: A ML model that was highly practical and reliable for predicting the prognosis of patients with EC after surgery was established, and an application to facilitate clinical utility was developed.
Introduction
Among all malignant tumors, the incidence and mortality rates for EC rank seventh and sixth, respectively, worldwide. In terms of pathological type, the most common type of EC is ESCC (1). ESCC dominates in China, which accounts for half of the world’s cases of ESCC (2). The prognosis for patients with EC varies considerably due to different clinicopathological stages and treatment options (3). For patients with resectable EC, surgical resection is the preferred therapy option (4). The patient information gathered during the procedure can be used to more accurately evaluate the patient’s prognosis. Effective prediction of patient prognosis following radical esophagectomy can provide an important reference for patient’s postoperative treatment plans, supporting individualized management of EC.
As medical data proliferates and technology and artificial intelligence develop at a rapid pace, using big data analysis to construct survival prediction models has become an important research topic. ML is a sub-field of artificial intelligence, which is the practice of developing systems that learn from data to identify categories and provide precise predictions of future events (5). In medicine, it can be deployed in clinical databases to develop valid risk models and redefine patient categories (6). ML approaches have been utilized in the construction of prognostic models for a variety of malignancies such as lung, breast, liver, and gastrointestinal cancers (7–10), showing great predictive efficacy and demonstrating important clinical value.
TNM staging is the most extensively used approach for assessing the prognosis of patients with EC, although it is challenging to produce individualized and accurate prediction since it excludes other prognostic-related features (11). As a result, in this work, we used COX regression to screen prognostic risk factors and created an ML model based on them to stratify survival risk in patients with EC following surgery. It was hoped that this would provide a new approach to formulating a postoperative treatment plan and assessing the prognosis of these patients.
Methods
Data collection
The clinicopathological characteristics and follow-up data of patients with thoracic ESCC who received radical esophagectomy at the Department of Thoracic Surgery, Northern Jiangsu People’s Hospital from January 2014 to June 2017 were analyzed. The overall survival (OS), defined as the time interval from the date of surgery to the end of the study or patient death, was the major predictive outcome for this study. Patients were followed up by telephone or outpatient after they were discharged from the hospital. They had a follow-up visit every 3 months for the first 2 years after surgery, once every 6 months for 2-5 years, and once a year after 5 years. The follow-up was carried out until June 2022. All patients were staged by pathology (pTNM) after surgery. A total of 16 clinicopathological characteristics were included. They included gender, age, type of surgery, hypertension, diabetes, smoking, drinking, tumor size, tumor center location, histological grade, pT stage, pN stage, vascular invasion, nerve violations, pathological type, and surgical margin. All clinicopathological characteristics were easily obtained from the patient’s records.
The inclusion criteria were: (1) no antitumor therapy before surgery such as chemoradiotherapy, immunotherapy, and targeted therapy, (2) liver, lung, brain, and other distant metastases were excluded by preoperative CT, magnetic resonance imaging, bone scanning, color ultrasound, or other examinations before surgery, (3) the anatomical center of the tumor was located in the thoracic segment, (4) patients underwent transthoracic radical esophagectomy and were diagnosed with ESCC by postoperative pathological examination, and (5) the clinicopathological files and follow-up data were complete. Exclusion criteria were: (1) other pathological tissue types on postoperative pathology, (2) a history of other malignant tumors before surgery, (3) postoperative survival of less than 30 days, and (4) lost to follow-up.
Model training and testing
COX regression was used in the training set to screen the variables impacting OS, and the hazard ratio (HR) and 95% confidence interval (CI) were determined. Based on the final features incorporated into the modeling, 5 ML models including Decision Tree, random forest (RF), support vector machine (SVM), gradient boosting machine (GBM), and XGBoost were trained and validated using 4 × 5-fold nCV(four outer iterations and five inner iterations). nCV provides a more accurate estimate of the validation error of a model on unknown datasets by averaging its performance metrics (12). Based on the average performance of each ML model, the optimum model is chosen for the final modeling.
All patients were randomly divided into a training set (567 patients) and a test set (243 patients) by computer in a 7:3 ratio. Based on the data of the training set, the grid search method was used to search the parameters, and the model was trained and verified internally by combining the 5-fold CV, thus completing the optimization of the model. Subsequently, the model was used for survival risk stratification and survival analysis of patients with EC and validated with an independent test set. A receiver operating characteristic (ROC) curve was plotted, and AUC, accuracy (ACC), and F1-Score (meaning the weighted average of precision and recall (13)) were calculated to evaluate the model performance. A calibration curve was plotted to evaluate the fitting of the model. Decision curve analysis (DCA), which calculates the net benefit of each strategy at each level of threshold probability (14) relating to the application of the model, was used to determine clinical utility (15). The X-tile software was used to confirm the optimal cut-off point for the survival probability values predicted by the model in the training set, and the patients were divided into different risk groups, and the test set was categorized using the same grouping criteria. We used the Kaplan-Meier methods and the log-rank test to perform survival analysis on the training set, and we verified it on the test set.
Statistical analysis
The data were analyzed using R software (version 4.1.3) and SPSS software (version 25.0).
The training, testing and optimization of ML models are mainly implemented through the mlr package. The ROC curve, calibration curve, DCA, and survival curve are implemented by the pROC package, the Predtools package, the Dcurves package, and the Survminer package, respectively. The online calculator is implemented through the Shiny package. The mean (SD, standard deviation) was employed to describe normally distributed measurement data, and the independent samples t test was utilized to compare groups. The categorical data were described by frequency (percentage), the Mann-Whitney U test was used to compare the ordered categorical data between groups, and the χ2 test was used to analyze the unordered categorical data between groups. The optimal cut-off point for survival risk stratification was achieved by X-Tile software (version 3.6.1). A p-value ≤ 0.05 was specified as statistically significant.
Results
Basic information
A total of 810 patients with ESCC were enrolled. There were 611 (75.4%) males and 199 (24.5%) females. The age distribution was 63.4 ± 6.97 (range: 41–84) years, and the median follow-up time was 66 months (range: 1-83 months). The 5-year postoperative OS rate for the training set was 66.6%, and the 5-year postoperative OS rate for the test set was 64.1%. The clinicopathological characteristics of the training and test sets were compared and all p-values were >0.05 (Table 1).
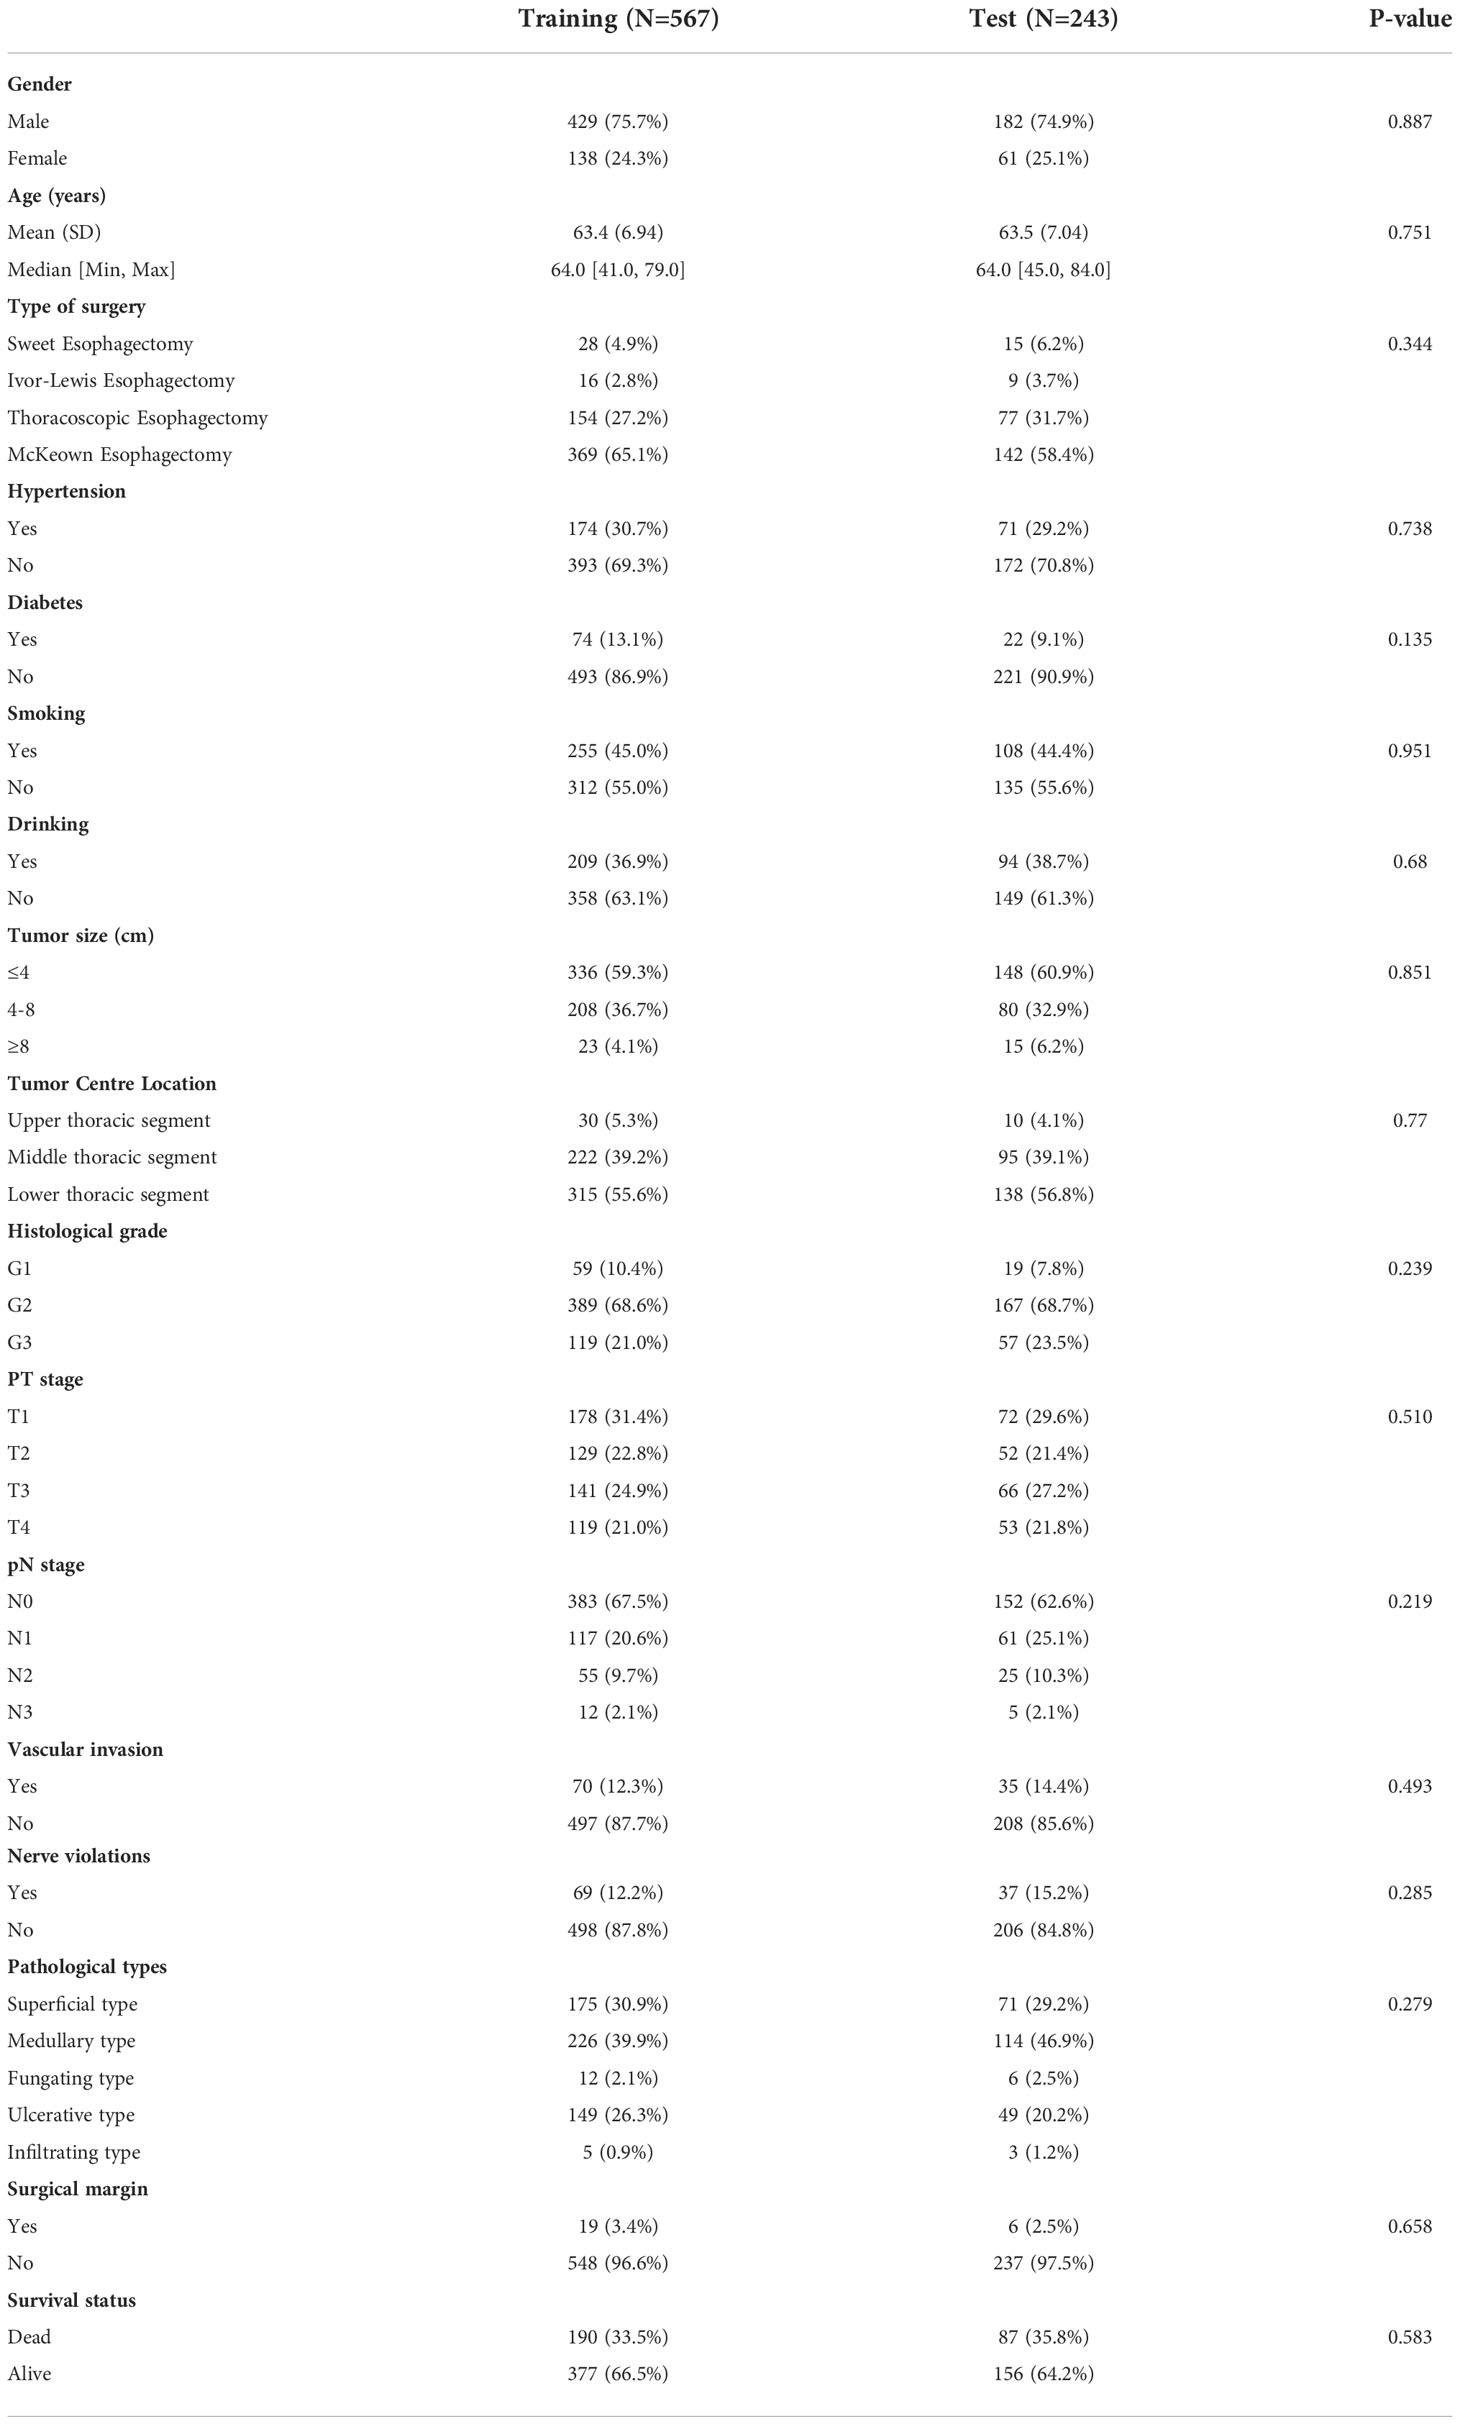
Table 1 Comparison of clinicopathological characteristics between the training and test sets.
Univariate and multivariate analysis
In this study, variable screening was performed by COX regression analysis. In univariate regression, age, type of surgery, hypertension, smoking, tumor size, histological grade, pT stage, pN stage, vascular invasion, nerve violations, and pathological types were all associated with OS (P-value < 0.05). Factors with statistically significant differences in the univariate analysis were integrated into the multifactorial regression and forward selection was performed, which showed that age, hypertension, smoking, histological grade, pT stage, and pN stage were independent predictors of OS (P-value < 0.05, Table 2).
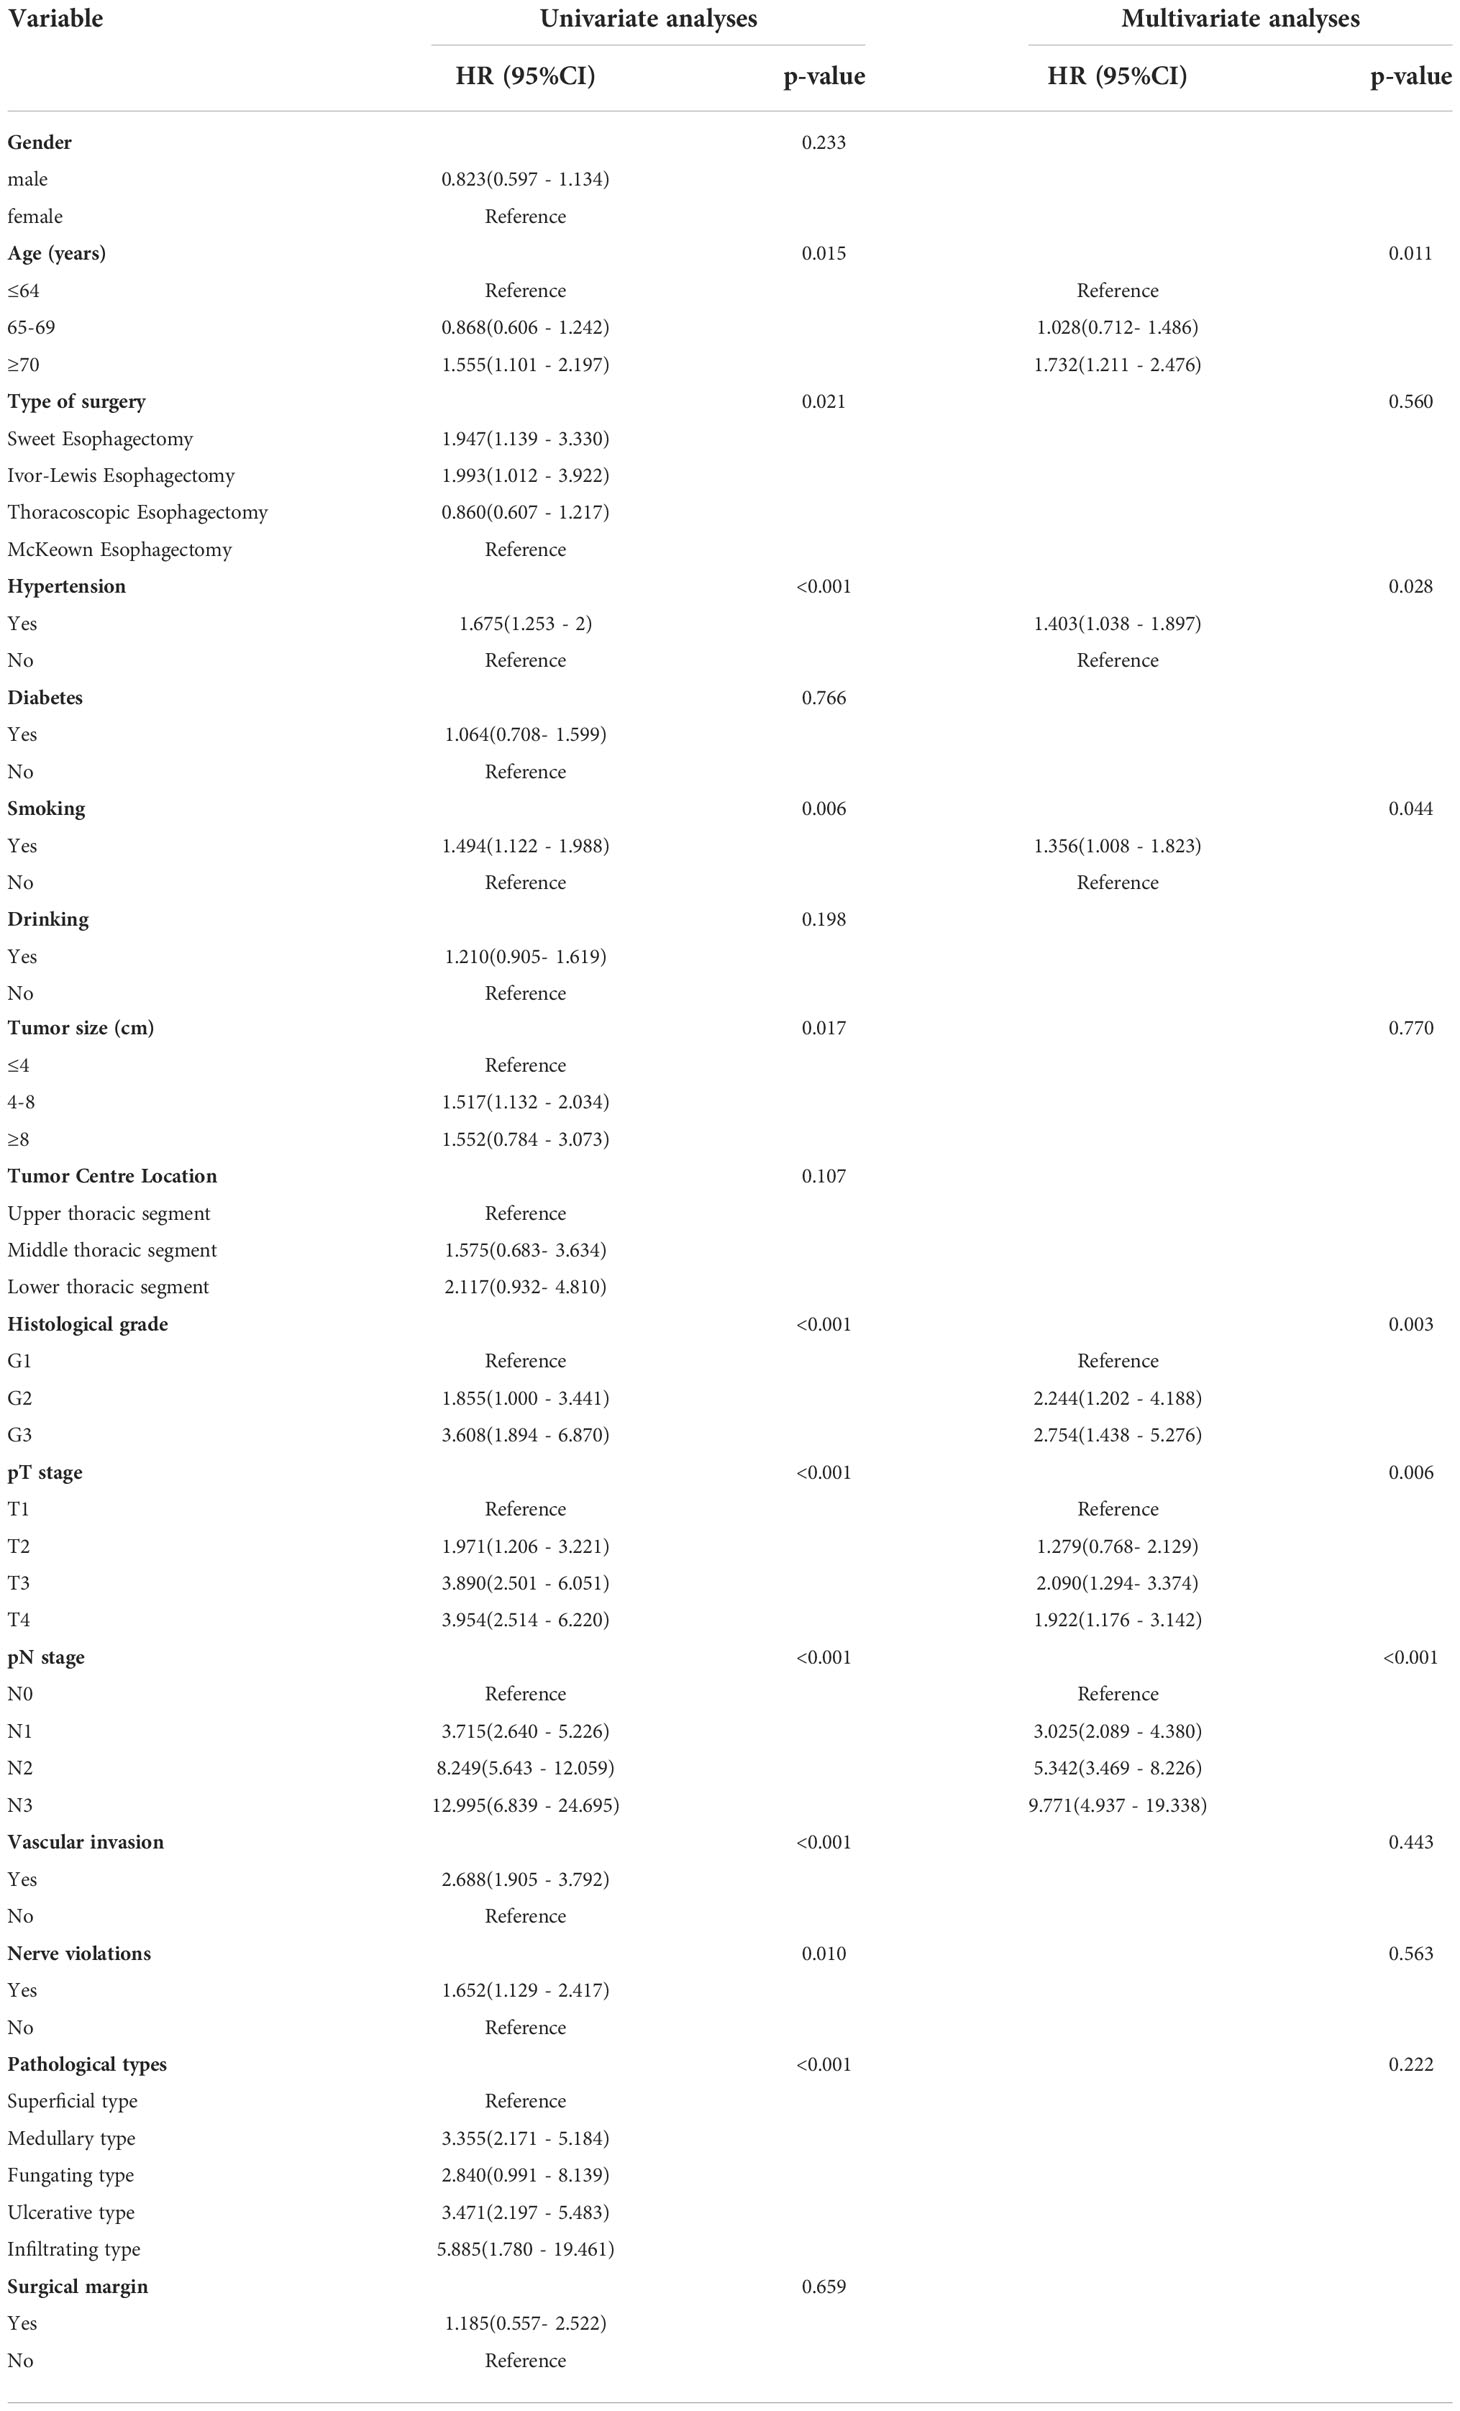
Table 2 Risk factor analysis of patients with EC in the training set.
Model training and testing
Ultimately, 6 variables including age, hypertension, smoking, histological grade, pT stage, and pN stage were selected for modeling. Based on these 6 variables, each ML model was trained and verified by 4 × 5-fold nCV, and the average performance is noted in Table 3. The average AUC of each model in external validation was: Decision Tree (AUC = 0.763), SVM (AUC = 0.809), RF (AUC = 0.809), GBM (AUC = 0.830), and XGBoost (AUC = 0.831). After a comprehensive comparison of several performance indicators, XGBoost was chosen as the final model.
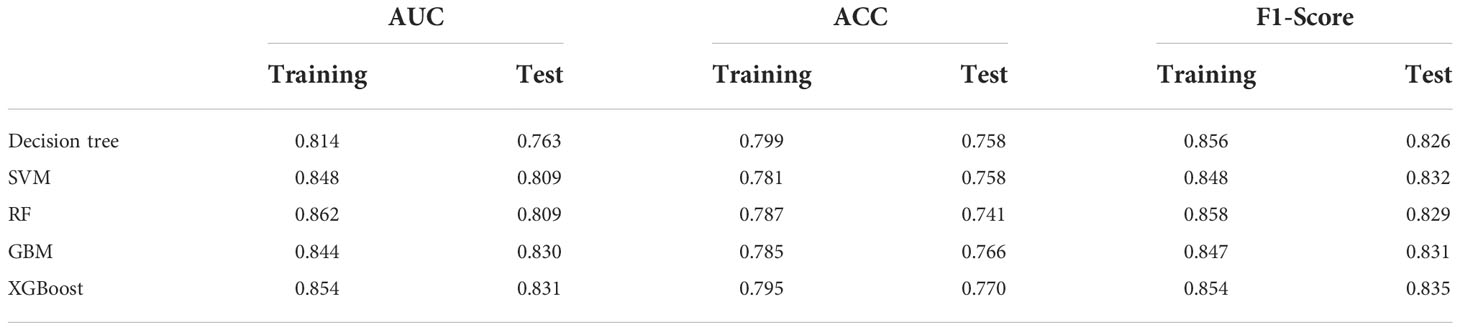
Table 3 Comparison of the models’ average performance in nested cross-validation.
Based on the training set, the model was optimized. The XGBoost model was validated on the test cohort, and the ROC curve was plotted (Figure 1). The model’s performance on the test cohort was calculated (AUC = 0.855; 95% CI, 0.808-0.902). The calibration curves (Figure 2) were plotted, which demonstrated that the predicted results of the model were consistent with the observed results, both in the training and test sets. DCA (Figure 3) was plotted, the area between the XGBoost model curve and the “Treat None” or “Treat All” line represents the clinical utility of the model, the farther the model curve is from the “Treat None” or “Treat All” line, the better the clinical value. In both training and test sets, DCA indicated that the clinical utility of the model was high.
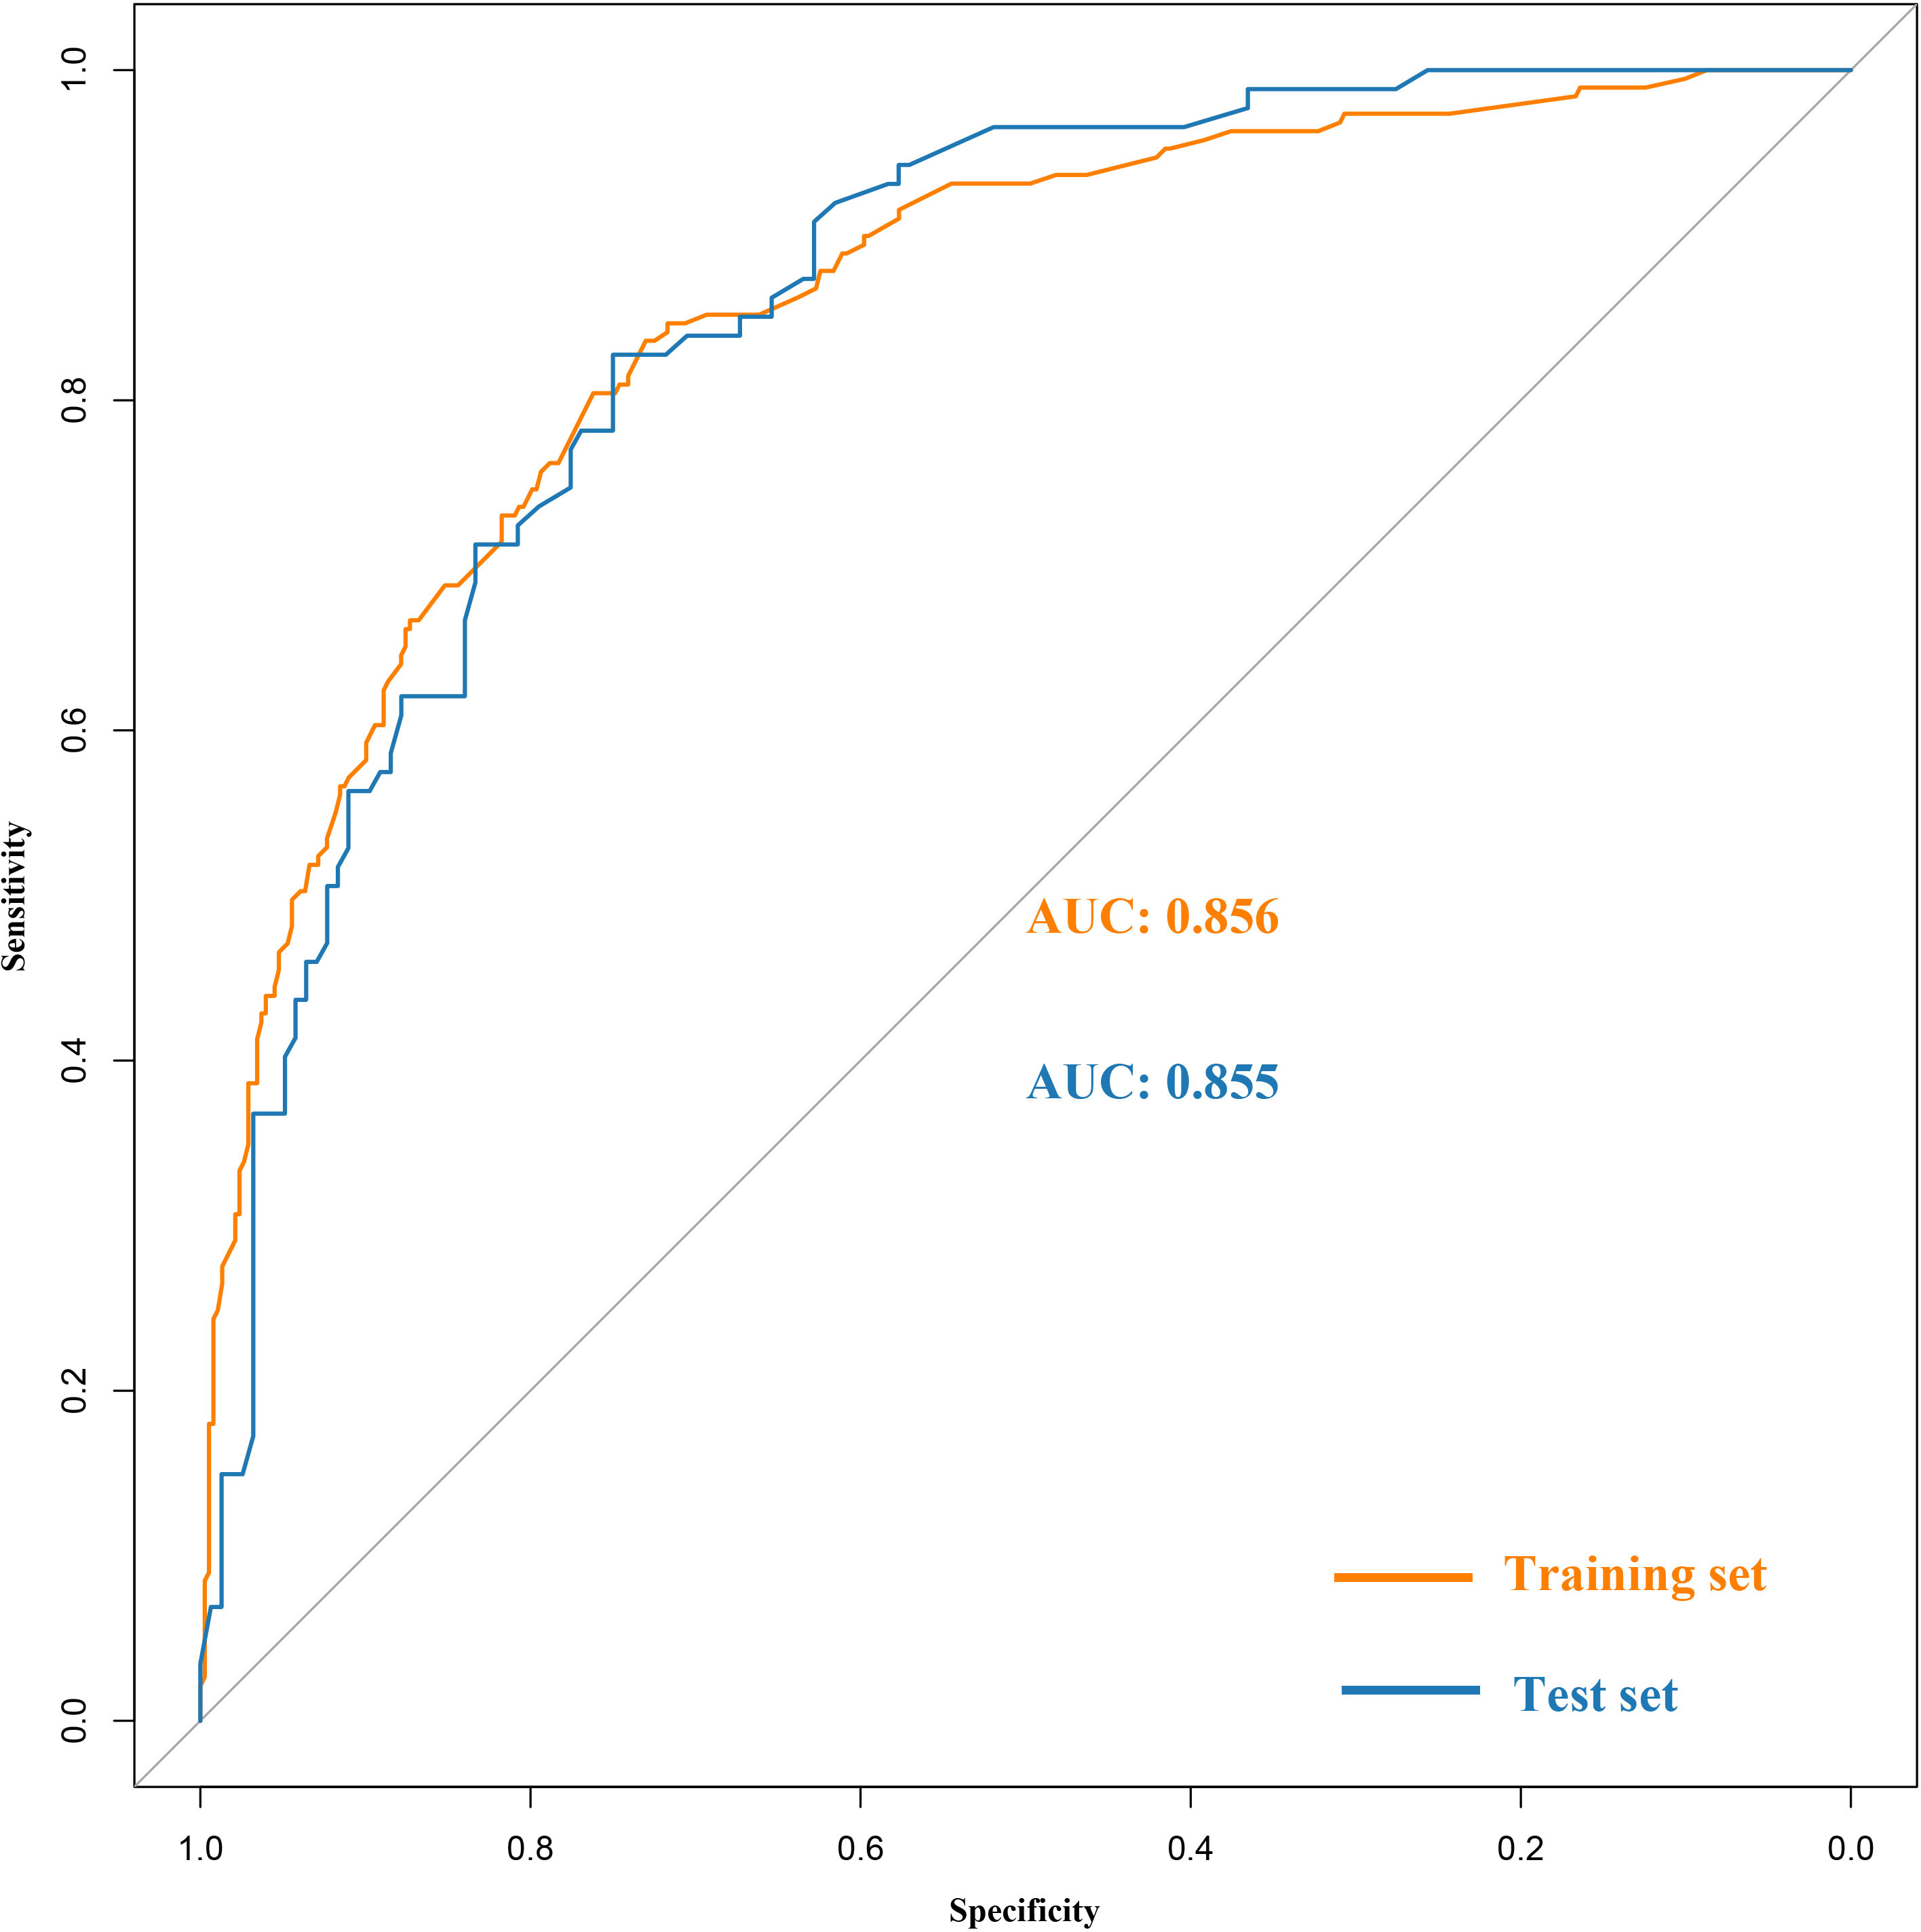
Figure 1 Receiver operating characteristic (ROC) curves of the XGBoost model in the training and the test set.
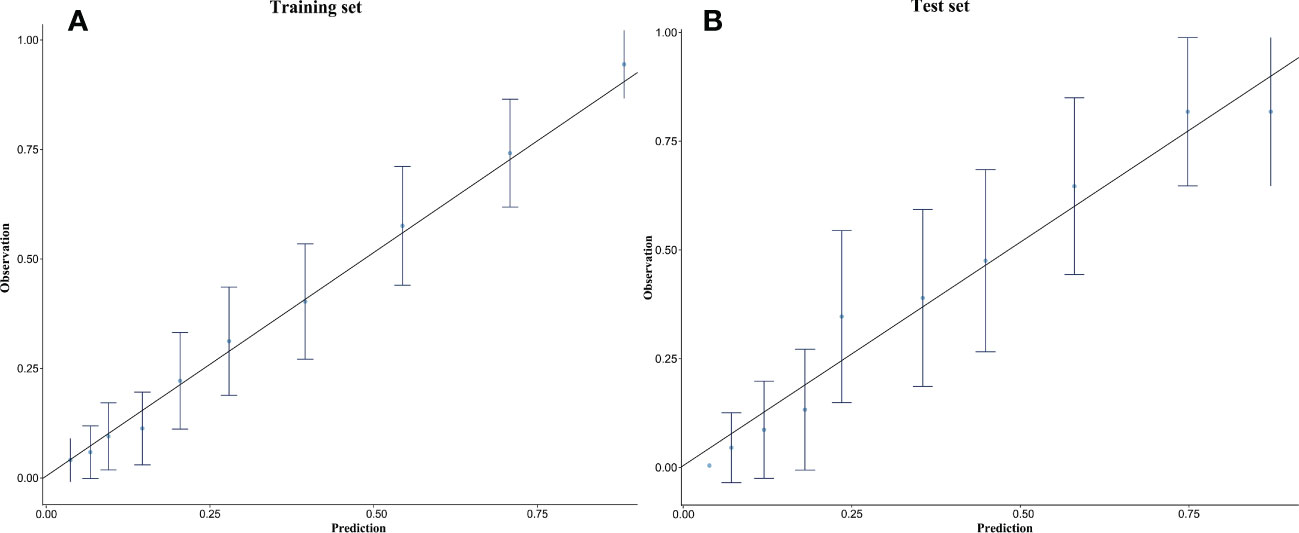
Figure 2 Calibration curves of the XGBoost model in the training set (A) and the test set (B).
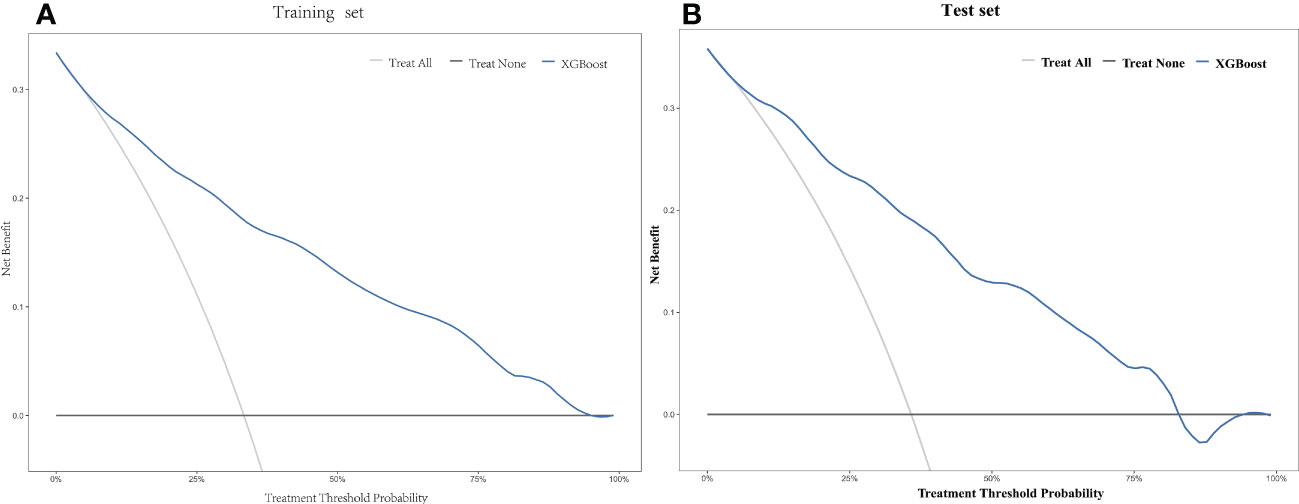
Figure 3 Decision curve analysis (DCA) of the XGBoost model in the training set (A) and the test set (B).
Risk stratification
The 5-year OS probability predicted by the XGBoost model in the training set was taken as the model score. Those with scores ≤0.21; 0.22–0.75; ≥0.76 were categorized as three different risk groups. Patients in the training cohort were divided into different risk groups: high-risk (61 patients), medium-risk (199 patients), and low-risk (307 patients). The 5-year OS rate for patients predicted to be high-risk by the XGBoost model was 11.4%, those predicted to be medium-risk was 47.7%, and those predicted to be low-risk was 89.9%. The difference was statistically significant (χ² = 190.284; p < 0.001). In the test set, patients were divided into risk groups with the same classification criteria as the training set: high-risk (34 patients), medium-risk (94 patients), and low-risk (115 patients). The 5-year OS rate for patients predicted to be high-risk by the model was 14.7%, for those predicted to be medium-risk was 52.1%, and for those predicted to be low-risk was 88.6%. The difference was statistically significant (χ² = 72.220; p < 0.001) (Figure 4).
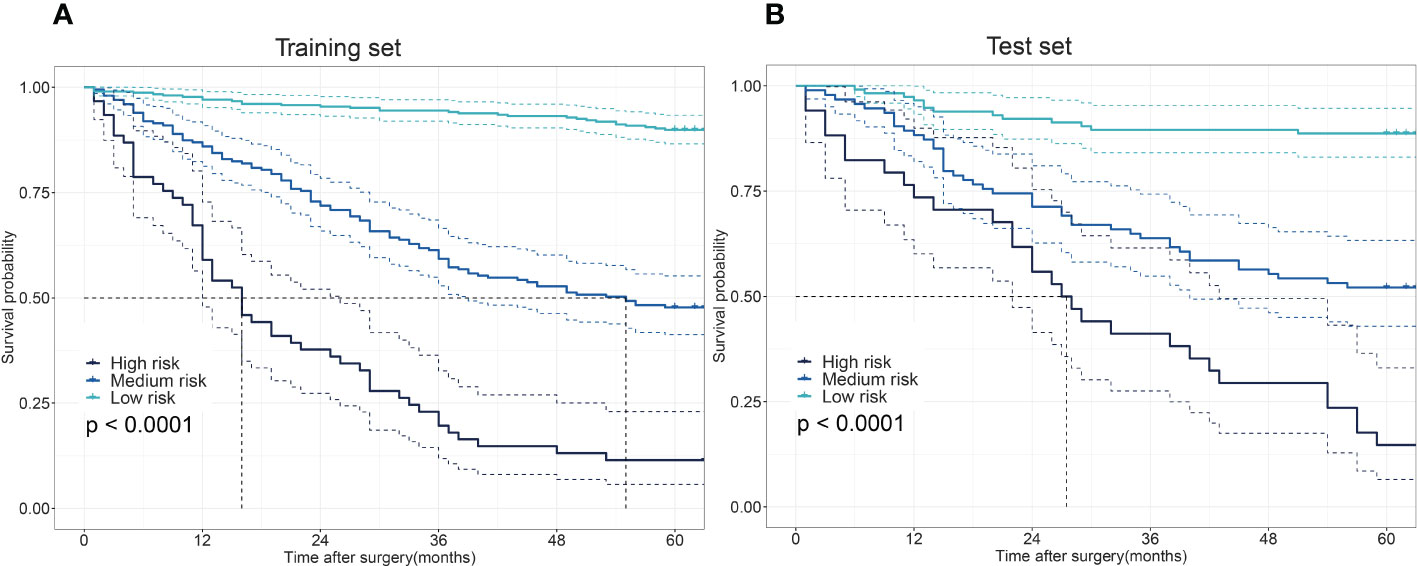
Figure 4 The differences in the overall survival (OS) among low-, medium-, and high-risk patients. Survival disparities among different risk groups in the training set (A) and the test set (B).
Development of applications
It is crucial that the constructed forecasting model can be simply applied in practice. A user-friendly application program (https://eso-predict.shinyapps.io/shiny_mlr/) was developed for both patients and clinicians. The application is offered as a web page with a backend that invokes the trained XGBoost model. The user enters the necessary information in response to the prompts and then clicks the “Predict” button to obtain the 5-year survival risk following EC surgery.
Discussion
Accurate surgical prognosis prediction is critical for subsequent therapy decisions in patients with EC. At present, prognosis prediction following EC surgery is mainly based on COX regression modeling (11, 16), which assumes a linear association between outcomes and variables, and thus, it cannot capture the nonlinear relationship between various characteristics and outcomes (17). In contrast, ML techniques can better capture the complex associations between features and outcomes (18), thus improving the accuracy of the model. However, the predictive process of ML models is poorly interpretable, reducing the trust of patients and physicians in the models (19). This study screened the final modeled risk factors through COX univariate and multivariate analysis, which increased the interpretability to a certain extent. Previously (3), ML methods have been used to build a ML model to predict the prognosis of patients with EC based on information from the Surveillance, Epidemiology, and End Results(SEER) database. However, this is a public database, and whether models from a public database can be used locally needs further verification. Moreover, its prediction model incorporates a total of 24 features, some of which are difficult to obtain in clinical practice, and this reduces the practicality and reliability of the model in clinical practice.
This study observed 5-year OS after surgery by a long-term follow-up of patients who underwent radical EC surgery at a single institution. A total of 16 characteristics commonly found in the records of patients with EC that might have an impact on their prognosis were collected. Multifactorial analysis identified age, hypertension, smoking, histological grading, pT stage and pN stage as independent predictors of OS. ML models based on these 6 clinicopathological characteristics were developed to predict the 5-year survival status of patients following EC surgery. Among these 6 characteristics, age and smoking were common risk factors for EC (20). Studies have shown that patients with hypertension at the time of cancer diagnosis have a higher all-cause mortality rate than those without hypertension especially in patients with longer follow-up (21). Histological grade, pT stage, and pN stage are widely recognized to influence the prognosis of patients with EC (22–24). In this study, to prevent overfitting of ML models, meaning that they perform well in training but poorly in testing (25), each ML model was trained and validated by nCV to estimate its prediction performance more accurately. Synthesizing the performance of each ML model, XGBoost was ultimately selected as the best model for final modeling.
CV was applied to the training set for hyperparameter tuning, and risk stratification and survival analysis were performed on the training set. Risk stratification and survival analysis were performed on the test cohort using the same partitioning criteria as the training cohort. The results show significant differences in survival among the different risk groups in both the training and test cohorts. In this study, 54.1% of patients in the training set and 47.3% in the test set were classified as low-risk, and the 5-year OS rates of the low-risk group in the training and test cohorts were 89.9% and 88.6%, respectively. For this reason, patients in the low-risk group may not need adjuvant therapy following surgery. In contrast, patients in this study classified as being in the medium–high risk group should receive more aggressive adjuvant therapy following surgery. ML algorithms are intricate and cannot be applied clinically through scoring or nomogram plots. To facilitate the use of this model in clinical decision-making, an application was developed to provide rapid access to the predictive ability of the XGBoost model. Clinicians only need to input data on these 6 variables to obtain the 5-year survival probabilities and risk stratification predicted by this model, so that the XGBoost model constructed in this study is highly practical and reliable.
This study has several limitations. First, this was a single-center study with a limited number of patients, and ML models derived from a larger dataset could achieve more accurate results (26). Therefore, in subsequent studies, multi-center data could be added for training and external validation to obtain a more reliable prediction model. Furthermore, this study was developed and validated utilizing retrospective files, and prospective validation studies should be performed to confirm the reliability of this model before it enters formal clinical practice.
Conclusions
In conclusion, this study constructed a ML model for predicting the risk of 5-year OS following EC surgery based on 6 common clinicopathological characteristics. The XGBoost model had the best performance of the several models tested. The XGBoost model can provide an important reference for prognostic assessment and postoperative treatment decisions for patients with EC thus promoting the individualized management of EC.
Data availability statement
The raw data supporting the conclusions of this article will be made available by the authors, without undue reservation.
Ethics statement
The studies involving human participants were reviewed and approved by Medical Ethics Committee of Northern Jiangsu People’s Hospital. Written informed consent for participation was not required for this study in accordance with the national legislation and the institutional requirements.
Author contributions
JX was involved in the study design, statistical analysis, and writing the first draft of the paper; JZ, JH, and QR were responsible for data collection and collation; XW was responsible for the study design, proofreading and paper revision; and YS was responsible for the study design, manuscript review and revision. All authors have read and agreed to the published version of the manuscript.
Funding
This work was supported by Geriatric Health Research Project of Jiangsu Provincial Health Commission (LKZ2022019) and Social Development and Clinical Frontier Technology Project of Yangzhou Science and Technology Bureau (YZ2021078).
Conflict of interest
The authors declare that the research was conducted in the absence of any commercial or financial relationships that could be construed as a potential conflict of interest.
Publisher’s note
All claims expressed in this article are solely those of the authors and do not necessarily represent those of their affiliated organizations, or those of the publisher, the editors and the reviewers. Any product that may be evaluated in this article, or claim that may be made by its manufacturer, is not guaranteed or endorsed by the publisher.
Supplementary material
The Supplementary Material for this article can be found online at: https://www.frontiersin.org/articles/10.3389/fonc.2022.1068198/full#supplementary-material
References
1. Bray F, Ferlay J, Soerjomataram I, Siegel RL, Torre LA, Jemal A. Global cancer statistics 2018: GLOBOCAN estimates of incidence and mortality worldwide for 36 cancers in 185 countries. CA: Cancer J Clin (2018) 68:394–424. doi: 10.3322/caac.21492
2. Abnet CC, Arnold M, Wei WQ. Epidemiology of esophageal squamous cell carcinoma. Gastroenterology (2018) 154:360–73. doi: 10.1053/j.gastro.2017.08.023
3. Gong X, Zheng B, Xu G, Chen H, Chen C. Application of machine learning approaches to predict the 5-year survival status of patients with esophageal cancer. J Thorac Dis (2021) 13:6240–51. doi: 10.21037/jtd-21-1107
4. Waters JK, Reznik SI. Update on management of squamous cell esophageal cancer. Curr Oncol Rep (2022) 24:375–85. doi: 10.1007/s11912-021-01153-4
5. Verma AA, Murray J, Greiner R, Cohen JP, Shojania KG, Ghassemi M, et al. Implementing machine learning in medicine. CMAJ Can Med Assoc J = J l'Association medicale Can (2021) 193:E1351–E7. doi: 10.1503/cmaj.202434
6. Deo RC. Machine learning in medicine. Circulation (2015) 132:1920–30. doi: 10.1161/CIRCULATIONAHA.115.001593
7. Lynch CM, Abdollahi B, Fuqua JD, de Carlo AR, Bartholomai JA, Balgemann RN, et al. Prediction of lung cancer patient survival via supervised machine learning classification techniques. Int J Med Inf (2017) 108:1–8. doi: 10.1016/j.ijmedinf.2017.09.013
8. Zhou CM, Xue Q, Wang Y, Tong J, Ji M, Yang JJ. Machine learning to predict the cancer-specific mortality of patients with primary non-metastatic invasive breast cancer. Surg Today (2021) 51:756–63. doi: 10.1007/s00595-020-02170-9
9. Ji GW, Fan Y, Sun DW, Wu MY, Wang K, Li XC, et al. Machine learning to improve prognosis prediction of early hepatocellular carcinoma after surgical resection. J hepatocellular carcinoma (2021) 8:913–23. doi: 10.2147/JHC.S320172
10. Christopherson KM, Das P, Berlind C, Lindsay WD, Ahern C, Smith BD, et al. A machine learning model approach to risk-stratify patients with gastrointestinal cancer for hospitalization and mortality outcomes. Int J Radiat oncology biology Phys (2021) 111:135–42. doi: 10.1016/j.ijrobp.2021.04.019
11. Liu X, Guo W, Shi X, Ke Y, Li Y, Pan S, et al. Construction and verification of prognostic nomogram for early-onset esophageal cancer. Bosn J Basic Med Sci (2021) 21:760–72. doi: 10.17305/bjbms.2021.5533
12. Maros ME, Capper D, Jones DTW, Hovestadt V, von Deimling A, Pfister SM, et al. Machine learning workflows to estimate class probabilities for precision cancer diagnostics on DNA methylation microarray data. Nat Protoc (2020) 15:479–512. doi: 10.1038/s41596-019-0251-6
13. Munir K, Elahi H, Ayub A, Frezza F, Rizzi A. Cancer diagnosis using deep learning: A bibliographic review. Cancers (2019) 11(9):1235. doi: 10.3390/cancers11091235
14. Vickers AJ, Holland F. Decision curve analysis to evaluate the clinical benefit of prediction models. Spine J Off J North Am Spine Soc (2021) 21:1643–8. doi: 10.1016/j.spinee.2021.02.024
15. Vickers AJ, Elkin EB. Decision curve analysis: a novel method for evaluating prediction models. Med decision making an Int J Soc Med Decision Making (2006) 26:565–74. doi: 10.1177/0272989X06295361
16. Tang X, Zhou X, Li Y, Tian X, Wang Y, Huang M, et al. A novel nomogram and risk classification system predicting the cancer-specific survival of patients with initially diagnosed metastatic esophageal cancer: A SEER-based study. Ann Surg Oncol (2019) 26:321–8. doi: 10.1245/s10434-018-6929-0
17. Kim H, Park T, Jang J, Lee S. Comparison of survival prediction models for pancreatic cancer: Cox model versus machine learning models. Genomics Inform (2022) 20:e23. doi: 10.5808/gi.22036
18. Buch VH, Ahmed I, Maruthappu M. Artificial intelligence in medicine: current trends and future possibilities. Br J Gen Pract J R Coll Gen Practitioners (2018) 68:143–4. doi: 10.3399/bjgp18X695213
19. Moncada-Torres A, van Maaren MC, Hendriks MP, Siesling S, Geleijnse G. Explainable machine learning can outperform cox regression predictions and provide insights in breast cancer survival. Sci Rep (2021) 11:6968. doi: 10.1038/s41598-021-86327-7
20. Li S, Chen H, Man J, Zhang T, Yin X, He Q, et al. Changing trends in the disease burden of esophageal cancer in China from 1990 to 2017 and its predicted level in 25 years. Cancer Med (2021) 10:1889–99. doi: 10.1002/cam4.3775
21. Petrelli F, Ghidini A, Cabiddu M, Perego G, Lonati V, Ghidini M, et al. Effects of hypertension on cancer survival: A meta-analysis. Eur J Clin Invest (2021) 51:e13493. doi: 10.1111/eci.13493
22. Shahbaz Sarwar CM, Luketich JD, Landreneau RJ, Abbas G. Esophageal cancer: an update. Int J Surg (2010) 8:417–22. doi: 10.1016/j.ijsu.2010.06.011
23. Yang J, Lu Z, Li L, Li Y, Tan Y, Zhang D, et al. Relationship of lymphovascular invasion with lymph node metastasis and prognosis in superficial esophageal carcinoma: systematic review and meta-analysis. BMC Cancer (2020) 20:176. doi: 10.1186/s12885-020-6656-3
24. Gupta V, Coburn N, Kidane B, Hess KR, Compton C, Ringash J, et al. Survival prediction tools for esophageal and gastroesophageal junction cancer: A systematic review. J Thorac Cardiovasc Surg (2018) 156:847–56. doi: 10.1016/j.jtcvs.2018.03.146
25. Ji GW, Jiao CY, Xu ZG, Li XC, Wang K, Wang XH. Development and validation of a gradient boosting machine to predict prognosis after liver resection for intrahepatic cholangiocarcinoma. BMC Cancer (2022) 22:258. doi: 10.1186/s12885-022-09352-3
Keywords: esophageal neoplasms, machine learning, surgery, prognosis, survival risk stratification
Citation: Xu J, Zhou J, Hu J, Ren Q, Wang X and Shu Y (2022) Development and validation of a machine learning model for survival risk stratification after esophageal cancer surgery. Front. Oncol. 12:1068198. doi: 10.3389/fonc.2022.1068198
Received: 12 October 2022; Accepted: 24 November 2022;
Published: 09 December 2022.
Edited by:
Chi-Jie Lu, Fu Jen Catholic University, TaiwanCopyright © 2022 Xu, Zhou, Hu, Ren, Wang and Shu. This is an open-access article distributed under the terms of the Creative Commons Attribution License (CC BY). The use, distribution or reproduction in other forums is permitted, provided the original author(s) and the copyright owner(s) are credited and that the original publication in this journal is cited, in accordance with accepted academic practice. No use, distribution or reproduction is permitted which does not comply with these terms.
*Correspondence: Yusheng Shu, MTgwNTEwNjE5OTlAeXp1LmVkdS5jbg==; Xiaolin Wang, d3hsMTkwODUyNkAxNjMuY29t