 Jinrui Liu
 Mengying Xu2
 Jialiang Ren
 Zhihao Li
- 1School of Clinical Medicine, Ningxia Medical University, Yinchuan, China
- 2Department of Radiology, General Hospital of Ningxia Medical University, Yinchuan, China
- 3Department of Pharmaceuticals Diagnostics, GE Healthcare, Beijing, China
- 4Department of Pharmaceuticals Diagnostics, GE Healthcare, Xi’an, China
- 5Sales Department, GE Healthcare, Yinchuan, China
Objective: To assess the diagnostic value of predictive models based on synthetic magnetic resonance imaging (syMRI), multiplexed sensitivity encoding (MUSE) sequences, and Breast Imaging Reporting and Data System (BI-RADS) in the differentiation of benign and malignant breast lesions.
Methods: Clinical and MRI data of 158 patients with breast lesions who underwent dynamic contrast-enhanced MRI (DCE-MRI), syMRI, and MUSE sequences between September 2019 and December 2020 were retrospectively collected. The apparent diffusion coefficient (ADC) values of MUSE and quantitative relaxation parameters (longitudinal and transverse relaxation times [T1, T2], and proton density [PD] values) of syMRI were measured, and the parameter variation values and change in their ratios were calculated. The patients were randomly divided into training (n = 111) and validation (n = 47) groups at a ratio of 7:3. A nomogram was built based on univariate and multivariate logistic regression analyses in the training group and was verified in the validation group. The discriminatory and predictive capacities of the nomogram were assessed by the receiver operating characteristic curve and area under the curve (AUC). The AUC was compared by DeLong test.
Results: In the training group, univariate analysis showed that age, lesion diameter, menopausal status, ADC, T2pre, PDpre, PDGd, T2Delta, and T2ratio were significantly different between benign and malignant breast lesions (P < 0.05). Multivariate logistic regression analysis showed that ADC and T2pre were significant variables (all P < 0.05) in breast cancer diagnosis. The quantitative model (model A: ADC, T2pre), BI-RADS model (model B), and multi-parameter model (model C: ADC, T2pre, BI-RADS) were established by combining the above independent variables, among which model C had the highest diagnostic performance, with AUC of 0.965 and 0.986 in the training and validation groups, respectively.
Conclusions: The prediction model established based on syMRI, MUSE sequence, and BI-RADS is helpful for clinical differentiation of breast tumors and provides more accurate information for individualized diagnosis.
1. Introduction
Breast cancer has become the most commonly diagnosed cancer, seriously threatening the health of women (1). The early detection and diagnosis of breast diseases are crucial for the prognosis of breast cancer. Dynamic contrast-enhanced magnetic resonance imaging (DCE-MRI) has been widely applied in the differential diagnosis of breast diseases (2–5). The Breast Imaging Reporting and Data System (BI-RADS) is a standardized acquisition and interpretation system for breast MRI. Breast MRI typically classify lesions based on the BI-RADS criteria. Although high accuracy has been reported, the specificity of the BI-RADS diagnosis varies widely (6–8). In addition, the BI-RADS classification is related to the experience of the radiologist and there is no definite diagnosis of the lesion.
Diffusion weighted imaging (DWI) is an effective MRI technique that can noninvasively measure the diffusion of water molecules in tissue (9). DWI can provide information on lesions at the cellular and molecular levels, and is an effective parameter for distinguishing benign and malignant lesions (5). However, DWI is mainly based on single-shot echo-planar imaging (SS-EPI), which is prone to geometric distortion (10). Multiplexed sensitivity encoding (MUSE) DWI integrates a sensitivity-encoding parallel imaging method and achieves a better signal-to-noise ratio (SNR) due to its improved matrix inversion conditioning (11, 12). MUSE-DWI can acquire high-spatial-resolution images within a clinically feasible acquisition time and reduce ghosting artifacts and geometric distortions (11). MUSE-DWI sequence has been applied in brain (10) and breast (11) and has shown higher image quality than traditional SS-EPI.
Recently, a multi-contrast and one-stop relaxation quantitative technique called synthetic MRI (syMRI) has emerged, which can simultaneously quantify tissues’ synthetic relaxometry (longitudinal and transverse relaxation times [T1, T2]) and proton density (PD), as well as a variety of weighted images (13, 14). Tissue relaxation times form the fundamental basis of soft tissue contrast and anatomical imaging with MRI (15). As the malignancy of the tumor increases, the change in relaxation time can be measured by MRI (16). This technique has been successfully applied for the brain (16, 17), breast (18–21), and prostate (22) and has shown good diagnostic performance. However, conclusions on breast diagnosis are still inconsistent, and comparisons between MUSE-DWI and BI-RADS are rarely performed.
A nomogram is a graphic calculating scale tool that provides a predictive model for individual prognosis (23). By quantifying independent risk factors, the total score of the nomogram corresponds to the risk prediction value, which can succinctly and intuitively reflect the personalized prediction. This study used syMRI combined with the MUSE sequence to analyze its diagnostic performance for breast lesions. In addition, combined with the BI-RADS, a nomogram was established to explore its diagnostic performance in benign and malignant breast lesions.
2. Materials and methods
2.1. Patients
A total of 158 female patients (mean age, 50.19 ± 11.81 years; age range, 22-80 years; 38 with benign lesions and 120 with malignant lesions) who satisfied the inclusion criteria were enrolled between September 2019 and December 2020 (Figure 1). The inclusion criteria were as follows (1): Patients who underwent breast DCE-MRI, syMRI, and MUSE-DWI sequences, and the same syMRI sequence parameters were used for scanning before and after enhancement; 2) Surgery or needle biopsy performed within two weeks of MRI; 3) No surgery, chemotherapy, radiotherapy, or other related treatments before MRI examination; 4) Lesion diameter > 0.8 cm; 5) Patients with sufficient MRI image quality for quantitative measurement. All patients were randomly divided into the training group (111 cases) and validation group (47 cases) at a ratio of 7:3. The training group included 25 benign and 86 malignant patients, and the validation group included 13 benign and 34 malignant patients (Table 1). This study was approved by the Institutional Ethics Board of the hospital (KYLL-2022-0551), and informed consents were waived.
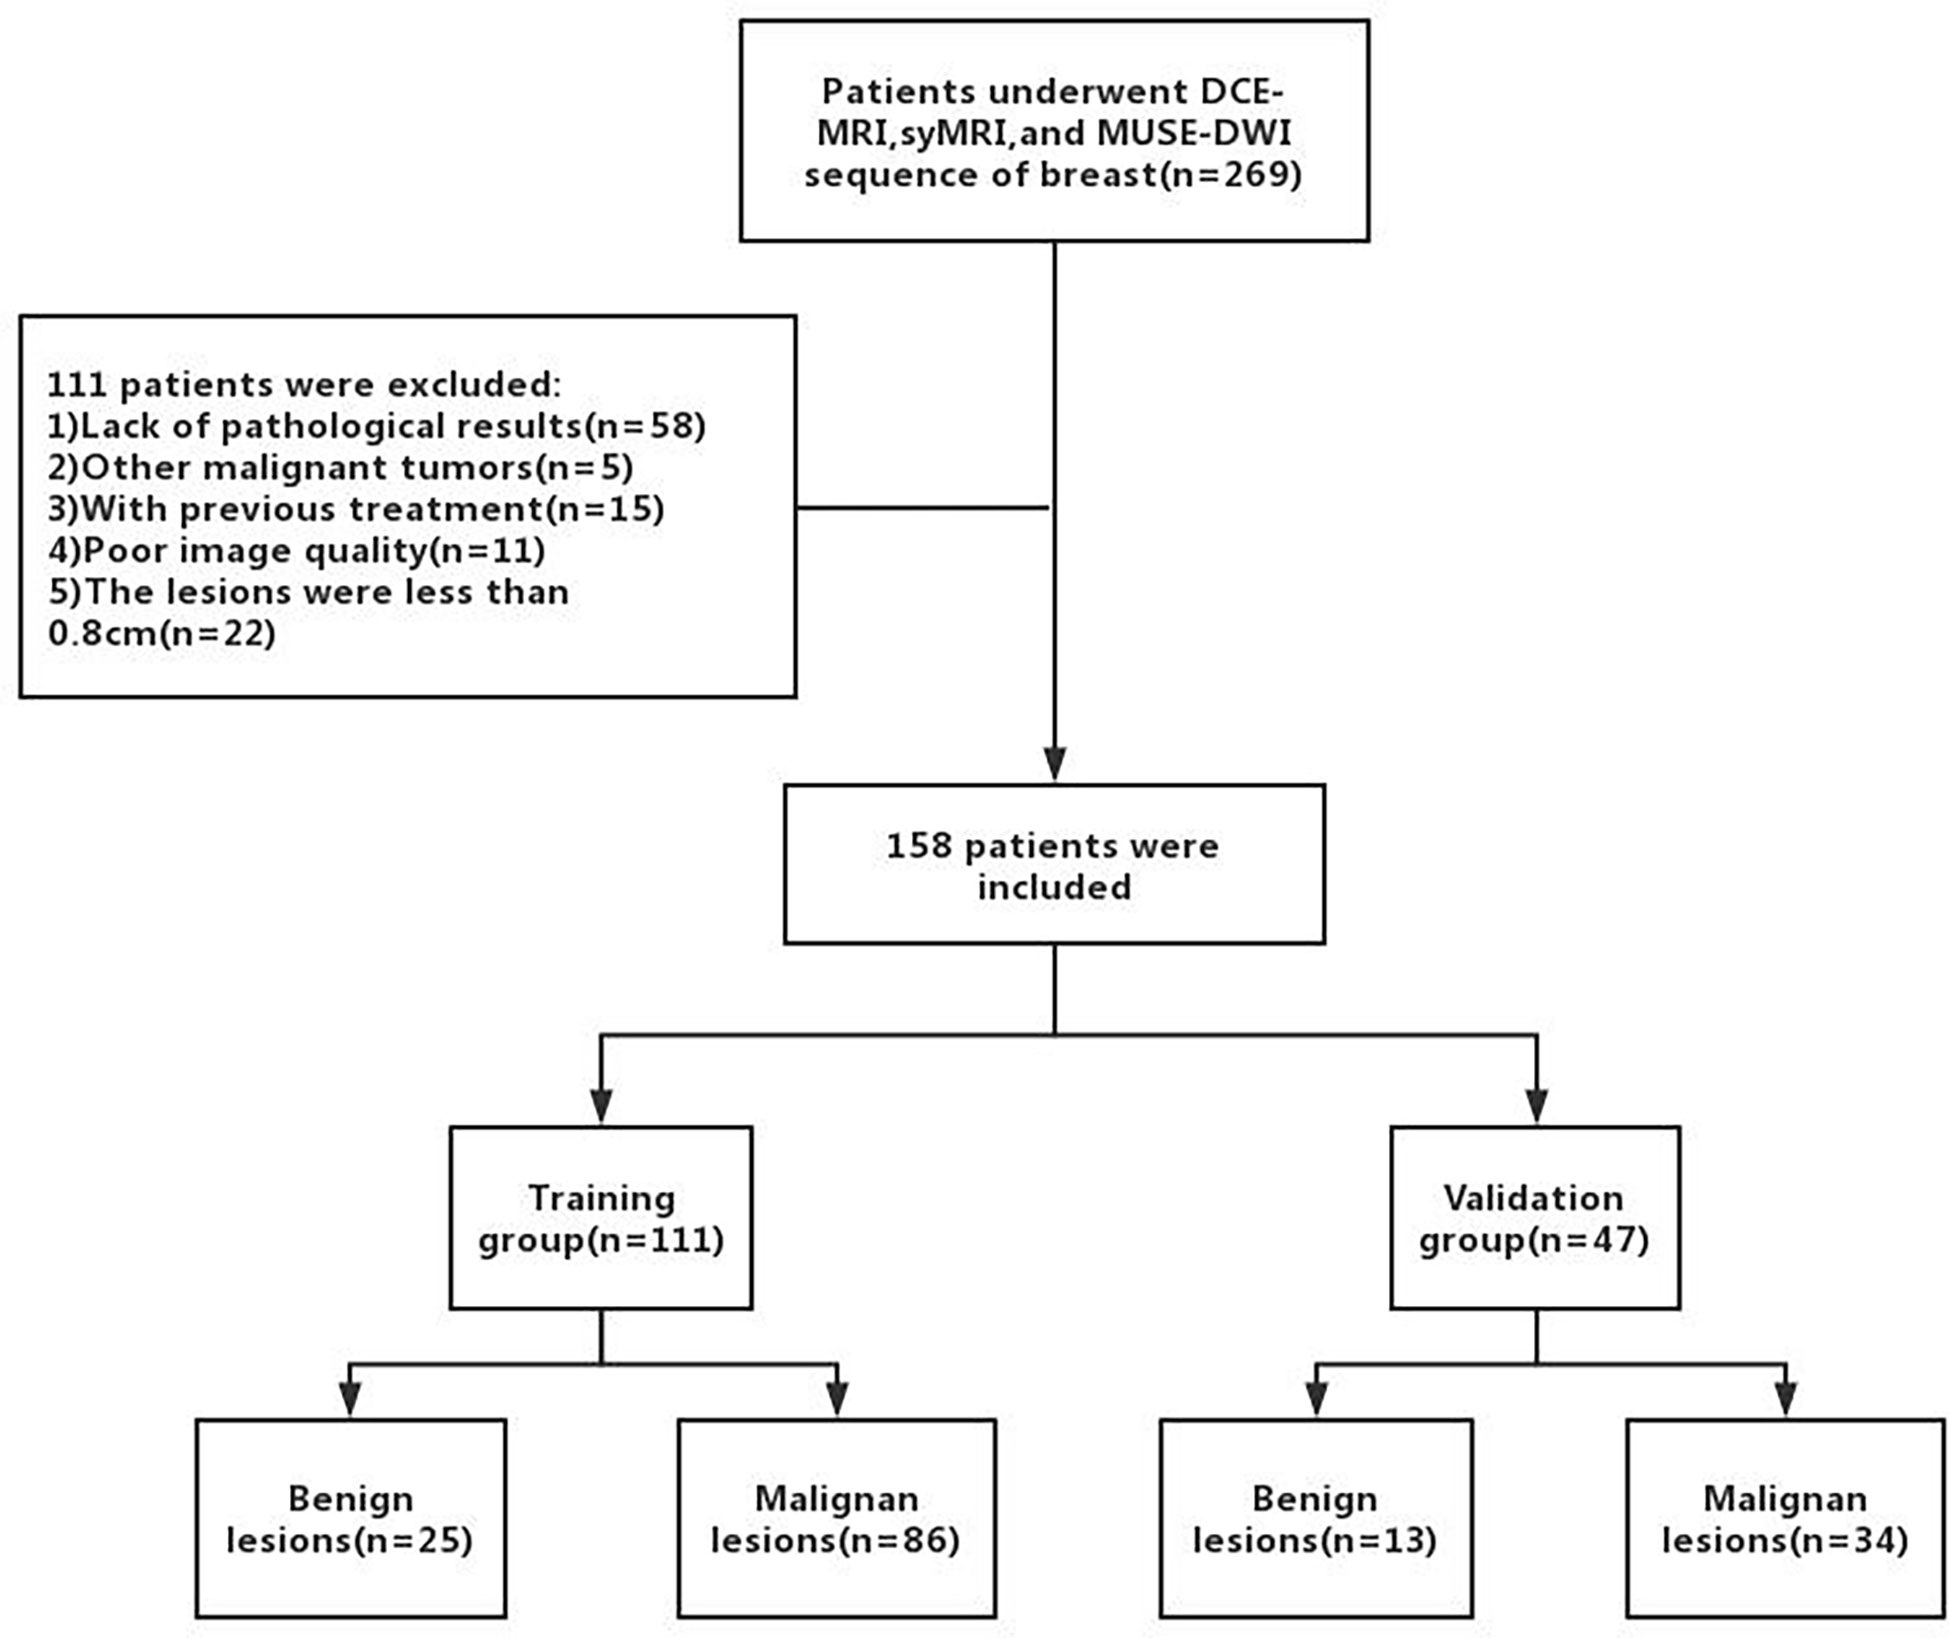
Figure 1 The flowchart of patient enrollment.
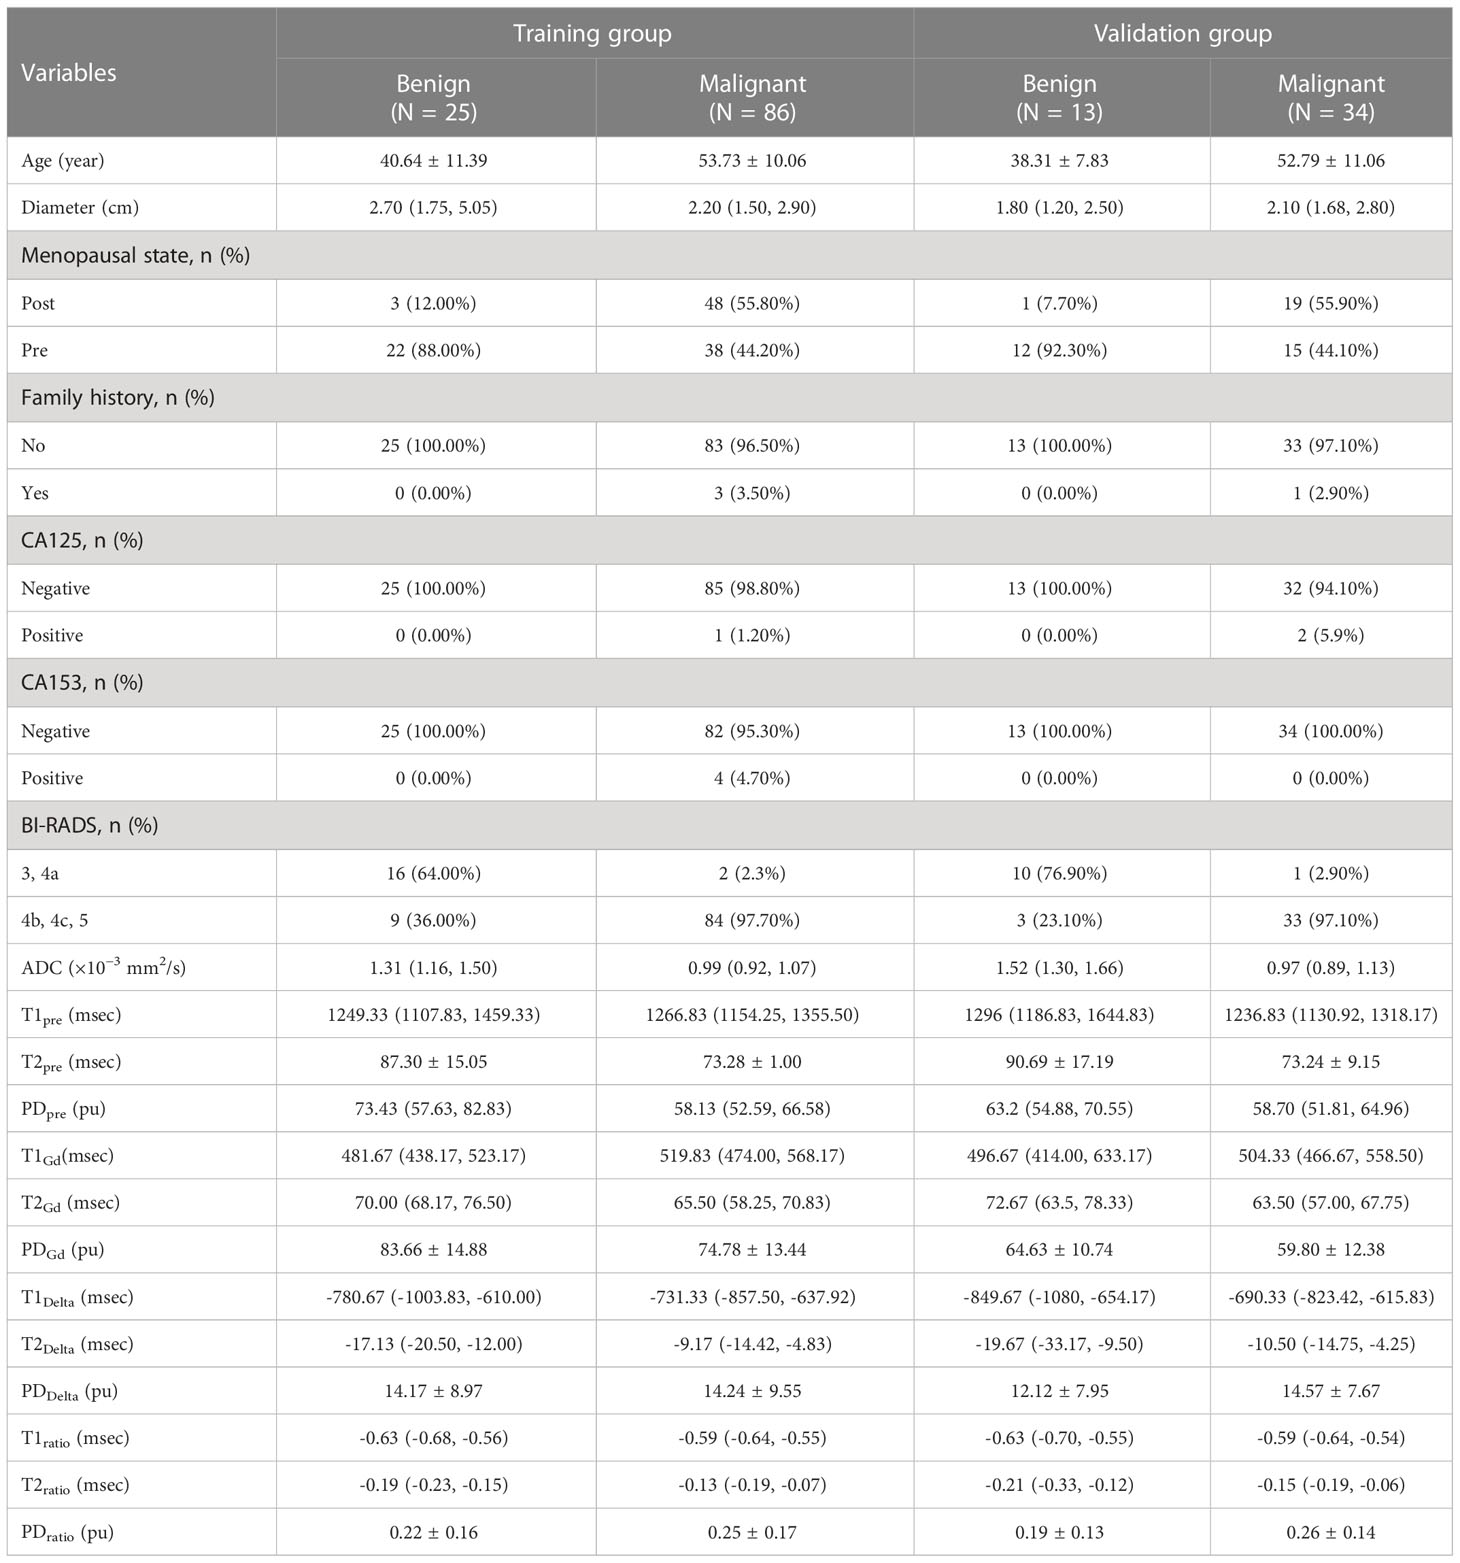
Table 1 Basic characteristics of the study population.
2.2. MRI protocols
All patients underwent MR examinations using a 3.0 T whole-body scanner (Signa Architect, GE Healthcare, Milwaukee, Wisconsin, USA) with an eight-channel phased-array breast surface coil. All patients were scanned in the prone position and conventional MRI (including T1WI and T2WI) was performed first, followed by MUSE DWI and DCE-MRI sequences. Axial syMRI sequences (OAx MAGiC) were obtained before and after contrast injection, with consistent scan parameters. A rapid bolus of gadodiamide contrast agent (GE Healthcare, Ireland) was injected intravenously at a dose of 0.2 mL/kg with an injection rate of 2.5 mL/s, followed by a flush of 20 mL normal saline at a rate of 3 mL/s. Table 2 lists the detailed parameters of the imaging sequences.
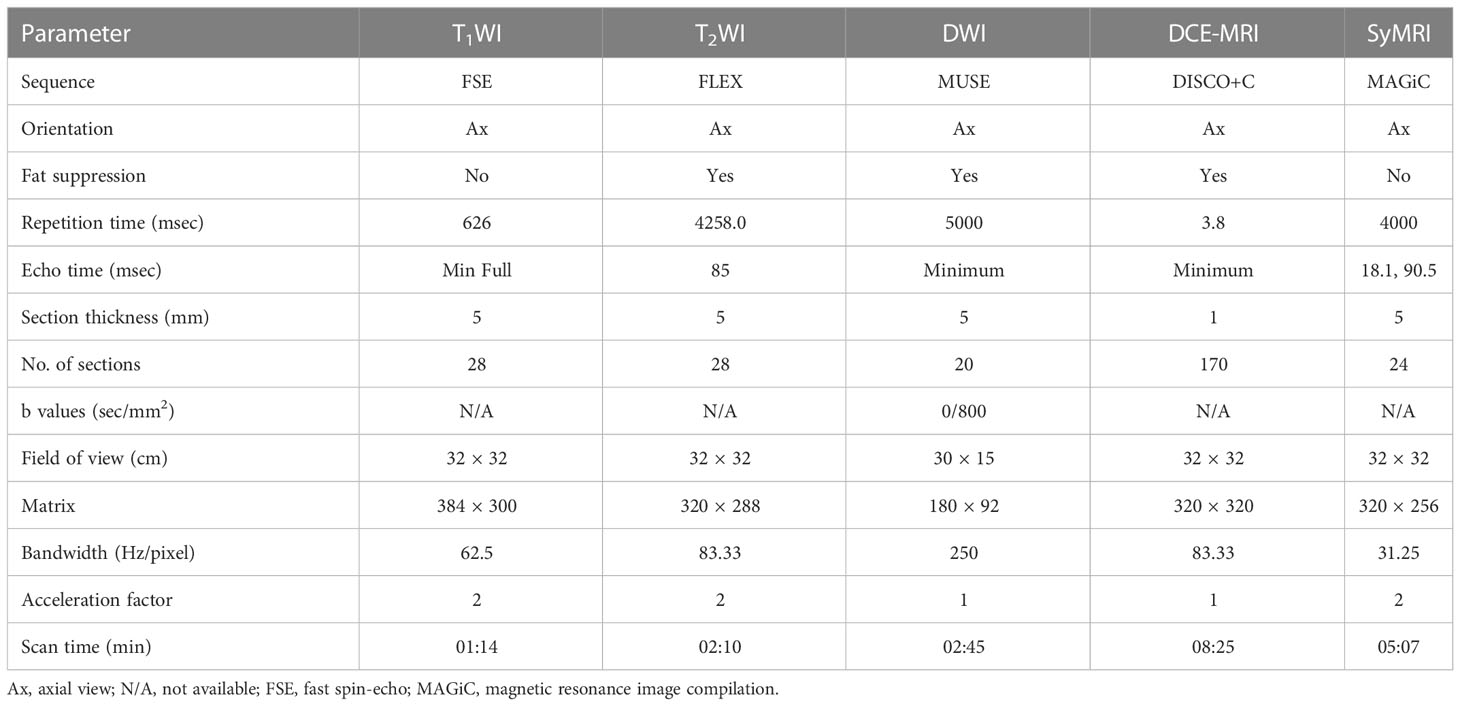
Table 2 Imaging protocols for MRI.
2.3. Image analysis
Two radiologists (R.J.L. and Y.M.X. with three and six years of experience in breast imaging, respectively), blinded to the pathology results, reviewed all the images with the dedicated Advantage Workstation (AW 4.7, GE Healthcare). Region-of-interests (ROIs) were manually drawn on the largest area of the lesion. All ROIs were placed from the solid portion of the lesion, excluding hemorrhagic necrosis or cystic lesions. The names of imaging parameter in Table 3 follow the rule that prefixes T1, T2, and PD represent the quantitative relaxation indices, and suffixes pre, Gd, delta, and ratio represent before enhancement, after enhancement, difference between before and after enhancement, and ratios before and after enhancement, respectively, calculated as: ratio = (Gd-pre)/pre. In case of discrepancy in the opinions, the two observers negotiated and reached an agreement and then the final results were record. In addition, the BI-RADS categories of patients were extracted from radiology reports following the BI-RADS MRI protocol. According to clinical practice, BI-RADS 3 and BI-RADS 4a were classified as benign (i.e., malignancy could be excluded), and BI-RADS 4b, BI-RADS 4c, and BI-RADS 5 were classified as malignant (i.e., malignancy could not be excluded). This study compared the results of MRI diagnosis with pathological results to calculate the diagnostic efficacy.
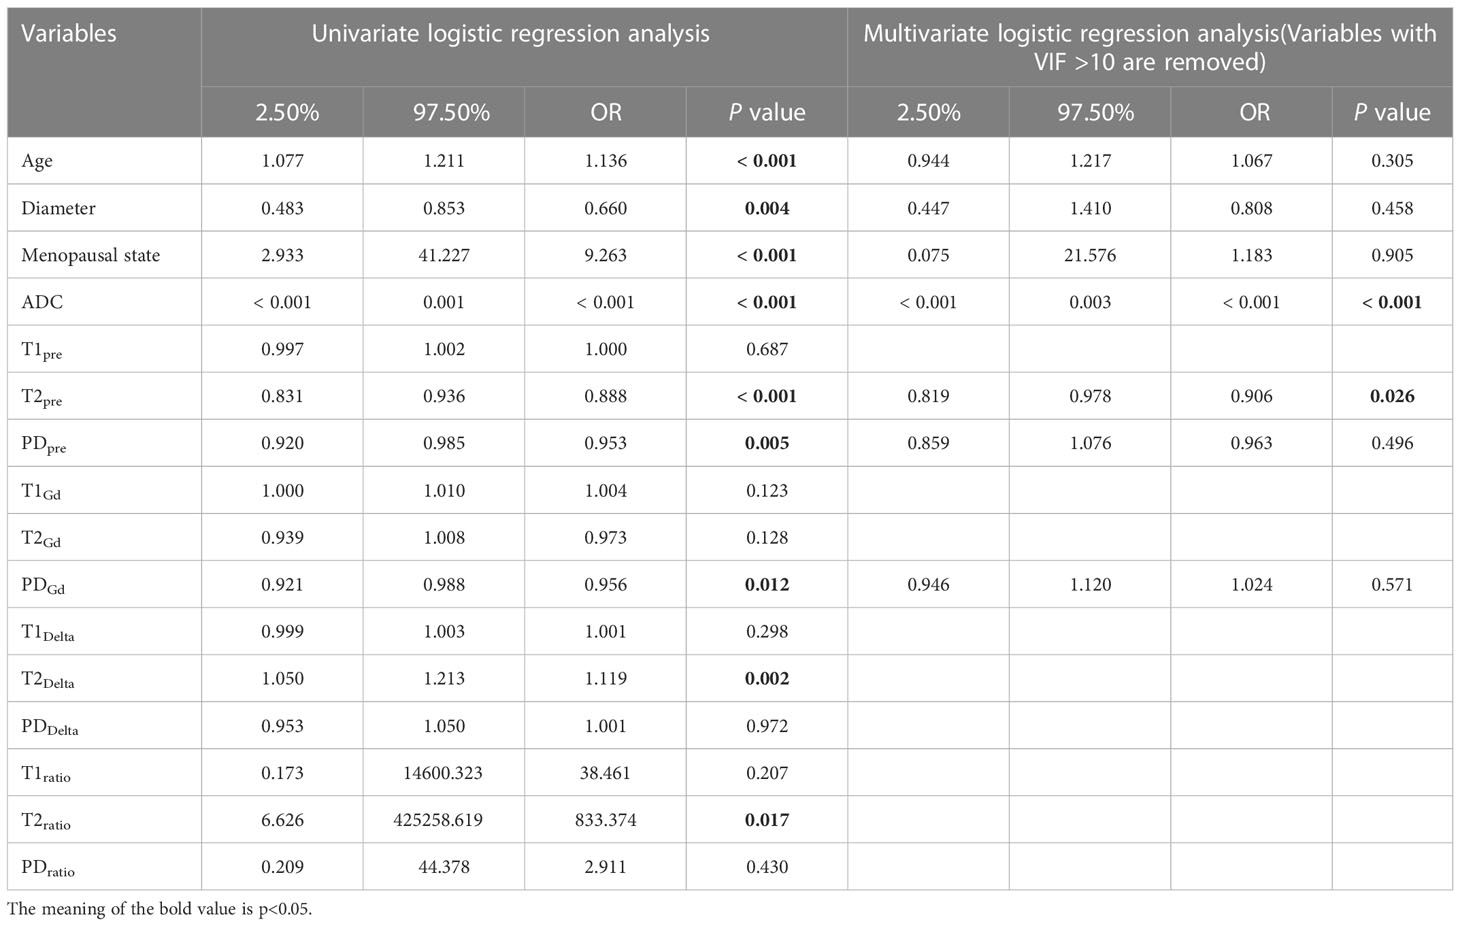
Table 3 Diagnostic value of parameters in univariate and multivariate regression analysis in the training group.
2.4. Statistical analysis
All statistical analyses were performed using the R statistical software (The R Foundation; http://www.rproject.org;version4.1.0) and SPSS software (version 24.0; IBM Corp., Armonk, NY, USA). Continuous data were summarized as means ± standard deviation (M ± SD) or median and interquartile ranges (Q1, Q3) for normal or non-normal distribution data, as appropriate. The Kolmogorov-Smirnov test was used for normal distribution. Univariate logistic regression analysis was performed to identify indicators for diagnosing breast cancer. Variables with a p-value > 0.05 (in the univariate case) from the univariate logistic regression analysis were incorporated into multivariate regression analysis to identify independent factors. Based on the results of univariate and multivariate regression analysis, a nomogram was constructed using the “rms” package in R software. The diagnostic values of various predictive models were evaluated by the area under the curve (AUC) of the receiver operating characteristic (ROC) curve through the “riskRegression” R package. The DeLong test was used to evaluate differences in the AUC of each model. Accuracy, sensitivity, specificity, positive predictive value (PPV), and negative predictive value (NPV) were calculated. A two-sided P < 0.05 was considered statistically significant. The interobserver consistencies for all quantitative MRI parameters between the two radiologists were evaluated using the intraclass correlation coefficient (ICC) as follows: ICC ≥ 0.75 = strong; 0.4–0.75 = moderate, and ICC < 0.4 = weak.
3. Results
3.1. Inter-observer agreement of quantitative measurement
Interobserver agreement between the two experienced radiologists was strong for apparent diffusion coefficient (ADC) (ICC = 0.917), T1pre (ICC = 0.863), T2pre (ICC = 0.954), PDpre (ICC = 0.975), T1Gd (ICC = 0.889), T2Gd (ICC = 0.934), and PDGd (ICC = 0.953).
3.2. Parameter values in differentiating benign and malignant breast lesions
Univariate regression analysis showed that age, lesion diameter, menopausal status, ADC, T2pre, PDpre, PDGd, T2Delta, and T2ratio were independent parameters for breast cancer diagnosis (P < 0.05). The ADC, T2pre, PDpre, PDGd, T2Delta, and T2ratio of malignant breast lesions were significantly lower than those of benign breast lesions. After excluding variables with a variance inflation factor (VIF) > 10 (T2ratio, T2Delta), multivariate analysis further showed that ADC and T2pre were important independent factors for breast cancer diagnosis (P < 0.05) (Table 3).
3.3. Nomogram model building
Based on the multivariate logistic regression model combined with DCE-MRI, the R statistical package was used to establish a nomogram for diagnosing benign and malignant breast lesions (Figure 2). The AUC of the nomogram model in the training and validation groups were 0.965 and 0.986, respectively (Figure 3). For example, in a 37-year-old woman with a non-specific invasive ductal carcinoma: T2WI (A-a), DCE-MRI (A-b), MUSE-DWI (A-c), T1 map (A-d), T2 map (A-e), PD map (A-f). BI-RADS 4c (i.e., malignancy could not be excluded, classified as malignant), T2pre = 78.67 ms, ADC = 1.06×10⁻³ mm2/s. Total points = 199; probability of malignancy = 92.30% (Figure 2).
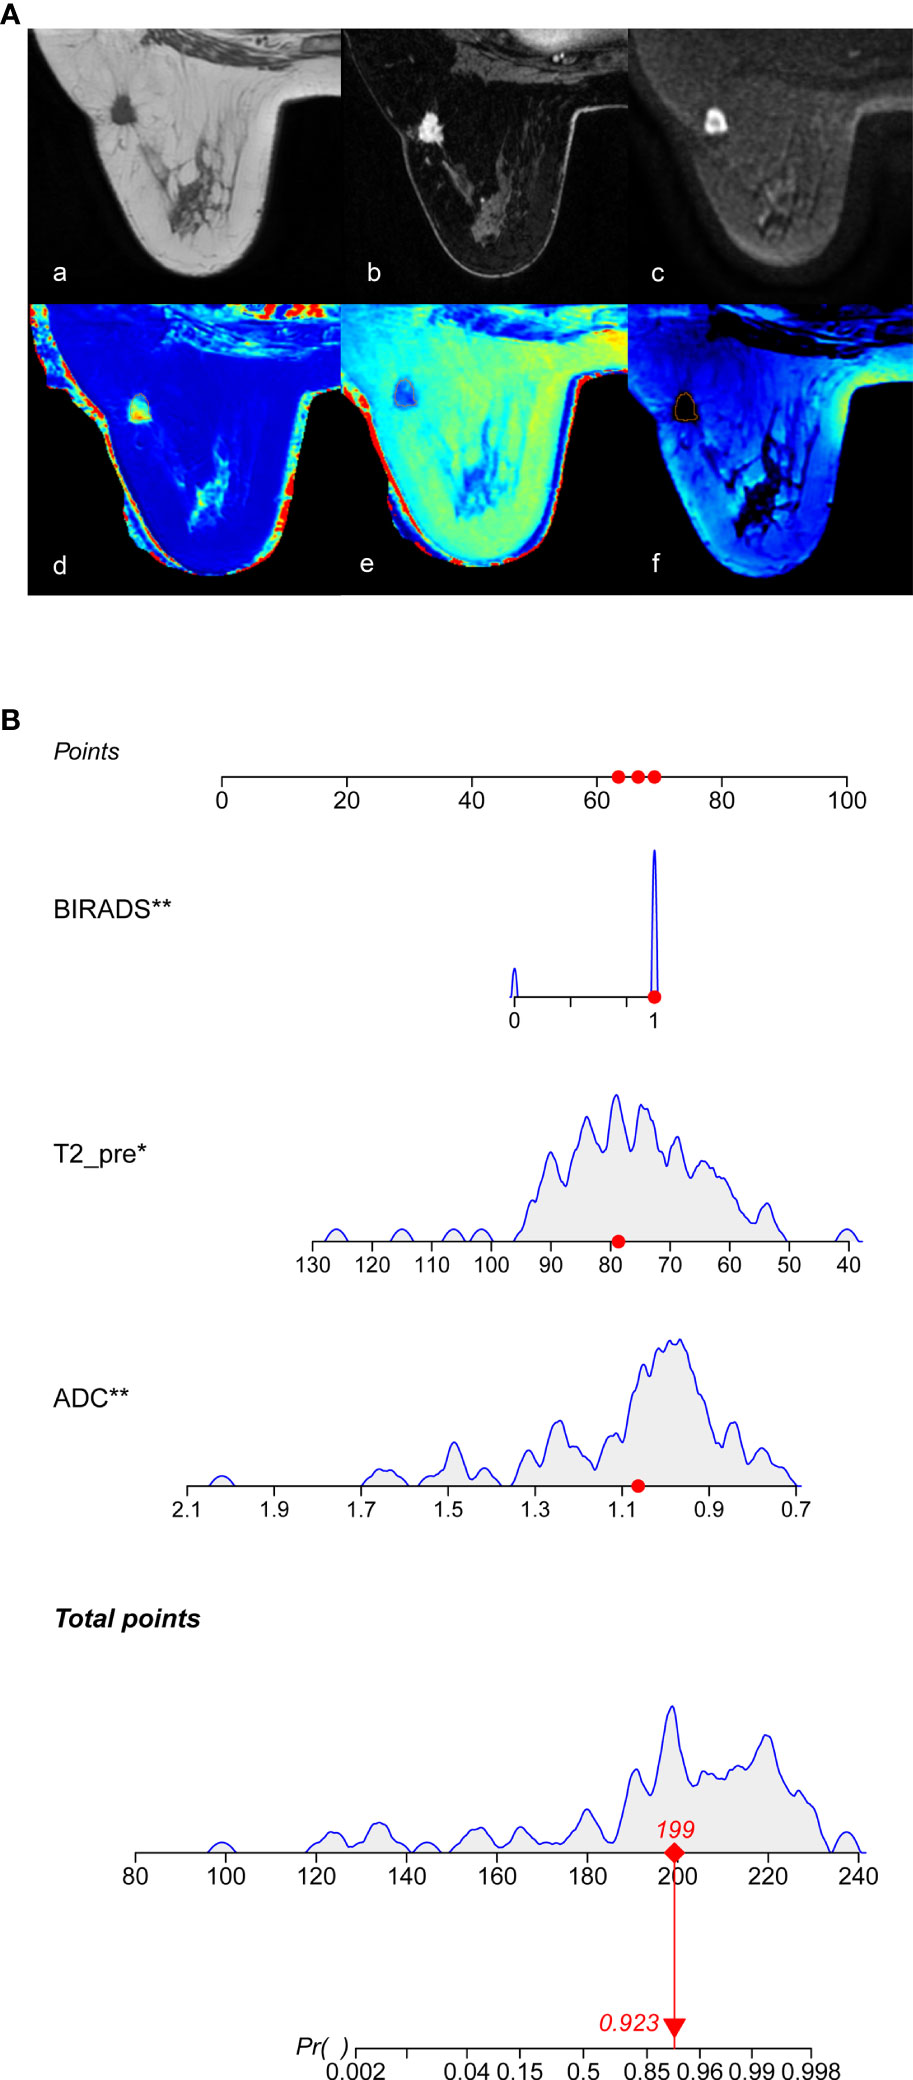
Figure 2 Nomogram for the diagnosis of benign and malignant breast lesions. (A) 37-year-old woman with a non-specific invasive ductal carcinoma, image with T2WI (A-a), DCE-MRI (A-b), MUSE-DWI (A-c), T1 map (A-d), T2 map (A-e), PD map (A-f). BI-RADS 4c=1 (i.e., malignancy could not be excluded, classified as malignant), T2pre = 78.67 ms, ADC = 1.06×10⁻³ mm2/s. According to Nomograms (B), total points was 199 points and the possibility of malignancy was about 92.30%.
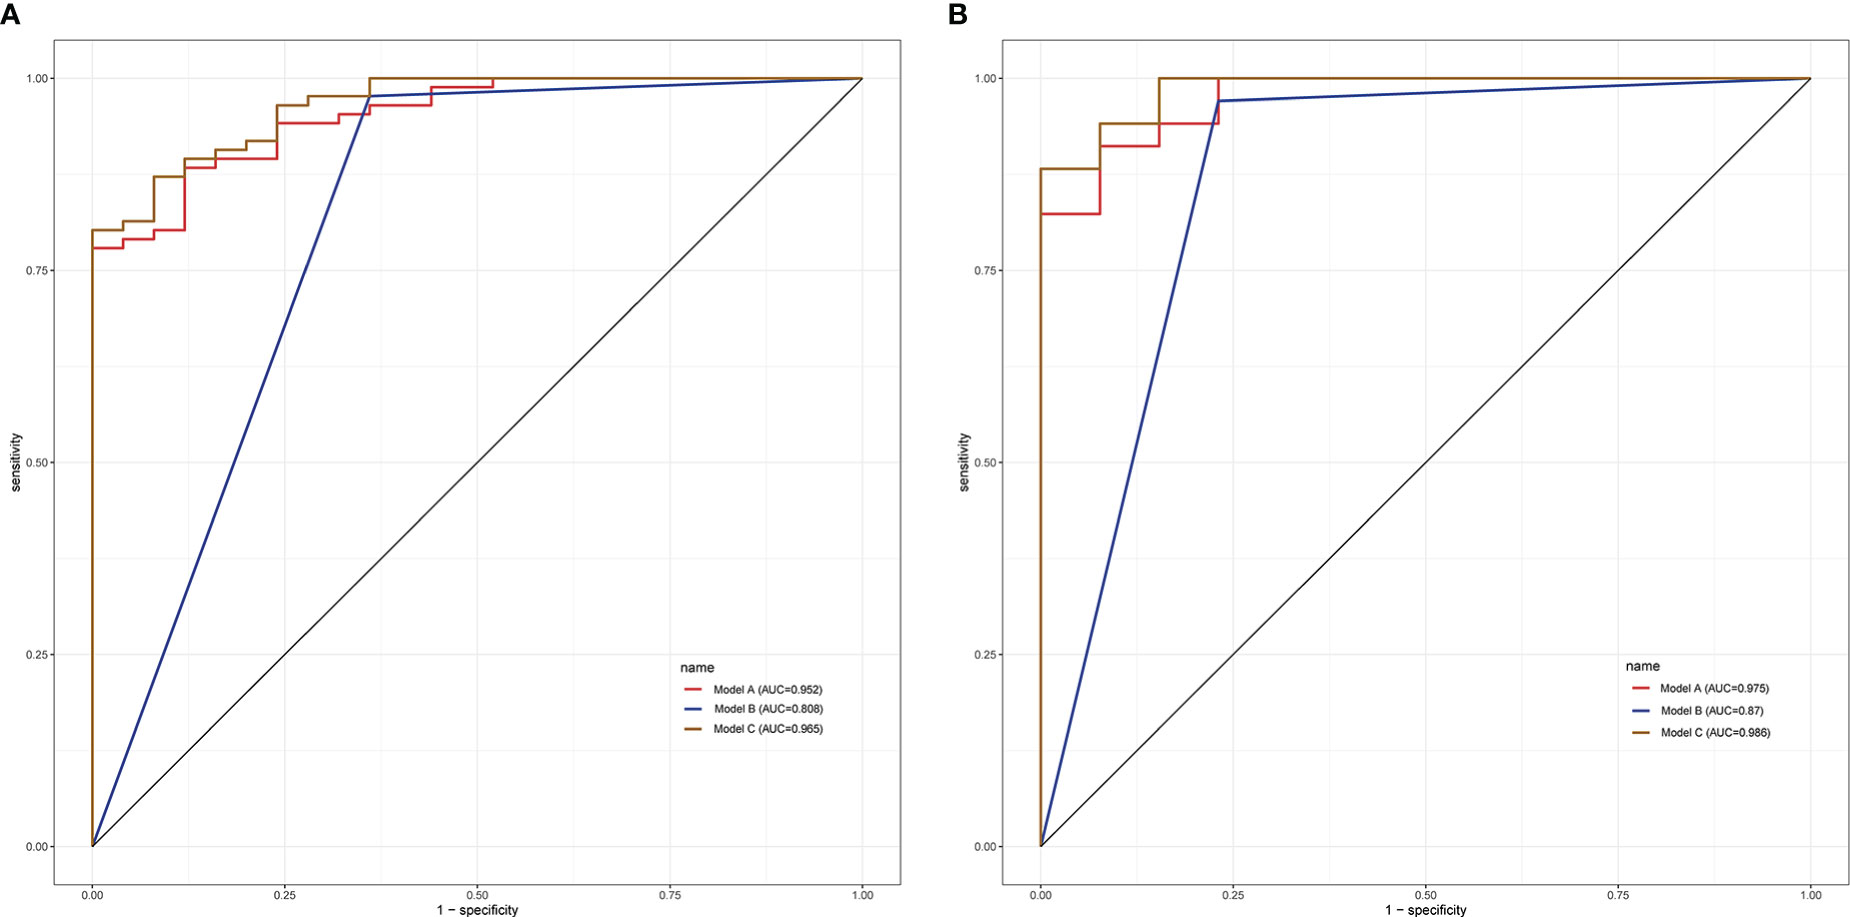
Figure 3 ROC curve analysis in the training group (A) and validation group (B).
3.4. Value of prediction model in the identification of benign and malignant breast lesions
Based on the univariate and multivariate regression analyses, three prediction models were established: the quantitative parameter model (model A: ADC, T2pre), BI-RADS model (model B: BI-RADS), and multiparameter MRI model (model C: ADC, T2pre, BI-RADS).
In the training group, the AUCs of models A and C were 0.952 and 0.808, respectively, which were significantly higher than those of model B (Z = 2.94, P < 0.001; Z = -3.73, P < 0.001). The AUC of models A and C were not statistically significant (P = 0.288). In the validation group, model C had the highest diagnostic performance with an AUC of 0.975 (Figure 3, Table 4). As shown in Table 4, the model C had high efficacy in detecting malignancy, with sensitivity, specificity, accuracy, and PPV of 80.23%, 100.00%, 84.68%, and 100.00%, respectively, in the training group, and 97.06%, 92.31%, 95.74%, and 97.06% in the validation group, respectively. Model A had AUCs of 0.952 and 0.975 in the training group and validation group (95%CI:0.915-0.988, 0.939-1.000), indicating a better performance than model B(AUC:0.808,0.870; 95% CI:0.711-0.906,0.747-0.993). In the training group, model A had higher specificity and PPV compared to model B, and model B had improved predictive ability (accuracy, sensitivity, and NPV) compared to model A in distinguishing benign and malignant breast lesions (Table 4).
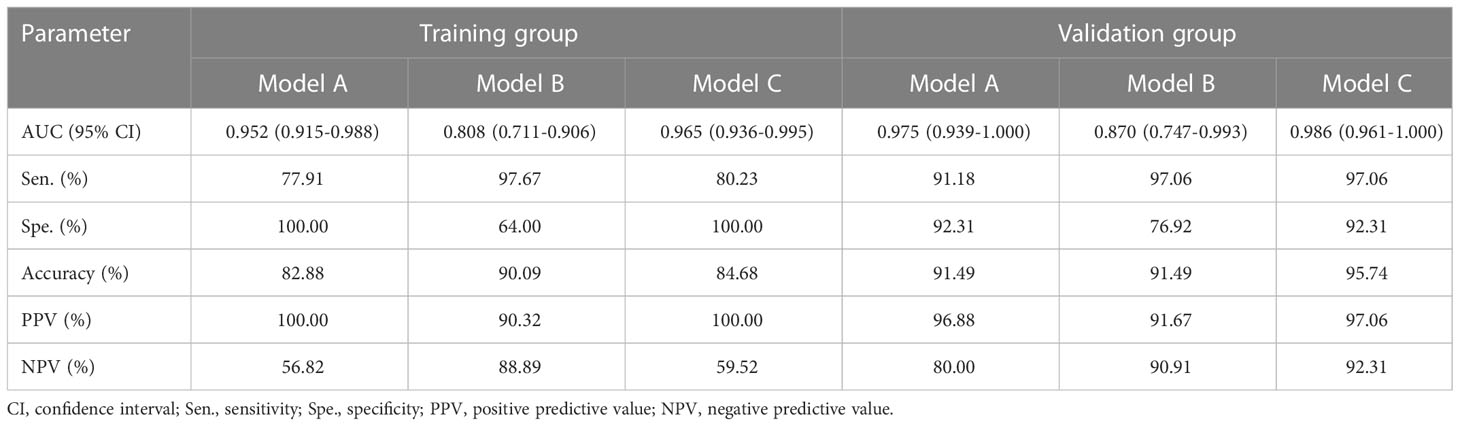
Table 4 Performance of the prediction model in the diagnosis of benign and malignant breast lesions in the training and validation groups.
4. Discussion
This study investigated the diagnostic performance of a combination of syMRI, ADC, and BI-RADS in distinguishing benign and malignant breast lesions. The results revealed that quantitative syMRI parameters can be used as a reference index to identify benign and malignant breast lesions. Combined with BI-RADS, this can further improve the diagnostic efficiency of breast cancer.
Clinical DW imaging is based on SS-EPI, which is prone to image artifacts (24–28). Compared with sensitivity encoding alone, MUSE DWI has a better SNR, due to its improved matrix inversion conditioning, and has shown a high spatial resolution in previous investigations (29–31). However, few studies have been conducted on the diagnosis of breast diseases using MUSE sequences. Previous studies have focused on image quality comparison between MUSE-DWI and traditional SS-EPI sequences. Daimiel et al. showed that the ADC value in the MUSE sequence of breast cancer was significantly lower than that of benign breast lesions (11).
Similarly, this study found that the ADC values of malignant breast lesions were significantly lower than those of benign breast lesions. Owing to continuous cell proliferation, increased synthesis of macromolecular substances, such as proteins in the cytoplasm, and the release of many necrotic substances, the extracellular space reduces, content of bound water increases, and the diffusion of free water molecules is restricted. These factors decrease ADC values in breast cancer (18). Compared with the study by Daimiel et al., the number of patients included in this study was more prominent. Validation was performed in the validation group, indicating that the MUSE sequence has a massive advantage in benign and malignant breast lesions.
T1, T2, and PD are inherent properties of matter (16). Previous studies have shown that relaxation time is meaningful in the differential diagnosis of breast diseases, of which T2 relaxation time has a better diagnostic performance than other quantitative parameters (19, 20). Similarly, in this study, the T2 value of malignant breast lesions was significantly lower than that of benign lesions, indicating that the difference in T2 values is meaningful for distinguishing benign lesions from breast cancer. Previous studies have shown that the difference in relaxation time is related to the amount of free water (32–35). The higher the free water content, the longer is the relaxation time (18). In malignant lesions, continuous cell proliferation and the release of necrotic material lead to a reduction of the extracellular space. The above reasons may lead to the reduction of tissue-free water, which is the reason for the shorter T2 relaxation time in malignant lesions.
This study also investigated the quantitative parameters of post-enhanced syMRI; however, multivariate logistic regression analysis showed that post-enhanced MRI quantitative parameters (PDGd) were not independent predictors of breast cancer. The reason behind this was analyzed because the post-enhanced syMRI sequence was performed after the enhanced sequence scan, and most of the contrast agent was cleared. Therefore, an enhanced quantitative relaxation index cannot represent the true blood supply to the tumor. This result was consistent with Matsuda et al. (21), suggesting that pre-enhanced MRI quantitative parameters were more meaningful. In this study, model A was established based on quantitative parameters (ADC, T2pre) and verified in the validation group. Compared with the conventional BI-RADS model(model B), model A showed better performance than model B. It shows that model A may be beneficial for pregnant women, children, and patients allergic to contrast media. In addition, the boundaries of small lesions are difficult to define, resulting in inaccurate measurements of relaxation values. Therefore, breast lesions smaller than 0.8 cm were excluded in this study, which was consistent with the exclusion criteria of Gao et al (20) and Matsuda et al (21). SyMRI can provide a variety of contrast images in a short scanning time, which is more helpful in obtaining histological information about lesions and improving the accuracy of benign and malignant breast identification.
DCE-MRI is an integral method for diagnosing breast diseases. However, its specificity varies greatly, which may result in clinically unnecessary biopsies. Therefore, effectively improving the diagnostic specificity of DCE-MRI is a future research direction for breast disease diagnosis. Different imaging parameters can provide different lesion characteristics. Therefore, this study combined different parameters to build a model and verified it in a validation group. This study showed that model A had better diagnostic performance (AUC = 0.952) than traditional BI-RADS model B (AUC = 0.808) in the training group. Model C had the highest diagnostic performance, with AUCs of 0.965 and 0.986 in the training and validation groups, respectively. In addition, an individualized prediction model for benign and malignant breast diagnosis was established based on the model C, which provided an intuitive and comprehensive prediction model for clinical practice to avoid unnecessary biopsies. In conclusion, the multiparameter MRI model has better diagnostic performance and provides objective quantitative parameters.
This study had some limitations. First, it was a single-center study with a relatively small sample size. Therefore, multicenter prospective studies are needed to verify the stability and reproducibility of different MRI scan parameters in the future. Second, when delineating the ROI, the most comprehensive axial level of the lesion was selected, and the entire lesion was not included, which may have resulted in loss of some heterogeneous features. Finally, this study adds MAGiC sequences before and after enhancement to conventional breast MRI, prolongs the examination time of patients, and reduces patient tolerance. It is necessary to optimize MAGiC scanning technology and shorten the examination time in future clinical practice.
Data availability statement
The original contributions presented in the study are included in the article/supplementary material. Further inquiries can be directed to the corresponding author.
Ethics statement
The studies involving human participants were reviewed and approved by General Hospital of Ningxia Medical University. Written informed consent for participation was not required for this study in accordance with the national legislation and the institutional requirements.
Author contributions
JL: Investigation, Data curation, Writing-Original Draft, Writing-Review & Editing Preparation, statistical analysis; MX: Investigation, resources; JR: Writing - Review & Editing Preparation; ZL: Writing -Review & Editing Preparation; LX: resources, supervision; BC: Conceptualization, resources, supervision, project administration,writing - Review & Editing Preparation. All authors contributed tothe article and approved the submitted version.
Acknowledgments
The authors thank BC for his guidance and advice during the writing process of the article. We also thank JR and ZL of GE Healthcare China for the English language editing and writing review.
Conflict of interest
Authors JR, ZL, and LX were employed by GE Healthcare.
The remaining authors declare that the research was conducted in the absence of any commercial or financial relationships that could be construed as a potential conflict of interest.
Publisher’s note
All claims expressed in this article are solely those of the authors and do not necessarily represent those of their affiliated organizations, or those of the publisher, the editors and the reviewers. Any product that may be evaluated in this article, or claim that may be made by its manufacturer, is not guaranteed or endorsed by the publisher.
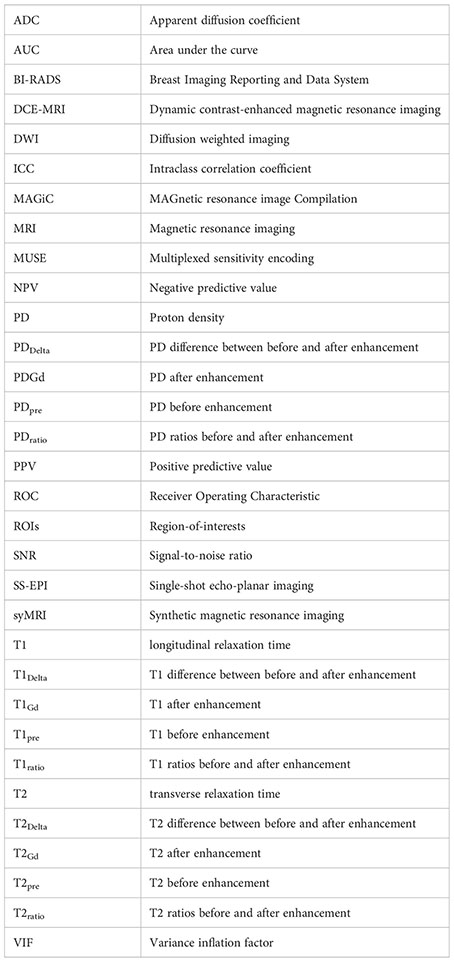
Glossary
References
1. Sung H, Ferlay J, Siegel RL, Laversanne M, Soerjomataram I, Jemal A, et al. Global cancer statistics 2020: GLOBOCAN estimates of incidence and mortality worldwide for 36 cancers in 185 countries. CA Cancer J Clin (2021) 71:209–49. doi: 10.3322/caac.21660
2. Orel SG, Schnall MD. MR imaging of the breast for the detection, diagnosis, and staging of breast cancer. Radiology (2001) 220:13–30. doi: 10.1148/radiology.220.1.r01jl3113
3. Mann RM, Cho N, Moy L. Breast MRI: State of the art. Radiology (2019) 292:520–36. doi: 10.1148/radiol.2019182947
4. Saslow D, Boetes C, Burke W, Harms S, Leach MO, Lehman CD, et al. American Cancer society guidelines for breast screening with MRI as an adjunct to mammography. CA Cancer J Clin (2007) 57:75–89. doi: 10.3322/canjclin.57.2.75
5. Partridge SC, Nissan N, Rahbar H, AE K, Sigmund EE. Diffusion-weighted breast MRI: Clinical applications and emerging techniques. J Magn Reson Imaging (2017) 45:337–55. doi: 10.1002/jmri.25479
6. Song SE, Park EK, Cho KR, Seo BK, Woo OH, Jung SP, et al. Additional value of diffusion-weighted imaging to evaluate multifocal and multicentric breast cancer detected using pre-operative breast MRI. Eur Radiol (2017) 27:4819–27. doi: 10.1007/s00330-017-4898-5
7. Pinker K, Baltzer P, Bogner W, Leithner D, Trattnig S, Zaric O, et al. Multiparametric MR imaging with high-resolution dynamic contrast-enhanced and diffusion-weighted imaging at 7 T improves the assessment of breast tumors: A feasibility study. Radiology (2015) 276:360–70. doi: 10.1148/radiol.15141905
8. Si L, Zhai R, Liu X, Yang K, Wang L, Jiang T. MRI In the differential diagnosis of primary architectural distortion detected by mammography. Diagn Interv Radiol (2016) 22:141–50. doi: 10.5152/dir.2016.15017
9. Zhu G, Luo J, Ouyang Z, Cheng Z, Deng Y, Guan Y, et al. The assessment of prostate cancer aggressiveness using a combination of quantitative diffusion-weighted imaging and dynamic contrast-enhanced magnetic resonance imaging. Cancer Manag Res (2021) 13:5287–95. doi: 10.2147/CMAR.S319306
10. Johansson J, Lagerstrand K, Ivarsson L, Svensson PA, Hebelka H, Maier SE. Brain diffusion MRI with multiplexed sensitivity encoding for reduced distortion in a pediatric patient population. Magn Reson Imaging (2022) 87:97–103. doi: 10.1016/j.mri.2022.01.003
11. Daimiel NI, Lo GR, Morris EA, Larowin T, Fung MM, Guidon A, et al. High-Spatial-Resolution multishot multiplexed sensitivity-encoding diffusion-weighted imaging for improved quality of breast images and differentiation of breast lesions: A feasibility study. Radiol Imaging Cancer (2020) 2:e190076. doi: 10.1148/rycan 2020190076
12. Pruessmann KP, Weiger M, Scheidegger MB, Boesiger P. SENSE: Sensitivity encoding for fast MRI. Magn Reson Med (1999) 42:952–62. doi: 10.1002/(SICI)1522-2594(199911)42:5<952::AID-MRM16>3.0.CO;2-S
13. Bitar R, Leung G, Perng R, Tadros S, Moody AR, Sarrazin J, et al. MR pulse sequences: what every radiologist wants to know but is afraid to ask. Radiographics (2006) 26:513–37. doi: 10.1148/rg.262055063
14. Betts AM, Leach JL, Jones BV, Zhang B, Serai S. Brain imaging with synthetic MR in children: clinical quality assessment. Neuroradiology (2016) 58:1017–26. doi: 10.1007/s00234-016-1723-9
15. White NS, Mcdonald C, Farid N, Kuperman J, Karow D, Schenker-Ahmed NM, et al. Diffusion-weighted imaging in cancer: Physical foundations and applications of restriction spectrum imaging. Cancer Res (2014) 74:4638–52. doi: 10.1158/0008-5472.CAN-13-3534
16. Ge X, Wang M, Ma H, Zhu K, Wei X, Li M, et al. Investigated diagnostic value of synthetic relaxometry, three-dimensional pseudo-continuous arterial spin labelling and diffusion-weighted imaging in the grading of glioma. Magn Reson Imaging (2022) 86:20–7. doi: 10.1016/j.mri.2021.11.006
17. Tanenbaum LN, Tsiouris AJ, Johnson AN, Naidich TP, DeLano MC, Melhem ER, et al. Synthetic MRI for clinical neuroimaging: Results of the magnetic resonance image compilation (MAGiC) prospective, multicenter, multireader trial. AJNR Am J Neuroradiol (2017) 38:1103–10. doi: 10.3174/ajnr.A5227
18. Sun SY, Ding Y, Li Z, Nie L, Liao C, Liu Y, et al. Multiparameter MRI model with DCE-MRI, DWI, and synthetic MRI improves the diagnostic performance of BI-RADS 4 lesions. Front Oncol (2021) 11:699127. doi: 10.3389/fonc.2021.699127
19. Liu L, Yin B, Shek K, Geng D, Lu Y, Wen J, et al. Role of quantitative analysis of T2 relaxation time in differentiating benign from malignant breast lesions. J Int Med Res (2018) 46:1928–35. doi: 10.1177/0300060517721071
20. Gao W, Zhang S, Guo J, Wei X, Li X, Diao Y, et al. Investigation of synthetic relaxometry and diffusion measures in the differentiation of benign and malignant breast lesions as compared to BI-RADS. J Magn Reson Imaging (2021) 53:1118–27. doi: 10.1002/jmri.27435
21. Matsuda M, Tsuda T, Ebihara R, Toshimori W, Takeda S, Okada K, et al. Enhanced masses on contrast-enhanced breast: Differentiation using a combination of dynamic contrast-enhanced MRI and quantitative evaluation with synthetic MRI. J Magn Reson Imaging (2021) 53:381–91. doi: 10.1002/jmri.27362
22. Cui Y, Han S, Liu M, Wu PY, Zhang W, Zhang J, et al. Diagnosis and grading of prostate cancer by relaxation maps from synthetic MRI. J Magn Reson Imaging (2020) 52:552–64. doi: 10.1002/jmri.27075
23. Zhao YY, Chen SH, Hao Z, Zhu HX, Xing ZL, Li MH. A nomogram for predicting individual prognosis of patients with low-grade glioma. World Neurosurg (2019) 130:e605–12. doi: 10.1016/j.wneu.2019.06.169
24. Wenkel E, Geppert C, Schulz-Wendtland R, Uder M, Kiefer B, Bautz W, et al. Diffusion weighted imaging in breast MRI: comparison of two different pulse sequences. Acad Radiol (2007) 14:1077–83. doi: 10.1016/j.acra.2007.06.006
25. Porter DA, Calamante F, Gadian DG, Connelly A. The effect of residual Nyquist ghost in quantitative echo-planar diffusion imaging. Magn Reson Med (1999) 42:385–92. doi: 10.1002/(SICI)1522-2594(199908)42:2<385::AID-MRM21>3.0.CO;2-J
26. Porter DA, Heidemann RM. High resolution diffusion-weighted imaging using readout-segmented echo-planar imaging, parallel imaging and a two-dimensional navigator-based reacquisition. Magn Reson Med (2009) 62:468–75. doi: 10.1002/mrm.22024
27. Kuroki Y, Nasu K, Kuroki S, Murakami K, Hayashi T, Sekiguchi R, et al. Diffusion-weighted imaging of breast cancer with the sensitivity encoding technique: Analysis of the apparent diffusion coefficient value. Magn Reson Med Sci (2004) 3:79–85. doi: 10.2463/mrms.3.79
28. Stadlbauer A, Bernt R, Gruber S, Bogner W, Pinker K, van der Riet W, et al. Diffusion-weighted MR imaging with background body signal suppression (DWIBS) for the diagnosis of malignant and benign breast lesions. Eur Radiol (2009) 19:2349–56. doi: 10.1007/s00330-009-1426-2
29. Chen NK, Guidon A, Chang HC, Song AW. A robust multi-shot scan strategy for high-resolution diffusion weighted MRI enabled by multiplexed sensitivity-encoding (MUSE). Neuroimage (2013) 72:41–7. doi: 10.1016/j.neuroimage.2013.01.038
30. Chang HC, Gaur P, Chou YH, Chu ML, Chen NK. Interleaved EPI based fMRI improved by multiplexed sensitivity encoding (MUSE) and simultaneous multi-band imaging. PloS One (2014) 9:e116378. doi: 10.1371/journal.pone.0116378
31. Bammer R, Keeling SL, Augustin M, Pruessmann KP, Wolf R, Stollberger R, et al. Improved diffusion-weighted single-shot echo-planar imaging (EPI) in stroke using sensitivity encoding (SENSE). Magn Reson Med (2001) 46:548–54. doi: 10.1002/mrm.1226
32. Biagini C. [Role of magnetic resonance imaging in the tissue characterization of tumors]. Radiol Med (1986) 72:379–92.
33. Bottomley PA, Hardy CJ, Argersinger RE, Allen-Moore G. A review of 1H nuclear magnetic resonance relaxation in pathology: Are T1 and T2 diagnostic? Med Phys (1987) 14:1–37. doi: 10.1118/1.596111
34. Lusse S, Claassen H, Gehrke T, Hassenpflug J, Schunke M, Heller M, et al. Evaluation of water content by spatially resolved transverse relaxation times of human articular cartilage. Magn Reson Imaging (2000) 18:423–30. doi: 10.1016/S0730-725X(99)00144-7
Keywords: breast cancer, synthetic magnetic resonance imaging (syMRI), diffusion-weighted imaging, multiplexed sensitivity-encoding, nomogram
Citation: Liu J, Xu M, Ren J, Li Z, Xi L and Chen B (2023) Synthetic MRI, multiplexed sensitivity encoding, and BI-RADS for benign and malignant breast cancer discrimination. Front. Oncol. 12:1080580. doi: 10.3389/fonc.2022.1080580
Received: 26 October 2022; Accepted: 14 December 2022;
Published: 03 February 2023.
Edited by:
Wei Zhao, Beihang University, ChinaCopyright © 2023 Liu, Xu, Ren, Li, Xi and Chen. This is an open-access article distributed under the terms of the Creative Commons Attribution License (CC BY). The use, distribution or reproduction in other forums is permitted, provided the original author(s) and the copyright owner(s) are credited and that the original publication in this journal is cited, in accordance with accepted academic practice. No use, distribution or reproduction is permitted which does not comply with these terms.
*Correspondence: Bing Chen, Y2hlbmJpbmcxMzU1MDFAMTYzLmNvbQ==