 Stylianos Kotsyfakis1Evangelia Iliaki-Giannakoudaki2Antonios Anagnostopoulos3
 Eleni Papadokostaki2Konstantinos Giannakoudakis2Michail Goumenakis4
 Michail Kotsyfakis5*
- 1Diagnostic Center ‘Ierapetra Diagnosis’, Ierapetra, Greece
- 2General Hospital of Heraklion Venizeleio-Pananeio, Heraklion, Greece
- 3Agios Savvas Oncology Hospital of Athens, Athens, Greece
- 4‘Apollonion’ Diagnostic Center, Heraklion, Greece
- 5Biology Center of the Czech Academy of Sciences, Budweis (Ceske Budejovice), Czechia
Background: Here, we conducted a scoping review to (i) establish which machine learning (ML) methods have been applied to hematological malignancy imaging; (ii) establish how ML is being applied to hematological cancer radiology; and (iii) identify addressable research gaps.
Methods: The review was conducted according to the Preferred Reporting Items for Systematic Reviews and Meta-Analysis Extension for Scoping Reviews guidelines. The inclusion criteria were (i) pediatric and adult patients with suspected or confirmed hematological malignancy undergoing imaging (population); (ii) any study using ML techniques to derive models using radiological images to apply to the clinical management of these patients (concept); and (iii) original research articles conducted in any setting globally (context). Quality Assessment of Diagnostic Accuracy Studies 2 criteria were used to assess diagnostic and segmentation studies, while the Newcastle–Ottawa scale was used to assess the quality of observational studies.
Results: Of 53 eligible studies, 33 applied diverse ML techniques to diagnose hematological malignancies or to differentiate them from other diseases, especially discriminating gliomas from primary central nervous system lymphomas (n=18); 11 applied ML to segmentation tasks, while 9 applied ML to prognostication or predicting therapeutic responses, especially for diffuse large B-cell lymphoma. All studies reported discrimination statistics, but no study calculated calibration statistics. Every diagnostic/segmentation study had a high risk of bias due to their case–control design; many studies failed to provide adequate details of the reference standard; and only a few studies used independent validation.
Conclusion: To deliver validated ML-based models to radiologists managing hematological malignancies, future studies should (i) adhere to standardized, high-quality reporting guidelines such as the Checklist for Artificial Intelligence in Medical Imaging; (ii) validate models in independent cohorts; (ii) standardize volume segmentation methods for segmentation tasks; (iv) establish comprehensive prospective studies that include different tumor grades, comparisons with radiologists, optimal imaging modalities, sequences, and planes; (v) include side-by-side comparisons of different methods; and (vi) include low- and middle-income countries in multicentric studies to enhance generalizability and reduce inequity.
1 Introduction
Radiology is at the forefront of applied artificial intelligence (AI) due to the digitization and archiving of vast numbers of radiology images coupled with the availability of high-performance, low-cost computers. Machine learning (ML) is a branch of AI that uses computational resources to detect underlying patterns in high-dimensional, “big” data. ML is increasingly used in radiology (1) and other medical specialties requiring predictions such as predicting hypertension (2) or chronic kidney disease risk (3). ML algorithms have now been developed and tested in almost every radiological subspecialty, including X-ray interpretation to reduce turnaround times, analyzing screening mammograms for breast cancer, segmenting pulmonary embolism in CT angiography, and brain tumor segmentation with MRI (4). This is also true in hematology, where ML has been applied to hematological malignancy radiology and to cytology, molecular genetics, and cytogenetics (5). However, there is currently no comprehensive assessment of ML in hematological oncology radiology.
This scoping review focuses on the application of ML to the diagnosis and prediction of hematological malignancies using radiological approaches. It also serves as an exemplar of the challenges faced when applying ML to diagnostic and predictive problems in hematology and oncology where computational approaches would benefit the specialty. ML has already been applied to other areas of hematology such as cytomorphometry (identifying and characterizing cell populations based on their morphology after imaging), cytogenetics (identifying and selecting individual chromosomes and chromosomal abnormalities), and immunophenotyping (identification and characterization of flow cytometry cell populations based on light-scattering properties and antigen expression patterns) (5). ML has also been applied to every other area of clinical oncology including automated histopathological analysis, molecular subtyping, prognostication and predicting responses to therapies using clinical and/or biomarker data (genomic and transcriptomic), and precision oncology (such as the inference of genomic traits from histopathological images) (6). Therefore, many of the principles underlying the application of ML to hematological oncology radiology—and the challenges and conclusions—will be of interest to every clinician since all patient care is likely to be impacted by rapid developments in this field.
1.1 A brief overview of machine learning and some important definitions
For an excellent overview of ML in radiology, see (4). For the purposes of this scoping review, ML refers to the automatic detection, or learning, of patterns and associations within data using computational resources and algorithms (a series of steps, often mathematical equations, designed to solve a problem). In the context of imaging, by applying an ML algorithm to images (such as CT, MRI, or FDG-PET images) and given some prior knowledge about these images (such as whether they contain a benign or malignant tumor), the algorithm can learn from training images and apply this knowledge to unseen images to make a prediction. Hopefully, as the parameters in the equations are optimized, the prediction improves, i.e., the algorithm learns.
From this basic description of ML, we can describe a set of definitions to help understand the ML literature. The model represents the rules, numbers, and any other algorithm-specific data structures required to make predictions after running an ML algorithm on training data. Labels refer to the “correct” answer assigned to the images or parts of the images, such as the presence of a lymphoma or the boundary of a diseased node. When the label is assigned to a group of pixels, this is known as classification. Training refers to the ML model learning from labeled data until it can no longer improve, while the validation set refers to a second set of data to which the model is applied to provide an unbiased estimate of the skill of the final tuned model when comparing or selecting between final models. In some cases, a third set of examples is used for “real-world” testing, known as testing, although, confusingly, the terms “validation” and “testing” are often used interchangeably. The application of the model to a third (preferably independent) set of data helps to ensure that the model generalizes with high accuracy to new, unseen data. Since the label in many medical applications is known (i.e., presence or absence of lymphoma), these models tend to be supervised as opposed to unsupervised, where the output is unknown and generated by the model itself. Finally, the data used to construct ML models are called features, which might be pixel values or variations, edge strengths, or any other numerical value derived by radiomics—a method that extracts huge numbers of features from medical images using data-characterization algorithms. For medical applications, non-imaging features may also be used such as a laboratory test value or clinical parameter such as age or gender.
Many different types of the ML model have been used in radiology research. These include decision trees [DTs; and their adaptation, random forests (RFs)], support vector machines (SVMs), and artificial neural networks (ANNs), complete descriptions of which can be found in (4). For the purposes of this review, it is useful to know that SVMs tend to generalize well to unseen data and work well with complex (multidimensional) data but can be hard to interpret (7, 8) and that ANNs—inspired by neural connections in the human brain—are computationally expensive and represent a “black box.” That is, the way in which they performed the classification is not known; thus, they are therefore difficult to interpret clinically (7, 8).
1.2 The clinical imperative for using ML in the hematological cancer radiology
There are several intuitive areas in which ML can be applied to hematological malignancy imaging: diagnosis, segmentation, and prognostication or therapeutic response prediction.
1.2.1 Clinical rationale for developing ML-based diagnostic models
While the morphological features of lymphomas and other benign and malignant neoplasms and inflammatory diseases are usually easy to distinguish, diagnostic difficulties can arise in certain cases when these appearances overlap. For example, most glioblastomas (GBMs) exhibit ring-like or heterogeneous enhancement on MRI with the areas of hypointense necrosis. Primary central nervous system lymphomas (PCNSLs) show uniform enhancement and low cerebral blood volumes (CBVs). Despite these diagnostic features, atypical cases can cause diagnostic difficulty (for example, non-necrotic GBMs or necrotic PCNSLs) (9, 10). Furthermore, “hypervascular PCNSLs” have high CBVs that mimic GBM (11). While biopsy can resolve the diagnostic dilemma, this is invasive, can cause complications, and may be non-diagnostic, particularly if steroids have lysed lymphoma cells (12). While complex imaging protocols including quantitative diffusion-, perfusion-, and susceptibility-weighted imaging; texture analysis; or their combination may increase diagnostic yield, a sufficiently accurate automated analysis of routine diagnostic images with ML could help diagnostic decision-making. It is essential to make the correct diagnosis, with minimal resources, and with minimal harm to the patient, since PCNSL and GBM are managed differently: methotrexate-based chemotherapy with or without radiotherapy for the former and surgical resection with radiochemotherapy for the latter (10, 13). Similar diagnostic difficulties occur at other sites including differentiating thymic neoplasms (usually surgical treatment) from lymphoma (medical management) (14) and differentiating breast carcinoma from lymphoma (15).
A second major application of ML techniques is to improve the detection and monitoring of hematological malignancies for accurate diagnosis, treatment, and staging. For example, the FDG-PET/CT images of lymphomas and multiple myeloma can be difficult to interpret due to low avidity, unusual distribution patterns [particularly diffuse disease in multiple myeloma (16) and leukemia (17)], or motion/attenuation artifacts, especially for inexperienced readers. Algorithms to support diagnostic decision-making would therefore be helpful (16, 18).
1.2.2 Clinical rationale for developing ML-based segmentation models
Total metabolic tumor volume (TMTV)—the quantification of the metabolically active volume of tumor assessed by FDG-PET/CT—is prognostic for many hematological malignancies including Hodgkin (19) and non-Hodgkin (20) lymphomas. Some patients are resistant to therapy or relapse, and it is difficult to identify this subset with existing prognostic indices [such as the international prognostic index (IPI) or international prognostic score (IPS) for HL]. New, accurate prognostic indices to drive personalized treatment approaches are still needed. While TMTV might form a valuable component of a prognostic algorithm, its computation currently requires the marking, often manually, of many regions of interest (ROIs). This is time-consuming and operator dependent, also contributing to error, and several non-standardized approaches are currently used to threshold and segment lesions, e.g., SUV ≥41%, SUV ≥2.5, or SUV ≥ mean liver uptake. ML approaches lend themselves to automating and standardizing this task by learning the most important imaging features while subtracting physiological uptake. This is challenging since the algorithms must handle low-resolution PET and the partial volume effect (loss of signal in small areas due to limited resolution), the high distribution variability of lesions, and the recognition and subtraction of physiological uptake in different organs.
1.2.3 Clinical rationale for developing ML-based prognostic/predictive models
As noted above, not all patients respond to therapy; for example, only ~60% of diffuse large B-cell lymphoma (DLBCL) patients benefit from current therapies and ~15% experience primary treatment failure and a median survival of under 1 year (21). Identifying these patients would allow the tailored addition of emerging therapies such as chimeric antigen receptor T-cell (CAR-T) therapy in patients most likely to fail first-line therapy. However, it is becoming increasingly clear that identifying and quantifying variability in and between lesions in the same patient, i.e., tumor heterogeneity, is as important as quantifying the amount of tumor since the molecular and microenvironmental differences reflected by this heterogeneity contribute to progression (i.e., prognosis) and therapeutic responses (22). Since ML can detect underlying patterns in high-dimensional data that are invisible to humans, it is hypothesized that ML can better interpret the quantitative and spatial data embedded in radiology images reflecting tumor heterogeneity. Associating these previously unseen patterns with the outcomes of interest such as survival or therapeutic response is then expected to identify the future clinical course of individual patients.
2 Objectives
Radiologists managing patients with hematological cancers are faced with clinical problems defined by known and unknown imaging features corresponding to disease states or clinical outcomes. This lends itself to the application of supervised ML techniques to develop diagnostic or predictive models. We therefore performed a scoping review of studies using ML techniques on radiology images to (i) establish which, if any, ML methods have been applied to hematological malignancy imaging; (ii) establish the main applications of ML in hematological cancer radiology; and (iii) identify research gaps that must be addressed to advance the field.
3 Methods
The Preferred Reporting Items for Systematic Reviews and Meta-Analysis Extension for Scoping Reviews (PRISMA-ScR) guidelines were applied (see Supplementary File 1 for the checklist) (23).
3.1 Rationale for performing a scoping review
A scoping review methodology (24) was chosen to map the available evidence since initial literature assessment showed that (i) evidence on ML in hematological cancer radiology is only just emerging; thus, a first impression of this field of research was appropriate and (ii) available studies are highly heterogenous and use many ML methods for several purposes/applications (24). The scoping approach therefore allowed us to (i) identify the available evidence; (ii) clarify key concepts and definitions; (iii) examine how research is being conducted, in which populations, and for what purposes; and (iv) identify knowledge gaps (24).
3.2 Inclusion and exclusion criteria
Using the population, concept, and context approach (25), inclusion criteria were (i) pediatric and adult patients with a suspected or confirmed hematological malignancy undergoing imaging (population); (ii) any study using ML techniques to derive models using radiological images for clinical benefit (concept); and (iii) original research articles conducted in any setting globally (context). All modeling approaches defined as ML in the respective papers (such as logistic regression) were included, with the assumption that the data analysis was almost wholly computer driven.
Exclusion criteria were any study in which an ML model was not defined and outcomes were not defined (for prognostic/predictive studies) and/or not written in English.
3.3 Literature search
The PubMed database was searched to identify literature meeting the study criteria published in English from inception to 1 October 2021. The search term used was [((machine learning) OR (artificial intelligence) OR (decision tree) OR (neural network) OR (random forest) OR (support vector machine) OR (radiomics)) AND ((radiology) OR (imaging) OR (tomography) OR (magnetic resonance)) AND ((hematological malignancy) OR (lymphoma) OR (myeloma) OR (leukemia))].
Articles were included if they used supervised ML techniques to interpret diagnostic radiology images in any patient with a hematological malignancy. Commentaries, editorials, letters, or case reports were excluded. All abstracts identified by the initial search were screened for inclusion and checked for accuracy. Disagreements over inclusion were resolved by consensus between the researchers.
Data were extracted from papers meeting the inclusion criteria to populate tables prior to analysis. The data of interest included study population characteristics; imaging modalities; ML algorithms used; the methods of model validation; performance measures such as accuracy, sensitivity, specificity, and AUC; and direct comparison to other algorithms or radiologist performance.
3.4 Quality assessment
No current quality assessment tool specifically addresses ML methodology, although the Checklist for Artificial Intelligence in Medical Imaging (CLAIM) is a recently published guideline that helps authors applying ML to medical imaging applications present their research optimally (26).
Therefore, for diagnostic studies (including segmentation analyses), the following CLAIM items were used to assess each domain of the Quality Assessment of Diagnostic Accuracy Studies 2 (QUADAS-2) criteria (27): (1) data sources, the selection of data subsets and how missing data were handled in the patient selection risk of bias; (2) the measures of significance and uncertainty and robustness or sensitivity analysis in the index test risk of bias; (3) sufficient detail to allow replication about the definition of ground truth, rationale for choosing the reference standard, qualifications, and preparation of annotators for the source of ground truth annotations in the reference standard test risk of bias; and (4) validation or testing on external data when assessing concerns regarding the applicability of the index test.
The Newcastle–Ottawa Scale (NOS) (28) was used to assess the quality of prognostic/predictive studies with scores converted to AHRQ standards, i.e., good quality: three or four stars in the selection domain AND one or two stars in the comparability domain AND two or three stars in the outcome/exposure domain; fair quality: two stars in the selection domain AND one or two stars in the comparability domain AND two or three stars in the outcome/exposure domain; and poor quality: zero or one star in the selection domain OR zero star in the comparability domain OR zero or one star in the outcome/exposure domain.
4 Results and discussion
4.1 Main findings
4.1.1 Identified risk models
A total of 397 studies were identified, of which 53 studies met the inclusion criteria (Table 1; Figure 1). The most common reasons for exclusion were (i) ML was not the primary analytical methodology or the analysis was not computer driven and (ii) the studies used features from non-imaging data such as histopathological or cytology images.
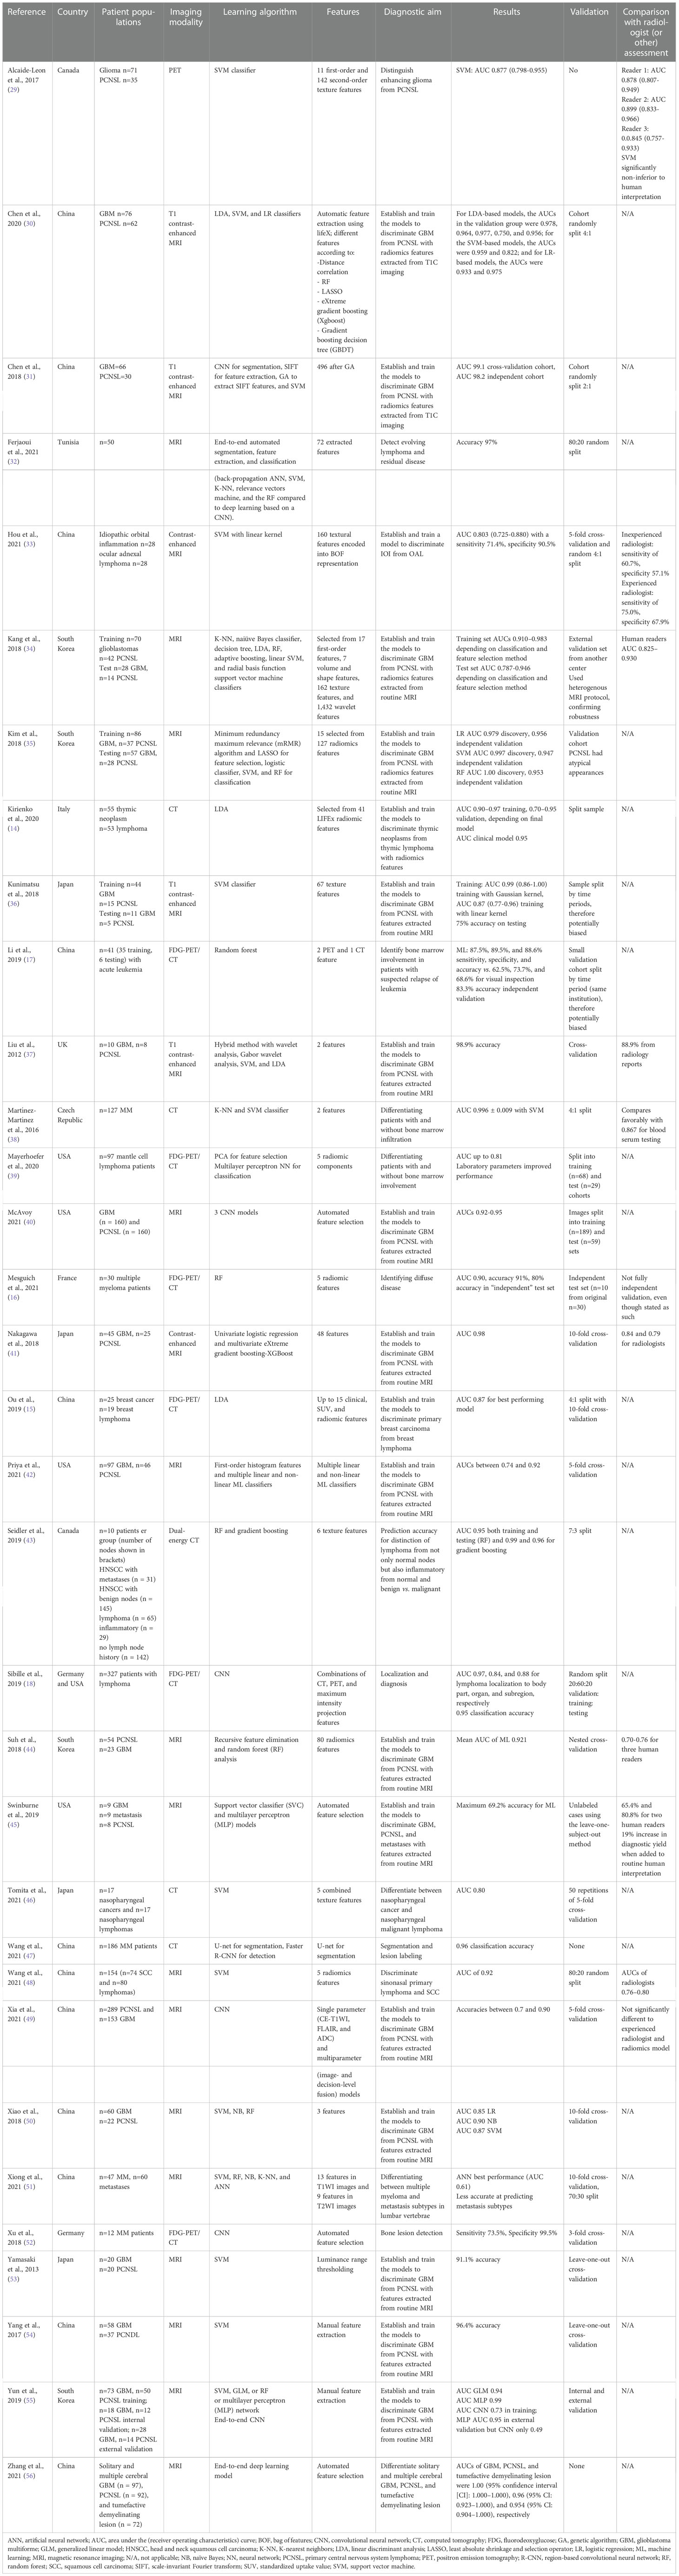
Table 1 Studies applying machine learning to the diagnosis of lymphoma or to distinguish it from another malignancy.
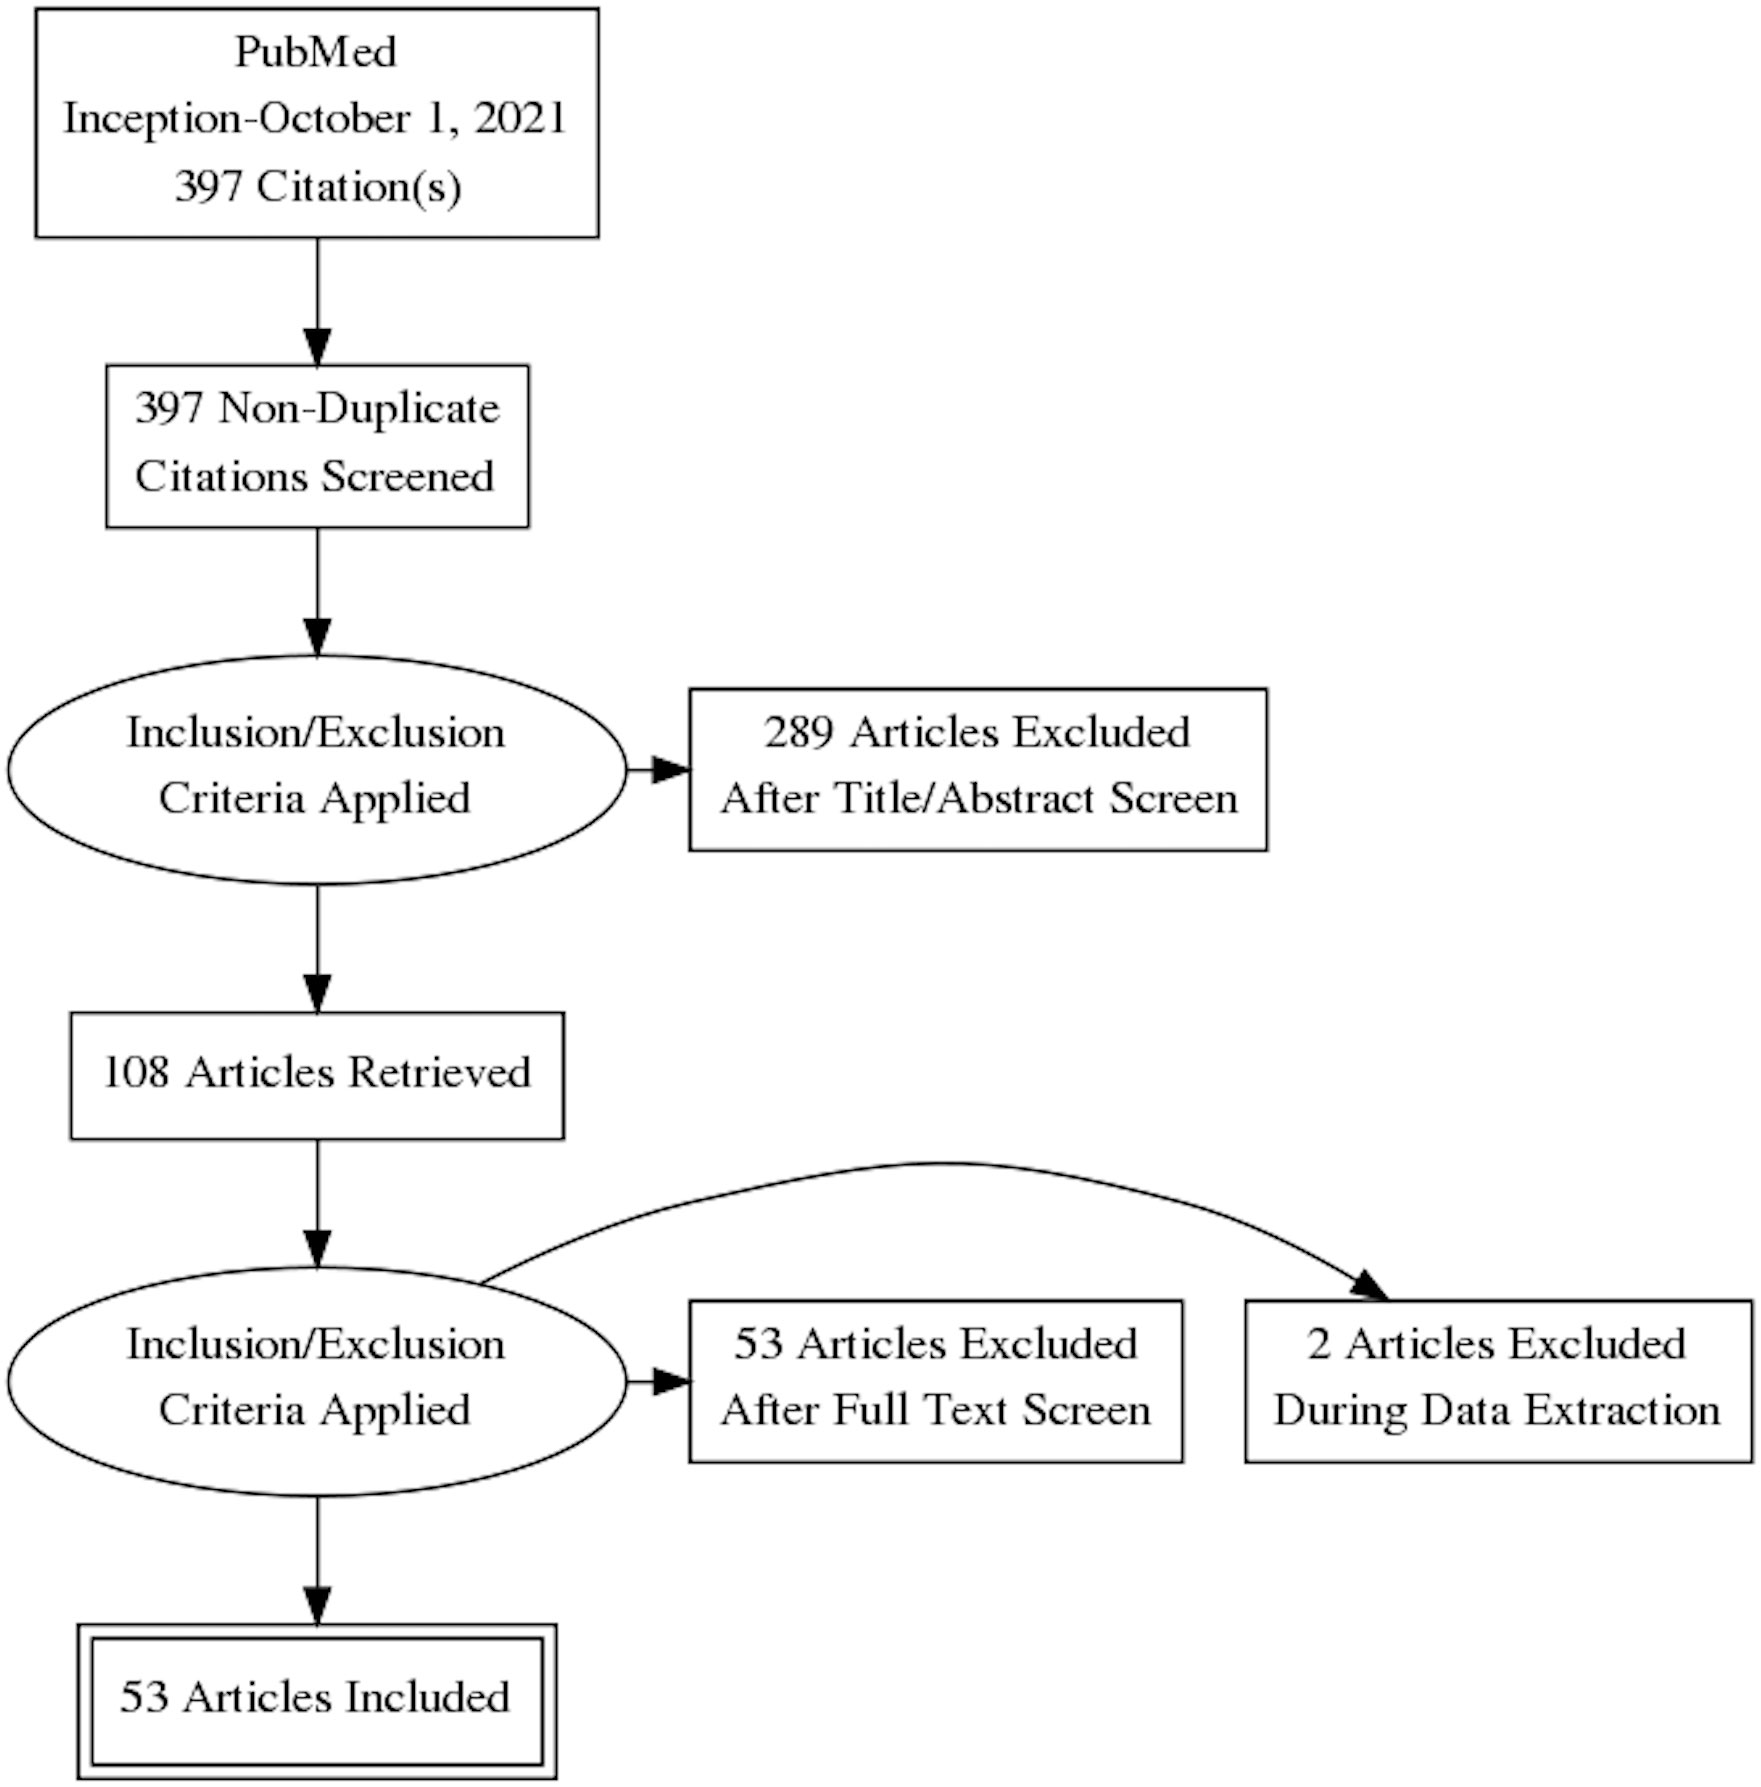
Figure 1 The Preferred Reporting Items for Systematic Revsiews and Meta-Analysis (PRISMA) flowchart depicting the search strategy. Figure prepared using the PRISMA Flow Diagram Generator (http://prisma.thetacollaborative.ca).
All studies were retrospective studies conducted between 2012 and 2021, and 39 (74%) were published in the last 3 years. There were 14 studies conducted in China, 15 in the UK/Europe, 11 in North America, 5 in South Korea, 4 in Japan, and 2 in the rest of the world (Tunisia and Turkey); only two were multicenter, multinational (Germany/USA and Denmark/USA) studies.
There were 33 studies that applied ML techniques to diagnose a hematological malignancy or to differentiate it from another disease state or malignancy (Table 1); 11 applied ML for segmentation tasks alone (Table 2), while 9 applied ML to the problem of prognostication or predicting responses to therapy (Table 3). These subgroups are considered separately below.
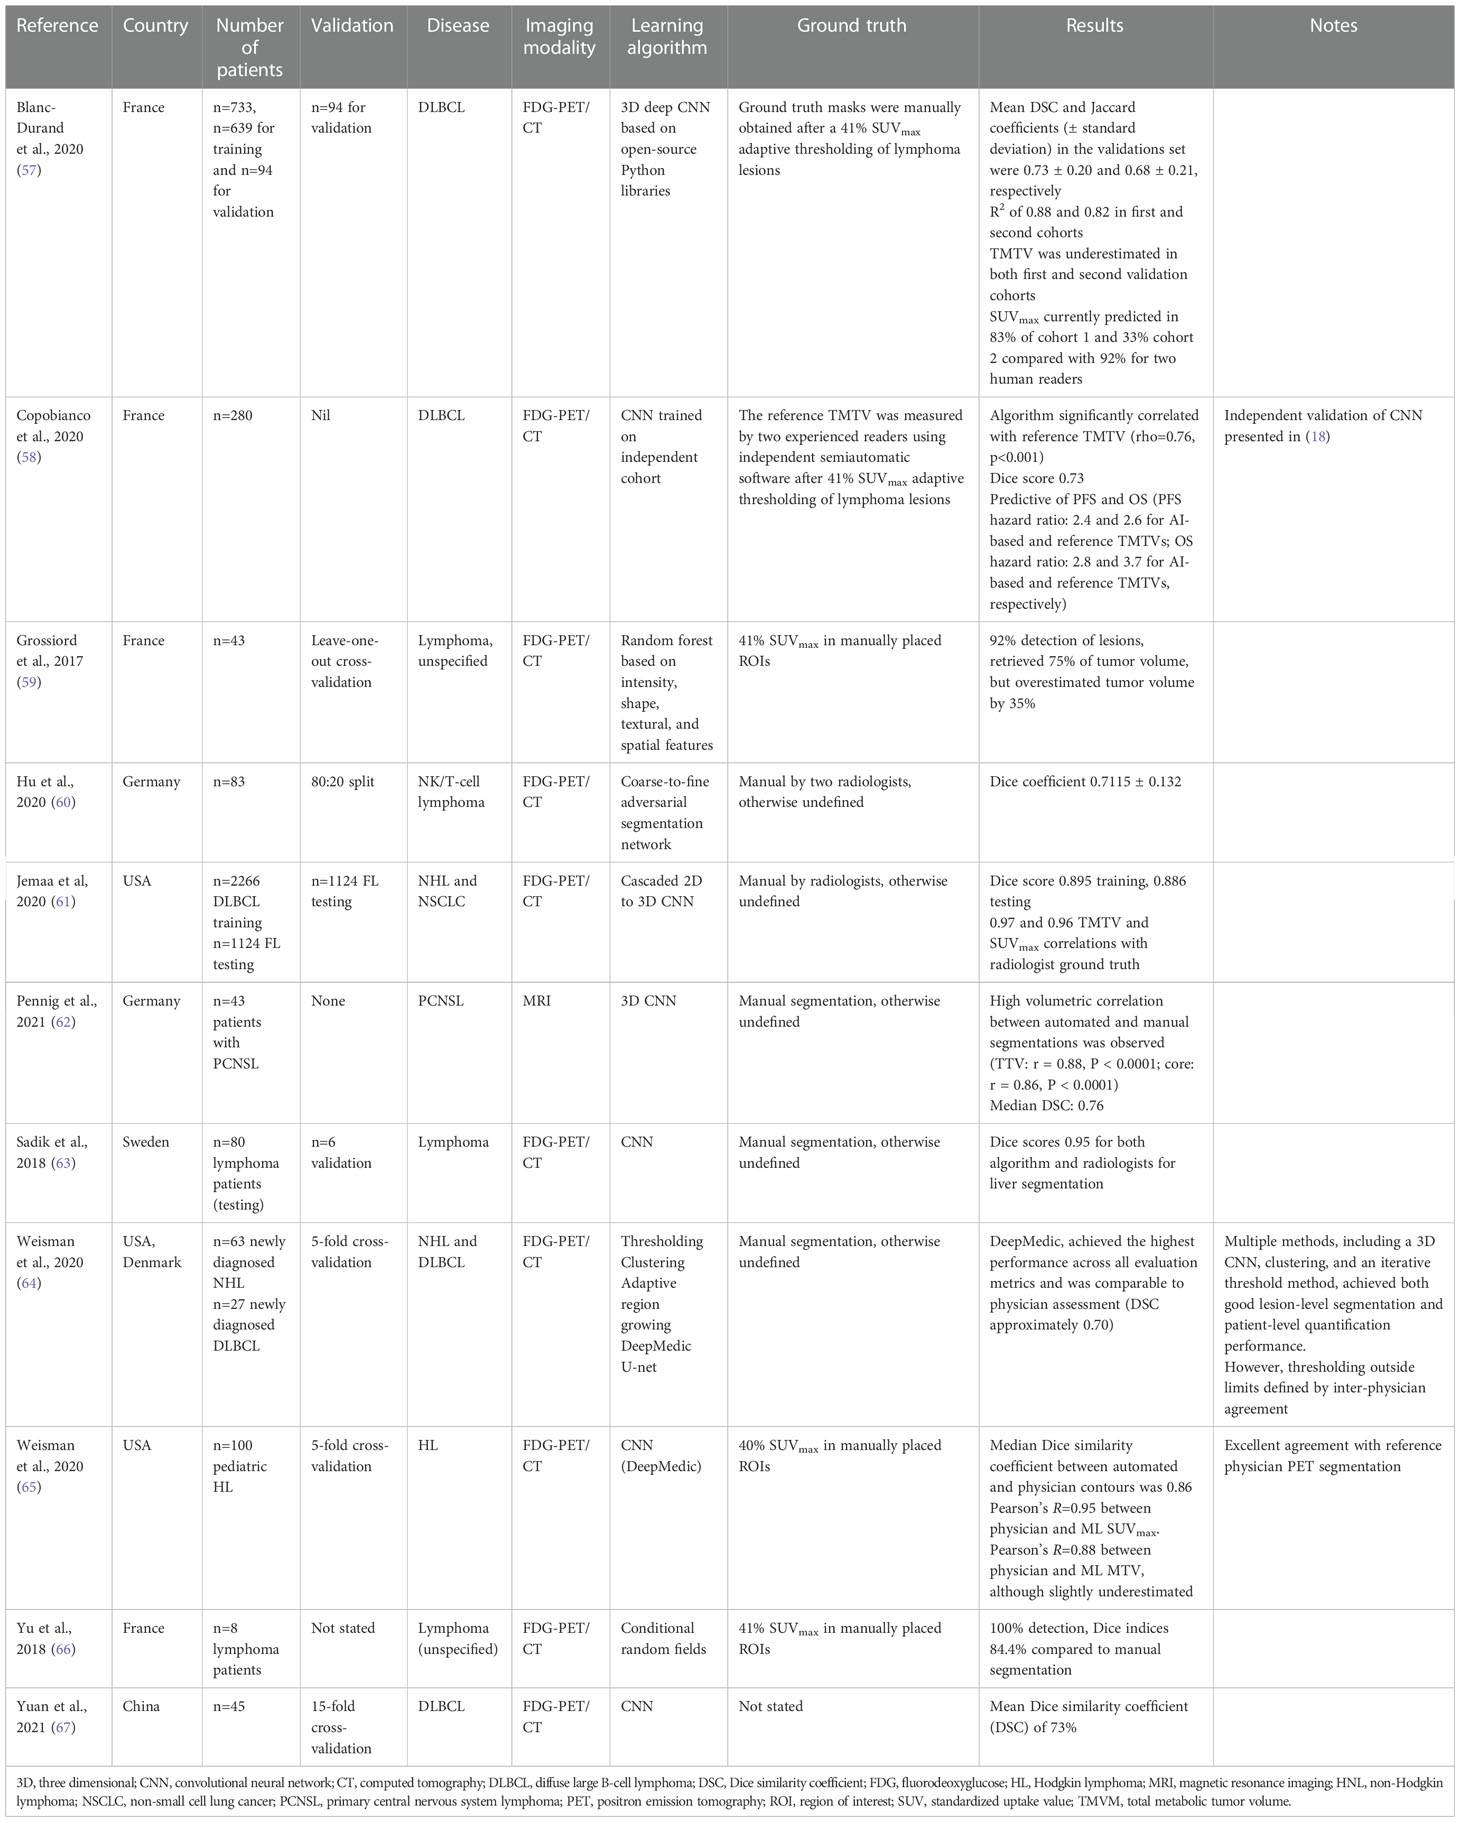
Table 2 Studies applying machine learning to segmentation tasks.

Table 3 Studies applying machine learning for the prognosis/prediction of responses to therapy.
4.2 ML models for diagnostic purposes
4.2.1 Applications
Of the 33 studies that applied ML techniques to diagnose a hematological malignancy or to differentiate it from another disease state or malignancy (Table 1), 18 were designed to establish and train ML models to discriminate gliomas [predominantly GBM from PCNSL (29–31, 34–37, 40–42, 44, 45, 49, 50, 53–56)] using features extracted from FDG-PET [one study (29),] or MRI (30, 31, 34–37, 40–42, 44, 45, 49, 50, 53–56) images. The remaining studies belonged to two major categories: those developing models to discriminate solid hematological malignancies from other benign and malignant lesions at other sites [nasopharyngeal carcinomas from nasopharyngeal lymphoma (46, 48), idiopathic orbital inflammation from ocular adnexal lymphoma (33), thymic neoplasm from thymic lymphoma (14), breast carcinoma from breast lymphoma (15), lymphoma from normal nodes (43), or multiple myeloma from bone metastases (51)] and those that detect the location of hematological malignancies either at diagnosis or during the disease course [location of (18) or evolving/residual lymphoma (32) or leukemia (17) or bone marrow involvement with multiple myeloma (16, 38, 47, 52) or mantle cell lymphoma (39)].
4.2.2 Model development
Many ML techniques were used, and, in some studies, different modeling approaches were compared on the same dataset (30, 32, 34, 35, 42, 43, 50, 51, 55). Others developed models using a single approach or a combination of approaches in an end-to-end manner (31, 32, 55, 56). The following diverse ML approaches were used to discriminate lymphomas from other benign or malignant lesions: support vector machines (SVMs (29–31, 33–37, 46, 48, 50, 51, 53–55);), linear discriminant analysis (LDA (14, 15, 30, 34, 37);), logistic regression (LR (30);), artificial/convolutional neural networks (A/CNNs (31, 40, 45, 49, 51, 55, 56);), k-nearest neighbors (K-NNs (34, 51);), naïve Bayes classification (NB (34, 50, 51);), decision trees (DTs (34);), random forests (RFs (34, 35, 43, 44, 50, 51, 55);), adaptive boosting (34), and gradient boosting (41, 43). The ML approaches used to detect the location of hematological malignancies either at diagnosis or during the course of disease were similarly diverse: A/CNNs (18, 32, 48, 77), SVMs (32, 38), K-NN (32, 38), RF (16, 17, 32).
All studies used at least some radiomics features in the models (from a few to several hundred); most studies used automated extraction methods, although some used manual feature extraction (54, 55) and one study included clinical features (15). Only three studies validated model performance on external datasets (34, 35, 55), the remainder choosing cross-validation approaches or a random division of the datasets into training and test sets.
4.2.3 Model discrimination and calibration
AUC values or standard accuracies were provided as the metrics of model performance. No study assessed calibration (i.e., quantifying the uncertainty). With respect to distinguishing gliomas from PCNSL, the AUC values were mainly >0.90, with the occasional study reporting lower values (e.g., 0.85–0.90 and 0.74–0.92 depending on model type in (50) and (42), respectively, and 0.49 and 0.79 independent external datasets in (55) and (34), respectively). Where accuracies were reported, they were similarly usually very high (>90%), except for one study where the maximum accuracy was only 69.2% for the ML approach. Likewise, for those studies discriminating lymphomas from other benign or malignant lesions, the AUC values were generally high (>0.80), except for one attempt to differentiate multiple myeloma from metastases in lumbar vertebrae [best AUC (for a CNN) 0.61 (51)]. Those studies examining disease location or presence reported uniformly good performance (AUCs usually >0.8, accuracies >85%), except for one study identifying patients with and without bone marrow involvement with mantle cell lymphoma, which achieved AUCs up to 0.81 and required the inclusion of laboratory parameters to improve performance (39).
4.2.4 Performance of different ML methods and comparison with radiologist assessment
In studies that compared different ML methods on the same datasets (30, 32, 34, 35, 42, 43, 50, 51, 55), no single approach consistently outperformed the others.
All studies comparing model performance with radiologists or human interpreters reported equivalent (29, 49) or superior (33, 34, 37, 41, 44, 48) performance using ML approaches, except for Swinburne et al. (45), who reported a maximum accuracy of 60.2% for the ML approach to discriminate GBM, PCNSL, and brain metastases with features extracted from routine MRI scans compared with 65.4% and 80.8% for two human readers. However, when the algorithm was added to routine human interpretation, there was a 19% increase in diagnostic yield.
Finally, an SVM-based model (AUC 0.99) compared favorably with blood serum testing to detect patients with bone marrow infiltration with multiple myeloma (38).
4.2.5 Quality assessment
The quality of diagnostic studies was assessed by QUADAS-2 criteria (Table 4 and Figure 2). In the patient selection risk of bias domain, all studies were considered at a high risk of bias since they needed to be considered as a case–control design because the outcomes were already known before ML algorithms were applied. Conversely, all studies were assessed as a low risk of bias in the index test risk of bias domain because the ground truth was not visible during computational analysis and algorithm development defined a prespecified threshold that was subsequently used in the test phase. In the reference standard risk of bias domain, while nine studies explicitly stated that the reference was interpreted without the knowledge of the ML results, there was uncertainty in the remainder as to whether reference standard interpretation was independent of the index test results. For many of these studies, this lack of information also resulted in uncertainty in the flow and timing domain since the interval between the index and reference tests was uncertain. In the index test domain of concern of applicability, five studies validated the algorithms on external validation cohorts (two via a temporal split of the data) and were considered to have a low concern of applicability. All studies were considered to have low concern about applicability in the patient selection domain, and one study had high uncertainty about applicability in the reference standard domain due to the variety of diagnostic techniques used to define the disease status of the cervical nodes assessed in the study (43).
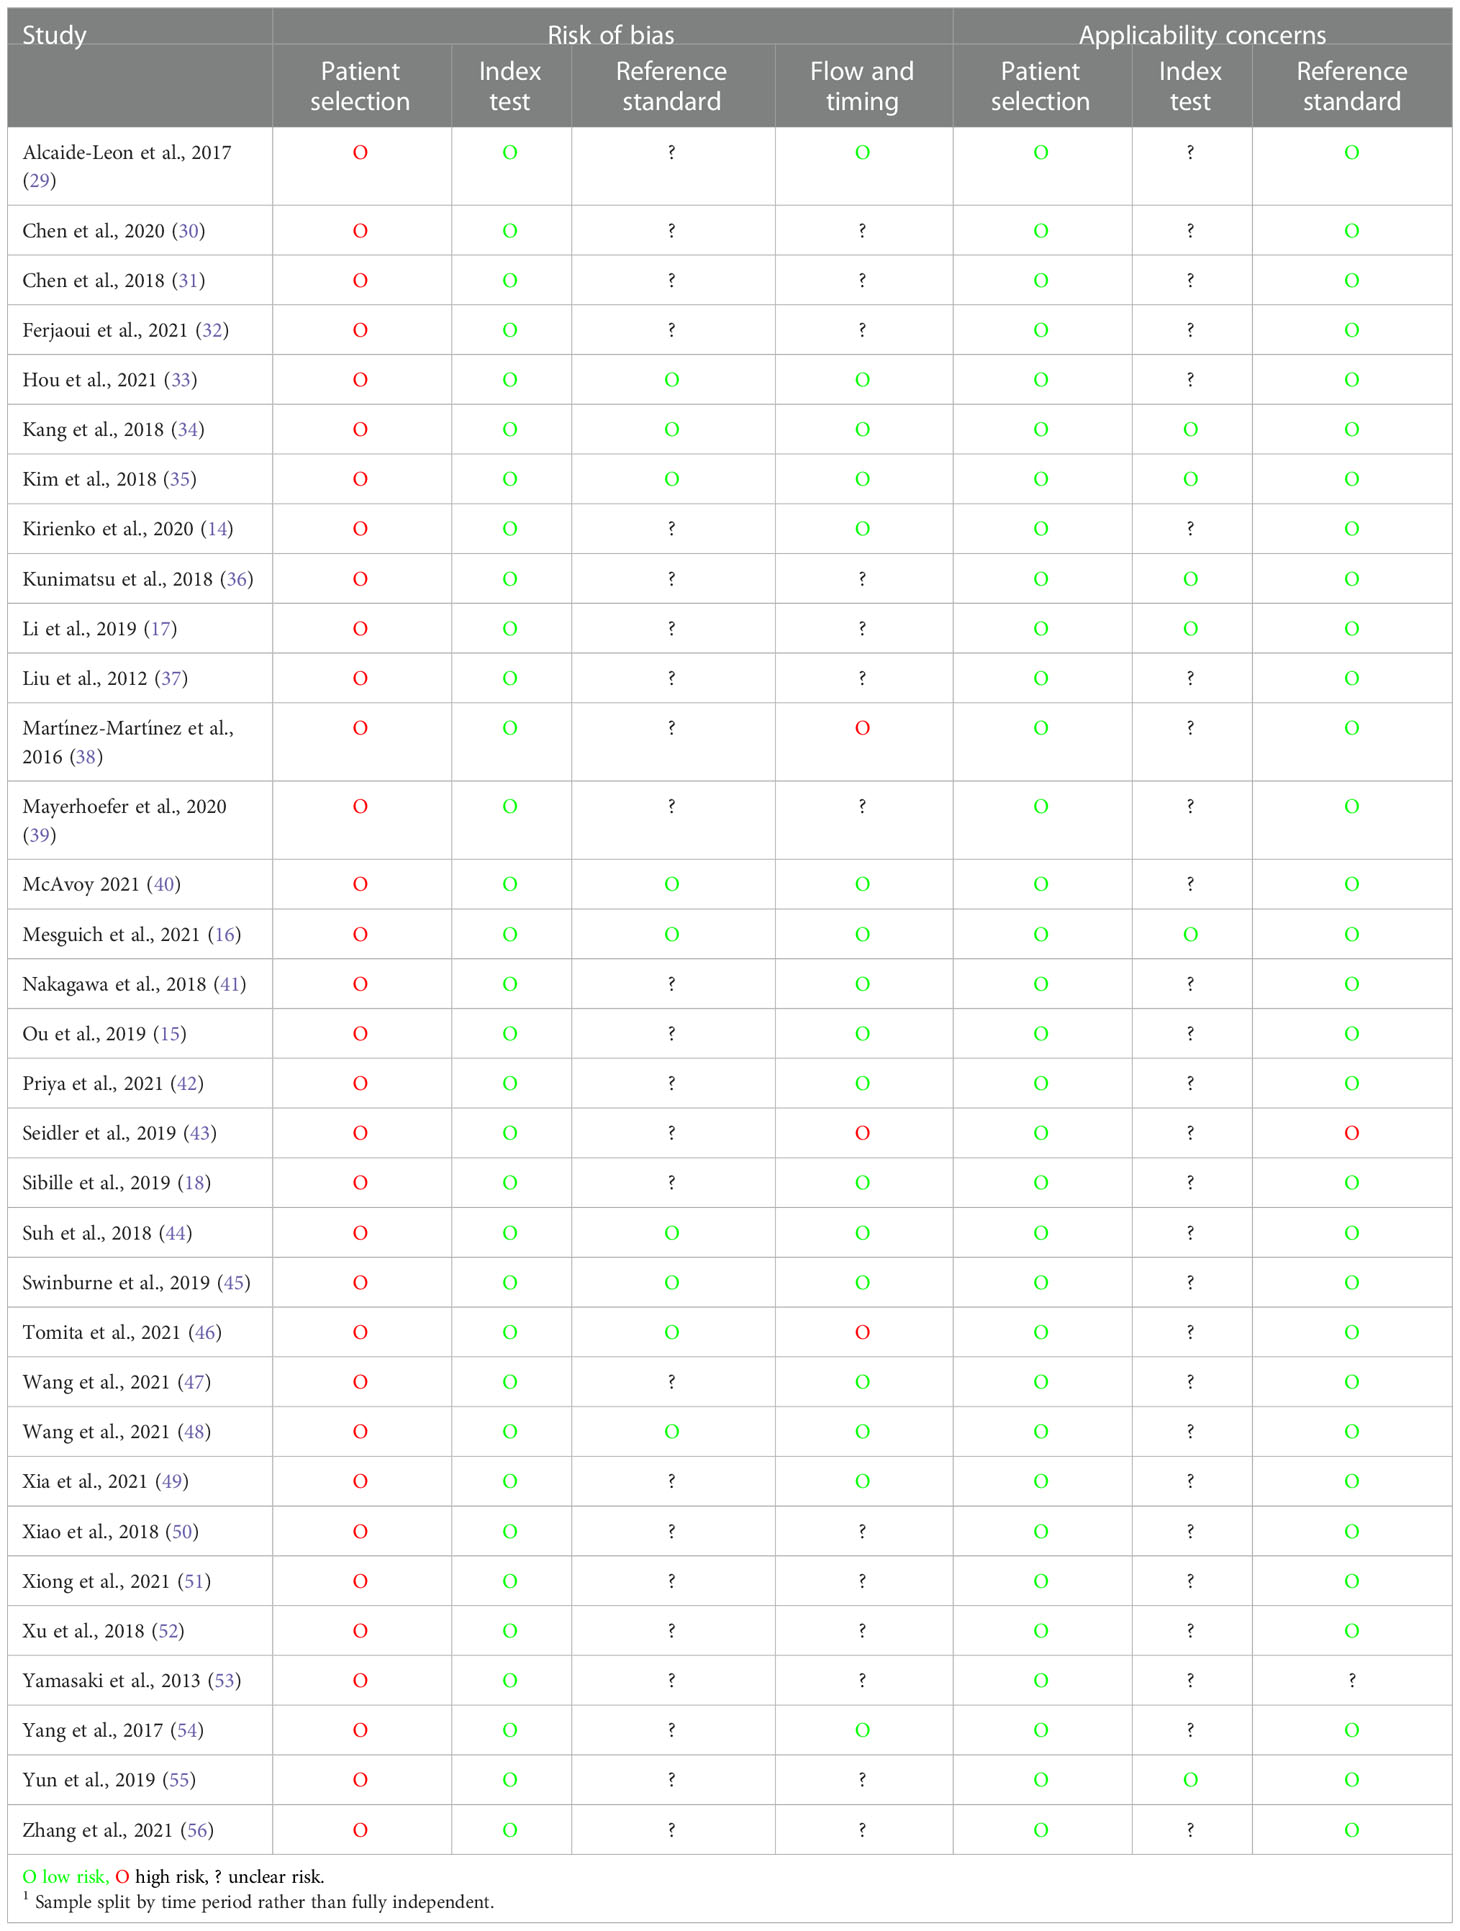
Table 4 Quality Assessment of Diagnostic Accuracy Studies 2 (QUADAS-2) assessment for diagnostic studies.
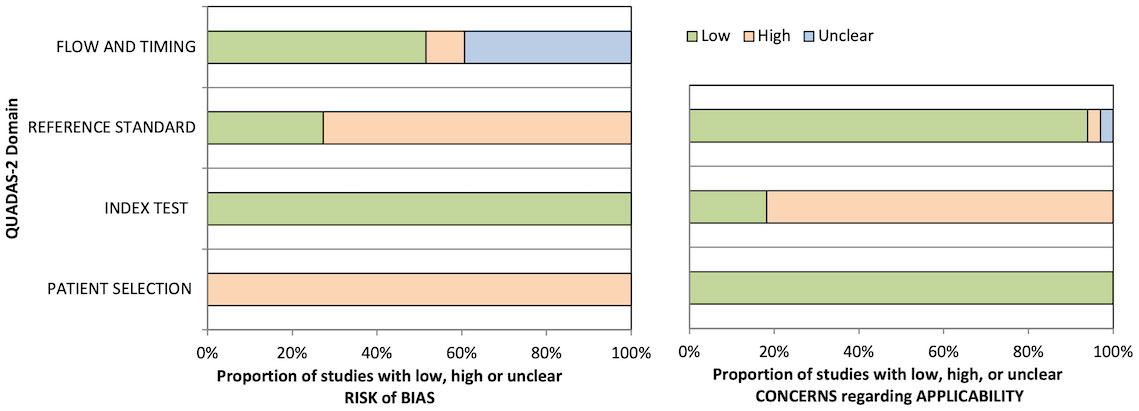
Figure 2 Graphical summary of Quality Assessment of Diagnostic Accuracy Studies 2 (QUADAS-2) results for diagnostic studies.
4.3 ML models for segmentation tasks
4.3.1 Applications
A total of 11 studies applied ML to segmentation tasks (Table 2) in FDG-PET/CT images: 3 applied it to DLBCL (57, 58, 67), 1 to DLBCL and HL (78), 1 to DLBCL and NHL (64), 1 to natural killer (NK)/T-cell lymphoma (60), 1 to HL (65), and 4 to NHL/lymphoma unspecified (59, 61, 63, 66). One study applied ML to MRI images to segment PCNSL (62).
4.3.2 Model development
CNN-based methods were most commonly applied to segmentation tasks (eight studies (57, 58, 61–65, 67),), but RFs (59), adversarial networks (60), and conditional random fields (66) were also used.
Each study selected a number of different ground truths for comparison with the ML results, including manual selection after 41% SUVmax thresholding (57, 58), 41% SUVmax thresholding in manually placed ROIs (59, 64, 66), manual segmentation by radiologists but without any further details of the methodology (60–63, 65), or not stated (67).
Models were validated using random splits (60), cross-validation approaches (59, 64, 65, 67), separate (but not fully independent) datasets (57, 61, 63), or validation was unreported or not performed (62, 66).
4.3.3 Model discrimination and calibration
All studies reported Dice similarity coefficients (DSCs). These ranged from 0.71 to 0.95, except for Grossiard et al. (59), which only reported its results descriptively (92% lesion detection, retrieved 75% of tumor volume but overestimated tumor volume by 35%). Calibration (i.e., quantifying the uncertainty) was not assessed in any study.
4.3.4 Quality assessment
QUADAS-2 quality assessment results are presented in Table 5 and Figure 3. All studies were considered at a high risk of bias in the patient selection domain and as a low risk of bias in the index test risk of bias domain due to the case–control design and blinded ground truth/prespecified thresholds used, respectively. No study stated whether the reference standard was assessed independent of the index test results or the interval between the index and reference tests; thus, the reference standard and flow/timing biases were deemed unclear. No study validated the proposed ML algorithms on independent cohorts; hence, the concern about the applicability of the index test was deemed uncertain in all cases.
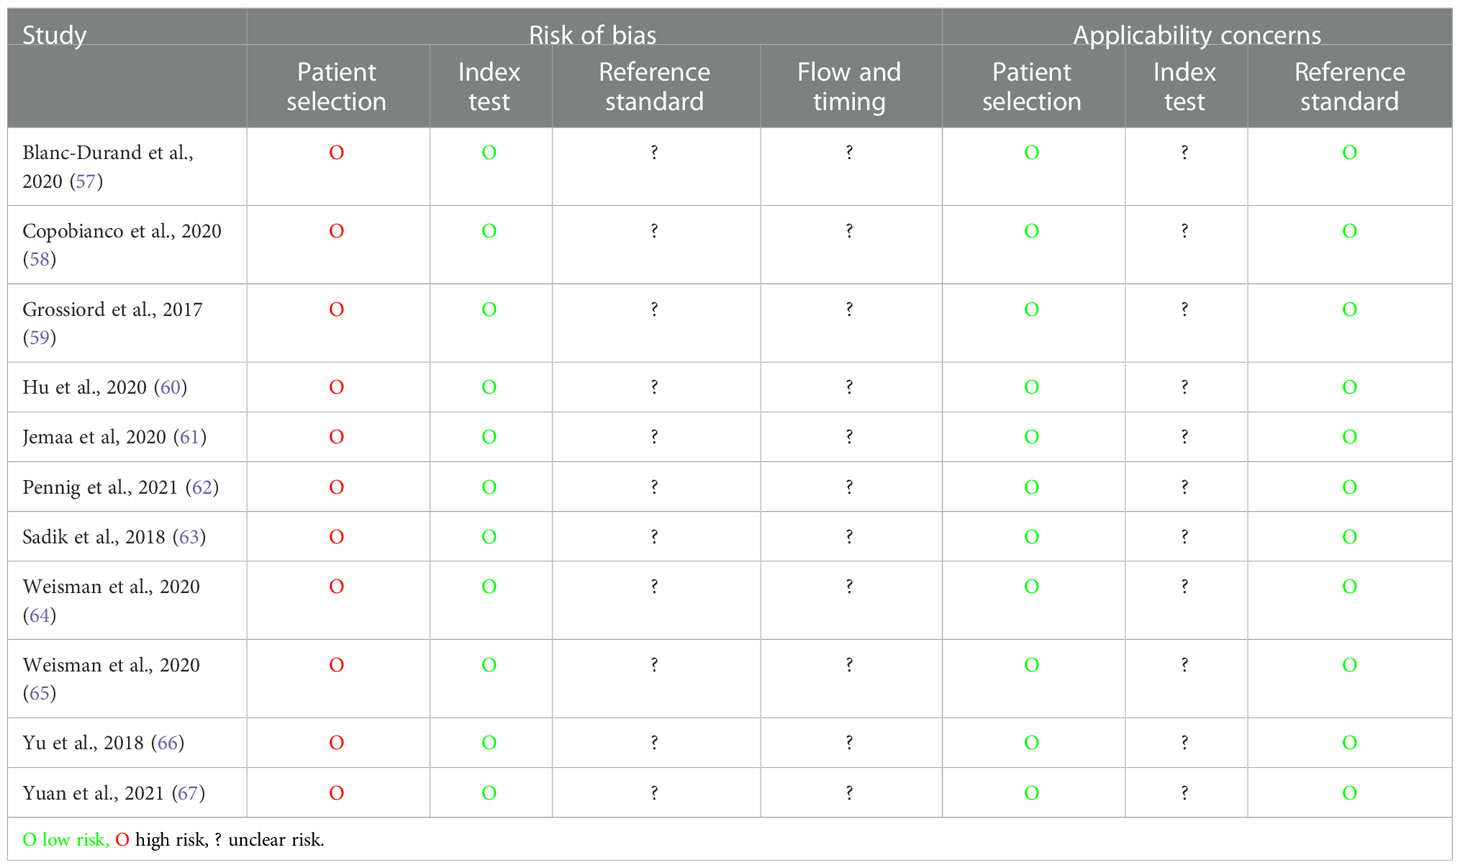
Table 5 QUADAS-2 assessment for segmentation studies.
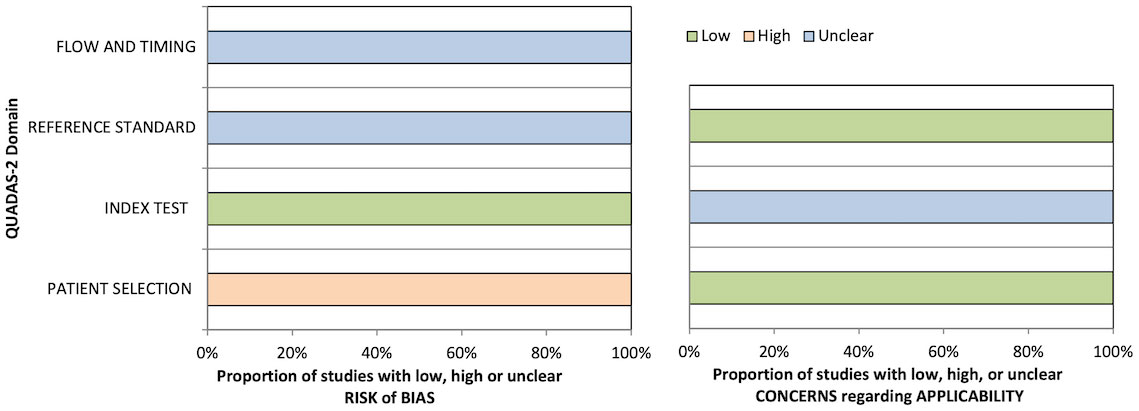
Figure 3 Graphical summary of QUADAS-2 results for segmentation studies.
4.4 ML models for prognostication or prediction of responses to therapy
4.4.1 Applications
Nine studies applied ML to prognostication or predicting responses to therapy in patients with hematological malignancies (Table 3): (i) predicting outcomes (overall survival or progression-free survival) in patients with extranodal NK/T-cell lymphoma, nasal type (69), multiple myeloma (70, 75), DLBCL (71), and mantle cell lymphoma (73) or (ii) predicting responses to therapy in patients with DLBCL (68, 76) and HL (74). One study aimed to identify high-risk cytogenetic (HRC) multiple myeloma patients by applying ML to MRI images (72). Six studies used FDG-PET/CT data, two studies CT data, and one study MRI data.
4.4.2 Model development
Several different ML approaches were applied including a logistic regression classifier (68, 72), random survival forests (RSFs (70);), weakly supervised deep learning (69), ANN/CNNs (71, 73), SVM (72, 74), RF (72, 75, 76), DT (72), K-NN (72), and XGBoost (72). The models used a range of features including not only automatically extracted radiomic features but also clinicopathological variables in two studies (70, 75), laboratory variables in one study (73), and two additional radiological features (nodal site and subjective necrosis) in one study (76). The models were validated by splitting the data or cross-validation, and no study tested the models on independent validation sets.
4.4.3 Model discrimination and calibration
Studies reported model performance with AUCs, hazard ratios (HRs), or prediction errors. The models developed to predict survival outcomes could all discriminate survival differences with the AUCs of 0.83 (73) and 0.88 (test set (69),), the HRs of 4.3 (70) and ~2 (71) between good and poor prognosis groups, or an average prediction error for the PFS of 0.36 (75). With respect to responses to therapy, the reported AUCs for the outcome of interest were between 0.81 and 0.95. Finally, in the study aiming to identify HRC multiple myeloma patients (72), the AUC was 0.84 for the LR model. No study reported calibration statistics.
4.4.4 Quality assessment
Using the NOS, six studies were graded as good, two as “fair”, and one as “poor”, the latter because the cohorts were not comparable because the design or analysis did not adequately control for confounders.
4.5 Strengths and limitations of the evaluated studies
This scoping review set out to (i) establish which, if any, ML methods are being used to interpret diagnostic radiology in patients with hematological malignancies; (ii) establish the main applications of ML in hematological cancer radiology; and (iii) identify current research gaps. The review is definitive on the first two aims. Wide, indeed disparate, ML methods have been applied to diagnostic radiology images in patients with hematological malignancies, and there is no consensus on which, if any, approach best suits a particular application. With respect to the second aim, these methods have been applied to three main applications: the diagnosis or discrimination of lymphoma from other disease entities, lesion segmentation to accurately quantify tumor burden in PET-CT images, and for the prognostication or prediction of therapeutic responses.
With three-quarters of ML studies in the hematological oncology radiology arena published in the last 3 years, all the published literature representing preclinical studies, and no ML algorithm yet having entered hematological radiology practice, this scoping review also highlights that the field remains in its infancy. Most of the presented studies, whether evaluated in isolation or compared with radiologist assessment, demonstrate favorable accuracies. Thus, why are these ML algorithms not yet used in clinical practice, and what areas need addressing to facilitate widespread clinical adoption? We propose that three areas must be addressed to progress the clinical application of ML in this field: (i) improvements in model application, validation, comparison, and performance evaluation; (ii) improvements in methodology and reporting standards to reduce bias and promote comparability; and (iii) broadening the study populations to improve generalizability.
4.5.1 Model application, validation, performance evaluation, and comparison
No single ‘best’ ML approach was identified, although some studies compared different ML approaches on the same datasets. Only a few studies validated model accuracy on external datasets, instead splitting the sample or using cross-validation. This limitation is analogous to that seen in molecular biomarker development, where the numerous identified candidate biomarkers for the diagnosis, prognosis, and prediction of responses to therapy do not reach clinical practice because they are not validated in independent datasets (79). Without similar rigorous validation in independent datasets, ML algorithms are likely to be similarly unsuccessful since cross-validation approaches do not account for training dataset bias (e.g., through patient selection or the use of a particular scanner) nor differences in other target populations. While one solution might be to increase the sample size to improve predictive accuracy (79), this does not substitute for applying the same algorithm to fully independent datasets derived from different institutions and geographies. Furthermore, models trained on larger sample sizes do not necessarily perform better (80). It would perhaps be more useful to tailor the sample size to a particular context. In this regard, Riley et al. (81) recently reported a sample size calculation framework for predictive models to help plan the application of ML and avoid underpowered datasets unlikely to yield a meaningful result.
Second, discrimination (i.e., the ability to distinguish a PCNSL from a GBM as measured by the AUC) is not the only metric of model performance, nor is it necessarily the most clinically useful (82). Calibration—that is, establishing the uncertainty of the risk estimates or classification—is also an important performance metric, particularly if intended for clinical use (83). This is most easily understood when ML models are developed to predict the risk of an event, such as relapse: a clinically useful model would not unduly over- or underestimate the risk that a patient will develop a relapse, which might prompt overtreatment (overestimated risk), or, conversely, undertreatment and false reassurance. No study calculated calibration statistics, which is not uncommon in ML; indeed, in one report, 79% of 71 studies using ML for clinical prediction failed to address the calibration problem (84). Given that a highly discriminatory but poorly calibrated model would have poor clinical utility, one solution might be to report probability scores for each outcome (e.g., PCNSL or GBM) along with the calibration statistics of whether the predicted probability scores match the actual probability scores. A metric of the probability that a lesion belongs to a certain class is likely to be much more clinically useful for guiding clinical decision-making based on weak and uncertain binary classifications.
While all diagnostic/segmentation models were developed based on a reference standard (radiologist assessment, either manual or semiautomated), the details of the reference standard were not always clearly reported, leading to large uncertainty in the potential for bias. Furthermore, the robustness of the reference standard, i.e., the stability of the diagnosis under varying conditions such as different readers, scanners, or technical protocols, were not reported. This has two main implications; first, a robust standard is essential for the development of an accurate model and therefore predictive performance and (ii) that any developed model may not be generalizable to other settings.
The lack of a standardized reference standard was particularly critical for segmentation tasks, where TMTV was often defined manually without further details of the methodology or using different thresholds. In addition to introducing intra- and interobserver variability and compromising reproducibility, a lack of standardized ground truth makes a meaningful comparison of different studies difficult. While ultimately automated segmentations will eliminate this variability, a methodology for the assessment of tumor burden will need to be standardized to limit error and intercenter variability for clinical development and application. It is currently unclear exactly which ground truth (e.g., SUV ≥41%, SUV ≥2.5, or SUV ≥ mean liver uptake) would be optimal. Further efforts are required to strictly define TMTV, standardize volume segmentation methods, and establish guidelines for the inclusion of tumor-bearing anatomical regions to optimize a completely automated method.
4.5.2 Methodology and reporting standards
Given the high standards of application, validation, evaluation, and comparison required to translate ML algorithms into clinical practice, research must also be conducted and reported to standards that are likely to facilitate this translation. Our quality assessments showed that no study was free of a high risk of bias, particularly due to the process of model development meaning that they were a case–control design; this could at least, in part, be mitigated through a prospective evaluation of independent datasets during validation. Many studies failed to provide adequate details of the reference standard, and few studies were applicable due to the lack of an independent validation step. No study calculated sample sizes a priori [for the purposes of model development, as outlined in (81)]. Other important methodological considerations not considered include assessing feature reliability (i.e., that the same features would be extracted under different conditions, such as scans from a different scanner or a different scanning protocol) and full reporting of performance metrics (i.e., a minimum of sensitivity, specificity, positive predictive value, negative predictive value, and the confusion matrix for predictive performance; concordance index and Dice coefficient for survival analysis and segmentation performance, respectively; R squared, mean squared error, root mean squared error, root mean squared logarithmic error, and mean absolute error for regression tasks). For an excellent review of the key considerations when reading and interpreting an ML paper in radiology, see the review by Kocak et al. (85).
Recognizing the importance of clear, transparent, and reproducible scientific communication of the application of ML to medical imaging, the Checklist for Artificial Intelligence in Medical Imaging (CLAIM, first published in 2020) (26) provides a framework to assure high-quality scientific reporting and addresses many of the limitations outlined above. None of the studies reported here—despite many being published within the previous 12 months—used or fully adhered to CLAIM criteria. In a recent systematic review of CLAIM compliance in 186 ML radiology studies, the median CLAIM compliance was 0.40 (IQR 0.33–0.49; calculated as the number of items satisfied over the number of items applicable), suggesting significant room for improvement in the design and reporting of ML studies in radiology; indeed, only 27% documented eligibility criteria and 49% assessed model performance on test data partitions (86). We recommend that all studies use this checklist from the outset.
4.5.3 Study populations
Overall, study populations were small (n<100 for most studies) and heterogeneous (e.g., all grades of lymphomas included). Only two studies were conducted in low- or middle-income countries [LMICs; Turkey and Tunisia (32, 68)]. Developing and validating models in LMICs would have the advantage of improving the generalizability (and therefore utility) of models across the widest range of clinical contexts; second, disparities between models developed in different geographical settings could provide valuable new information about the factors contributing to the variable biology of hematological malignancies. However, we accept that generalizing ML models to LMICs is likely to be challenging since the necessary research infrastructure is often lacking. Nevertheless, given the potential cost benefits of applying AI to resource-poor settings, we believe that generalizing to LMICs is highly desirable and would reduce inequity.
4.6 Implications for clinical practice
While the promising performance of the ML models presented in this scoping review provides hope for their future clinical application, clearly, there is still some way to go before they reach clinical “prime-time” for the reasons described above. Given the potential for model overfitting and the lack of independent validation, it is perhaps unsurprising that the headline AUC values for many of the published models are high, and a more realistic appraisal of their clinical benefit will come with time. It is also perhaps worth emphasizing that although comparing ML algorithms with human interpretation is desirable and indeed necessary, an imperfect or inaccurate model does not necessarily imply a lack of clinical value. Ultimately, these ML tools are likely to be best used not to replace radiological assessment but rather to facilitate clinical decision-making, especially for treatment decision-making based on the AI-driven radiological biomarkers of future outcomes or therapeutic responses.
This scoping review highlights that achieving the goal of applying ML to hematological cancer radiology—and ultimately improve clinical outcomes for our patients—will require improvements in study design and clear, transparent, and reproducible reporting. This will not only include reporting diagnostic accuracy or performance but also confirming that it is appropriately calibrated and presented to clinicians in such a way that it can be embedded into clinical practice, for instance, through the use of well-calibrated probability scores. These measures are needed to reduce patient and health system risk, establish trust, and facilitate their widespread adoption. These steps are also needed to facilitate other essential aspects of real-world application and uptake, not least the need to meet regulatory standards. When intended to diagnose, treat, or prevent disease, ML-based software is defined as a medical device under the Food, Drug, and Cosmetic Act (software as a medical device, SaMD). Regulators, including the Food and Drug Administration (FDA), have proposed frameworks for ensuring the safety and efficacy of ML-based SaMDs, which include establishing that the algorithm has a meaningful clinical impact (87). Addressing the research gaps identified in this review would be expected to not only streamline the regulatory process but also improve the quality and applicability of the algorithm in real-world clinical practice.
4.7 Study limitations
This study has some limitations. We only searched the PubMed database; thus, papers in other non-biomedical databases may have been missed. We only searched for articles written in English; hence, papers in other languages may not have been included. Although AUC values and Dice scores provide an indication of model discrimination, they are not directly comparable; thus, it is difficult to draw meaningful conclusions about their general applicability to an application of interest, such as discriminating GBM for PCNSL. We identified significant bias and poor or uncertain applicability in nearly every study, and several prognostic/predictive studies similarly failed to control for confounders, which may have also resulted in bias.
5 Conclusions
Several research gaps exist and require filling so that robust ML-based models can be used to assist the clinical decision-making of radiologists managing patients with hematological cancers. These include (i) adhering to standardized, high-quality reporting guidelines to reduce bias and improve comparability and generalizability; (ii) validating models in independent cohorts of sufficient size calculated a priori; (ii) developing a stricter definition of TMTV and standardizing volume segmentation methods for segmentation tasks; (iv) establishing comprehensive prospective studies that include different tumor grades, comparisons with radiologists, optimal imaging modalities, sequences, and planes; (v) comparing different methods on the same cohort to fully explore and report optimal model generalizability and performance; and (vi) include LMICs in multicentric study designs to further enhance generalizability and reduce inequity. While some of these research gaps are specific to hematological oncology radiology, others—not least establishing and adhering to ML reporting standards, independent validation, and method comparison—are applicable to the application of ML to any diagnostic or predictive task in oncology or hematology, such as predicting outcomes in patients with DLBCL (88). These identified research gaps should help clinicians and computational scientists plan their future research to provide ML-based models that can be applied clinically.
Data availability statement
The original contributions presented in the study are included in the article/Supplementary Material. Further inquiries can be directed to the corresponding author.
Author contributions
MK and SK had the idea for the article. All authors performed the literature search and wrote parts of the manuscript/assembled the data. SK and MK extracted the data and completed the tables. MK made critical revisions and proofread the manuscript. All authors contributed to the article and approved the submitted version.
Funding
MK received funding from the Grant Agency of the Czech Republic (grant19-382 07247S) and ERD Funds, project CePaVip OPVVV (No. 384 CZ.02.1.01/0.0/0.0/16_019/ 0000759). The funders had no role in the design, data collection and analysis, decision to publish, or preparation of the manuscript.
Conflict of interest
The authors declare that the research was conducted in the absence of any commercial or financial relationships that could be construed as a potential conflict of interest.
Publisher’s note
All claims expressed in this article are solely those of the authors and do not necessarily represent those of their affiliated organizations, or those of the publisher, the editors and the reviewers. Any product that may be evaluated in this article, or claim that may be made by its manufacturer, is not guaranteed or endorsed by the publisher.
Supplementary material
The Supplementary Material for this article can be found online at: https://www.frontiersin.org/articles/10.3389/fonc.2022.1080988/full#supplementary-material
References
1. Martin Noguerol T, Paulano-Godino F, Martin-Valdivia MT, Menias CO, Luna A. Strengths, weaknesses, opportunities, and threats analysis of artificial intelligence and machine learning applications in radiology. J Am Coll Radiol (2019) 16(9 Pt B):1239–47. doi: 10.1016/j.jacr.2019.05.047
2. Ye C, Fu T, Hao S, Zhang Y, Wang O, Jin B, et al. Prediction of incident hypertension within the next year: Prospective study using statewide electronic health records and machine learning. J Med Internet Res (2018) 20(1):e22. doi: 10.2196/jmir.9268
3. Hao S, Fu T, Wu Q, Jin B, Zhu C, Hu Z, et al. Estimating one-year risk of incident chronic kidney disease: Retrospective development and validation study using electronic medical record data from the state of Maine. JMIR Med Inform (2017) 5(3):e21. doi: 10.2196/medinform.7954
4. Erickson BJ, Korfiatis P, Akkus Z, Kline TL. Machine learning for medical imaging. Radiographics (2017) 37(2):505–15. doi: 10.1148/rg.2017160130
5. Walter W, Haferlach C, Nadarajah N, Schmidts I, Kuhn C, Kern W, et al. How artificial intelligence might disrupt diagnostics in hematology in the near future. Oncogene (2021) 40(25):4271–80. doi: 10.1038/s41388-021-01861-y
6. Tran KA, Kondrashova O, Bradley A, Williams ED, Pearson JV, Waddell N. Deep learning in cancer diagnosis, prognosis and treatment selection. Genome Med (2021) 13(1):152. doi: 10.1186/s13073-021-00968-x
7. Kourou K, Exarchos TP, Exarchos KP, Karamouzis MV, Fotiadis DI. Machine learning applications in cancer prognosis and prediction. Comput Struct Biotechnol J (2015) 13:8–17. doi: 10.1016/j.csbj.2014.11.005
8. Richter AN, Khoshgoftaar TM. A review of statistical and machine learning methods for modeling cancer risk using structured clinical data. Artif Intell Med (2018) 90:1–14. doi: 10.1016/j.artmed.2018.06.002
9. Kunimatsu A, Kunimatsu N, Kamiya K, Watadani T, Mori H, Abe O. Comparison between glioblastoma and primary central nervous system lymphoma using MR image-based texture analysis. Magn Reson Med Sci (2018) 17(1):50–7. doi: 10.2463/mrms.mp.2017-0044
10. Malikova H, Koubska E, Weichet J, Klener J, Rulseh A, Liscak R, et al. Can morphological MRI differentiate between primary central nervous system lymphoma and glioblastoma? Cancer Imaging (2016) 16(1):40. doi: 10.1186/s40644-016-0098-9
11. Dandois V, De Coene B, Laloux P, Godfraind C, Cosnard G. Increased relative cerebral blood volume (rCBV) in brain lymphoma. J Neuroradiol (2011) 38(3):191–3. doi: 10.1016/j.neurad.2010.06.004
12. Gametchu B. Glucocorticoid receptor-like antigen in lymphoma cell membranes: correlation to cell lysis. Science (1987) 236(4800):456–61. doi: 10.1126/science.3563523
13. Lukas RV, Wainwright DA, Ladomersky E, Sachdev S, Sonabend AM, Stupp R. Newly diagnosed glioblastoma: A review on clinical management. Oncol (Williston Park) (2019) 33(3):91–100.
14. Kirienko M, Ninatti G, Cozzi L, Voulaz E, Gennaro N, Barajon I, et al. Computed tomography (CT)-derived radiomic features differentiate prevascular mediastinum masses as thymic neoplasms versus lymphomas. Radiol Med (2020) 125(10):951–60. doi: 10.1007/s11547-020-01188-w
15. Ou X, Zhang J, Wang J, Pang F, Wang Y, Wei X, et al. Radiomics based on (18) f-FDG PET/CT could differentiate breast carcinoma from breast lymphoma using machine-learning approach: A preliminary study. Cancer Med (2020) 9(2):496–506. doi: 10.1002/cam4.2711
16. Mesguich C, Hindie E, de Senneville BD, Tlili G, Pinaquy JB, Marit G, et al. Improved 18-FDG PET/CT diagnosis of multiple myeloma diffuse disease by radiomics analysis. Nucl Med Commun (2021) 42(10):1135–43. doi: 10.1097/MNM.0000000000001437
17. Li H, Xu C, Xin B, Zheng C, Zhao Y, Hao K, et al. (18)F-FDG PET/CT radiomic analysis with machine learning for identifying bone marrow involvement in the patients with suspected relapsed acute leukemia. Theranostics (2019) 9(16):4730–9. doi: 10.7150/thno.33841
18. Sibille L, Seifert R, Avramovic N, Vehren T, Spottiswoode B, Zuehlsdorff S, et al. (18)F-FDG PET/CT uptake classification in lymphoma and lung cancer by using deep convolutional neural networks. Radiology (2020) 294(2):445–52. doi: 10.1148/radiol.2019191114
19. Kanoun S, Rossi C, Berriolo-Riedinger A, Dygai-Cochet I, Cochet A, Humbert O, et al. Baseline metabolic tumour volume is an independent prognostic factor in Hodgkin lymphoma. Eur J Nucl Med Mol Imaging (2014) 41(9):1735–43. doi: 10.1007/s00259-014-2783-x
20. Guo B, Tan X, Ke Q, Cen H. Prognostic value of baseline metabolic tumor volume and total lesion glycolysis in patients with lymphoma: A meta-analysis. PLoS One (2019) 14(1):e0210224. doi: 10.1371/journal.pone.0210224
21. Crump M, Neelapu SS, Farooq U, Van Den Neste E, Kuruvilla J, Westin J, et al. Outcomes in refractory diffuse large b-cell lymphoma: results from the international SCHOLAR-1 study. Blood (2017) 130(16):1800–8. doi: 10.1182/blood-2017-03-769620
22. Michor F, Polyak K. The origins and implications of intratumor heterogeneity. Cancer Prev Res (Phila) (2010) 3(11):1361–4. doi: 10.1158/1940-6207.CAPR-10-0234
23. Tricco AC, Lillie E, Zarin W, O'Brien KK, Colquhoun H, Levac D, et al. PRISMA extension for scoping reviews (PRISMA-ScR): Checklist and explanation. Ann Intern Med (2018) 169(7):467–73. doi: 10.7326/M18-0850
24. Munn Z, Peters MDJ, Stern C, Tufanaru C, McArthur A, Aromataris E. Systematic review or scoping review? guidance for authors when choosing between a systematic or scoping review approach. BMC Med Res Methodol (2018) 18(1):143. doi: 10.1186/s12874-018-0611-x
25. Peters MD. In no uncertain terms: the importance of a defined objective in scoping reviews. JBI Database System Rev Implement Rep (2016) 14(2):1–4. doi: 10.11124/jbisrir-2016-2838
26. Mongan J, Moy L, Kahn CE Jr. Checklist for artificial intelligence in medical imaging (CLAIM): A guide for authors and reviewers. Radiol Artif Intell (2020) 2(2):e200029. doi: 10.1148/ryai.2020200029
27. Whiting PF, Rutjes AW, Westwood ME, Mallett S, Deeks JJ, Reitsma JB, et al. QUADAS-2: a revised tool for the quality assessment of diagnostic accuracy studies. Ann Intern Med (2011) 155(8):529–36. doi: 10.7326/0003-4819-155-8-201110180-00009
28. Stang A. Critical evaluation of the Newcastle-Ottawa scale for the assessment of the quality of nonrandomized studies in meta-analyses. Eur J Epidemiol (2010) 25(9):603–5. doi: 10.1007/s10654-010-9491-z
29. Alcaide-Leon P, Dufort P, Geraldo AF, Alshafai L, Maralani PJ, Spears J, et al. Differentiation of enhancing glioma and primary central nervous system lymphoma by texture-based machine learning. AJNR Am J Neuroradiol (2017) 38(6):1145–50. doi: 10.3174/ajnr.A5173
30. Chen C, Zheng A, Ou X, Wang J, Ma X. Comparison of radiomics-based machine-learning classifiers in diagnosis of glioblastoma from primary central nervous system lymphoma. Front Oncol (2020) 10:1151. doi: 10.3389/fonc.2020.01151
31. Chen Y, Li Z, Wu G, Yu J, Wang Y, Lv X, et al. Primary central nervous system lymphoma and glioblastoma differentiation based on conventional magnetic resonance imaging by high-throughput SIFT features. Int J Neurosci (2018) 128(7):608–18. doi: 10.1080/00207454.2017.1408613
32. Ferjaoui R, Cherni MA, Boujnah S, Kraiem NEH, Kraiem T. Machine learning for evolutive lymphoma and residual masses recognition in whole body diffusion weighted magnetic resonance images. Comput Methods Programs BioMed (2021) 209:106320. doi: 10.1016/j.cmpb.2021.106320
33. Hou Y, Xie X, Chen J, Lv P, Jiang S, He X, et al. Bag-of-features-based radiomics for differentiation of ocular adnexal lymphoma and idiopathic orbital inflammation from contrast-enhanced MRI. Eur Radiol (2021) 31(1):24–33. doi: 10.1007/s00330-020-07110-2
34. Kang D, Park JE, Kim YH, Kim JH, Oh JY, Kim J, et al. Diffusion radiomics as a diagnostic model for atypical manifestation of primary central nervous system lymphoma: development and multicenter external validation. Neuro Oncol (2018) 20(9):1251–61. doi: 10.1093/neuonc/noy021
35. Kim Y, Cho HH, Kim ST, Park H, Nam D, Kong DS. Radiomics features to distinguish glioblastoma from primary central nervous system lymphoma on multi-parametric MRI. Neuroradiology (2018) 60(12):1297–305. doi: 10.1007/s00234-018-2091-4
36. Kunimatsu A, Kunimatsu N, Yasaka K, Akai H, Kamiya K, Watadani T, et al. Machine learning-based texture analysis of contrast-enhanced MR imaging to differentiate between glioblastoma and primary central nervous system lymphoma. Magn Reson Med Sci (2019) 18(1):44–52. doi: 10.2463/mrms.mp.2017-0178
37. Liu Y-h, Muftah M, Das T, Bai L, Robson K, Auer D. Classification of MR tumor images based on gabor wavelet analysis. J Med Biol Eng (2012) 32(1):22–8. doi: 10.5405/jmbe.813
38. Martinez-Martinez F, Kybic J, Lambert L, Meckova Z. Fully automated classification of bone marrow infiltration in low-dose CT of patients with multiple myeloma based on probabilistic density model and supervised learning. Comput Biol Med (2016) 71:57–66. doi: 10.1016/j.compbiomed.2016.02.001
39. Mayerhoefer ME, Riedl CC, Kumar A, Dogan A, Gibbs P, Weber M, et al. [18F]FDG-PET/CT radiomics for prediction of bone marrow involvement in mantle cell lymphoma: A retrospective study in 97 patients. Cancers (Basel) (2020) 12(5):1138. doi: 10.3390/cancers12051138
40. McAvoy M, Prieto PC, Kaczmarzyk JR, Fernandez IS, McNulty J, Smith T, et al. Classification of glioblastoma versus primary central nervous system lymphoma using convolutional neural networks. Sci Rep (2021) 11(1):15219. doi: 10.1038/s41598-021-94733-0
41. Nakagawa M, Nakaura T, Namimoto T, Kitajima M, Uetani H, Tateishi M, et al. Machine learning based on multi-parametric magnetic resonance imaging to differentiate glioblastoma multiforme from primary cerebral nervous system lymphoma. Eur J Radiol (2018) 108:147–54. doi: 10.1016/j.ejrad.2018.09.017
42. Priya S, Ward C, Locke T, Soni N, Maheshwarappa RP, Monga V, et al. Glioblastoma and primary central nervous system lymphoma: differentiation using MRI derived first-order texture analysis - a machine learning study. Neuroradiol J (2021) 34(4):320–8. doi: 10.1177/1971400921998979
43. Seidler M, Forghani B, Reinhold C, Perez-Lara A, Romero-Sanchez G, Muthukrishnan N, et al. Dual-energy CT texture analysis with machine learning for the evaluation and characterization of cervical lymphadenopathy. Comput Struct Biotechnol J (2019) 17:1009–15. doi: 10.1016/j.csbj.2019.07.004
44. Suh HB, Choi YS, Bae S, Ahn SS, Chang JH, Kang SG, et al. Primary central nervous system lymphoma and atypical glioblastoma: Differentiation using radiomics approach. Eur Radiol (2018) 28(9):3832–9. doi: 10.1007/s00330-018-5368-4
45. Swinburne NC, Schefflein J, Sakai Y, Oermann EK, Titano JJ, Chen I, et al. Machine learning for semi-automated classification of glioblastoma, brain metastasis and central nervous system lymphoma using magnetic resonance advanced imaging. Ann Transl Med (2019) 7(11):232. doi: 10.21037/atm.2018.08.05
46. Tomita H, Yamashiro T, Iida G, Tsubakimoto M, Mimura H, Murayama S. Unenhanced CT texture analysis with machine learning for differentiating between nasopharyngeal cancer and nasopharyngeal malignant lymphoma. Nagoya J Med Sci (2021) 83(1):135–49. doi: 10.18999/nagjms.83.1.135
47. Wang J, Shi X, Yao X, Ren J, Du X. Deep learning-based CT imaging in diagnosing myeloma and its prognosis evaluation. J Healthc Eng (2021) 2021:5436793. doi: 10.1155/2021/5436793
48. Wang X, Dai S, Wang Q, Chai X, Xian J. Investigation of MRI-based radiomics model in differentiation between sinonasal primary lymphomas and squamous cell carcinomas. Jpn J Radiol (2021) 39(8):755–62. doi: 10.1007/s11604-021-01116-6
49. Xia W, Hu B, Li H, Shi W, Tang Y, Yu Y, et al. Deep learning for automatic differential diagnosis of primary central nervous system lymphoma and glioblastoma: Multi-parametric magnetic resonance imaging based convolutional neural network model. J Magn Reson Imaging (2021) 54(3):880–7. doi: 10.1002/jmri.27592
50. Xiao DD, Yan PF, Wang YX, Osman MS, Zhao HY. Glioblastoma and primary central nervous system lymphoma: Preoperative differentiation by using MRI-based 3D texture analysis. Clin Neurol Neurosurg (2018) 173:84–90. doi: 10.1016/j.clineuro.2018.08.004
51. Xiong X, Wang J, Hu S, Dai Y, Zhang Y, Hu C. Differentiating between multiple myeloma and metastasis subtypes of lumbar vertebra lesions using machine learning-based radiomics. Front Oncol (2021) 11:601699. doi: 10.3389/fonc.2021.601699
52. Xu L, Tetteh G, Lipkova J, Zhao Y, Li H, Christ P, et al. Automated whole-body bone lesion detection for multiple myeloma on (68)Ga-pentixafor PET/CT imaging using deep learning methods. Contrast Media Mol Imaging (2018) 2018:2391925. doi: 10.1155/2018/2391925
53. Yamasaki T, Chen T, Hirai T, Murakami R. Classification of cerebral lymphomas and glioblastomas featuring luminance distribution analysis. Comput Math Methods Med (2013) 2013:619658. doi: 10.1155/2013/619658
54. Yang Z, Feng P, Wen T, Wan M, Hong X. Differentiation of glioblastoma and lymphoma using feature extraction and support vector machine. CNS Neurol Disord Drug Targets (2017) 16(2):160–8. doi: 10.2174/1871527315666161018122909
55. Yun J, Park JE, Lee H, Ham S, Kim N, Kim HS. Radiomic features and multilayer perceptron network classifier: a robust MRI classification strategy for distinguishing glioblastoma from primary central nervous system lymphoma. Sci Rep (2019) 9(1):5746. doi: 10.1038/s41598-019-42276-w
56. Zhang Y, Liang K, He J, Ma H, Chen H, Zheng F, et al. Deep learning with data enhancement for the differentiation of solitary and multiple cerebral glioblastoma, lymphoma, and tumefactive demyelinating lesion. Front Oncol (2021) 11:665891. doi: 10.3389/fonc.2021.665891
57. Blanc-Durand P, Jegou S, Kanoun S, Berriolo-Riedinger A, Bodet-Milin C, Kraeber-Bodere F, et al. Fully automatic segmentation of diffuse large b cell lymphoma lesions on 3D FDG-PET/CT for total metabolic tumour volume prediction using a convolutional neural network. Eur J Nucl Med Mol Imaging (2021) 48(5):1362–70. doi: 10.1007/s00259-020-05080-7
58. Capobianco N, Meignan M, Cottereau AS, Vercellino L, Sibille L, Spottiswoode B, et al. Deep-learning (18)F-FDG uptake classification enables total metabolic tumor volume estimation in diffuse Large b-cell lymphoma. J Nucl Med (2021) 62(1):30–6. doi: 10.2967/jnumed.120.242412
59. Grossiord E, Talbot H, Passat N, Meignan M, Najman L eds. Automated 3D lymphoma lesion segmentation from PET/CT characteristics. In: 2017 IEEE 14th international symposium on biomedical imaging (ISBI 2017). (Melbourne, VIC, Australia: IEEE).
60. Hu X, Guo R, Chen J, Li H, Waldmannstetter D, Zhao Y, et al. Coarse-to-Fine adversarial networks and zone-based uncertainty analysis for NK/T-cell lymphoma segmentation in CT/PET images. IEEE J BioMed Health Inform (2020) 24(9):2599–608. doi: 10.1109/JBHI.2020.2972694
61. Jemaa S, Fredrickson J, Carano RAD, Nielsen T, de Crespigny A, Bengtsson T. Tumor segmentation and feature extraction from whole-body FDG-PET/CT using cascaded 2D and 3D convolutional neural networks. J Digit Imaging (2020) 33(4):888–94. doi: 10.1007/s10278-020-00341-1
62. Pennig L, Hoyer UCI, Goertz L, Shahzad R, Persigehl T, Thiele F, et al. Primary central nervous system lymphoma: Clinical evaluation of automated segmentation on multiparametric MRI using deep learning. J Magn Reson Imaging (2021) 53(1):259–68. doi: 10.1002/jmri.27288
63. Sadik M, Lind E, Polymeri E, Enqvist O, Ulen J, Tragardh E. Automated quantification of reference levels in liver and mediastinal blood pool for the deauville therapy response classification using FDG-PET/CT in Hodgkin and non-Hodgkin lymphomas. Clin Physiol Funct Imaging (2019) 39(1):78–84. doi: 10.1111/cpf.12546
64. Weisman AJ, Kieler MW, Perlman S, Hutchings M, Jeraj R, Kostakoglu L, et al. Comparison of 11 automated PET segmentation methods in lymphoma. Phys Med Biol (2020) 65(23):235019. doi: 10.1088/1361-6560/abb6bd
65. Weisman AJ, Kim J, Lee I, McCarten KM, Kessel S, Schwartz CL, et al. Automated quantification of baseline imaging PET metrics on FDG PET/CT images of pediatric Hodgkin lymphoma patients. EJNMMI Phys (2020) 7(1):76. doi: 10.1186/s40658-020-00346-3
66. Yu Y, Decazes P, Lapuyade-Lahorgue J, Gardin I, Vera P, Ruan S. Semi-automatic lymphoma detection and segmentation using fully conditional random fields. Comput Med Imaging Graph (2018) 70:1–7. doi: 10.1016/j.compmedimag.2018.09.001
67. Yuan C, Zhang M, Huang X, Xie W, Lin X, Zhao W, et al. Diffuse large b-cell lymphoma segmentation in PET-CT images via hybrid learning for feature fusion. Med Phys (2021) 48(7):3665–78. doi: 10.1002/mp.14847
68. Coskun N, Okudan B, Uncu D, Kitapci MT. Baseline 18F-FDG PET textural features as predictors of response to chemotherapy in diffuse large b-cell lymphoma. Nucl Med Commun (2021) 42(11):1227–32. doi: 10.1097/MNM.0000000000001447
69. Guo R, Hu X, Song H, Xu P, Xu H, Rominger A, et al. Weakly supervised deep learning for determining the prognostic value of (18)F-FDG PET/CT in extranodal natural killer/T cell lymphoma, nasal type. Eur J Nucl Med Mol Imaging (2021) 48(10):3151–61. doi: 10.1007/s00259-021-05232-3
70. Jamet B, Morvan L, Nanni C, Michaud AV, Bailly C, Chauvie S, et al. Random survival forest to predict transplant-eligible newly diagnosed multiple myeloma outcome including FDG-PET radiomics: a combined analysis of two independent prospective European trials. Eur J Nucl Med Mol Imaging (2021) 48(4):1005–15. doi: 10.1007/s00259-020-05049-6
71. Jullien M, Tessoulin B, Ghesquieres H, Oberic L, Morschhauser F, Tilly H, et al. Deep-learning assessed muscular hypodensity independently predicts mortality in DLBCL patients younger than 60 years. Cancers (Basel) (2021) 13(18):4503. doi: 10.3390/cancers13184503
72. Liu J, Zeng P, Guo W, Wang C, Geng Y, Lang N, et al. Prediction of high-risk cytogenetic status in multiple myeloma based on magnetic resonance imaging: Utility of radiomics and comparison of machine learning methods. J Magn Reson Imaging (2021) 54(4):1303–11. doi: 10.1002/jmri.27637
73. Mayerhoefer ME, Riedl CC, Kumar A, Gibbs P, Weber M, Tal I, et al. Radiomic features of glucose metabolism enable prediction of outcome in mantle cell lymphoma. Eur J Nucl Med Mol Imaging (2019) 46(13):2760–9. doi: 10.1007/s00259-019-04420-6
74. Milgrom SA, Elhalawani H, Lee J, Wang Q, Mohamed ASR, Dabaja BS, et al. A PET radiomics model to predict refractory mediastinal Hodgkin lymphoma. Sci Rep (2019) 9(1):1322. doi: 10.1038/s41598-018-37197-z
75. Morvan L, Carlier T, Jamet B, Bailly C, Bodet-Milin C, Moreau P, et al. Leveraging RSF and PET images for prognosis of multiple myeloma at diagnosis. Int J Comput Assist Radiol Surg (2020) 15(1):129–39. doi: 10.1007/s11548-019-02015-y
76. Santiago R, Ortiz Jimenez J, Forghani R, Muthukrishnan N, Del Corpo O, Karthigesu S, et al. CT-based radiomics model with machine learning for predicting primary treatment failure in diffuse large b-cell lymphoma. Transl Oncol (2021) 14(10):101188. doi: 10.1016/j.tranon.2021.101188
77. Mayerhoefer ME, Umutlu L, Schoder H. Functional imaging using radiomic features in assessment of lymphoma. Methods (2021) 188:105–11. doi: 10.1016/j.ymeth.2020.06.020
78. Lartizien C, Rogez M, Niaf E, Ricard F. Computer-aided staging of lymphoma patients with FDG PET/CT imaging based on textural information. IEEE J BioMed Health Inform (2014) 18(3):946–55. doi: 10.1109/JBHI.2013.2283658
79. Hernandez B, Parnell A, Pennington SR. Why have so few proteomic biomarkers "survived" validation? (Sample size and independent validation considerations). Proteomics (2014) 14(13-14):1587–92. doi: 10.1002/pmic.201300377
80. van der Ploeg T, Austin PC, Steyerberg EW. Modern modelling techniques are data hungry: a simulation study for predicting dichotomous endpoints. BMC Med Res Methodol (2014) 14:137. doi: 10.1186/1471-2288-14-137
81. Riley RD, Ensor J, Snell KIE, Harrell FE Jr., Martin GP, Reitsma JB, et al. Calculating the sample size required for developing a clinical prediction model. BMJ (2020) 368:m441. doi: 10.1136/bmj.m441
82. Steyerberg EW, Vickers AJ, Cook NR, Gerds T, Gonen M, Obuchowski N, et al. Assessing the performance of prediction models: a framework for traditional and novel measures. Epidemiology (2010) 21(1):128–38. doi: 10.1097/EDE.0b013e3181c30fb2
83. Van Calster B, McLernon DJ, van Smeden M, Wynants L, Steyerberg EW, Topic Group 'Evaluating diagnostic t, et al. Calibration: the Achilles heel of predictive analytics. BMC Med (2019) 17(1):230. doi: 10.1186/s12916-019-1466-7
84. Christodoulou E, Ma J, Collins GS, Steyerberg EW, Verbakel JY, Van Calster B. A systematic review shows no performance benefit of machine learning over logistic regression for clinical prediction models. J Clin Epidemiol (2019) 110:12–22. doi: 10.1016/j.jclinepi.2019.02.004
85. Kocak B, Kus EA, Kilickesmez O. How to read and review papers on machine learning and artificial intelligence in radiology: a survival guide to key methodological concepts. Eur Radiol (2021) 31(4):1819–30. doi: 10.1007/s00330-020-07324-4
86. O'Shea RJ, Sharkey AR, Cook GJR, Goh V. Systematic review of research design and reporting of imaging studies applying convolutional neural networks for radiological cancer diagnosis. Eur Radiol (2021) 31(10):7969–83. doi: 10.1007/s00330-021-07881-2
87. Larson DB, Harvey H, Rubin DL, Irani N, Tse JR, Langlotz CP. Regulatory frameworks for development and evaluation of artificial intelligence-based diagnostic imaging algorithms: Summary and recommendations. J Am Coll Radiol (2021) 18(3 Pt A):413–24. doi: 10.1016/j.jacr.2020.09.060
Keywords: machine learning, hematological malignancy, scoping review, artificial intelligence, radiology
Citation: Kotsyfakis S, Iliaki-Giannakoudaki E, Anagnostopoulos A, Papadokostaki E, Giannakoudakis K, Goumenakis M and Kotsyfakis M (2022) The application of machine learning to imaging in hematological oncology: A scoping review. Front. Oncol. 12:1080988. doi: 10.3389/fonc.2022.1080988
Received: 26 October 2022; Accepted: 05 December 2022;
Published: 19 December 2022.
Edited by:
Min Tang, Jiangsu University, ChinaReviewed by:
Youwen Zhang, University of South Carolina, United StatesQianqian Song, Wake Forest University, United States
Sarbesh Pandeya, Harvard Medical School, United States
Copyright © 2022 Kotsyfakis, Iliaki-Giannakoudaki, Anagnostopoulos, Papadokostaki, Giannakoudakis, Goumenakis and Kotsyfakis. This is an open-access article distributed under the terms of the Creative Commons Attribution License (CC BY). The use, distribution or reproduction in other forums is permitted, provided the original author(s) and the copyright owner(s) are credited and that the original publication in this journal is cited, in accordance with accepted academic practice. No use, distribution or reproduction is permitted which does not comply with these terms.
*Correspondence: Michail Kotsyfakis, bWljaF9rb3RzeWZha2lzQHlhaG9vLmNvbQ==