In the original article, there was an error in Table 2 as published. The percentages for Table 2 “Due for Pap. Test (never or 3+ years ago)” for Los Angeles and Sacramento were incorrect. The count and percentage for San Francisco were incorrect. The corrected Table 2 and its caption appear below.
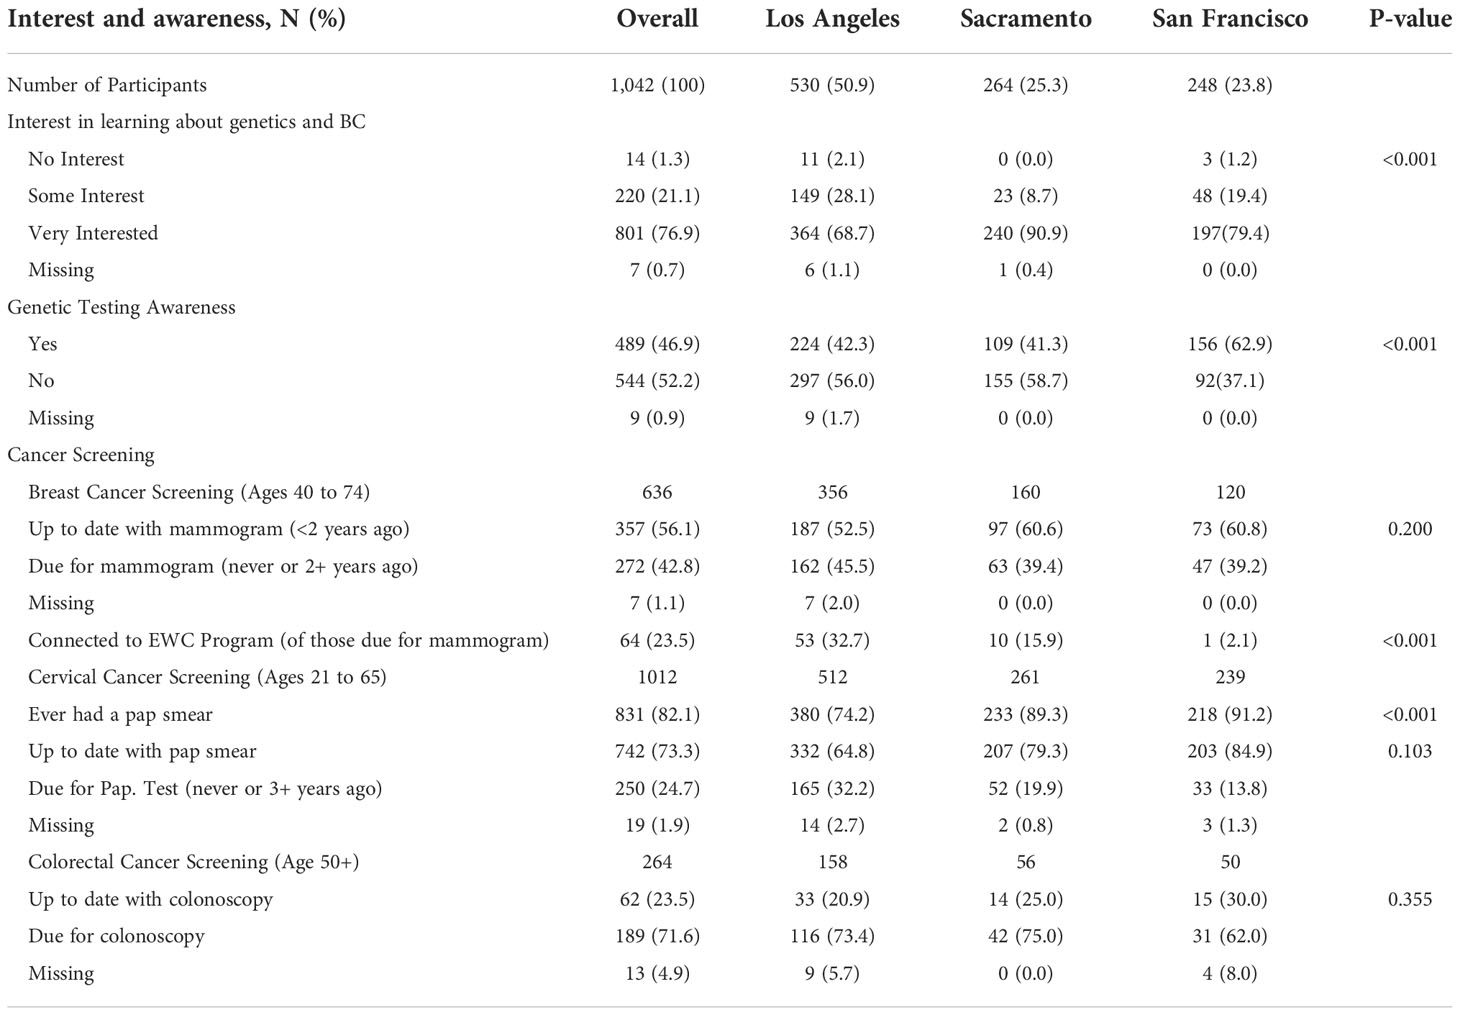
Table 2
| Interest and awareness, N (%) | Overall | Los Angeles | Sacramento | San Francisco | P-value |
|---|---|---|---|---|---|
| Number of Participants | 1,042 (100) | 530 (50.9) | 264 (25.3) | 248 (23.8) | |
| Interest in learning about genetics and BC | |||||
| No Interest | 14 (1.3) | 11 (2.1) | 0 (0.0) | 3 (1.2) | <0.001 |
| Some Interest | 220 (21.1) | 149 (28.1) | 23 (8.7) | 48 (19.4) | |
| Very Interested | 801 (76.9) | 364 (68.7) | 240 (90.9) | 197(79.4) | |
| Missing | 7 (0.7) | 6 (1.1) | 1 (0.4) | 0 (0.0) | |
| Genetic Testing Awareness | |||||
| Yes | 489 (46.9) | 224 (42.3) | 109 (41.3) | 156 (62.9) | <0.001 |
| No | 544 (52.2) | 297 (56.0) | 155 (58.7) | 92(37.1) | |
| Missing | 9 (0.9) | 9 (1.7) | 0 (0.0) | 0 (0.0) | |
| Cancer Screening | |||||
| Breast Cancer Screening (Ages 40 to 74) | 636 | 356 | 160 | 120 | |
| Up to date with mammogram (<2 years ago) | 357 (56.1) | 187 (52.5) | 97 (60.6) | 73 (60.8) | 0.200 |
| Due for mammogram (never or 2+ years ago) | 272 (42.8) | 162 (45.5) | 63 (39.4) | 47 (39.2) | |
| Missing | 7 (1.1) | 7 (2.0) | 0 (0.0) | 0 (0.0) | |
| Connected to EWC Program (of those due for mammogram) | 64 (23.5) | 53 (32.7) | 10 (15.9) | 1 (2.1) | <0.001 |
| Cervical Cancer Screening (Ages 21 to 65) | 1012 | 512 | 261 | 239 | |
| Ever had a pap smear | 831 (82.1) | 380 (74.2) | 233 (89.3) | 218 (91.2) | <0.001 |
| Up to date with pap smear | 742 (73.3) | 332 (64.8) | 207 (79.3) | 203 (84.9) | 0.103 |
| Due for Pap. Test (never or 3+ years ago) | 250 (24.7) | 165 (32.2) | 52 (19.9) | 33 (13.8) | |
| Missing | 19 (1.9) | 14 (2.7) | 2 (0.8) | 3 (1.3) | |
| Colorectal Cancer Screening (Age 50+) | 264 | 158 | 56 | 50 | |
| Up to date with colonoscopy | 62 (23.5) | 33 (20.9) | 14 (25.0) | 15 (30.0) | 0.355 |
| Due for colonoscopy | 189 (71.6) | 116 (73.4) | 42 (75.0) | 31 (62.0) | |
| Missing | 13 (4.9) | 9 (5.7) | 0 (0.0) | 4 (8.0) | |
Screening behavior and interest in breast cancer genetics among ‘Tu Historia Cuenta’ study participants (N=1,042) overall and by recruitment area.
Furthermore, there was also an error in Table 4 as published. The measurement of association should be RRR. An asterisk has also been added to the bottom of the table. The corrected Table 4 and its caption appear below.
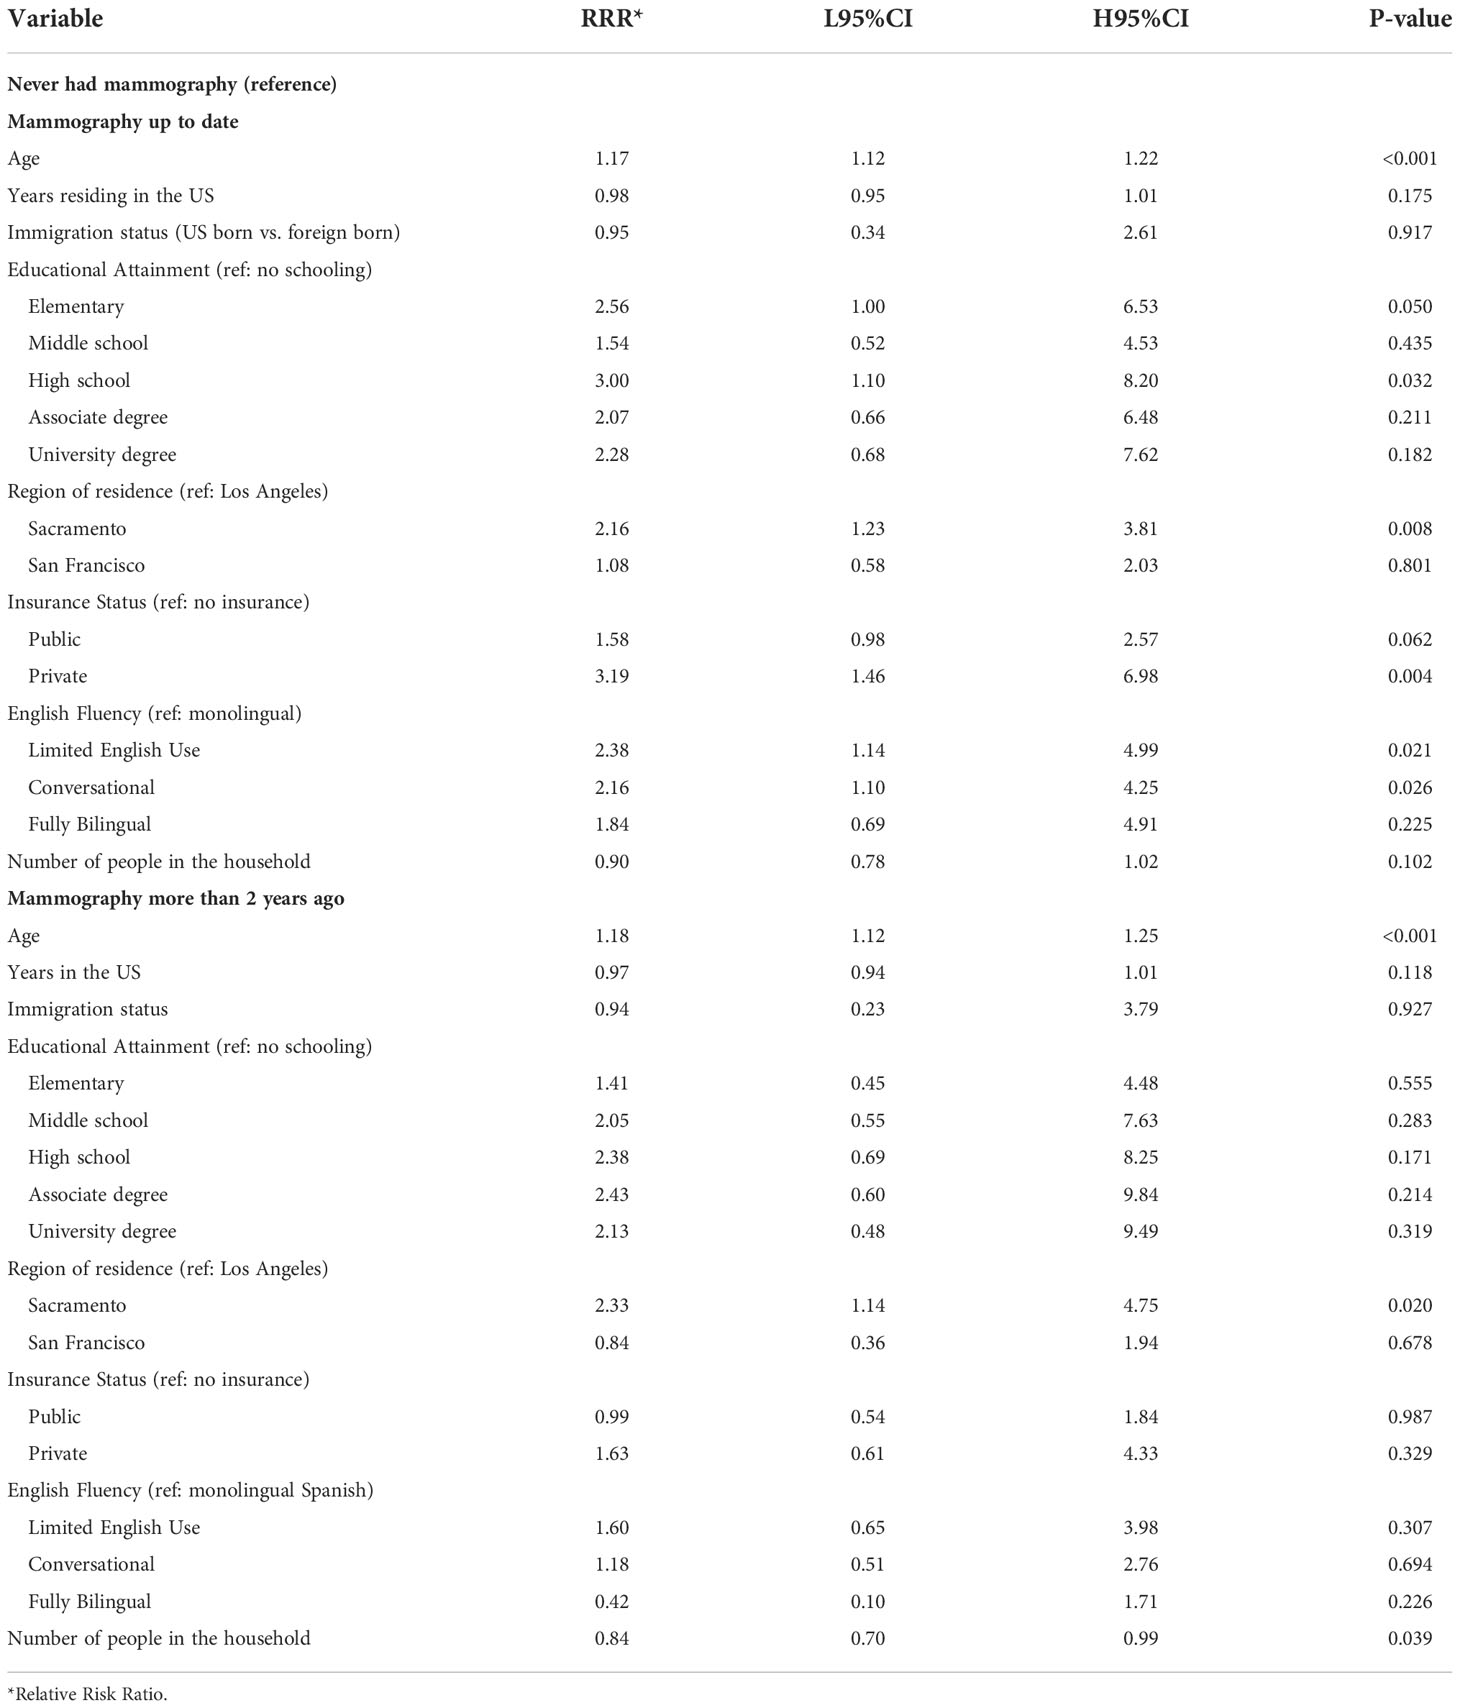
Table 4
| Variable | RRR* | L95%CI | H95%CI | P-value |
|---|---|---|---|---|
| Never had mammography (reference) | ||||
| Mammography up to date | ||||
| Age | 1.17 | 1.12 | 1.22 | <0.001 |
| Years residing in the US | 0.98 | 0.95 | 1.01 | 0.175 |
| Immigration status (US born vs. foreign born) | 0.95 | 0.34 | 2.61 | 0.917 |
| Educational Attainment (ref: no schooling) | ||||
| Elementary | 2.56 | 1.00 | 6.53 | 0.050 |
| Middle school | 1.54 | 0.52 | 4.53 | 0.435 |
| High school | 3.00 | 1.10 | 8.20 | 0.032 |
| Associate degree | 2.07 | 0.66 | 6.48 | 0.211 |
| University degree | 2.28 | 0.68 | 7.62 | 0.182 |
| Region of residence (ref: Los Angeles) | ||||
| Sacramento | 2.16 | 1.23 | 3.81 | 0.008 |
| San Francisco | 1.08 | 0.58 | 2.03 | 0.801 |
| Insurance Status (ref: no insurance) | ||||
| Public | 1.58 | 0.98 | 2.57 | 0.062 |
| Private | 3.19 | 1.46 | 6.98 | 0.004 |
| English Fluency (ref: monolingual) | ||||
| Limited English Use | 2.38 | 1.14 | 4.99 | 0.021 |
| Conversational | 2.16 | 1.10 | 4.25 | 0.026 |
| Fully Bilingual | 1.84 | 0.69 | 4.91 | 0.225 |
| Number of people in the household | 0.90 | 0.78 | 1.02 | 0.102 |
| Mammography more than 2 years ago | ||||
| Age | 1.18 | 1.12 | 1.25 | <0.001 |
| Years in the US | 0.97 | 0.94 | 1.01 | 0.118 |
| Immigration status | 0.94 | 0.23 | 3.79 | 0.927 |
| Educational Attainment (ref: no schooling) | ||||
| Elementary | 1.41 | 0.45 | 4.48 | 0.555 |
| Middle school | 2.05 | 0.55 | 7.63 | 0.283 |
| High school | 2.38 | 0.69 | 8.25 | 0.171 |
| Associate degree | 2.43 | 0.60 | 9.84 | 0.214 |
| University degree | 2.13 | 0.48 | 9.49 | 0.319 |
| Region of residence (ref: Los Angeles) | ||||
| Sacramento | 2.33 | 1.14 | 4.75 | 0.020 |
| San Francisco | 0.84 | 0.36 | 1.94 | 0.678 |
| Insurance Status (ref: no insurance) | ||||
| Public | 0.99 | 0.54 | 1.84 | 0.987 |
| Private | 1.63 | 0.61 | 4.33 | 0.329 |
| English Fluency (ref: monolingual Spanish) | ||||
| Limited English Use | 1.60 | 0.65 | 3.98 | 0.307 |
| Conversational | 1.18 | 0.51 | 2.76 | 0.694 |
| Fully Bilingual | 0.42 | 0.10 | 1.71 | 0.226 |
| Number of people in the household | 0.84 | 0.70 | 0.99 | 0.039 |
Multivariate multinomial logistic regression model testing the association between breast cancer screening behavior and demographic factors among ‘Tu Historia Cuenta’ participants ages 40 to 74 (N=587, 42 excluded from 629 due to missing data).
*Relative Risk Ratio.
In addition, there were also errors in Table 5 as published. The sublabels under English Fluency have been updated to match the ones previously used. Furthermore, Insurance status, English fluency and Number of people in household for those with cervical screening 3 years ago were cut off from the table and have been added back in. The corrected Table 5 and its caption appear below.
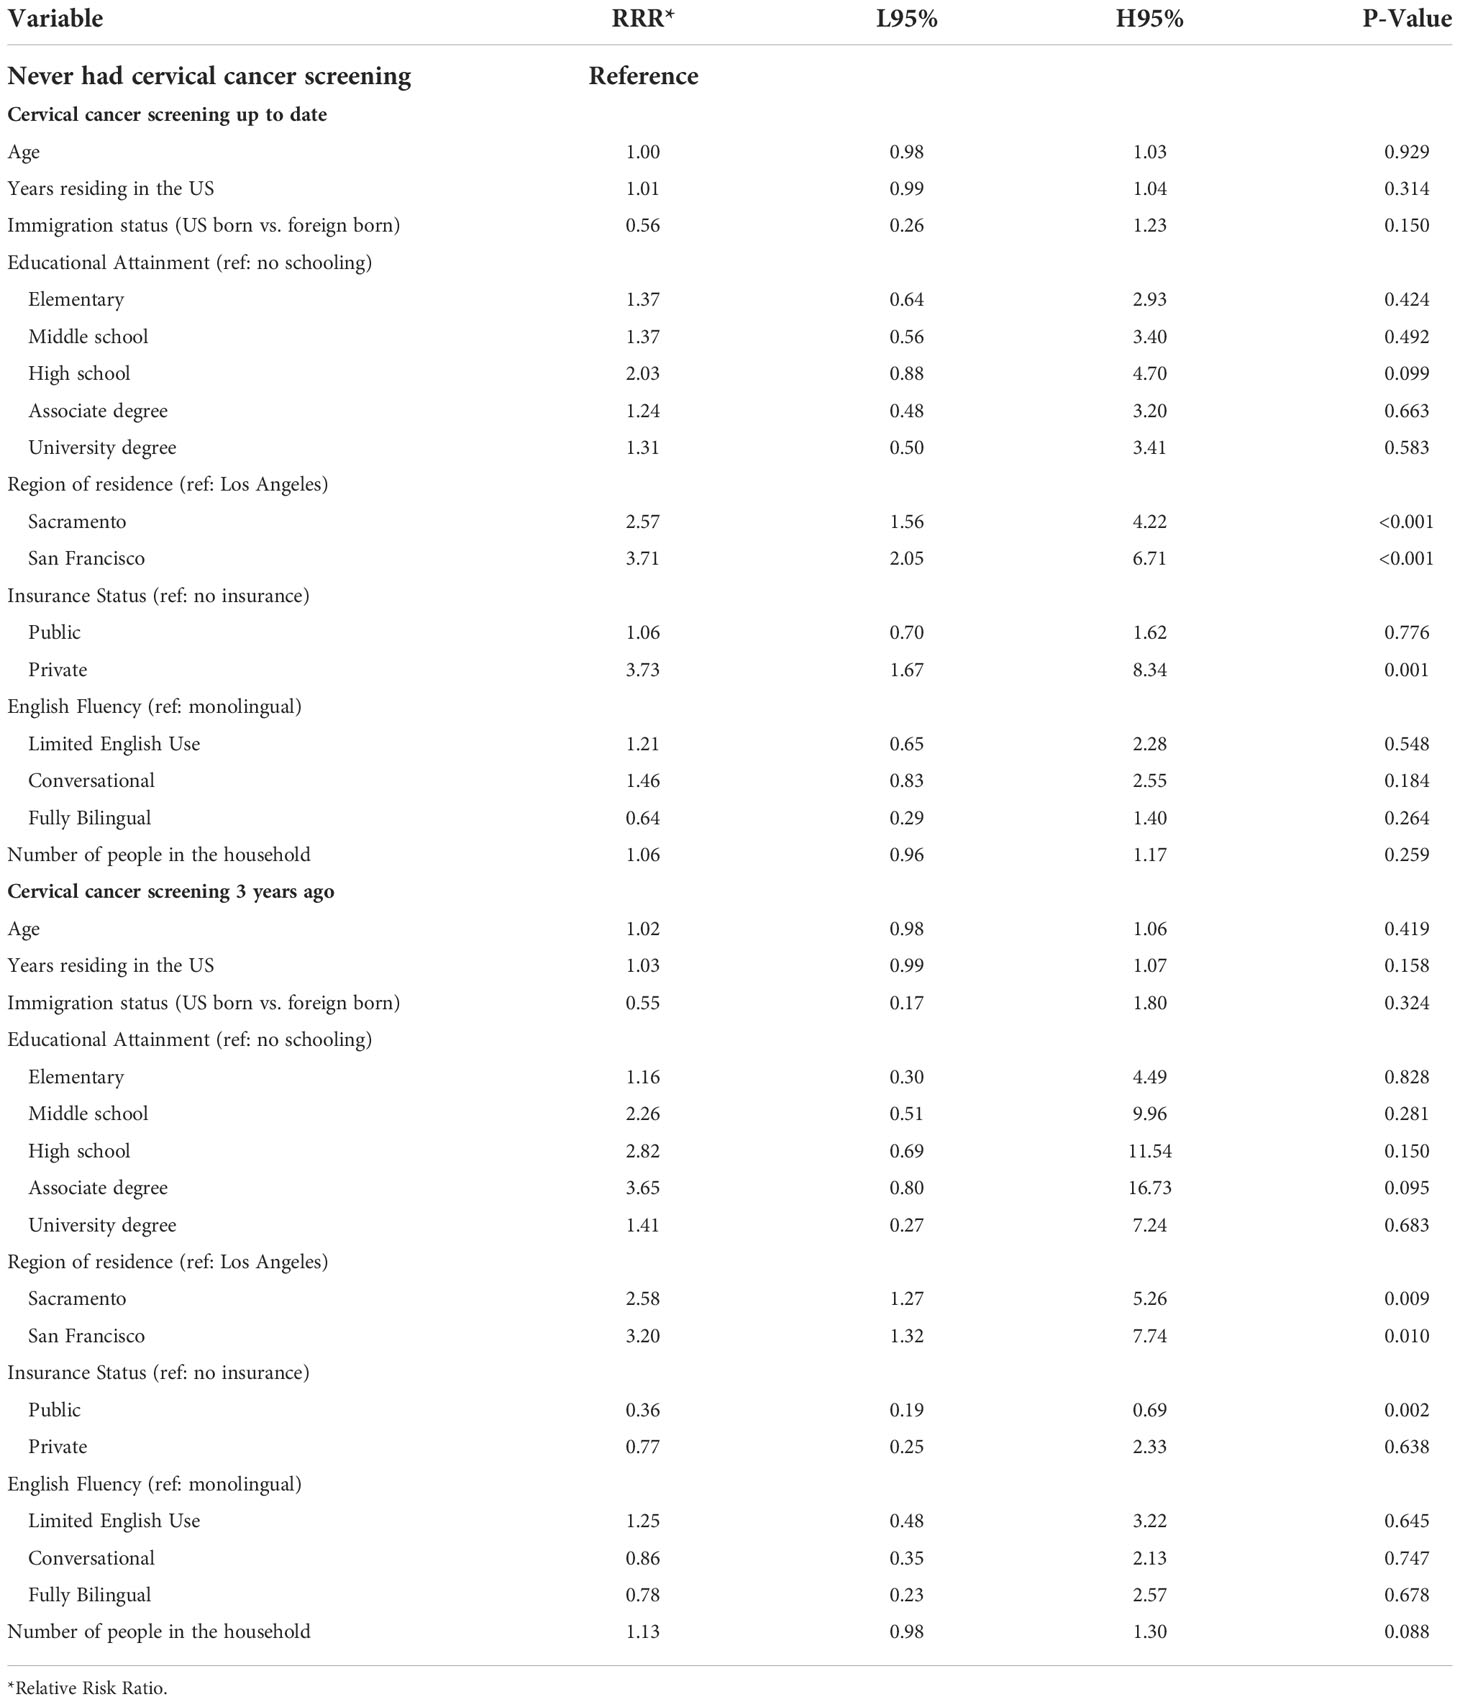
Table 5
| Variable | RRR* | L95% | H95% | P-Value |
|---|---|---|---|---|
| Never had cervical cancer screening | Reference | |||
| Cervical cancer screening up to date | ||||
| Age | 1.00 | 0.98 | 1.03 | 0.929 |
| Years residing in the US | 1.01 | 0.99 | 1.04 | 0.314 |
| Immigration status (US born vs. foreign born) | 0.56 | 0.26 | 1.23 | 0.150 |
| Educational Attainment (ref: no schooling) | ||||
| Elementary | 1.37 | 0.64 | 2.93 | 0.424 |
| Middle school | 1.37 | 0.56 | 3.40 | 0.492 |
| High school | 2.03 | 0.88 | 4.70 | 0.099 |
| Associate degree | 1.24 | 0.48 | 3.20 | 0.663 |
| University degree | 1.31 | 0.50 | 3.41 | 0.583 |
| Region of residence (ref: Los Angeles) | ||||
| Sacramento | 2.57 | 1.56 | 4.22 | <0.001 |
| San Francisco | 3.71 | 2.05 | 6.71 | <0.001 |
| Insurance Status (ref: no insurance) | ||||
| Public | 1.06 | 0.70 | 1.62 | 0.776 |
| Private | 3.73 | 1.67 | 8.34 | 0.001 |
| English Fluency (ref: monolingual) | ||||
| Limited English Use | 1.21 | 0.65 | 2.28 | 0.548 |
| Conversational | 1.46 | 0.83 | 2.55 | 0.184 |
| Fully Bilingual | 0.64 | 0.29 | 1.40 | 0.264 |
| Number of people in the household | 1.06 | 0.96 | 1.17 | 0.259 |
| Cervical cancer screening 3 years ago | ||||
| Age | 1.02 | 0.98 | 1.06 | 0.419 |
| Years residing in the US | 1.03 | 0.99 | 1.07 | 0.158 |
| Immigration status (US born vs. foreign born) | 0.55 | 0.17 | 1.80 | 0.324 |
| Educational Attainment (ref: no schooling) | ||||
| Elementary | 1.16 | 0.30 | 4.49 | 0.828 |
| Middle school | 2.26 | 0.51 | 9.96 | 0.281 |
| High school | 2.82 | 0.69 | 11.54 | 0.150 |
| Associate degree | 3.65 | 0.80 | 16.73 | 0.095 |
| University degree | 1.41 | 0.27 | 7.24 | 0.683 |
| Region of residence (ref: Los Angeles) | ||||
| Sacramento | 2.58 | 1.27 | 5.26 | 0.009 |
| San Francisco | 3.20 | 1.32 | 7.74 | 0.010 |
| Insurance Status (ref: no insurance) | ||||
| Public | 0.36 | 0.19 | 0.69 | 0.002 |
| Private | 0.77 | 0.25 | 2.33 | 0.638 |
| English Fluency (ref: monolingual) | ||||
| Limited English Use | 1.25 | 0.48 | 3.22 | 0.645 |
| Conversational | 0.86 | 0.35 | 2.13 | 0.747 |
| Fully Bilingual | 0.78 | 0.23 | 2.57 | 0.678 |
| Number of people in the household | 1.13 | 0.98 | 1.30 | 0.088 |
Multivariate multinomial logistic regression model testing the association between cervical cancer screening behavior and demographic factors among ‘Tu Historia Cuenta’ participants ages 21 to 65 (N=932, 80 excluded from 1012 due to missing data).
*Relative Risk Ratio.
Lastly, there was also an error in Table 6 as published. The sublabels under English Fluency have been updated to match the ones previously used. The corrected Table 6 and its caption appear below.
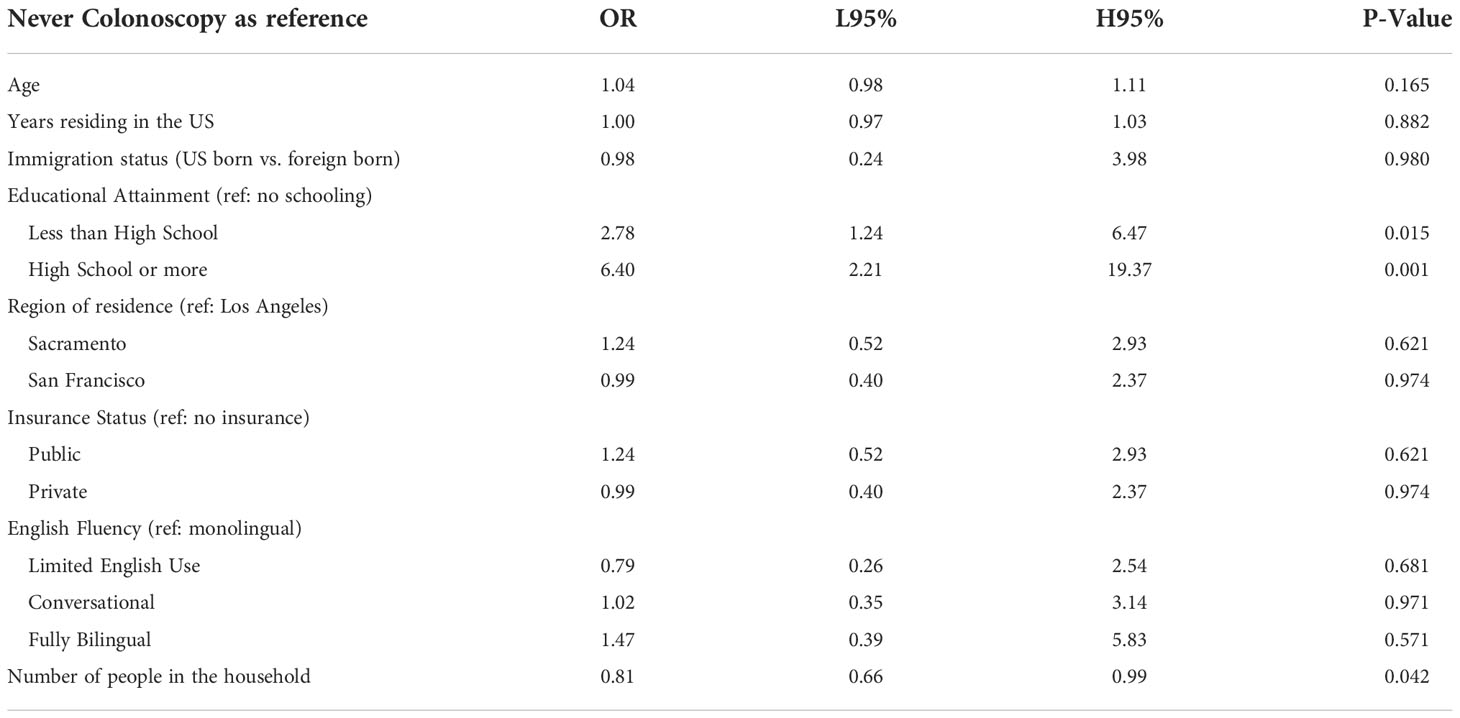
Table 6
| Never Colonoscopy as reference | OR | L95% | H95% | P-Value |
|---|---|---|---|---|
| Age | 1.04 | 0.98 | 1.11 | 0.165 |
| Years residing in the US | 1.00 | 0.97 | 1.03 | 0.882 |
| Immigration status (US born vs. foreign born) | 0.98 | 0.24 | 3.98 | 0.980 |
| Educational Attainment (ref: no schooling) | ||||
| Less than High School | 2.78 | 1.24 | 6.47 | 0.015 |
| High School or more | 6.40 | 2.21 | 19.37 | 0.001 |
| Region of residence (ref: Los Angeles) | ||||
| Sacramento | 1.24 | 0.52 | 2.93 | 0.621 |
| San Francisco | 0.99 | 0.40 | 2.37 | 0.974 |
| Insurance Status (ref: no insurance) | ||||
| Public | 1.24 | 0.52 | 2.93 | 0.621 |
| Private | 0.99 | 0.40 | 2.37 | 0.974 |
| English Fluency (ref: monolingual) | ||||
| Limited English Use | 0.79 | 0.26 | 2.54 | 0.681 |
| Conversational | 1.02 | 0.35 | 3.14 | 0.971 |
| Fully Bilingual | 1.47 | 0.39 | 5.83 | 0.571 |
| Number of people in the household | 0.81 | 0.66 | 0.99 | 0.042 |
Multivariate logistic regression model testing the association between colorectal screening behavior and demographic factors among ‘Tu Historia Cuenta’ participants ages 50+ (N=240, 24 excluded from 264 due to missing data).
The authors apologize for these errors and state that they do not change the scientific conclusions of the article in any way. The original article has been updated.
Statements
Publisher’s note
All claims expressed in this article are solely those of the authors and do not necessarily represent those of their affiliated organizations, or those of the publisher, the editors and the reviewers. Any product that may be evaluated in this article, or claim that may be made by its manufacturer, is not guaranteed or endorsed by the publisher.
Summary
Keywords
breast cancer health disparities, hereditary breast cancer, cancer education, Hispanic/Latina, cancer family history
Citation
Tamayo LI, Perez F, Perez A, Hernandez M, Martinez A, Huang X, Zavala VA, Ziv E, Neuhausen SL, Carvajal-Carmona L, Duron Y and Fejerman L (2023) Cancer screening and breast cancer family history in Spanish-speaking Hispanic/Latina women in California. Front. Oncol. 12:1087022. doi: 10.3389/fonc.2022.1087022
Received
01 November 2022
Accepted
17 November 2022
Published
06 January 2023
Volume
12 - 2022
Edited and reviewed by
Jennie L. Williams, Stony Brook University, United States
Updates
Copyright
© 2023 Tamayo, Perez, Perez, Hernandez, Martinez, Huang, Zavala, Ziv, Neuhausen, Carvajal-Carmona, Duron and Fejerman.
This is an open-access article distributed under the terms of the Creative Commons Attribution License (CC BY). The use, distribution or reproduction in other forums is permitted, provided the original author(s) and the copyright owner(s) are credited and that the original publication in this journal is cited, in accordance with accepted academic practice. No use, distribution or reproduction is permitted which does not comply with these terms.
*Correspondence: Laura Fejerman, lfejerman@ucdavis.edu
This article was submitted to Cancer Epidemiology and Prevention, a section of the journal Frontiers in Oncology
Disclaimer
All claims expressed in this article are solely those of the authors and do not necessarily represent those of their affiliated organizations, or those of the publisher, the editors and the reviewers. Any product that may be evaluated in this article or claim that may be made by its manufacturer is not guaranteed or endorsed by the publisher.