 Nikolay Konovalov1
 Stanislav Timonin1Dmitry Asyutin1
 Mikhail Raevskiy2,3,4,5
 Maxim Sorokin3,4,5
 Anton Buzdin2,3,4,5,6*Stanislav Kaprovoy1
- 1Burdenko Neurosurgical Center, Moscow, Russia
- 2Omicsway Corp., Walnut, CA, United States
- 3Moscow Institute of Physics and Technology, Moscow, Russia
- 4Shemyakin-Ovchinnikov Institute of Bioorganic Chemistry, Moscow, Russia
- 5I.M. Sechenov First Moscow State Medical University, Moscow, Russia
- 6Oncobox Ltd., Moscow, Russia
In this study, we report 31 spinal intramedullary astrocytoma (SIA) RNA sequencing (RNA-seq) profiles for 25 adult patients with documented clinical annotations. To our knowledge, this is the first clinically annotated RNA-seq dataset of spinal astrocytomas derived from the intradural intramedullary compartment. We compared these tumor profiles with the previous healthy central nervous system (CNS) RNA-seq data for spinal cord and brain and identified SIA-specific gene sets and molecular pathways. Our findings suggest a trend for SIA-upregulated pathways governing interactions with the immune cells and downregulated pathways for the neuronal functioning in the context of normal CNS activity. In two patient tumor biosamples, we identified diagnostic KIAA1549-BRAF fusion oncogenes, and we also found 16 new SIA-associated fusion transcripts. In addition, we bioinformatically simulated activities of targeted cancer drugs in SIA samples and predicted that several tyrosine kinase inhibitory drugs and thalidomide analogs could be potentially effective as second-line treatment agents to aid in the prevention of SIA recurrence and progression.
Introduction
Spinal intramedullary astrocytoma (SIA) is a rare subtype of glioma comprising about 2%–4% of all primary central nervous system (CNS) neoplasms and approximately 6%–8% of tumors occurring in the spinal cord. SIAs are mainly observed as low-grade tumors (WHO I and II) (1). Five-year overall survival rate of patients with low-grade SIA is 70%–80% and declines to 14%–28% for grades III–IV (2). However, clinical data on prognostic biomarkers and tumor molecular data associated with treatment outcomes are needed for patients with spinal astrocytoma due to a particularly low frequency of these tumors and lack of successful therapeutic regimens. In addition, diagnosis and treatment of these neoplasms is often challenging given their ambiguous manifestations such as back pain, limb weakness, paresthesia, and bowel and bladder dysfunction (1, 3). Spinal cord tumors are more frequently diagnosed in children (3, 4) but also occur in adults (4).
Surgical resection remains the main primary treatment for intramedullary astrocytomas of the spinal cord (3, 5). In turn, second-line treatments usually include radiation therapy and chemotherapy. It was also reported that the use of adjuvant radiation therapy can result in an increase in the overall survival of patients, especially for the lower-grade tumors (6). However, the optimal regimen for an adjunctive therapy including chemotherapy settings has not yet been precisely determined (1, 3, 5). Treating spinal cord astrocytomas remains problematic to date, and morbidity and mortality depend on various factors. In order to better understand these relevant factors linked with the outcomes of spinal cord astrocytomas, several studies were conducted. Due to the complications associated with clinical diagnosis, indecision about optimal surgical treatment, and second-line treatment failures, most reports on intramedullary astrocytomas represent either small cohort retrospective analyses and case studies or data capturing current changes in treatment options (1, 3, 5). Due to the low incidence of these tumors, prospective clinical investigations are problematic to perform, and alternative chemo- and targeted therapeutic agents and regimens were poorly explored for SIA (7–9).
On the other hand, RNA expression profiles may serve as potent predictors of tumor sensitivity to targeted therapeutics, as shown in clinical investigations for microarray (10) and RNA sequencing (RNA-seq) (11) data. Furthermore, molecular pathway activation levels can be calculated using high-throughput gene expression profiles (12, 13) and translated into next-generation biomarkers (14–16) for algorithmic scoring of cancer drug efficiencies (17, 18). Moreover, aggregation of expression data of single gene products into pathways or signatures results in significantly more robust expression-level biomarkers, as deduced theoretically (19) and shown on real cancer molecular data (20, 21). Thus, RNA-seq profiles can be used for finding effective cancer prognostic or predictive biomarkers and assist in finding better clinical treatment regimens (22–24). However, there is a dearth of clinically annotated molecular profiles of SIA that could be used for such a purpose.
In this study, we report 31 new SIA RNA-seq profiles for 25 patients with documented clinical annotations. As far as we know, the current study presents the first clinically annotated RNA-seq dataset of spinal astrocytomas derived from the intradural intramedullary compartment.
We compared these tumor profiles with the previous healthy CNS RNA-seq data of spinal cord and brain samples (24, 25). We identified differentially expressed gene (DEG) sets in SIA and molecular pathways and analyzed the occurrence of known diagnostic and new fusion transcripts. In addition, we calculated prognostic balanced efficiency scores for known targeted drugs and identified a fraction of them that could be potentially helpful as second-line treatment agents to aid in the prevention of SIA recurrence and progression.
Results
SIAs were not previously characterized on transcriptome-wide level, and in this study, we aimed to analyze RNA-seq profiles of SIA samples in comparison with healthy brain and spinal cord samples obtained from Genotype-Tissue Expression (GTEx) Portal (25) and Atlas of RNA sequencing profiles for normal human tissues (ANTE) database (24).
Spinal Intramedullary Astrocytoma Diagnosis and Biosamples
Overall, 31 tumor tissue samples were taken from 14 male and 11 female donors who were diagnosed between 2003 and 2018 with SIA (23 pilocytic astrocytomas, 4 glioblastomas, 2 anaplastic astrocytomas, and 2 astrocytomas with uncategorized histological subtype; Figure 1). The mean age was 32.73 years (range 18–69 years) and 30.00 years (18–56 years), respectively. The biosamples were formalin-fixed paraffin-embedded (FFPE) histologically characterized tumor samples with at least 70% cancer cells. Clinical annotations of tumor tissue specimens investigated in this study and their patient origin are summarized in Supplementary Table S1. Kaplan–Meier plots for progression-free survival and overall survival are shown in Supplementary Figure S1.
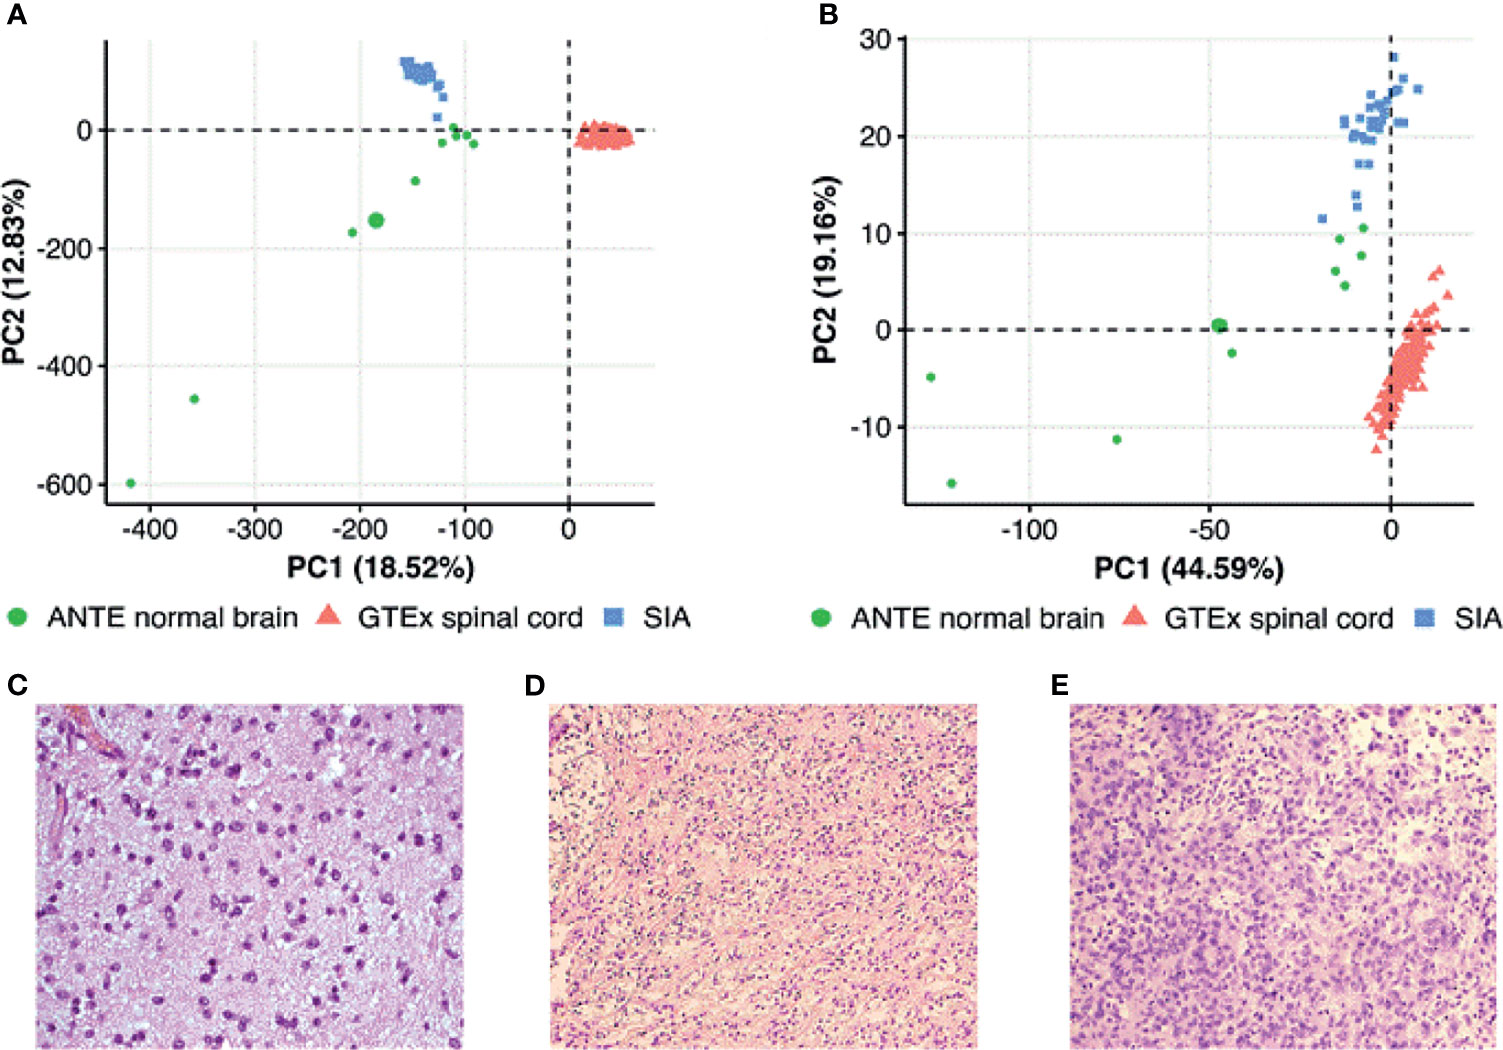
Figure 1 Principal component analysis (PCA) of (A) gene expression and (B) pathway activation levels (PALs) for spinal intramedullary astrocytoma (SIA) tissue samples and publicly available spinal cord and brain normal samples from The Genotype-Tissue Expression (GTEx) Portal and Atlas of Normal Tissue Expression (ANTE). PALs were calculated according to Borisov et al. (12) with the 168 healthy CNS tissue samples taken as the controls for SIA. Histological examples of (C) a diffuse, (D) a pilocytic, and (E) an anaplastic astrocytoma.
Characteristics of Sequencing and Mapping
A total of 10,509.3 million reads were obtained for 31 independent libraries of SIA tissues (median 55.3 million reads per sample). Most reads reached Phred-like quality scores (Q-scores) at the Q30 level, indicating that the probability of an incorrect base call is 0.001%. The average coverage of sequencing depth reached approximately 53.45× of the human transcriptome. After alignment, 98.57% to 99.12% uniquely aligned reads were mapped to the reference human genome.
Primary Comparison of RNA Sequencing Profiles of Spinal Intramedullary Astrocytomas and Healthy Central Nervous System Tissues
To further characterize SIA transcriptomic data, we compared using principal component analysis (PCA) distributions of RNA-seq profiles among the SIA samples (n = 31) and publicly available datasets of normal spinal cord (n = 159) and brain (n = 9) tissues from GTEx and ANTE databases, respectively. PCA was performed to investigate cross-dataset compatibility in order to select proper reference group(s) for SIA comparison. The profiles from ANTE database were chosen because they were obtained using the same reagents, equipment, and protocols as for the current experimental SIA sampling (24). The GTEx reference group of samples was selected because this is, to our knowledge, currently the biggest publicly available collection of healthy spinal cord RNA-seq profiles [30]. Performing two-step expression analysis allowed us to select the DEGs between SIA and normal neural tissue explored using the same RNA-seq platform (brain samples from ANTE) and using a different platform but for the same tissue type (GTEx spinal cord samples). Unfortunately, normal spinal cord samples were not available in the ANTE database. We hope that this approach allowed to establish differential gene expression profiles without the influence of platform-specific batch effect.
PCA was performed first in the space of log10 transformed quantile normalized gene counts. We observed tissue-specific sample clustering corresponding to the biological nature of the datasets under analysis, where SIA samples formed a separate cluster (Figure 1A) . In addition, we performed PCA for brain and spinal cord from GTEx, SIA, and ANTE normal brain data normalized using quantile normalization, DESeq2, and harmonized/batch corrected using XPN (26), CuBlock (27), and Shambhala (28). It appeared that GTEx brain profiles clustered with ANTE normal brain even in case of DESeq2 normalization, indicating that further batch correction was not necessary (Supplementary Figure S2).
Then, we performed PCA based on pathway activation levels (PALs) of 1,611 molecular pathways (29) calculated using the same transcriptomic data for each sample under study (Figure 1B). In case of pathway upregulation or downregulation, PALs can take positive or negative values, respectively, thus quantitatively reflecting the extent of a pathway activation or inhibition relatively to the control group of samples. Zero PAL values suggest unaffected activity of a molecular pathway. Thus, PAL values can be used as the quantitative functional characteristic of the interactome under analysis (14). We calculated PALs according to Borisov et al. (12), with the 168 healthy CNS tissue samples taken as the controls.
On the PAL-based PCA plot, we observed similar clustering as for the gene expression-based PCA (Figure 1B), thus strongly suggesting that SIA samples should be independently compared to each of the above healthy CNS tissue datasets.
Differential Gene Expression Analysis
Subsequently, we performed paired differential gene expression analysis between SIA samples relatively to each dataset of healthy CNS tissues (Supplementary Table S2). Overall, 1,949 genes, 1,766 (90.61%) upregulated and 183 (9.39%) downregulated, were found to be statistically significantly differentially expressed [|log2FC|>5, false discovery rate (FDR)-adjusted p-value <0.05] between SIA and GTEx spinal cord samples (Figure 2A). In turn, 382 DEGs, 102 (26.70%) upregulated and 280 (73.30%) downregulated, were found for the comparison between SIA and ANTE healthy brain samples (Figure 2B).
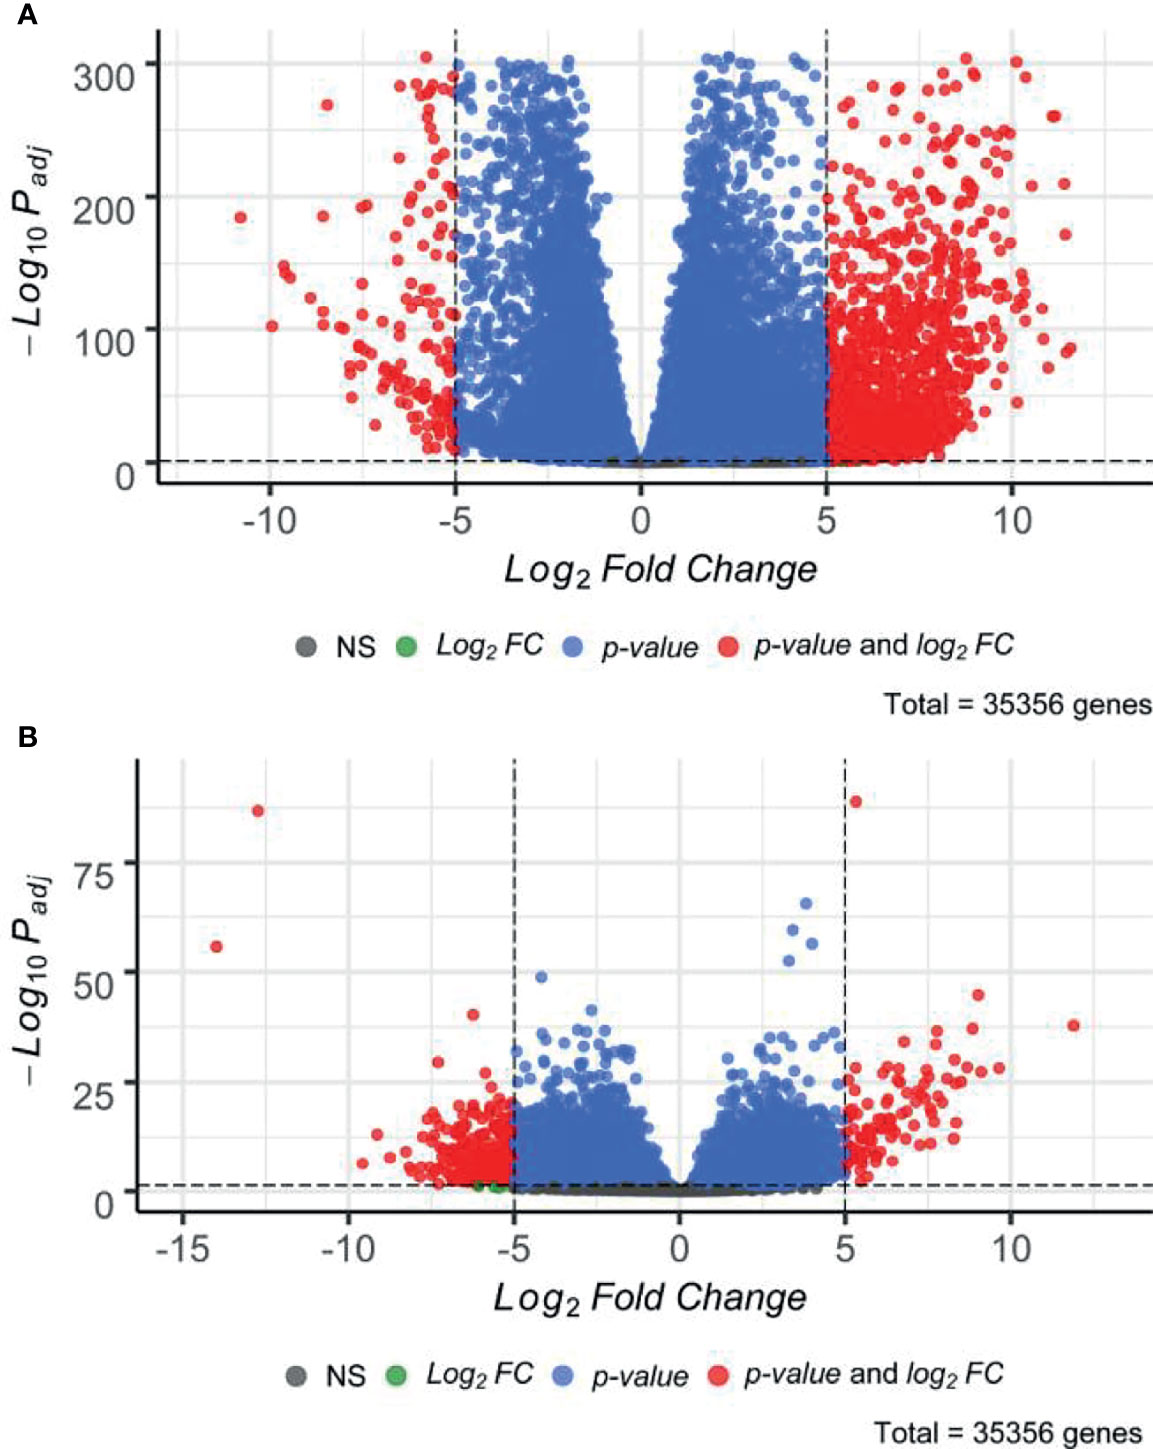
Figure 2 Distribution of differentially expressed genes between spinal intramedullary astrocytomas (SIAs) relative to (A) GTEx healthy spinal cord and (B) ANTE healthy brain samples.
These DEG sets were then intersected with respect to log2FC sign (Figures 3A, B). In order to test whether an observed number of common differential genes can support random or non-random intersection hypothesis, we performed perturbation test for randomness according to Sorokin et al. (30) with 1,000 random gene sets. The percentile of the observed case precedent in the distribution of random intersections was considered as a measure of statistical significance.
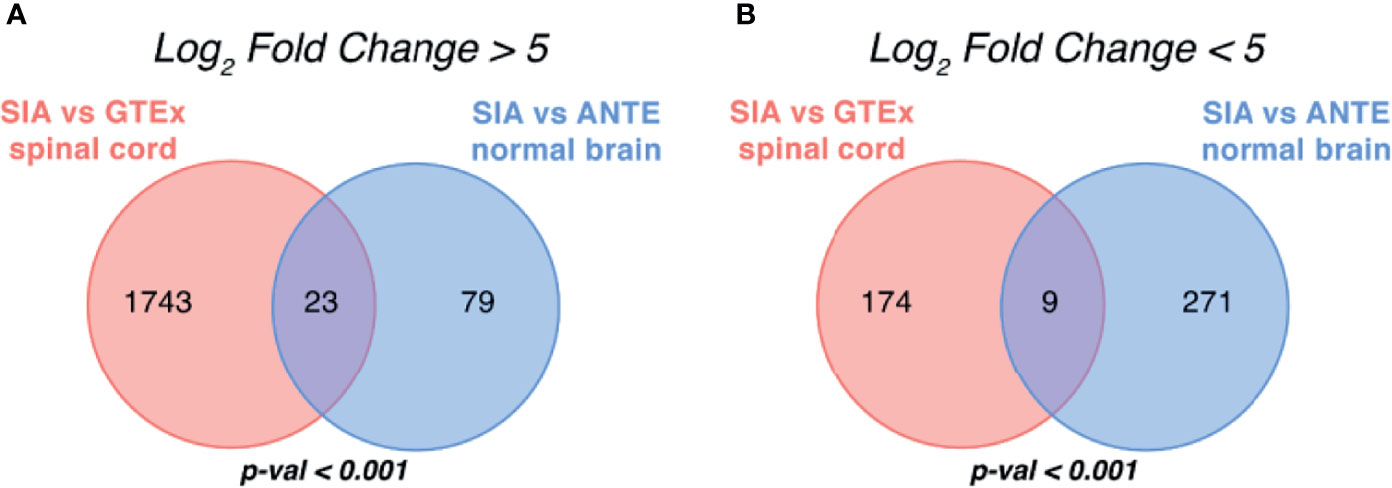
Figure 3 Intersection of differentially expressed gene sets between spinal intramedullary astrocytomas (SIAs), GTEx healthy spinal cord, and ANTE healthy brain samples. Intersections of (A) upregulated and (B) downregulated differentially expressed gene sets between SIA–GTEx spinal cord and SIA–ANTE normal brain samples are shown; p-values for intersection significance obtained in perturbation test are highlighted in bold.
In total, 32 genes, 23 (71.88%) upregulated and 9 (28.12%) downregulated, were commonly differentially expressed in SIA samples according to both comparisons, which supported the hypothesis that the intersections between the DEGs were non-random (p < 0.01).
Gene Ontology Enrichment Analysis
To evaluate potential functional similarities of the above 32 SIA-specific differential genes and the underlying molecular and cellular processes, we then performed Gene Ontology (GO) terms enrichment analysis (Figures 4A, B). We identified significantly enriched 563 functional GO terms, where 340 terms (60.39%) were for upregulated and 223 (39.61%) were for downregulated DEGs. For statistical estimates, we used Benjamini–Hochberg method for FDR correction (31) and p-value threshold 0.05 (32).
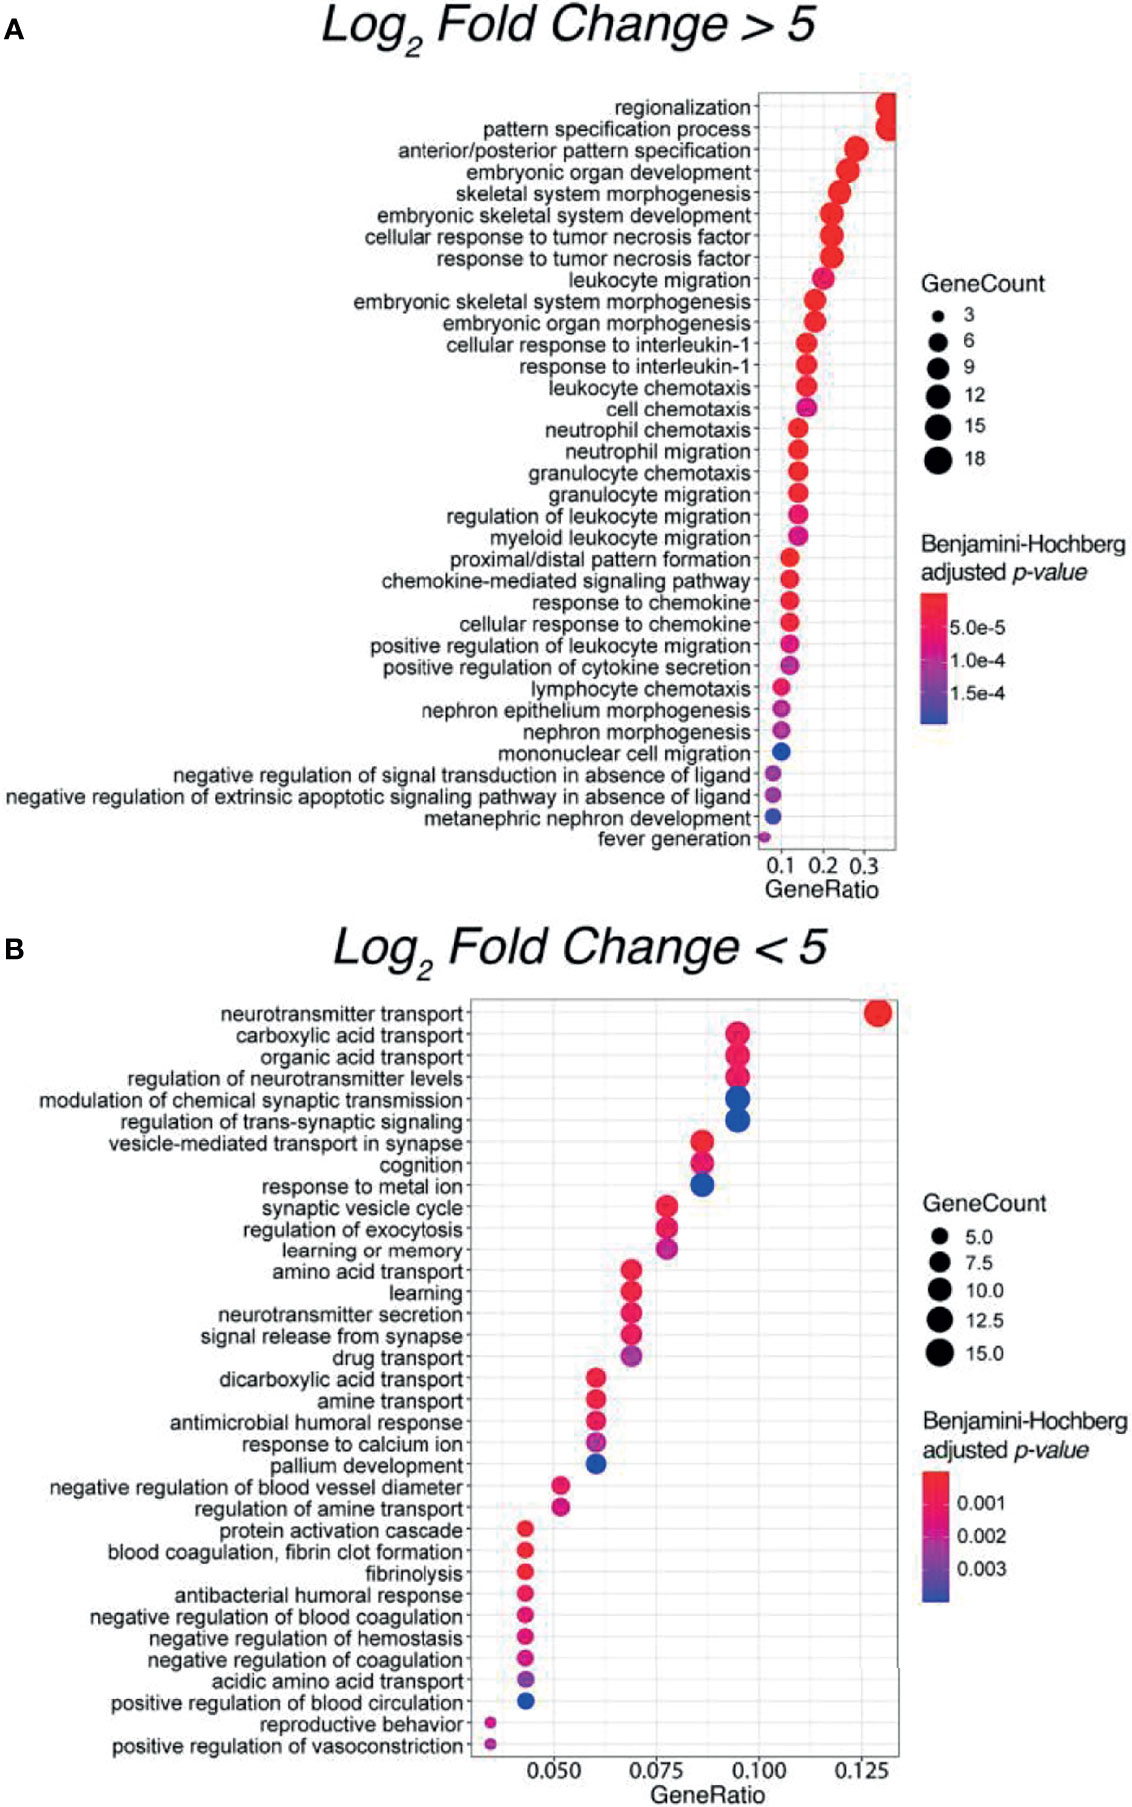
Figure 4 Top 35 enriched Gene Ontology (GO) terms for significantly (A) upregulated and (B) downregulated differentially expressed genes between spinal intramedullary astrocytomas (SIAs) and healthy CNS tissues: GTEx spinal cord and ANTE normal brain samples.
Interestingly, most of the enriched terms for upregulated DEGs were related to the regulation of an innate and adaptive immune response, thus supporting a concept that immune microenvironment may play a crucial role in the development of spinal astrocytomas (33). In contrast, for downregulated DEGs, the most strongly enriched terms were linked with complex neuronal processes, such as cognition, learning ability, and regulation of neurotransmitter secretion and transport. The latter supports specific functional impairments occurring in astrocytomas in comparison with healthy CNS tissues (34).
Differential Pathway Activation Analysis
We then performed differential PAL analysis for SIA samples relative to healthy CNS tissues (Figure 5). In total, 1,611 molecular pathways including 10 and more gene products were interrogated from Oncobox pathway databank (29).
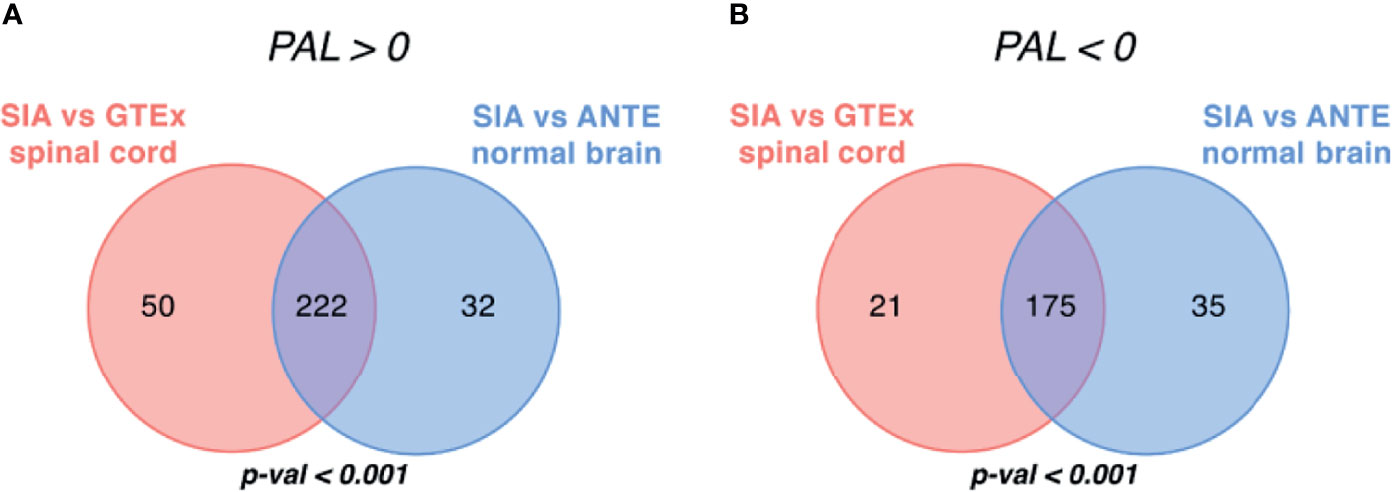
Figure 5 Intersection of differentially regulated molecular pathways between spinal intramedullary astrocytomas (SIAs), GTEx healthy spinal cord, and ANTE healthy brain samples. Intersections of significantly (A) upregulated (PAL >0) and (B) downregulated (PAL <0) molecular pathways between SIA–GTEx spinal cord and SIA–ANTE normal brain samples are shown; p-values for intersection significance obtained in perturbation test are highlighted in bold.
When comparing SIA and GTEx healthy spinal cord samples, we identified 468 differentially regulated pathways, 272 (58.12%) of them were activated and 196 (41.88%) were suppressed (Figure 5). In turn, for the comparison between SIA and ANTE normal brain samples, 464 differential pathways were identified; among them, 254 (54.74%) were activated and 210 (45.26%) were suppressed (Figure 5).
The intersections between these pathway sets returned 397 common differential molecular pathways [222 (55.92%) activated and 175 (44.08%) inhibited; Supplementary Tables S3, S4]. This supported non-random intersection between the differential pathways in both comparisons, p < 0.001 (Figure 5).
In both comparisons, top activated pathways deal with intracellular signal transduction and with the immune response, whereas top downregulated pathways are responsible for translational regulation and neurotransmitter activities (Figure 6). Except for the new feature of translational regulation, this trend was in line with the results obtained previously for the GO terms enrichment in the SIA differential genes (Figure 4).
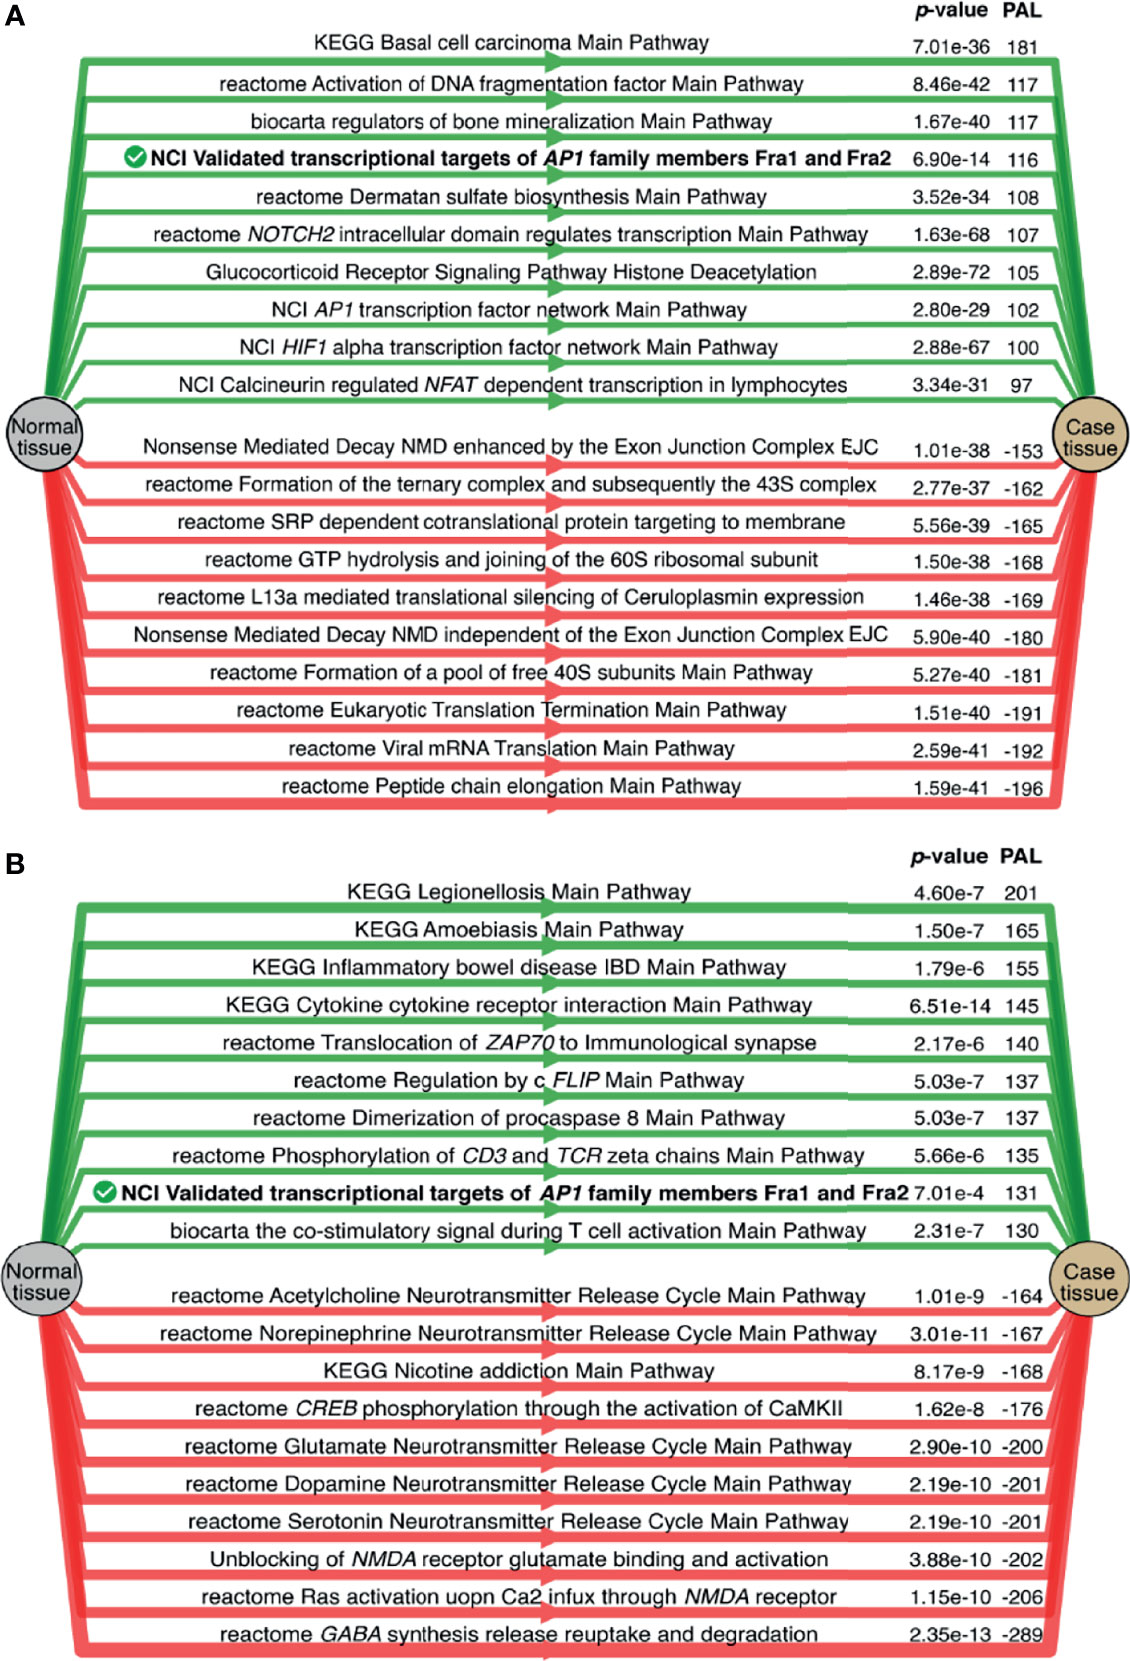
Figure 6 Top 10 activated (green) and suppressed (red) molecular pathways for the comparisons of spinal intramedullary astrocytomas (SIAs) with (A) GTEx healthy spinal cord and (B) ANTE normal brain samples. Common top differential pathways are shown in bold.
Simulated Activities of Anticancer Targeted Therapeutics
A chemotherapeutic treatment of SIA remains a challenging and poorly investigated field, and we performed computational simulation whether anticancer targeted drugs (ATDs) that are currently in use for other CNS tumors could be repurposed as second-line treatment options for SIA. To this end, we utilized Oncobox method for predicting efficiencies of ATDs based on gene expression and molecular pathway activation data (35). This returns for every drug a tumor sample-specific value of balanced drug efficiency score [drug score (DS)]. DS reflects an expected responsiveness of a tumor to a specific drug, where higher values mean higher expected efficacy of an ATD. Furthermore, drugs with positive DS are predicted to be potentially beneficial, and drugs with negative DS—potentially harmful (35). This method was shown to be clinically beneficial in a prospective clinical investigation on high-grade human solid tumors [16] and was effective for individual selection of experimental/off-label chemo- and targeted therapeutic settings, e.g., Buzdin et al. (36) and Moisseev et al. (37). In glioblastoma, Oncobox method could effectively predict tumor response on temozolomide, a DNA-alkylating agent whose activity is antagonized by MGMT gene products (38).
By using Oncobox algorithm, we identified 85 ATDs with positive DS in the SIA–GTEx spinal cord comparison, and 70 ATDs with positive DS in the SIA–ANTE healthy brain comparison (Figures 7, 8). In these lists, there were 66 common drugs, thus evidencing non-random intersection between the two comparison results (Figure 8 and Supplementary Tables S5, S6).
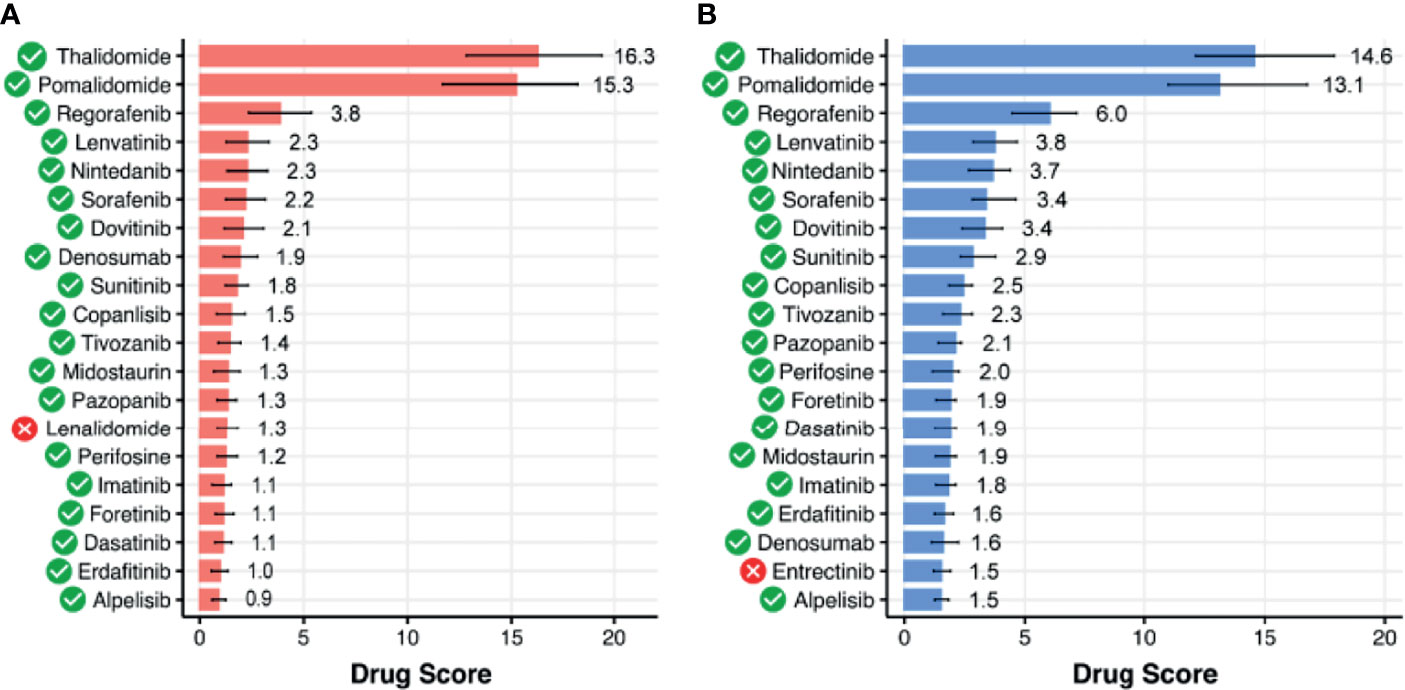
Figure 7 Top 20 targeted therapeutics ranked by drug score for spinal intramedullary astrocytomas (SIAs) separately normalized on (A) healthy GTEx spinal cord and (B) ANTE normal brain samples. Targeted therapeutics that are common between the two top-20 lists are shown with green marks.
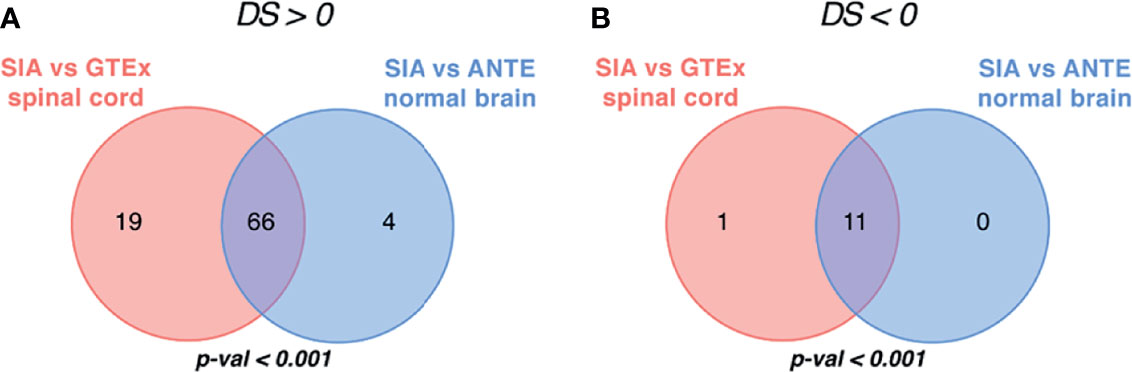
Figure 8 Intersection of targeted therapeutics assessed by Oncobox algorithm with (A) positive and (B) negative drug score (DS) predicted for spinal intramedullary astrocytomas (SIAs) separately normalized on GTEx healthy spinal cord and on ANTE normal brain samples; p-values for intersection significance obtained in perturbation test are highlighted in bold.
We then assessed available clinical trial reports for the top 20 DS-ranked drugs among these common 66 ATDs with the biggest DS values for different CNS tumors (Table 1 and Figure 7). Interestingly, the top predicted drugs mostly represented the classes of tyrosine kinase inhibitors (i.e., regorafenib, lenvatinib, nintedanib, sorafenib, dovitinib, sunitinib, tivozanib, pazopanib, imatinib, foretinib, dasatinib, erdafitinib) and thalidomide analogs (thalidomide and pomalidomide). Many of these drugs were previously investigated for CNS tumors and related cancers like neuroblastoma (Table 1).
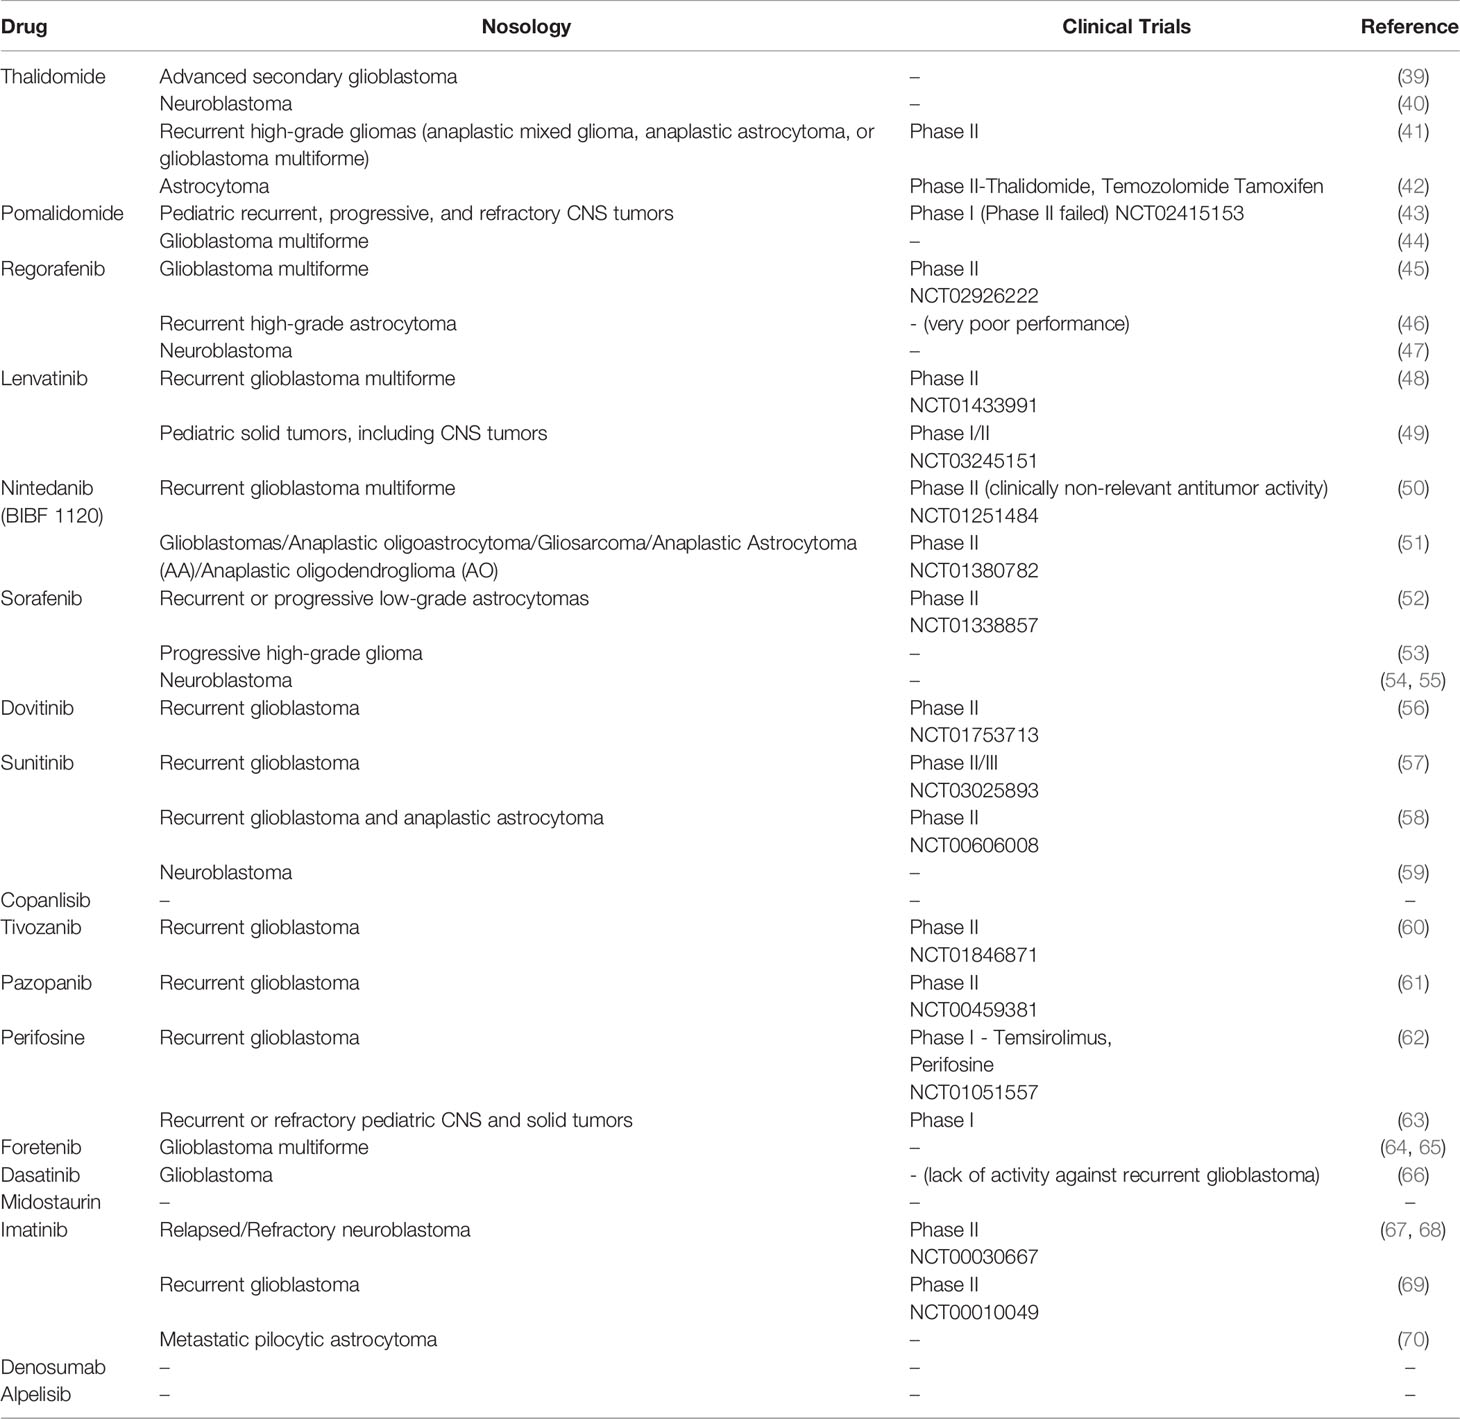
Table 1 Overview of existing clinical trials conducted across Central Nervous System (CNS)-related tumors for target drugs with the highest drug score predicted for spinal intramedullary astrocytoma (SIA) samples.
On the other hand, drugs with the predicted negative drug scores that were, therefore, algorithmically not recommended belonged mainly to cyclin-dependent kinase inhibitors and androgenic and anabolic steroid (AAS) classes.
Spinal Intramedullary Astrocytoma Fusion Gene Transcripts
Chromosomal rearrangements resulting in fusion genes and abnormal transcripts in some cases may become clinically actionable targets of specific cancer therapeutics (71). Fusion transcripts combine exons of 2 or more genes and may serve as the oncogenic drivers in many cancers including CNS tumors (72, 73).
We used RNA-seq profiles for SIA patients to detect fusion transcripts presenting in spinal astrocytoma and focused on the fusions where at least on partner gene was a serine/threonine or tyrosine kinase. This allowed to select potentially druggable fusion genes. We found, in total, 16 different fusion transcripts identified by STAR-Fusion software (74) (Figure 9 and Supplementary Figure S3). One of them, KIAA1549-BRAF, was found in two SIA patients and preserved BRAF kinase domain (Figures 10A, B). Interestingly, this fusion transcript was previously reported to confer a clinically less aggressive phenotype in pediatric low-grade astrocytoma (75). It was also found less abundant in the adult compared to pediatric patients with pilocytic astrocytoma (76). Other fusions, to our knowledge, were not reported previously and were not found in ChimerDB fusion database.
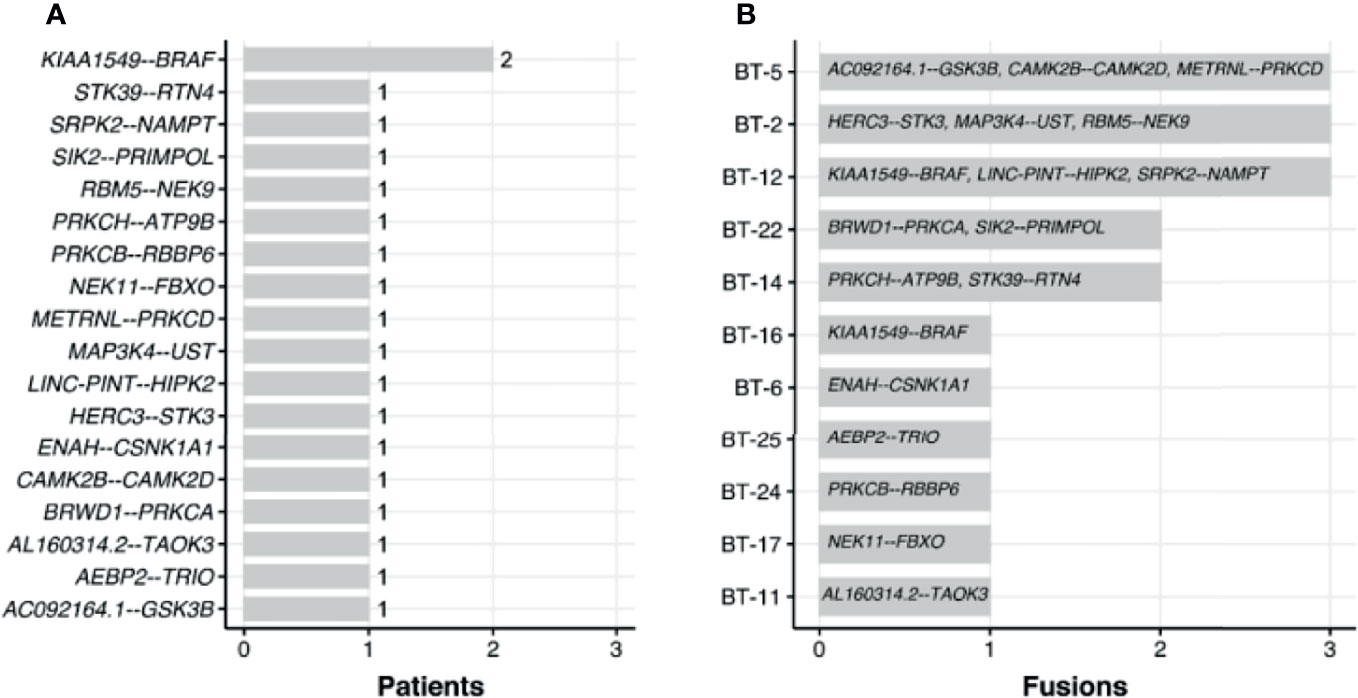
Figure 9 Occurrence of fusions found across spinal intramedullary astrocytoma (SIA) samples by number of patients (A) and fusions (B).
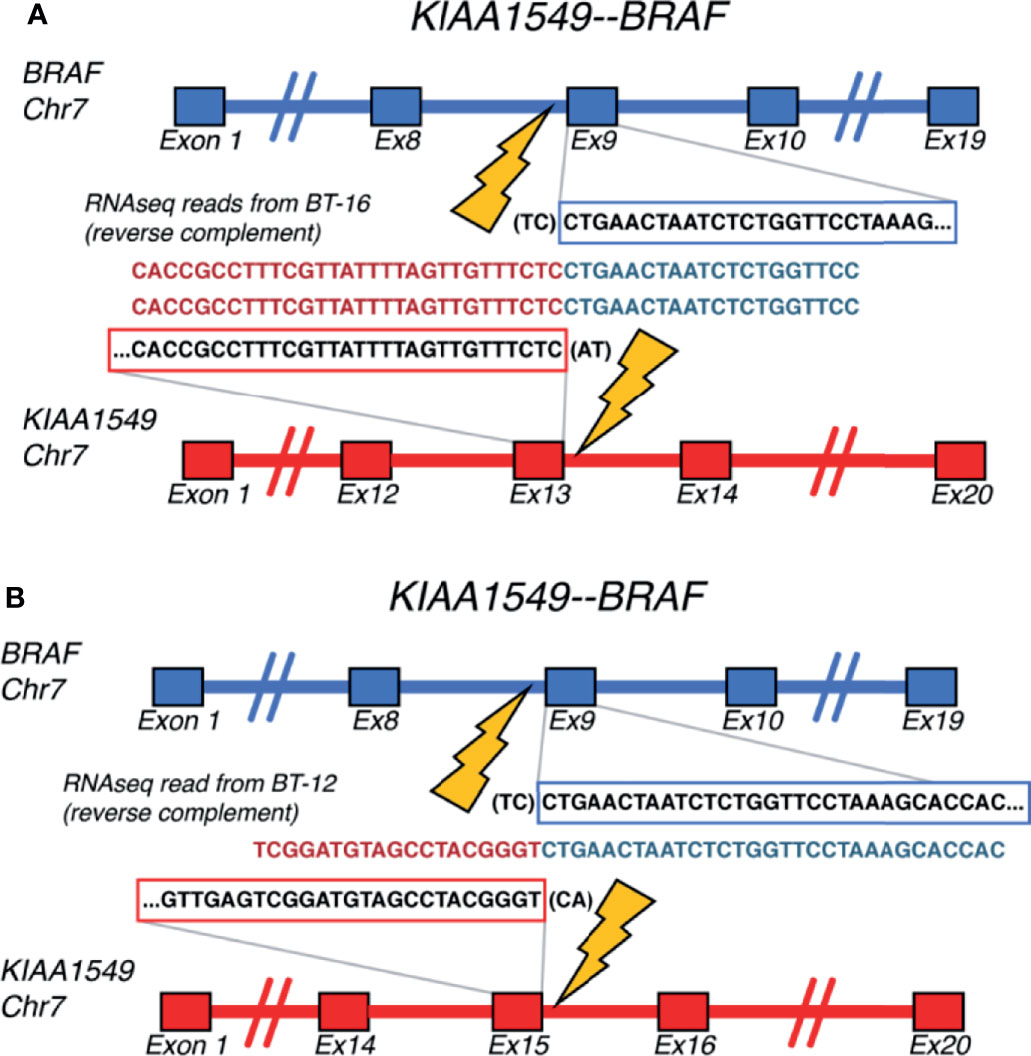
Figure 10 Schematic representation of the KIAA1549-BRAF fusion transcripts identified for (A) BT-16 and (B) BT-12 samples of spinal intramedullary astrocytoma (SIA).
Discussion
SIAs are rare tumors comprising 6%–8% of all spinal cord tumors, and finding effective lines of treatment for SIA is a challenging task (1, 3). Currently, second-line treatments after surgical resection may include radiation and chemotherapy, where the regimen for adjunctive therapy was not optimally defined. Distance of tumor extension, type of surgery, and adjuvant therapy were significantly associated with SIA patients’ survival in a previous study (77). The limited number of SIA clinical cases results in an absence of prospective studies (7–9). H3-K27 mutation previously showed diagnostic relevance and defined phenotypically and molecularly a distinct set of tumors (78). However, these mutations rarely occur in SIA with just several cases described in the literature (79).
Here, we report the first RNA-seq molecular dataset with documented clinical annotations for 31 samples of 25 SIA patients. While there were studies by Biczok et al. (80) and Zhang et al. (81) on SIA molecular profiling, the current study is, to our knowledge, the only one with publicly available sequencing data. In addition, Biczok et al. (80) performed only targeted RNA-seq for 55 genes to detect fusion genes, while we investigated gene expression profiling using total RNA sequencing.
By comparing the experimental data obtained with the healthy brain and spinal cord CNS tissues, we analyzed SIA-specific DEGs, enrichment of GO terms, activation of molecular pathways, presence of fusion transcripts, and simulated efficacies of anticancer targeted drugs. Our study has certain limitations such as retrospective design and a small number of patients with mixed pathology of low-grade and high-grade spinal cord astrocytomas, although taking into account the rarity of this disease, this is expected.
Our results provide clues on possible molecular mechanisms of spinal astrocytoma and on its biomarkers. Indeed, a group of 23 differential SIA-upregulated genes found in the study was significantly enriched by GO terms mostly linked with regulation of innate and adaptive immune response. This strongly supports a role of the immune microenvironment in SIA development and progression. At the same time, a group of nine differentially downregulated genes was enriched by the terms dealing with neuronal and cognitive functions, thus reflecting their impairment in the cancer tissue.
Interestingly, a secreted extracellular matrix protein periostin was among the 23 SIA upregulated genes. Periostin was previously associated with prognosis and performance status in gliomas (82). Moreover, Mikheev et al. (83) showed that periostin knockdown impaired the survival of xenografted glioma stem cells and thus concluded that targeting periostin may be a promising strategy. Our study supports these findings and points to a potential role of periostin also in spinal astrocytomas.
Furthermore, our algorithmic simulation predicted that 66 targeted therapeutics can be potentially beneficial for SIA treatment. Some of them were already tested for CNS tumors and passed Phases I or II of clinical trials. We speculate that they could be repurposed from being used in other CNS tumors, and related tumors such as neuroblastoma, to improving the second-line treatment of SIA. Interestingly, the most highly ranked drugs (thalidomide and its derivatives) also reflect the top GO terms enriched in the SIA-upregulated gene set, i.e., the cellular response on tumor necrosis factor (Figure 4A), whose pathway is a primary molecular target for these drugs (84). Many tyrosine kinase inhibitory drugs were also predicted to be beneficial in SIA treatment.
In contrast, there are some cancer therapeutics we predicted to be potentially harmful for treating SIA, which mainly related to cyclin-dependent kinase inhibitors (-Ciclibs) and AAS hormones.
At the level of molecular pathway analysis, we could identify several specific molecular features of SIA. For example, the top upregulated pathways were associated with transcriptional targets of AP1 (Activator Protein-1) family member transcription factors FOSL1 and FOSL2. Interestingly, AP1 transcription factors FOS and Fra1 were found to be upregulated in pilocytic astrocytomas (85). Moreover, Fra1 was shown to control architecture and migratory nature of glioblastoma cells (86). This protein is also linked with promotion of glioma aggressiveness through epithelial–mesenchymal transition (87) and overall glioblastoma invasion (88). In turn, downregulation of Fra1 enhances drug sensitivity in breast cancer cells (89). Also, experimental Fra1 inhibitors significantly suppressed tumor growth and lymph node metastasis of head and neck cancers in a patient-derived xenograft model (90). Thus, our results suggest that Fra1 could be investigated as a potential drug target in rare CNS tumors, such as SIA.
Finally, 16 different fusion transcripts identified in this study suggest the occurrence of chromosomal rearrangements resulting in fusion oncogenes and abnormal transcripts in SIA. Moreover, KIAA1549-BRAF fusion detected for two adult SIA patients was previously relatively frequently found in pediatric pilocytic astrocytomas [47] and was reported to confer a clinically less aggressive phenotype in pediatric low-grade astrocytoma (75). Thus, fusion transcripts found can be potentially clinically relevant for SIAs and should be further tested, since many gene fusions were reported as oncogenic drivers in CNS tumors (72, 73).
Materials and Methods
Experimental Clinical Biosamples
This study was performed in agreement with the ethical principles of Declaration of Helsinki. Retrospective biosamples were obtained from patients diagnosed with SIAs who had undergone surgery at the spinal department of Burdenko Neurosurgical Center, Moscow. From all the patients involved or from their legal representatives, informed written consents to participate in this study were collected. The study design and consent collection procedure were approved by the local ethical committee of the Burdenko Neurosurgical Center. For all patients enrolled and for their biosamples, the consent was obtained for publication of age, sex, histological tumor type, diagnosis, and molecular data including RNA-seq profiles but not including whole-genome and/or whole-exome sequencing data.
Biosamples were FFPE tumor tissue blocks that were evaluated and confirmed by a pathologist who estimated a proportion of tumor cells and determined the histological type of a tumor. In this study, only FFPE blocks with at least 70% tumor cells were analyzed. In total, 31 samples for 25 SIAs meeting the above criteria were obtained for further molecular screenings (Supplementary Table S5).
Preparation of Libraries and RNA Sequencing
RNA libraries were generated and sequenced according to Suntsova et al. (24). RNA was extracted using RecoverAll™ Total Nucleic Acid Isolation Kit (Invitrogen). RNA concentrations were measured with Qubit RNA Assay Kit, and Agilent 2100 bioanalyzer was used to measure RNA Integrity Number (RIN). Depletion of ribosomal RNA was performed using RNA Hyper Kit (Roche), and then library concentrations and fragment length distributions were measured with Qubit (Life Technologies) and Agilent Tapestation (Agilent), respectively. The RNA-seq was performed using Illumina NextSeq 550 engine for 50-bp single-end reads and approximately 30 million raw reads per sample using standard protocol. Single-end sequencing was used because SIA samples were FFPE tissue blocks that typically have a strong degree of RNA degradation. Primary sequencing data quality control was performed with Illumina SAV, and demultiplexing was made according to Suntsova et al. (24) with Illumina Bcl2fastq2 v 2.17 software.
RNA Sequencing Data Processing
SIA profiles were processed according to Suntsova et al. (24). STAR aligner (91) was used to process FASTQ files from RNA-seq in “GeneCounts” mode for Ensembl human transcriptome annotation GRCh38.89. The gene names for 36,596 annotated genes were converted to HGNC (HUGO Gene Nomenclature Committee) gene symbols from Ensembl IDs according to Complete HGNC dataset, version of August 17, 2021 (https://www.genenames.org). Further quality control metrics for RNA-seq data were obtained with NCBI MAGIC software (92–94). RNA-seq profiles were preprocessed by quantile normalization method (95), and then differential expression analysis was performed using DESeq2 (96), and visualized with R package EnhancedVolcano (97). Genes that were considered significantly differentially expressed had to pass a threshold of FDR-adjusted p-values <0.05 (98). GO enrichment analysis was conducted using clusterProfile (v.4.2.1) and org.Hs.eg.db (v.3.8.2) R packages. Fusion transcripts were detected with STAR-Fusion tool (74), and PCA and visualization were done for log10 transformed counts of all genes using pca2d R (v.3.6.0) and prcomp software. Code for data analysis is available at: https://github.com/raevskymichail/SIA_analysis.
Healthy Tissue Transcriptomic Data
We used healthy tissue transcriptomic profiles obtained for normal human spinal cord biosamples from GTEx project portal (25) and for normal brain samples from the ANTE database (24). In total, 9 ANTE and 159 GTEx normal CNS samples were analyzed. Raw count quantification in GENCODEv26 annotation was obtained from GTEx portal.
Calculation of Pathway Activation Levels
Algorithmically annotated molecular pathway graphs were taken from our previously published database (29). PALs were calculated with the Oncobox bioinformatic platform. It allows quantitative assessment of PALs using RNA-seq data and functionally annotated collection of molecular pathways (12, 29). We used a set of 1,611 pathways with 10 or more gene products included because of previously reported poor theoretically estimated data aggregation effect for smaller pathways (15).
This method of calculating PAL showed a strong potential to suppress batch effects (15, 16, 21) and to minimize the artifacts introduced by the methods of experimental transcriptome analysis (13, 99). An absolute value of PAL reflects the strength of the pathway up/downregulation, while a positive or negative sign indicates its activation or suppression, accordingly (12). To calculate PAL, each sample RNA-seq profile was normalized on mean geometric levels of gene expression in the relevant control dataset.
Targeted Drug Efficiency Simulation
Drug score [Balanced Efficiency Score (BES)] for cancer-targeted drugs was calculated according to Tkachev et al. (35), whose method is based on the analysis of targeted molecular pathway activation and relative expression levels of drug target genes.
Testing of Intersection Significance
To test whether an observed number of overlapping differential genes or pathways between the two intersecting datasets is significant, for every comparison, we performed 1,000 random intersections according to Sorokin et al. (30). In every case, two random samples from the corresponding gene sets under comparison were taken. Then, these random samples were intersected for 1,000 iterations, and numbers of randomly obtained common genes were registered. Then, p-value of intersection significance was calculated as an expected fraction of random intersects that is equal to or higher than the experimentally observed number of overlapping genes.
Conclusions
We report here the first clinically annotated RNA-seq dataset for 31 tumor tissue samples of 25 patients with SIA, a rare CNS tumor. Bioinformatic analysis revealed the presence of characteristic KIAA1549-BRAF fusion transcripts in two samples and 16 new fusions each present in one SIA patient. For the first time, differential gene and molecular pathway analysis showed that the top SIA-upregulated pathways govern interactions with the immune cells, whereas the top inhibited pathways deal with normal neuronal activities. In addition, we found SIA-specific activation of molecular targets for cancer drugs: several tyrosine kinase inhibitors and thalidomide analogs. While this is a theoretical prediction, we propose that they could be further investigated as second-line treatment agents to aid in the prevention of SIA recurrence and progression.
Data Availability Statement
Transcriptomic data used across the analyses was deposited in the Sequencing Read Archive under BioProject accession: PRJNA763174. Normalized gene counts are presented in Supplementary Dataset 1. Description of clinically relevant (age, sex, diagnosis, tumor histotype) information is given in Supplementary Table S1.
Ethics Statement
The studies involving human participants were reviewed and approved by the Ethical Committee of the Burdenko Neurosurgical Center. The patients/participants provided their written informed consent to participate in this study.
Author Contributions
Software: MR. Visualization: MR. Validation: MR. Writing—original draft: MR, MS, and AB. Writing—review and editing: MR, MS, and AB. Investigation: MR. Data curation: MR. Conceptualization: MS and AB. Methodology: MS. Supervision: MS. Project administration: AB. Patient treatment: NK, DA, SK, and ST. Tissue sample collection: NK, DA, SK, and ST. Writing—review and editing: SK and ST. All authors have read and agreed to the published version of the article.
Funding
This research was funded by The Russian Foundation for Basic Research, grant number 18-29-01042.
Conflict of Interest
Author MR was employed by Omicsway Corp and AB was employed by Omicsway Corp. and Oncobox Ltd.
The remaining authors declare that the research was conducted in the absence of any commercial or financial relationships that could be construed as a potential conflict of interest.
Publisher’s Note
All claims expressed in this article are solely those of the authors and do not necessarily represent those of their affiliated organizations, or those of the publisher, the editors and the reviewers. Any product that may be evaluated in this article, or claim that may be made by its manufacturer, is not guaranteed or endorsed by the publisher.
Supplementary Material
The Supplementary Material for this article can be found online at: https://www.frontiersin.org/articles/10.3389/fonc.2022.837570/full#supplementary-material
Supplementary Figure 1 | Kaplan-Meier plots for progression-free and overall survival.
Supplementary Figure 2 | PCA plots for log-transformed counts processed using (A) quantile normalization; (B) DESeq2 normalization; (C) XPN; (D) CuBlock; (E, F) Shambhala.
Supplementary Figure 3 | Schematic representation of 16 different fusion transcripts identified by STAR-Fusion for spinal intramedullary astocytoma (SIA) transcriptomic samples
Supplementary Data Sheet 1 | Normalized gene counts.
Supplementary Table 1 | Clinical annotations of spinal intramedullary astrocytomas tissue specimens analysed in this study.
Supplementary Table 2 | Gene lists for the intersection of upregulated and downregulated differentially expressed gene sets between spinal intramedullary astrocytomas (SIA), GTEx healthy spinal cord, and ANTE healthy brain samples
Supplementary Table 3 | Pathway-activation-levels (PAL) from the differential pathway activation analysis estimated for 1611 molecular pathways from Oncobox pathway databank between spinal intramedullary astrocytomas (SIA) and GTEx healthy spinal cord samples.
Supplementary Table 4 | Pathway-activation-levels (PAL) from the differential pathway activation analysis calculated across 1611 molecular pathways from Oncobox pathway databank between spinal intramedullary astrocytomas (SIA) and ANTE normal brain samples.
Supplementary Table 5 | Simulated activities of anticancer targeted therapeutics (Drug Scores), calculated between spinal intramedullary astrocytomas (SIA) and GTEx healthy spinal cord samples.
Supplementary Table 6 | Simulated activities of anticancer targeted therapeutics (Drugs Scores), estimated between spinal intramedullary astrocytomas (SIA) and ANTE normal brain samples.
References
1. Das J, Hoang S, Mesfin F. Intramedullary Spinal Cord Tumors. Neurocirugia (2021) 2:213–8. doi: 10.1016/S1130-1473(91)71148-2
2. Milano MT, Johnson MD, Sul J, Mohile NA, Korones DN, Okunieff P, et al. Primary Spinal Cord Glioma: A Surveillance, Epidemiology, and End Results Database Study. J Neurooncol (2010) 98:83–92. doi: 10.1007/s11060-009-0054-7
3. Ogunlade J, Wiginton JG IV, Elia C, Odell T, Rao SC. Primary Spinal Astrocytomas: A Literature Review. Cureus (2019) 11:e5247. doi: 10.7759/CUREUS.5247
4. Townsend N, Handler M, Fleitz J, Foreman N. Intramedullary Spinal Cord Astrocytomas in Children. Pediatr Blood Cancer (2004) 43:629–32. doi: 10.1002/PBC.20082
5. Hussain I, Parker WE, Barzilai O, Bilsky MH. Surgical Management of Intramedullary Spinal Cord Tumors. Neurosurg Clin N Am (2020) 31:237–49. doi: 10.1016/J.NEC.2019.12.004
6. Helal A, Alvi MA, Everson M, Mikula AL, Cohen Cohen S, Bydon M, et al. Prognostic Factors Independently Associated With Improved Progression-Free Survival After Surgical Resection in Patients With Spinal Cord Astrocytomas: An Institutional Case Series. Oper Neurosurg (2022) 22:106–14. doi: 10.1227/ONS.0000000000000084
7. Raco A, Piccirilli M, Landi A, Lenzi J, Delfini R, Cantore G. High-Grade Intramedullary Astrocytomas: 30 Years’ Experience at the Neurosurgery Department of the University of Rome “Sapienza”. J Neurosurg Spine (2010) 12:144–53. doi: 10.3171/2009.6.SPINE08910
8. Raco A, Esposito V, Lenzi J, Piccirilli M, Delfini R, Cantore G. Long-Term Follow-Up of Intramedullary Spinal Cord Tumors: A Series of 202 Cases. Neurosurgery (2005) 56:972–81. doi: 10.1227/01.NEU.0000158318.66568.CC
9. Minehan K, Brown P, Scheithauer B, Krauss W, Wright M. Prognosis and Treatment of Spinal Cord Astrocytoma. Int J Radiat Oncol Biol Phys (2009) 73:727–33. doi: 10.1016/J.IJROBP.2008.04.060
10. Rodon J, Soria JC, Berger R, Miller WH, Rubin E, Kugel A, et al. Genomic and Transcriptomic Profiling Expands Precision Cancer Medicine: The WINTHER Trial. Nat Med (2019) 25:751–8. doi: 10.1038/s41591-019-0424-4
11. Poddubskaya E, Sorokin M, Garazha A, Glusker A, Moisseev A, Sekacheva M, et al. Clinical Use of RNA Sequencing and Oncobox Analytics to Predict Personalized Targeted Therapeutic Efficacy. J Clin Oncol (2020) 38:e13676–6. doi: 10.1200/JCO.2020.38.15_suppl.e13676
12. Borisov N, Sorokin M, Garazha A, Buzdin A. Quantitation of Molecular Pathway Activation Using RNA Sequencing Data. Methods Mol Biol (2020) 2063:189–206. doi: 10.1007/978-1-0716-0138-9_15
13. Ozerov IV, Lezhnina KV, Izumchenko E, Artemov AV, Medintsev S, Vanhaelen Q, et al. In Silico Pathway Activation Network Decomposition Analysis (iPANDA) as a Method for Biomarker Development. Nat Commun (2016) 7:13427. doi: 10.1038/ncomms13427
14. Buzdin A, Sorokin M, Garazha A, Sekacheva M, Kim E, Zhukov N, et al. Molecular Pathway Activation – New Type of Biomarkers for Tumor Morphology and Personalized Selection of Target Drugs. Semin Cancer Biol (2018) 53:110–24. doi: 10.1016/j.semcancer.2018.06.003
15. Borisov N, Suntsova M, Sorokin M, Garazha A, Kovalchuk O, Aliper A, et al. Data Aggregation at the Level of Molecular Pathways Improves Stability of Experimental Transcriptomic and Proteomic Data. Cell Cycle (2017) 16:1810–23. doi: 10.1080/15384101.2017.1361068
16. Sorokin M, Raevskiy M, Zottel A, Šamec N, Vidmar MS, Matjašič A, et al. Large-Scale Transcriptomics-Driven Approach Revealed Overexpression of CRNDE as a Poor Survival Prognosis Biomarker in Glioblastoma. Cancers (2021) 13:3419. doi: 10.3390/CANCERS13143419. 2021, Vol 13, Page 3419.
17. Artemov A, Aliper A, Korzinkin M, Lezhnina K, Jellen L, Zhukov N, et al. A Method for Predicting Target Drug Efficiency in Cancer Based on the Analysis of Signaling Pathway Activation. Oncotarget (2015) 6:29347–56. doi: 10.18632/oncotarget.5119
18. Zhu Q, Izumchenko E, Aliper AM, Makarev E, Paz K, Buzdin AA, et al. Pathway Activation Strength is a Novel Independent Prognostic Biomarker for Cetuximab Sensitivity in Colorectal Cancer Patients. Hum Genome Var (2015) 2:15009. doi: 10.1038/hgv.2015.9
19. Crispo F, Notarangelo T, Pietrafesa M, Lettini G, Storto G, Sgambato A, et al. Braf Inhibitors in Thyroid Cancer: Clinical Impact, Mechanisms of Resistance and Future Perspectives. Cancers (Basel) (2019) 11:1388. doi: 10.3390/cancers11091388
20. Borisov NM, Terekhanova NV, Aliper AM, Venkova LS, Smirnov PY, Roumiantsev S, et al. Signaling Pathways Activation Profiles Make Better Markers of Cancer Than Expression of Individual Genes. Oncotarget (2014) 5:10198–205. doi: 10.18632/oncotarget.2548
21. Kamashev D, Sorokin M, Kochergina I, Drobyshev A, Vladimirova U, Zolotovskaia M, et al. Human Blood Serum can Donor-Specifically Antagonize Effects of EGFR-Targeted Drugs on Squamous Carcinoma Cell Growth. Heliyon (2021) 7:E06394. doi: 10.1016/j.heliyon.2021.e06394
22. Davis C, Hitz B, Sloan C, Chan E, Davidson J, Gabdank I, et al. The Encyclopedia of DNA Elements (ENCODE): Data Portal Update. Nucleic Acids Res (2018) 46:D794–801. doi: 10.1093/NAR/GKX1081
23. Huang X, Stern D, Zhao H. Transcriptional Profiles From Paired Normal Samples Offer Complementary Information on Cancer Patient Survival–Evidence From TCGA Pan-Cancer Data. Sci Rep (2016) 6:20567. doi: 10.1038/SREP20567
24. Suntsova M, Gaifullin N, Allina D, Reshetun A, Li X, Mendeleeva L, et al. Atlas of RNA Sequencing Profiles for Normal Human Tissues. Sci Data (2019) 6:36. doi: 10.1038/s41597-019-0043-4
25. Consortium TGte. The GTEx Consortium Atlas of Genetic Regulatory Effects Across Human Tissues. Science (80- ) (2020) 369:1318–30. doi: 10.1126/SCIENCE.AAZ1776
26. Shabalin AA, Tjelmeland H, Fan C, Perou CM, Nobel AB. Merging Two Gene-Expression Studies via Cross-Platform Normalization. Bioinformatics (2008) 24:1154–60. doi: 10.1093/bioinformatics/btn083
27. Junet V, Farrés J, Mas JM, Daura X. CuBlock: A Cross-Platform Normalization Method for Gene-Expression Microarrays. Bioinformatics (2021) 37:2365–73. doi: 10.1093/bioinformatics/btab105
28. Borisov N, Shabalina I, Tkachev V, Sorokin M, Garazha A, Pulin A, et al. Shambhala: A Platform-Agnostic Data Harmonizer for Gene Expression Data 06 Biological Sciences 0604 Genetics. BMC Bioinf (2019) 20:66. doi: 10.1186/s12859-019-2641-8
29. Sorokin M, Borisov N, Kuzmin D, Gudkov A, Zolotovskaia M, Garazha A, et al. Algorithmic Annotation of Functional Roles for Components of 3,044 Human Molecular Pathways. Front Genet (2021) 12:617059. doi: 10.3389/fgene.2021.617059
30. Sorokin M, Ignatev K, Barbara V, Vladimirova U, Muraveva A, Suntsova M, et al. Molecular Pathway Activation Markers Are Associated With Efficacy of Trastuzumab Therapy in Metastatic HER2-Positive Breast Cancer Better Than Individual Gene Expression Levels. Biochem (2020) 85:758–72. doi: 10.1134/S0006297920070044
31. Benjamini Y, Drai D, Elmer G, Kafkafi N, Golani I. Controlling the False Discovery Rate in Behavior Genetics Research. Behav Brain Res (2001) 125:279–84. doi: 10.1016/S0166-4328(01)00297-2
32. Guan Q, Chen R, Yan H, Cai H, Guo Y, Li M, et al. Differential Expression Analysis for Individual Cancer Samples Based on Robust Within-Sample Relative Gene Expression Orderings Across Multiple Profiling Platforms. Oncotarget (2016) 7:68909–20. doi: 10.18632/ONCOTARGET.11996
33. Hewedi IH, Radwan NA, Shash LS, Elserry TH. Perspectives on the Immunologic Microenvironment of Astrocytomas. Cancer Manag Res (2013) 5:293. doi: 10.2147/CMAR.S48942
34. Pletschko T, Felnhofer A, Lamplmair D, Dorfer C, Czech T, Chocholous M, et al. Cerebellar Pilocytic Astrocytoma in Childhood: Investigating the Long-Term Impact of Surgery on Cognitive Performance and Functional Outcome. Dev Neurorehabil (2018) 21:415. doi: 10.1080/17518423.2017.1370502
35. Tkachev V, Sorokin M, Garazha A, Borisov N, Buzdin A. “Oncobox Method for Scoring Efficiencies of Anticancer Drugs Based on Gene Expression Data”. In: Astakhova K, Bukhari SA, editors. Methods Mol Biol. New York, NY:Springer US (2020). p. 235–55. doi: 10.1007/978-1-0716-0138-9_17
36. Buzdin A, Sorokin M, Garazha A, Glusker A, Aleshin A, Poddubskaya E, et al. RNA Sequencing for Research and Diagnostics in Clinical Oncology. Semin Cancer Biol (2019) 60:311–23. doi: 10.1016/j.semcancer.2019.07.010
37. Moisseev A, Albert E, Lubarsky D, Schroeder D, Clark J. Transcriptomic and Genomic Testing to Guide Individualized Treatment in Chemoresistant Gastric Cancer Case. Biomedicines (2020) 8:67. doi: 10.3390/BIOMEDICINES8030067
38. Kim EL, Sorokin M, Kantelhardt SR, Kalasauskas D, Sprang B, Fauss J, et al. Intratumoral Heterogeneity and Longitudinal Changes in Gene Expression Predict Differential Drug Sensitivity in Newly Diagnosed and Recurrent Glioblastoma. Cancers (Basel) (2020) 12:520. doi: 10.3390/cancers12020520
39. Hassler MR, Sax C, Flechl B, Ackerl M, Preusser M, Hainfellner JA, et al. Thalidomide as Palliative Treatment in Patients With Advanced Secondary Glioblastoma. Oncology (2015) 88:173–9. doi: 10.1159/000368903
40. Gesundheit B, Moser A, Or R, Klement G. Successful Antiangiogenic Therapy for Neuroblastoma With Thalidomide. J Clin Oncol (2007) 25:5321–4. doi: 10.1200/JCO.2007.12.3331
41. Fine HA, Figg WD, Jaeckle K, Wen PY, Kyritsis AP, Loeffler JS, et al. Phase II Trial of the Antiangiogenic Agent Thalidomide in Patients With Recurrent High-Grade Gliomas. J Clin Oncol (2000) 18:708–15. doi: 10.1200/JCO.2000.18.4.708
42. Rabbani G, Benzil D, Wallam MN, Chen B, Hoang A, Kancherla R, et al. Combination Therapy With Thalidomide, Temozolomide and Tamoxifen Improves Quality of Life in Patients With Malignant Astrocytomas. Anticancer Res (2007) 27:2729–36.
43. Fangusaro J, Mitchell DA, Kocak M, Robinson GW, Baxter PA, Hwang EI, et al. Phase 1 Study of Pomalidomide in Children With Recurrent, Refractory, and Progressive Central Nervous System Tumors: A Pediatric Brain Tumor Consortium Trial. Pediatr Blood Cancer (2021) 68:e28756. doi: 10.1002/PBC.28756
44. Luo Z, Wang B, Liu H, Shi L. TNF Inhibitor Pomalidomide Sensitizes Glioblastoma Cells to EGFR Inhibition. Ann Clin Lab Sci (2020) 50:474–80.
45. Detti B, Scoccianti S, Lucidi S, Maragna V, Teriaca MA, Ganovelli M, et al. Regorafenib in Glioblastoma Recurrence: A Case Report. Cancer Treat Res Commun (2021) 26:100263. doi: 10.1016/J.CTARC.2020.100263
46. Kebir S, Rauschenbach L, Radbruch A, Lazaridis L, Schmidt T, Stoppek AK, et al. Regorafenib in Patients With Recurrent High-Grade Astrocytoma. J Cancer Res Clin Oncol (2019) 145:1037–42. doi: 10.1007/S00432-019-02868-5
47. Subramonian D, Phanhthilath N, Rinehardt H, Flynn S, Huo Y, Zhang J, et al. Regorafenib is Effective Against Neuroblastoma In Vitro and In Vivo and Inhibits the RAS/MAPK, PI3K/Akt/mTOR and Fos/Jun Pathways. Br J Cancer (2020) 123:568–79. doi: 10.1038/S41416-020-0905-8
48. Reardon DA, Pan E, Fan J, Mink J, Barboriak DP, Vredenburgh JJ, et al. A Phase 2 Trial of the Multitargeted Kinase Inhibitor Lenvatinib (E7080) in Patients (PTS) With Recurrent Glioblastoma (GBM) And Disease Progression Following Prior Bevacizumab Treatment. Ann Oncol (2012) 23:ix146. doi: 10.1016/S0923-7534(20)33001-5
49. dela Cruz FS, Fox E, Muscal JA, Kirov I, Geller JI, DuBois SG, et al. A Phase I/II Study of Lenvatinib (LEN) Plus Everolimus (EVE) in Recurrent and Refractory Pediatric Solid Tumors, Including CNS Tumors. J Clin Oncol (2020) 38:10527–7. doi: 10.1200/JCO.2020.38.15_SUPPL.10527
50. Muhic A, Poulsen HS, Sorensen M, Grunnet K, Lassen U. Phase II Open-Label Study of Nintedanib in Patients With Recurrent Glioblastoma Multiforme. J Neurooncol (2013) 111:205–12. doi: 10.1007/S11060-012-1009-Y
51. Norden AD, Schiff D, Ahluwalia MS, Lesser GJ, Nayak L, Lee EQ, et al. Phase II Trial of Triple Tyrosine Kinase Receptor Inhibitor Nintedanib in Recurrent High-Grade Gliomas. J Neurooncol (2015) 121:297–302. doi: 10.1007/S11060-014-1631-Y
52. Karajannis MA, Legault G, Fisher MJ, Milla SS, Cohen KJ, Wisoff JH, et al. Phase II Study of Sorafenib in Children With Recurrent or Progressive Low-Grade Astrocytomas. Neuro Oncol (2014) 16:1408–16. doi: 10.1093/NEUONC/NOU059
53. Hassler MR, Ackerl M, Flechl B, Sax C, Wöhrer A, Widhalm G, et al. Sorafenib for Patients With Pretreated Recurrent or Progressive High-Grade Glioma: A Retrospective, Single-Institution Study. Anticancer Drugs (2014) 25:723–8. doi: 10.1097/CAD.0000000000000077
54. Kakodkar NC, Peddinti RR, Tian Y, Guerrero LJ, Chlenski A, Yang Q, et al. Sorafenib Inhibits Neuroblastoma Cell Proliferation and Signaling, Blocks Angiogenesis, and Impairs Tumor Growth. Pediatr Blood Cancer (2012) 59:642–7. doi: 10.1002/PBC.24004
55. Okada K, Nakano Y, Yamasaki K, Nitani C, Fujisaki H, Hara J. Sorafenib Treatment in Children With Relapsed and Refractory Neuroblastoma: An Experience of Four Cases. Cancer Med (2016) 5:1947–9. doi: 10.1002/CAM4.784
56. Sharma M, Schilero C, Peereboom DM, Hobbs BP, Elson P, Stevens GHJ, et al. Phase II Study of Dovitinib in Recurrent Glioblastoma. J Neurooncol (2019) 144:359–68. doi: 10.1007/S11060-019-03236-6
57. Brahm CG, Van Linde ME, Labots M, Kouwenhoven MCM, Sanchez Aliaga E, Enting RH, et al. 436tip A Phase II/III Trial of High-Dose, Intermittent Sunitinib in Patients With Recurrent Glioblastoma: The STELLAR Study. Ann Oncol (2019) 30:v143–4. doi: 10.1093/annonc/mdz243
58. Pan E, Yu D, Yue B, Potthast L, Chowdhary S, Smith P, et al. A Prospective Phase II Single-Institution Trial of Sunitinib for Recurrent Malignant Glioma. J Neurooncol (2012) 110:111–8. doi: 10.1007/S11060-012-0943-Z
59. Calero R, Morchon E, Johnsen JI, Serrano R. Sunitinib Suppress Neuroblastoma Growth Through Degradation of MYCN and Inhibition of Angiogenesis. PloS One (2014) 9:e95628. doi: 10.1371/JOURNAL.PONE.0095628
60. Kalpathy-Cramer J, Chandra V, Da X, Ou Y, Emblem KE, Muzikansky A, et al. Phase II Study of Tivozanib, an Oral VEGFR Inhibitor, in Patients With Recurrent Glioblastoma. J Neurooncol (2017) 131:603–10. doi: 10.1007/S11060-016-2332-5
61. Iwamoto FM, Lamborn KR, Robins HI, Mehta MP, Chang SM, Butowski NA, et al. Phase II Trial of Pazopanib (GW786034), an Oral Multi-Targeted Angiogenesis Inhibitor, for Adults With Recurrent Glioblastoma (North American Brain Tumor Consortium Study 06-02). Neuro Oncol (2010) 12:855. doi: 10.1093/NEUONC/NOQ025
62. Kaley TJ, Panageas KS, Pentsova EI, Mellinghoff IK, Nolan C, Gavrilovic I, et al. Phase I Clinical Trial of Temsirolimus and Perifosine for Recurrent Glioblastoma. Ann Clin Transl Neurol (2020) 7:429–36. doi: 10.1002/ACN3.51009
63. Becher OJ, Millard NE, Modak S, Kushner BH, Haque S, Spasojevic I, et al. A Phase I Study of Single-Agent Perifosine for Recurrent or Refractory Pediatric CNS and Solid Tumors. PloS One (2017) 12:e0178593. doi: 10.1371/JOURNAL.PONE.0178593
64. Gortany NK, Panahi G, Ghafari H, Shekari M, Ghazi-Khansari M. Foretinib Induces G2/M Cell Cycle Arrest, Apoptosis, and Invasion in Human Glioblastoma Cells Through C-MET Inhibition. Cancer Chemother Pharmacol (2021) 87:827–42. doi: 10.1007/S00280-021-04242-0
65. Fotoohi M, Hadi N, Namazi F. Effect of Foretinib on Matrix Metalloproteinase-2 (MMP2) Expression in Glioblastoma. Res Mol Med (2019) 6:20–7. doi: 10.18502/RMM.V6I4.4800
66. Schiff D, Sarkaria J. Dasatinib in Recurrent Glioblastoma: Failure as a Teacher. Neuro Oncol (2015) 17:910–1. doi: 10.1093/NEUONC/NOV086
67. Morandi F, Amoroso L, Dondero A, Castriconi R, Parodi S, Luksch R, et al. Updated Clinical and Biological Information From the Two-Stage Phase II Study of Imatinib Mesylate in Subjects With Relapsed/Refractory Neuroblastoma. Oncoimmunology (2018) 7:e1468953. doi: 10.1080/2162402X.2018.1468953/SUPPL_FILE/KONI_A_1468953_SM4972.ZIP
68. Beppu K, Jaboine J, Merchant MS, Mackall CL, Thiele CJ. Effect of Imatinib Mesylate on Neuroblastoma Tumorigenesis and Vascular Endothelial Growth Factor Expression. J Natl Cancer Inst (2004) 96:46–55. doi: 10.1093/JNCI/DJH004
69. Raymond E, Brandes AA, Dittrich C, Fumoleau P, Coudert B, Clement PMJ, et al. Phase II Study of Imatinib in Patients With Recurrent Gliomas of Various Histologies: A European Organisation for Research and Treatment of Cancer Brain Tumor Group Study. J Clin Oncol (2008) 26:4659–65. doi: 10.1200/JCO.2008.16.9235
70. McLaughlin ME, Robson CD, Kieran MW, Jacks T, Pomeroy SL, Cameron S. Marked Regression of Metastatic Pilocytic Astrocytoma During Treatment With Imatinib Mesylate (STI-571, Gleevec): A Case Report and Laboratory Investigation. J Pediatr Hematol Oncol (2003) 25:644–8. doi: 10.1097/00043426-200308000-00012
71. Ferguson SD, Zhou S, Huse JT, de Groot JF, Xiu J, Subramaniam DS, et al. Targetable Gene Fusions Associate With the IDH Wild-Type Astrocytic Lineage in Adult Gliomas. J Neuropathol Exp Neurol (2018) 77:437. doi: 10.1093/JNEN/NLY022
72. Parker B, Zhang W. Fusion Genes in Solid Tumors: An Emerging Target for Cancer Diagnosis and Treatment. Chin J Cancer (2013) 32:594–603. doi: 10.5732/CJC.013.10178
73. Samii A, Sorokin M, Kar S, Makovskaia L, Garazha A, Hartmann C, et al. Case of Multifocal Glioblastoma With Four Fusion Transcripts of ALK, FGFR2, NTRK2, and NTRK3 Genes Stresses the Need for Tumor Tissue Multisampling for Transcriptomic Analysis. Cold Spring Harb Mol Case Stud (2021) 7:a006100. doi: 10.1101/MCS.A006100
74. Haas BJ, Dobin A, Li B, Stransky N, Pochet N, Regev A. Accuracy Assessment of Fusion Transcript Detection via Read-Mapping and De Novo Fusion Transcript Assembly-Based Methods. Genome Biol (2019) 20:213. doi: 10.1186/s13059-019-1842-9
75. Hawkins C, Walker E, Mohamed N, Zhang C, Jacob K, Shirinian M, et al. BRAF-KIAA1549 Fusion Predicts Better Clinical Outcome in Pediatric Low-Grade Astrocytoma. Clin Cancer Res (2011) 17:4790–8. doi: 10.1158/1078-0432.CCR-11-0034
76. Hasselblatt M, Riesmeier B, Lechtape B, Brentrup A, Stummer W, Albert F, et al. BRAF-KIAA1549 Fusion Transcripts are Less Frequent in Pilocytic Astrocytomas Diagnosed in Adults. Neuropathol Appl Neurobiol (2011) 37:803–6. doi: 10.1111/J.1365-2990.2011.01193.X
77. Yuan C, Yao Q, Cheng L, Zhang C, Ma L, Guan J, et al. Prognostic Factors and Nomogram Prediction of Survival Probability in Primary Spinal Cord Astrocytoma Patients. J Neurosurg Spine (2021) 35:651–62. doi: 10.3171/2021.1.SPINE202017
78. Louis DN, Perry A, Reifenberger G, von Deimling A, Figarella-Branger D, Cavenee WK, et al. The 2016 World Health Organization Classification of Tumors of the Central Nervous System: A Summary. Acta Neuropathol (2016) 131:803–20. doi: 10.1007/s00401-016-1545-1
79. Palpan Flores A, Rodríguez Domínguez V, Esteban Rodriguez I, Román de Aragón M, Zamarrón Pérez Á. H3K27M-Mutant Glioma in Thoracic Spinal Cord and Conus Medullaris With Pilocytic Astrocytoma Morphology: Case Report and Review of the Literature. Br J Neurosurg (2021), 1–7. doi: 10.1080/02688697.2021.1988054
80. Biczok A, Strübing FL, Eder JM, Egensperger R, Schnell O, Zausinger S, et al. Molecular Diagnostics Helps to Identify Distinct Subgroups of Spinal Astrocytomas. Acta Neuropathol Commun (2021) 9:119. doi: 10.1186/s40478-021-01222-6
81. Zhang M, Iyer RR, Azad TD, Wang Q, Garzon-Muvdi T, Wang J, et al. Genomic Landscape of Intramedullary Spinal Cord Gliomas. Sci Rep (2019) 9:18722. doi: 10.1038/s41598-019-54286-9
82. Tian B, Zhang Y, Zhang J. Periostin is a New Potential Prognostic Biomarker for Glioma. Tumor Biol (2014) 35:5877–83. doi: 10.1007/s13277-014-1778-3
83. Mikheev AM, Mikheeva SA, Trister AD, Tokita MJ, Emerson SN, Parada CA, et al. Periostin is a Novel Therapeutic Target That Predicts and Regulates Glioma Malignancy. Neuro Oncol (2015) 17:372–82. doi: 10.1093/neuonc/nou161
84. Lin C, Lecca D, Yang L, Luo W, Scerba M, Tweedie D, et al. 3,6’-Dithiopomalidomide Reduces Neural Loss, Inflammation, Behavioral Deficits in Brain Injury and Microglial Activation. Elife (2020) 9:1–78. doi: 10.7554/ELIFE.54726
85. Jeyapalan J, Doctor G, Jones T, Alberman S, Tep A, Haria C, et al. DNA Methylation Analysis of Paediatric Low-Grade Astrocytomas Identifies a Tumour-Specific Hypomethylation Signature in Pilocytic Astrocytomas. Acta Neuropathol Commun (2016) 4:54. doi: 10.1186/S40478-016-0323-6
86. Debinski W, Gibo D. Fos-Related Antigen 1 (Fra-1) Pairing With and Transactivation of JunB in GBM Cells. Cancer Biol Ther (2011) 11:254–62. doi: 10.4161/CBT.11.2.13953
87. Zhang L, Liu H, Mu X, Cui J, Peng Z. Dysregulation of Fra1 Expression by Wnt/β-Catenin Signalling Promotes Glioma Aggressiveness Through Epithelial-Mesenchymal Transition. Biosci Rep (2017) 37:BSR20160643. doi: 10.1042/BSR20160643
88. Amos S, Redpath G, Dipierro C, Carpenter J, Hussaini I. Epidermal Growth Factor Receptor-Mediated Regulation of Urokinase Plasminogen Activator Expression and Glioblastoma Invasion via C-SRC/MAPK/AP-1 Signaling Pathways. J Neuropathol Exp Neurol (2010) 69:582–92. doi: 10.1097/NEN.0B013E3181E008FE
89. Shi R, Peng H, Yuan X, Zhang X, Zhang Y, Fan D, et al. Down-Regulation of C-Fos by shRNA Sensitizes Adriamycin-Resistant MCF-7/ADR Cells to Chemotherapeutic Agents via P-Glycoprotein Inhibition and Apoptosis Augmentation. J Cell Biochem (2013) 114:1890–900. doi: 10.1002/JCB.24533
90. Zhang M, Hoyle R, Ma Z, Sun B, Cai W, Cai H, et al. FOSL1 Promotes Metastasis of Head and Neck Squamous Cell Carcinoma Through Super-Enhancer-Driven Transcription Program. Mol Ther (2021) 29:2583–600. doi: 10.1016/J.YMTHE.2021.03.024
91. Dobin A, Davis CA, Schlesinger F, Drenkow J, Zaleski C, Jha S, et al. STAR: Ultrafast Universal RNA-Seq Aligner. Bioinformatics (2013) 29:15–21. doi: 10.1093/bioinformatics/bts635
92. Bartlett P, Shawe-taylor J. Generalization Performance of Support Vector Machines and Other Pattern Classifiers, in: Adv Kernel Methods Support Vector Learn (1999). Available at: http://citeseerx.ist.psu.edu/viewdoc/summary?doi=10.1.1.42.6950 (Accessed June 26, 2019).
93. Borisov N, Buzdin A. New Paradigm of Machine Learning (ML) in Personalized Oncology: Data Trimming for Squeezing More Biomarkers From Clinical Datasets. Front Oncol (2019) 9:658. doi: 10.3389/fonc.2019.00658
94. Borisov N, Sorokin M, Tkachev V, Garazha A, Buzdin A. Cancer Gene Expression Profiles Associated With Clinical Outcomes to Chemotherapy Treatments. BMC Med Genomics (2020) 13:111. doi: 10.1186/s12920-020-00759-0
95. Zhao Y, Wong L, Goh Bin WW. How to do Quantile Normalization Correctly for Gene Expression Data Analyses. Sci Rep (2020) 10:1–11. doi: 10.1038/s41598-020-72664-6
96. Love MI, Huber W, Anders S. Moderated Estimation of Fold Change and Dispersion for RNA-Seq Data With Deseq2. Genome Biol (2014) 15:550. doi: 10.1186/s13059-014-0550-8
97. Blighe K, Rana S, Lewis M. EnhancedVolcano: Publication-Ready Volcano Plots With Enhanced Colouring and Labeling (2018). Available at: https://github.com/kevinblighe/EnhancedVolcano.
98. Feng J, Meyer CA, Wang Q, Liu JS, Shirley Liu X, Zhang Y. GFOLD: A Generalized Fold Change for Ranking Differentially Expressed Genes From RNA-Seq Data. Bioinformatics (2012) 28:2782–8. doi: 10.1093/BIOINFORMATICS/BTS515
Keywords: spinal intramedullary astrocytoma, glioblastoma, transcriptomic (RNA-Seq), RNA sequencing (RNA-seq), molecular pathway activation, gene expression, spinal cord neoplasms
Citation: Konovalov N, Timonin S, Asyutin D, Raevskiy M, Sorokin M, Buzdin A and Kaprovoy S (2022) Transcriptomic Portraits and Molecular Pathway Activation Features of Adult Spinal Intramedullary Astrocytomas. Front. Oncol. 12:837570. doi: 10.3389/fonc.2022.837570
Received: 16 December 2021; Accepted: 21 February 2022;
Published: 21 March 2022.
Edited by:
Tzu Pin Lu, National Taiwan University, TaiwanReviewed by:
Giorgio Carrabba, University of Milano-Bicocca, ItalyMirza Pojskic, University Hospital of Giessen and Marburg, Germany
Nir Shimony, Geisinger Health System, United States
Copyright © 2022 Konovalov, Timonin, Asyutin, Raevskiy, Sorokin, Buzdin and Kaprovoy. This is an open-access article distributed under the terms of the Creative Commons Attribution License (CC BY). The use, distribution or reproduction in other forums is permitted, provided the original author(s) and the copyright owner(s) are credited and that the original publication in this journal is cited, in accordance with accepted academic practice. No use, distribution or reproduction is permitted which does not comply with these terms.
*Correspondence: Anton Buzdin, YnV6ZGluQG9uY29ib3guY29t