 Zhen-Xiao Yang1,2†
 Peng Hu
 Xudong Liu
- 1Department of Epidemiology, School of Public Health, Sun Yat-sen University, Guangzhou, China
- 2School of Public Health, Guangdong Pharmaceutical University, Guangzhou, China
- 3Department of Pediatric Surgery, The Sixth Affiliated Hospital, Sun Yat-sen University, Guangzhou, China
- 4Department of General Surgery, Xi’an Aerospace General Hospital, Xi’an, China
- 5School of Public Health and Emergency Management, Southern University of Science and Technology, Shenzhen, China
- 6Health Effects Institute, Boston, MA, United States
- 7Department of Gastroenterology, The First Affiliated Hospital of Sun Yat-sen University, Guangzhou, China
Background: Serum pepsinogens are serological biomarkers of gastric atrophy, and the latter is a risk factor for esophageal squamous cell carcinoma (ESCC). However, the association of serum pepsinogens with ESCC risk remains unclear. This systematic review and meta-analysis aimed to assess the relationship between serum pepsinogen I (PGI) and pepsinogen I: pepsinogen II ratio (PGR) and ESCC risk.
Methods: PubMed, Embase, and Web of Science were searched for articles on the effect of serum PGI and PGR on ESCC risk, published up to the end of February 2022. Meta-analysis with a random-effect model was used to calculate pooled odds ratios (ORs) and 95% confidence intervals (CIs).
Results: Five case–control studies and three prospective studies were included. In comparison with the high categories, the low categories of serum PGI (OR: 1.92, 95% CI: 1.45–2.56) and PGR (OR: 1.70, 95% CI: 1.01–2.85) were associated with an increased risk of ESCC, although a substantial heterogeneity was observed in serum PGR (I2 = 60.2%, P = 0.028) rather than in serum PGI (I2 = 46.4%, P = 0.070). In stratified analysis by study quality, the significant risk effect on ESCC was remained for PGI (OR: 2.05, 95% CI: 1.48–2.84) and PGR (OR: 2.07, 95% CI: 1.17–3.75) when only the studies with high quality were pooled.
Conclusions: Based on the available studies, although limited in number, this systematic review along with meta-analysis suggests that low serum PGI and low PGR may be related to an increased risk of ESCC. This present study provides evidence for using serum pepsinogen biomarkers in predicting ESCC. More delicate well-designed cohort studies with high study quality are needed, and dose–response analysis should be performed.
Introduction
Esophageal cancer is one of the most common malignant tumors worldwide. It ranks seventh in cancer incidence and sixth in cancer mortality worldwide (1, 2). Esophageal squamous cell carcinoma (ESCC) is one of dominant histological subtypes, accounting for nearly 90% of all esophageal cancer cases in the world (3, 4). More than half of ESCC patients have progressed to the advanced stage when clinically diagnosed, and the overall 5-year survival rate is less than 20% (5, 6).
Early detection, early diagnosis, and early treatment can improve the patient’s condition and thereafter increase the survival of patients. Invasive and costly endoscopy and biopsy for histopathology are the gold standard for diagnosis of esophageal cancer (7). However, in most high-risk populations, the high cost and invasiveness of surgery are not acceptable. Therefore, it is necessary to develop simple, inexpensive, and accurate minimally invasive tools to identify asymptomatic high-risk individuals at the early stage. In recent years, many epidemiological studies have proved that blood biomarkers represent the most likely candidate indicators to promote the early detection of esophageal cancer (8–10). Gastric atrophy was evidenced to be a risk factor for ESCC (11, 12), and serum pepsinogens are serological biomarkers of gastric atrophy (13, 14). Serum pepsinogens are categorized into two groups: pepsinogen I (PGI) and pepsinogen II (PGII). The former is secreted by epithelium of the gastric body, and the latter is secreted by epithelium in both gastric antrum and gastric mucosa (15, 16). Atrophy of the gastric mucosa leads to a decrease in PGI, but no change in PGII, which further leads to a decrease in the pepsinogen I: pepsinogen II ratio (PGR). Several epidemiological studies found that low serum PGI and low serum PGR were associated with an increased risk of ESCC (17–21); however, other studies did not find such association (22–24).
Two previous meta-analyses (25, 26) examined the association by pooling potential studies, but the flaws in both studies affected the credibility and application of the results. Islami and colleagues (25) did the meta-analysis by synthesizing seven studies; nonetheless, two studies (27, 28) included in this meta-analysis did not examine the association between serum pepsinogens and risk of ESCC. The study by Yokoyama and colleagues examined the association of atrophic gastritis with risk of gastric cancer among Japanese ESCC male patients with alcoholic habits (27), and the study by Kamangar et al. examined the association of PGR with the risk of esophageal squamous dysplasia (28). Another meta-analysis (26) examined the association of ESCC risk with PGI and PGR by only pooling results from three studies (20, 22, 23); however, other epidemiological studies also examined the effect of PGI (17–19, 21, 24) and PGR (18, 19, 24) on ESCC risk; the incomplete inclusion of literature might lead to bias in the systematic review and meta-analysis.
Therefore, this systematic review and meta-analysis aimed to assess the association of ESCC risk with serum PGI and PGR by pooling the existing evidence.
Methods
Search Strategy and Selection Criteria
This systematic review and meta-analysis was conducted by following the PRISMA statement (29). The two researchers (Z-XY, WZ) independently searched the publications, reviewed the included studies, and extracted the relevant information from each study. Any disagreement between the third researchers was resolved by discussing with the third researchers (XL).
A systematic literature search for studies published in PubMed, Embase, and Web of Science was conducted up to the end of February 2022 for original studies in humans on the association between serum pepsinogens and ESCC, with no language restriction. The following search strategy was adopted: (“pepsinogen I” OR “pepsinogen II” OR “PGI” OR “PGII” OR “pepsinogen I: pepsinogen II ratio” OR “PGI: PGII” OR “PGI/II” OR “PGR” OR “PG” OR “pepsinogen” OR “gastric atrophy” OR “pepsinogens” [Mesh] OR ‘‘gastritis, atrophic’’[Mesh]) AND (“esophageal cancer” OR “esophageal carcinoma” OR “esophageal tumor” OR “esophageal neoplasms” OR “esophageal squamous dysplasia” OR “esophageal squamous cell carcinoma” OR “esophageal squamous cell carcinoma” [Mesh]). Reference and citation tracking was also conducted to retrieve potential studies. A more detailed search strategy is shown in Supplementary Table S1.
Eligible studies met the following criteria: study design of the case–control study or cohort study, ESCC cases were diagnosed by histological examination, the association of serum pepsinogens with ESCC incidence was examined, and the relative risk (RR) or odds ratios (ORs) and their 95% confidence interval (CIs) were reported or could be calculated. Cross-sectional studies, comments, editorials, animal studies, and abstracts were excluded. For multiple reports of the same biomarker from the same research population, only the most recent or informative report was included.
Quality Assessment
The quality of included studies was evaluated using the Newcastle–Ottawa Scale (NOS) (30, 31). This scale contains eight items, which are categorized into three domains: selection of participants, comparability between participants in different subgroups, and assessment of exposure (case–control study) or outcome (cohort study). The total score ranged from 0 to 9, with a higher score indicating a better methodological quality. A study was assessed as low, moderate, or high quality if the total score was in the range of 0–3, 4–6, or 7–9 score, respectively.
Data Extraction
The following information was collected from each included study, including first author, year of publication, country where the study was performed, study design, follow-up period for cohort studies, period when subjects were recruited for case–control studies, number of cases and total individuals for cohort studies, number of cases and controls for case–control studies, median or mean of age, male proportion, serum pepsinogen biomarkers and boundary point, risk estimates and their 95% CIs, and the covariates. The cutoff points for serum PGI and PGR varied in different studies. When the results for several cutoff points were provided in a study, we selected those which were more consistent with the cutoff points in other studies, that is, PGI <25 to ≤ 70 μg/l and PGR≤ 2 to ≤3.
Statistical Analysis
A meta-analysis was conducted to evaluate the pooled effect of low level of serum PGI and PGR on the ESCC risk by comparing with the correspondingly high level. The random-effect model was used if the heterogeneity was observed (I2 ≥ 50% and P ≤ 0.1); otherwise, the fixed-effect model was adopted (32). In order to facilitate understanding, OR was used to display the pooled effect. The heterogeneity among the studies was assessed using the I2 statistic and the Q-test. When studies reported both crude and adjusted ORs and 95% CIs, the fully adjusted estimates were selected. Publication bias was assessed by funnel plot and Egger’s test (33, 34).
To explore potential sources of heterogeneity, several subgroup analyses were conducted. Since Helicobacter pylori was an important factor for ESCC, and the infection rate of Helicobacter pylori may be different in Western and Eastern countries (35), we performed a subgroup analysis based on the study region (Asia or Europe). Compared with the case–control study, the cohort study is more capable of demonstrating causality; hence, we conducted a subgroup analysis based on study type (cohort study or case–control study). Moreover, a subgroup analysis was carried out according to the quality of included studies (high-quality, not high-quality). Sensitivity analysis was conducted to assess the effect of a single study on the pooled results by reducing each study one time (36). All analysis was conducted by using Stata version 15.0 (Stata Corporation, College Station, TX, USA).
Results
A total of 2,190 studies were found from three databases (548 from PubMed, 485 from Embase, and 1,157 from Web of Science), and two studies were found from reference tracking. A total of 1,549 studies were left after duplicate removal. Of 42 studies for further full-text reviewing after the abstract screening, 34 studies were excluded for the reason of unavailable outcomes of interest, inappropriate exposure, conference abstract, review, and studies in the same population. Finally, eight studies (17–24) were included in the meta-analysis. Figure 1 shows the flowchart of literature screening.
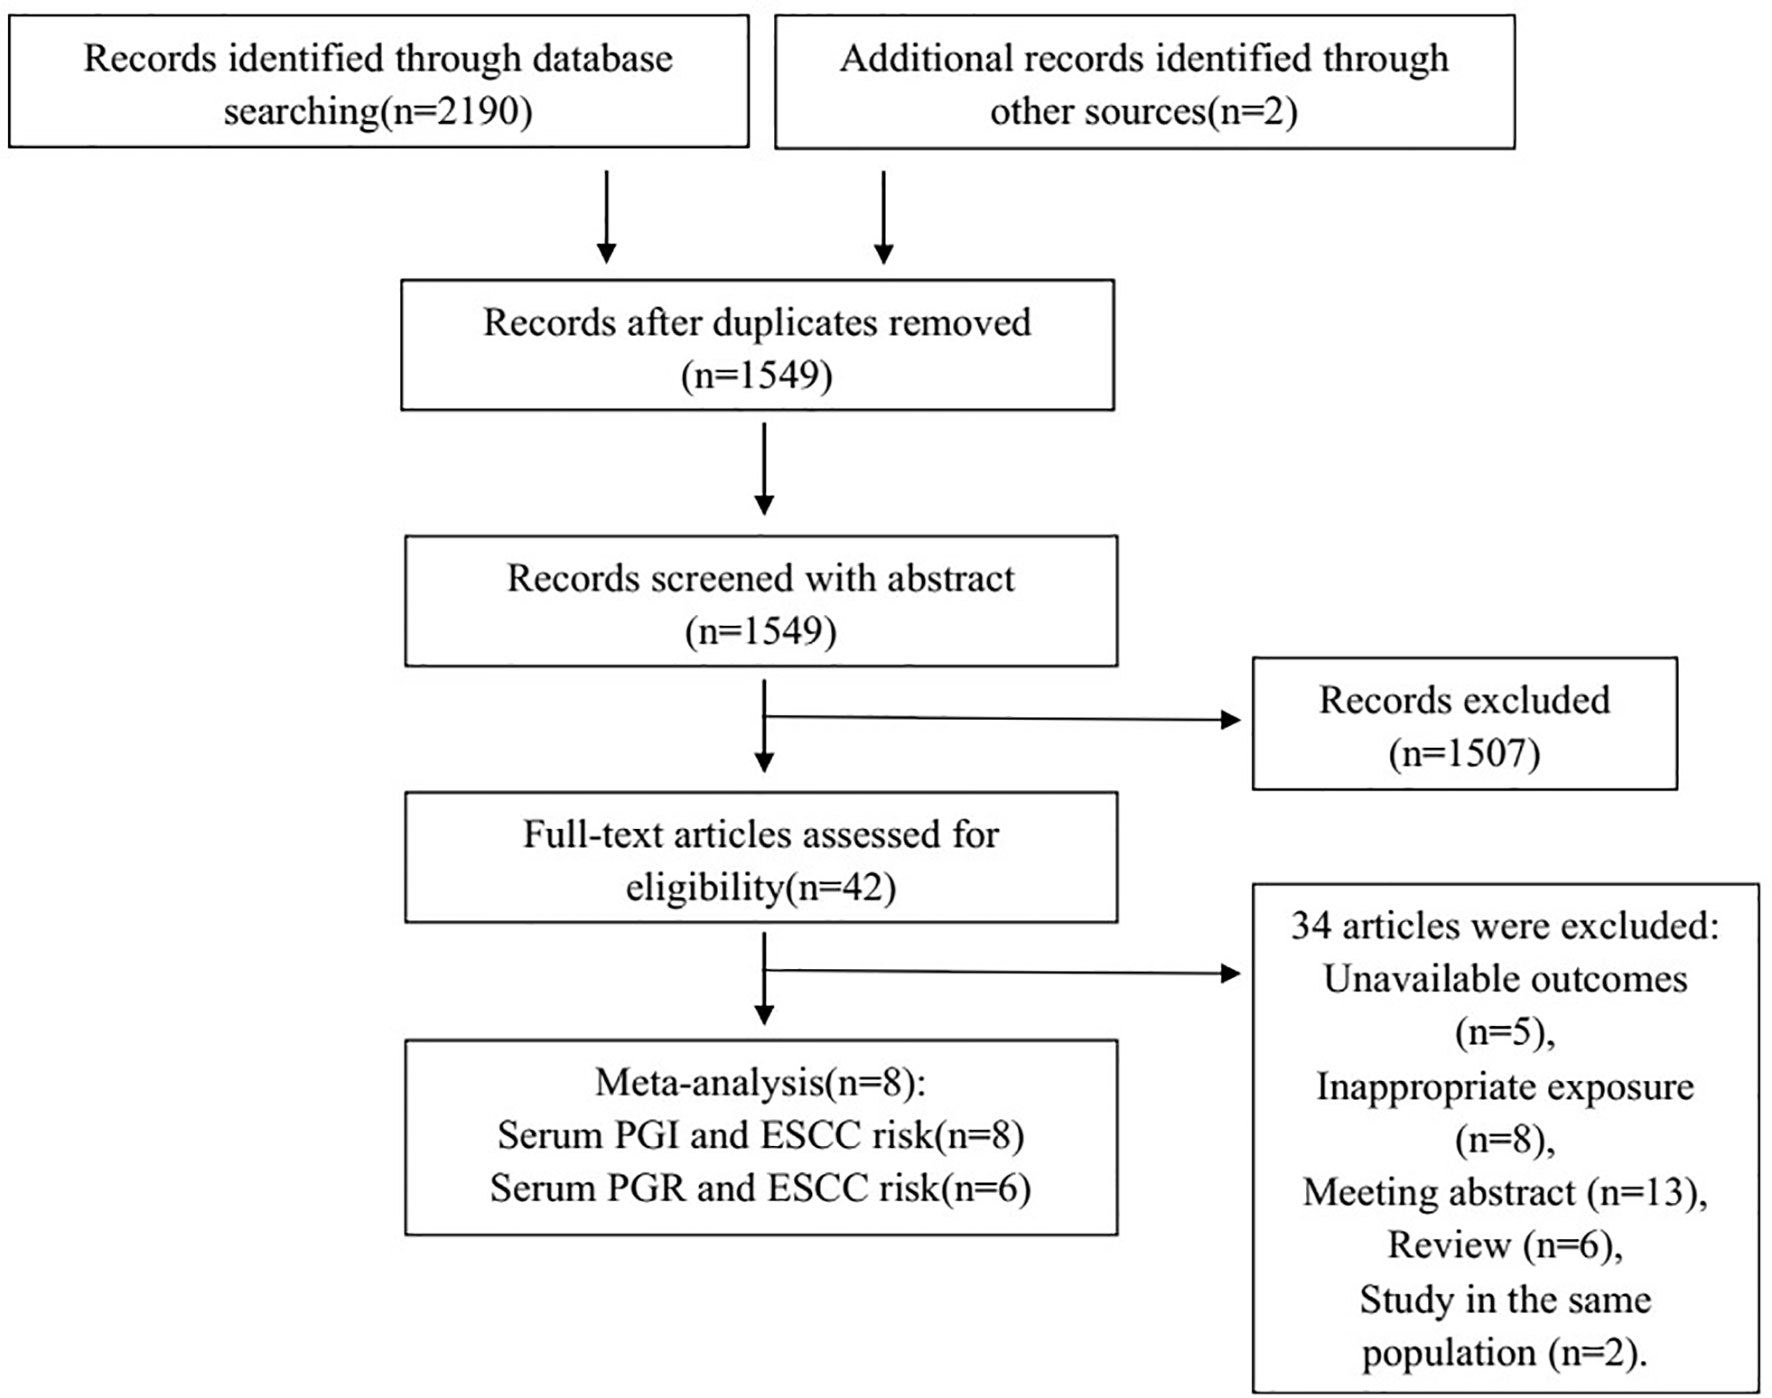
Figure 1 Flowchart of selection of eligible studies. PGI, pepsinogen I; PGR, pepsinogen I: pepsinogen II ratio; ESCC, esophageal squamous cell carcinoma.
Table 1 shows a summary of the characteristics of the included studies. The mean or median of age ranged from 40 to 85 years. Three studies (21–23) were carried out in China, one in Sweden (17), one in Japan (18), one in Iran (19), one in Finland (20), and one in Germany (24). Five were case–control studies (17–19, 21, 24), and three were prospective studies [one nested case–control study (20), one case–cohort study (22), and one cohort study (23)]. Six studies (17–22) adjusted for smoking and alcohol drinking when estimating the effect, and the other two studies did not (23, 24). For the study quality, six studies (17–22) were assessed as having good quality, and the other two were assessed as having fair quality (23, 24) (Supplementary Tables S2, S3).
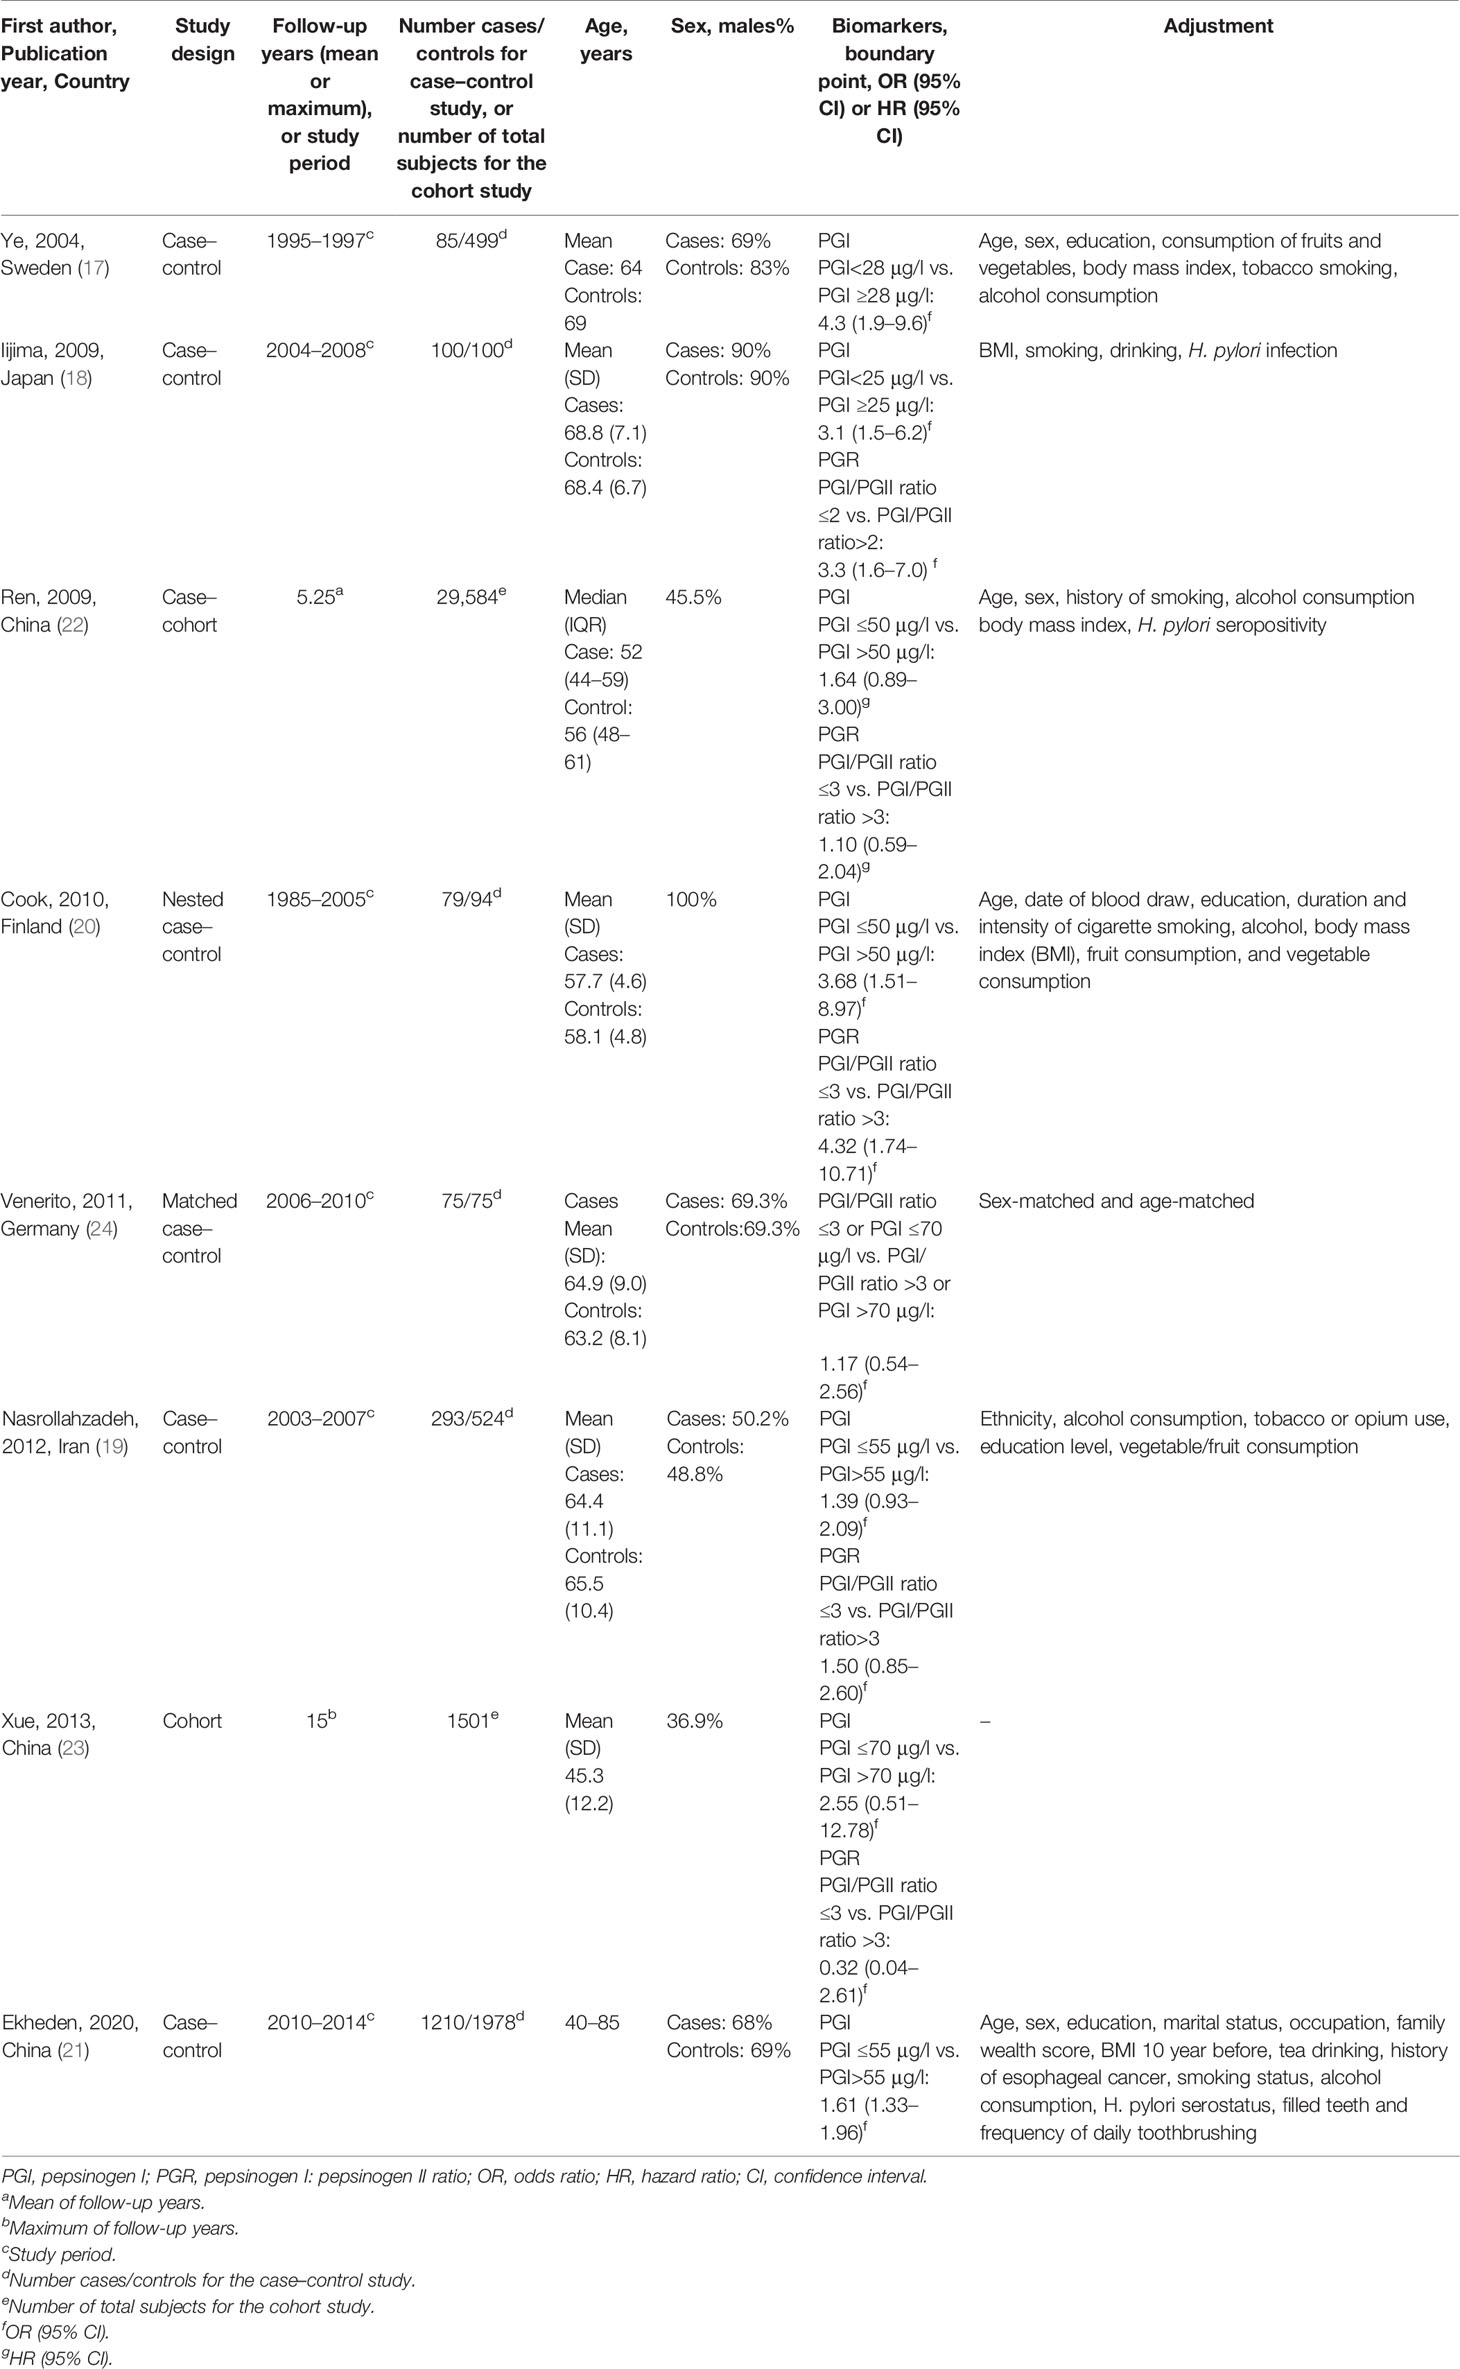
Table 1 Characteristics of the included studies.
As shown in Table 2 and Figure 2, by using the random-effect model and comparing the low with high level, the pooled result showed that a low serum PGI level was associated with an increased ESCC risk (OR: 1.92, 95% CI: 1.45–2.56) with a moderate heterogeneity (I2 = 46.4%, P-heterogeneity = 0.070). The Egger’s test (P = 0.156) and the funnel plot (Figure 3) did not show any publication bias. Sensitivity analyses by omitting each study a time showed that none of these studies had a substantial influence on the overall results (Supplementary Figure S1), indicating that the results are robust. The stratified analysis by region yielded similar results in both Asia (OR: 1.64, 95% CI: 1.39–1.94, I2 = 1.4%, P-heterogeneity = 0.398) and Europe (OR: 2.61, 95% CI: 1.14–6.00, I2 = 67.2%, P-heterogeneity = 0.047) (Table 2). However, when stratified by study quality, a significant difference was observed when pooling studies with high quality (OR: 2.05, 95% CI: 1.48–2.84, I2 = 57.9%, P-heterogeneity = 0.036) rather than with low quality (OR: 1.36, 95% CI: 0.67–2.73, I2 = 0.0%, P-heterogeneity = 0.393).
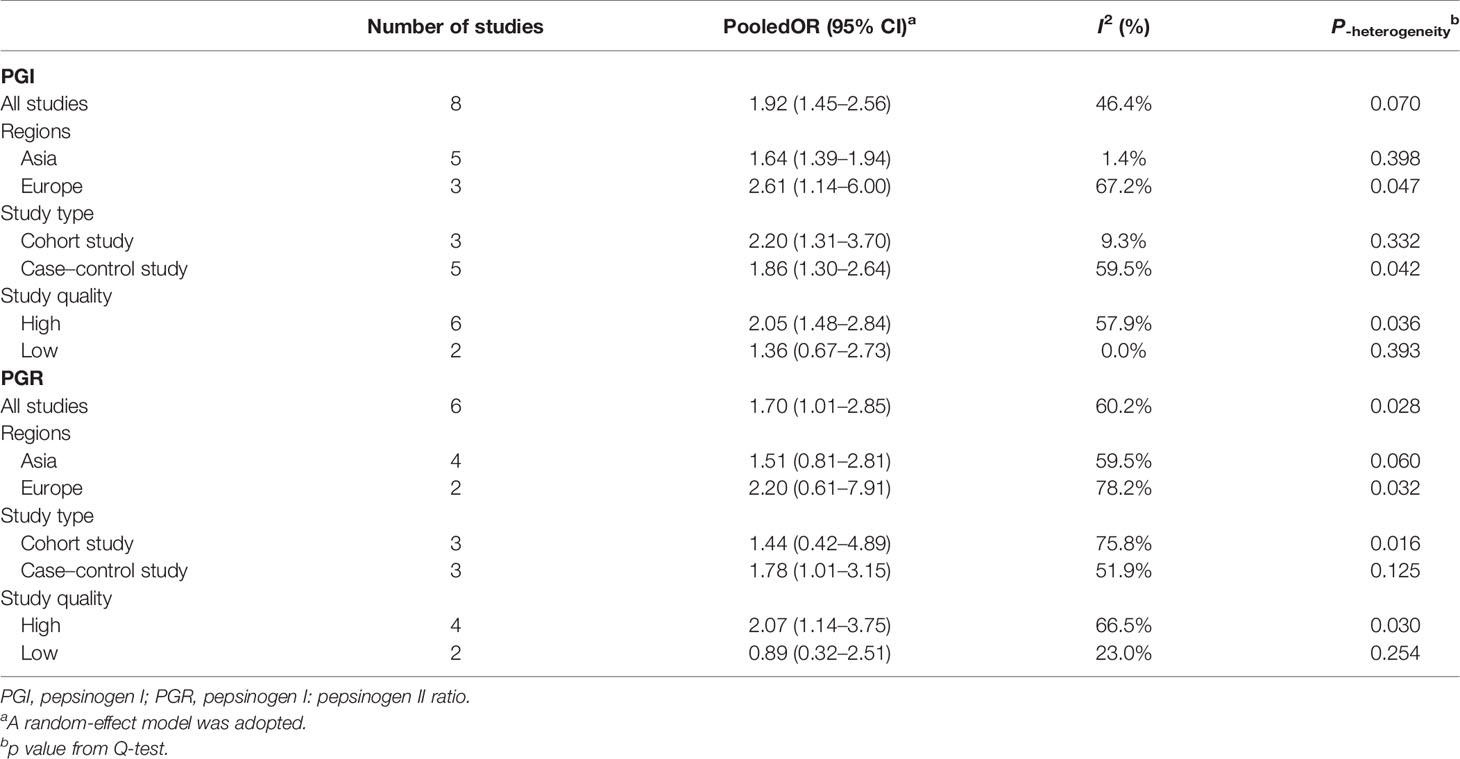
Table 2 Meta-analysis on association of esophageal squamous cell carcinoma risk with PGI and PGR.
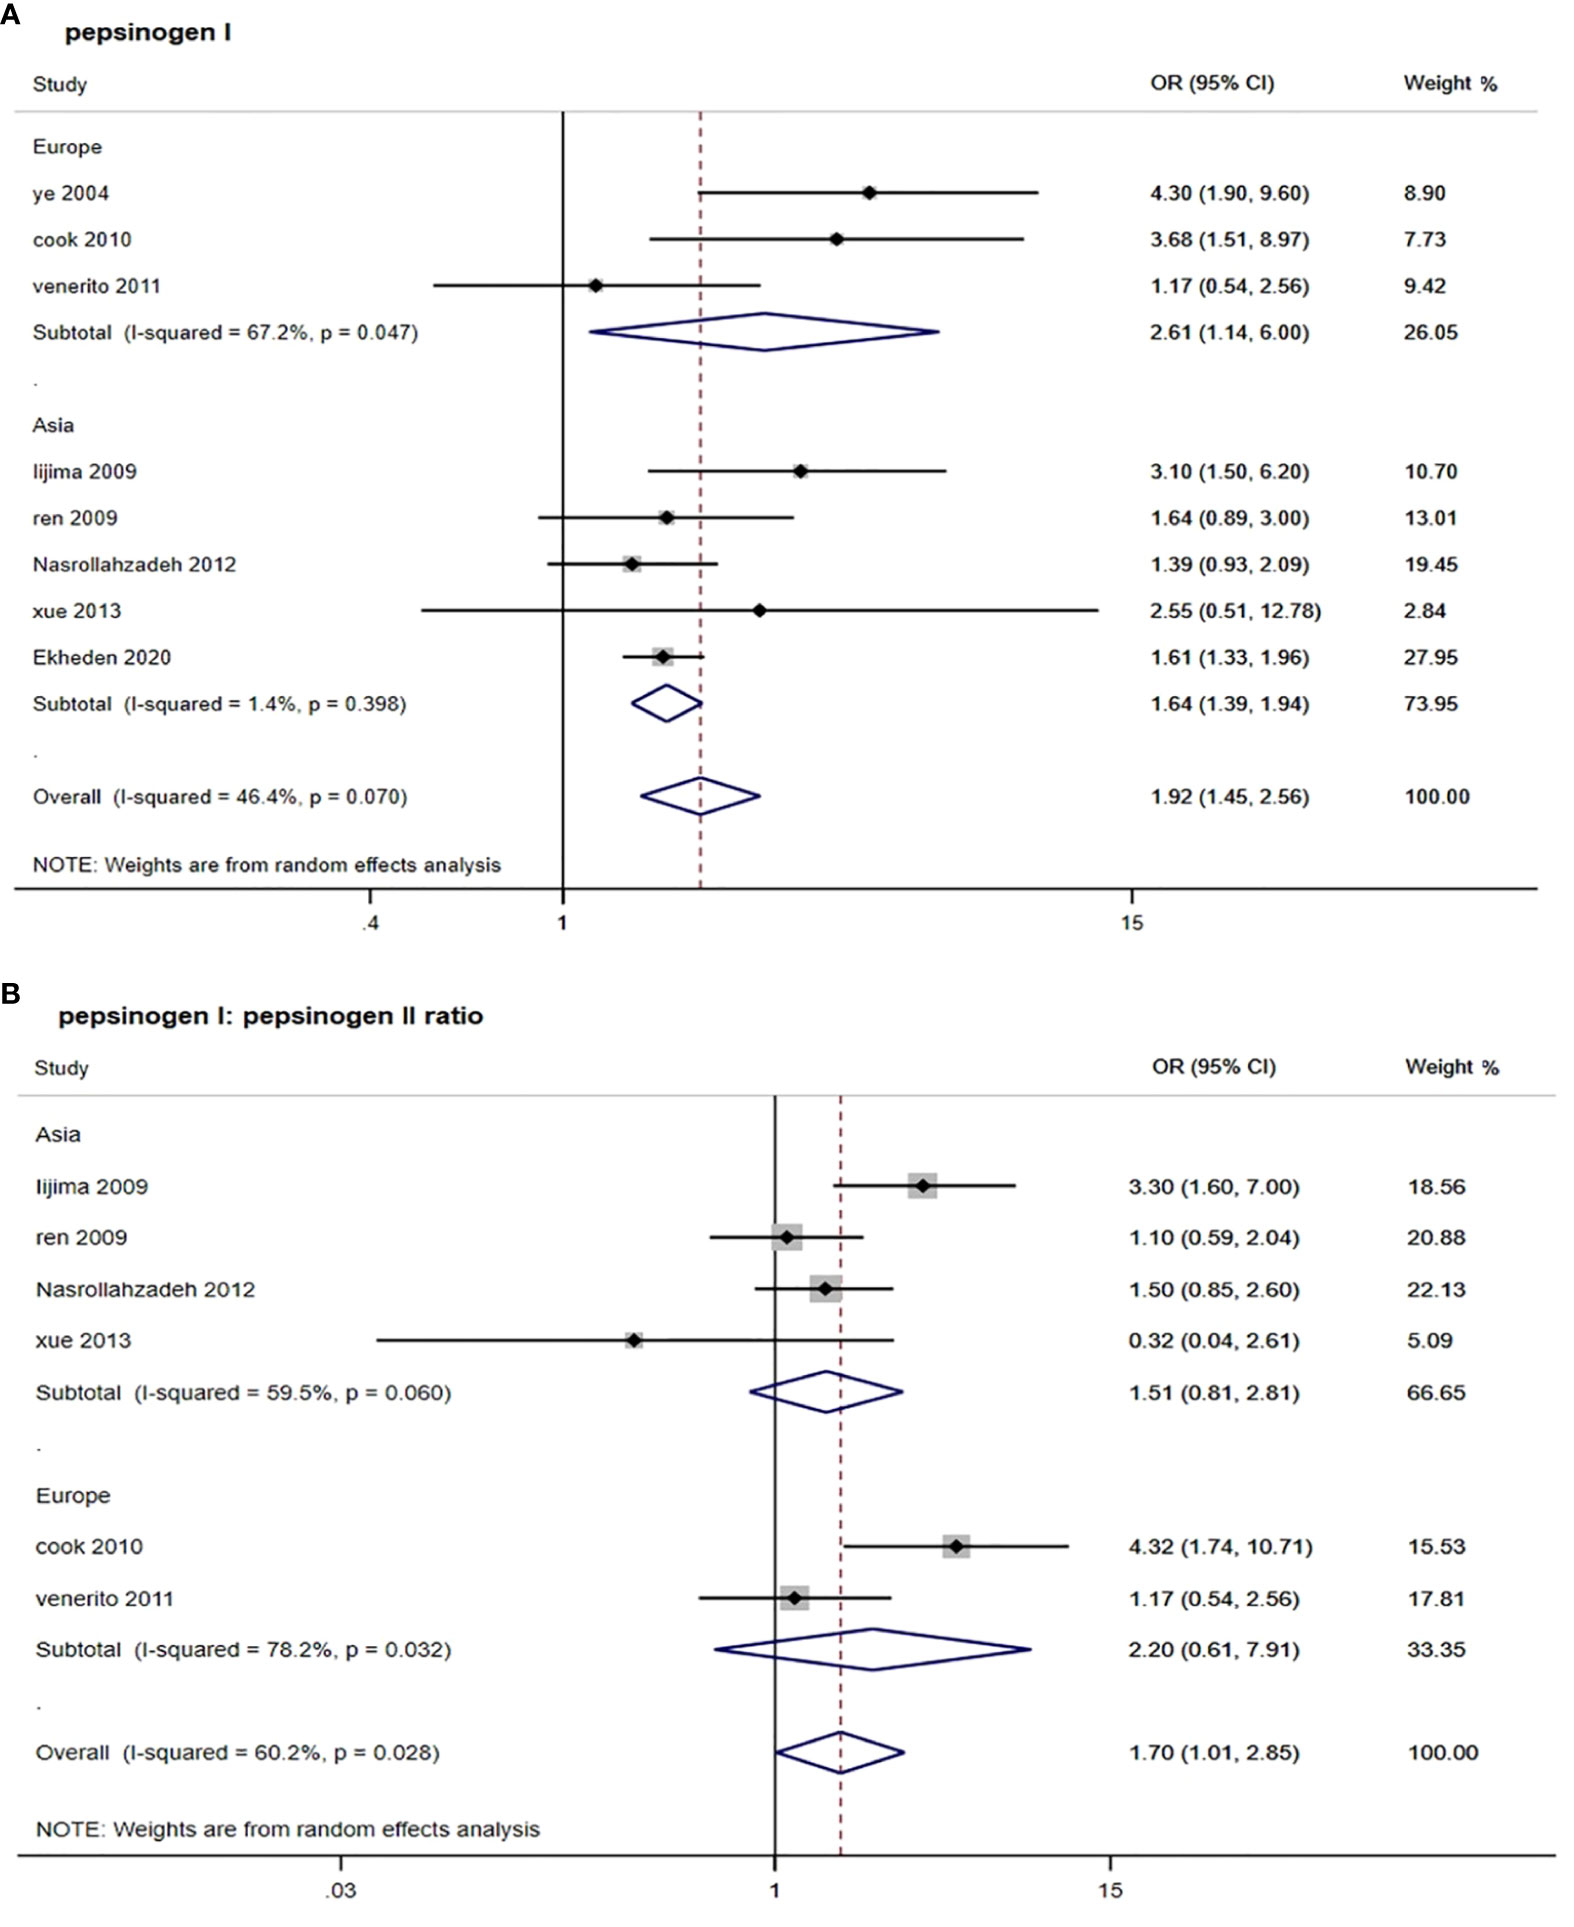
Figure 2 Forest plots from random-effect meta-analysis of the association between PGI and PGR and risk of esophageal squamous cell carcinoma. (A) Pepsinogen I; (B) pepsinogen I: pepsinogen II ratio. PGI, pepsinogen I; PGR, pepsinogen I: pepsinogen II ratio; OR, odds ratio; CI, confidence interval.
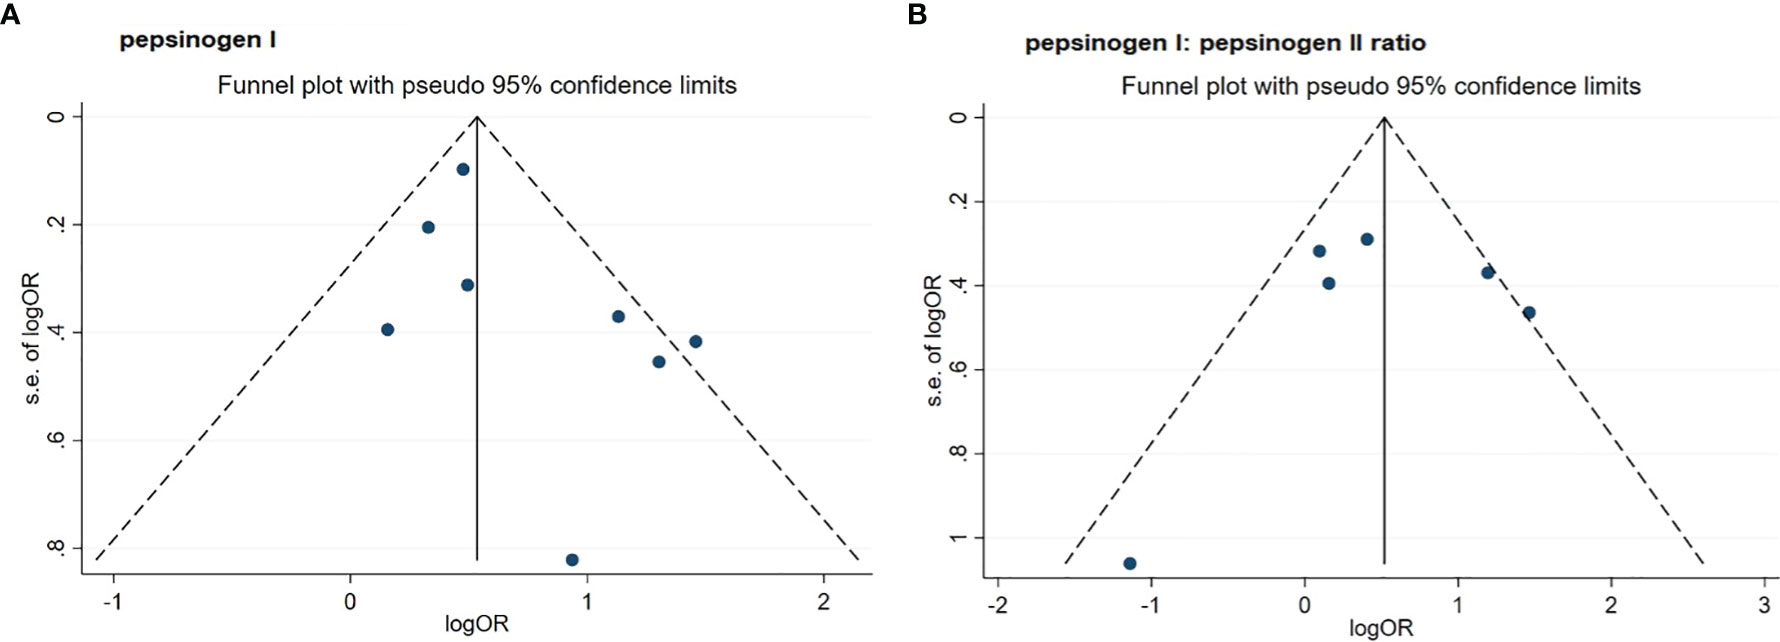
Figure 3 Funnel plots of standard error by log odds ratio for the association of PGI (A) and PGR (B) with risk of esophageal squamous cell carcinoma. (A) pepsinogen I; (B) pepsinogen I: pepsinogen II ratio. PGI, pepsinogen I; PGR, pepsinogen I: pepsinogen II ratio; OR, odds ratio.
For six studies that assessed the association between serum PGR and risk of ESCC, the pooled OR (95% CI) was 1.70 (1.01, 2.85) when comparing the low with high level (Figure 2 and Table 2). The I2 statistic was 60.2% and the P value for Q-test was 0.028, suggesting a marginal heterogeneity. The Egger’s test (P = 0.812) and the funnel plot (Figure 3) did not display any obvious publication bias. Sensitivity analyses by omitting each study at a time showed that none of these studies had a substantial effect on the overall results (Supplementary Figure S1), indicating that the results are stable. In stratified analysis by region, the association of serum PGR and ESCC risk was observed in neither group (Table 2) when comparing the low and high serum PGR levels. In stratified analysis by study quality and study type, a significant association was only observed when four studies with high quality were pooled (OR: 2.07, 95% CI: 1.14–3.75, I2 = 66.5%, P-heterogeneity = 0.030) or three studies with case–control design were pooled (OR:1.78, 95% CI: 1.01–3.15, I2 = 51.9%, P-heterogeneity = 0.125).
Discussion
In the present study, we found that both low level of serum PGI and low level of serum PGR were associated with an increased risk of ESCC.
Smoking and drinking were two risk factors for ESCC; hence, we conducted a subgroup analysis based on whether these two risk factors were adjusted. Two studies [one cohort study (24) and one matched case–control study (23)] did not adjust for smoking and alcohol drinking, and these two studies (23, 24) were also deemed to have low quality (23, 24); hence, the stratified analysis according to whether to adjust for smoking and alcohol drinking was the same with the stratified analysis by the study quality. After excluding these two studies (23, 24), similar risk effects to the main analysis were observed for both PGI and PGR when only the studies with high quality were considered. This finding suggests that although there may be complex interrelationships between PGI, PGR, and ESCC, the studies should be conducted with high quality and most confounders should be considered in future studies.
For PGI, the subgroup analysis by region found that the association was stronger in European than in Asian, suggesting the geographical or ethnic variation. This was consistent with the finding by Islami et al. (25). When stratified by study type, a similar risk effect was observed when cohort studies and case–control studies were pooled separately, further indicating that the results were stable. For PGR, a significantly positive association of serum PGR with ESCC risk was observed when three case–control studies were pooled. However, no significant association was observed when longitudinal studies, studies in Asia, or studies in Europe were pooled; this might be due to the high heterogeneity among studies in these subgroups. De Vries et al. (11) proposed that the association between gastric atrophy determined by PGR and ESCC can be explained by confounding factors, such as smoking, after proving the connection between gastric atrophy and small cell lung carcinoma. However, the present systematic review found a statistically significant association between PGR and ESCC risk after adjusting for smoking and drinking status. Kamangar et al. (28) showed that lower serum PGR was associated with a continuous increase in the risk of esophageal squamous dysplasia, the precursor lesion of ESCC, which was consistent with results in our meta-analysis.
Gastric atrophy has been associated with ESCC, but its causal relevance has been questioned. It was suggested that gastric atrophy might be related to ESCC because of bacterial overgrowth and N-nitrosation reactions caused by the reduced gastric acid production during gastric atrophy or duodenal reflux (37–39). Some studies (40, 41) have found that Helicobacter pylori infection was associated with a higher risk of ESCC, and gastric atrophy may be an intermediate step in the pathway from Helicobacter pylori infection to ESCC. However, since most studies did not provide information on the combined stratification of Helicobacter pylori and serum PGI or PGR, we cannot examine it directly in the present meta-analysis.
There are some advantages in this study. Firstly, as many eligible studies as possible were included in this study. Secondly, several subgroup analyses were conducted to identify potential sources of heterogeneity. Several limitations also existed. Firstly, substantial heterogeneity was observed among included studies. This heterogeneity may be due to various factors, such as diversity in the population characteristics, serum pepsinogen detection methods, and study design. Secondly, there is no consensus on the best cutoff point for serum pepsinogen biomarkers. Dichotomous comparisons may not be the most efficient use of data in estimating the association between gastric atrophy and ESCC risk. These comparisons may be misleading, because any cutoff point will put people with considerably different risks into the same category. Therefore, it is urgent to conduct the delicate well-designed longitude studies and dose–response analyses.
Conclusion
In summary, this systematic review with meta-analysis, although based on a limited number of studies, suggested that both low level of serum PGI and low level of serum PGR were related to an increased risk of ESCC, respectively. This present study provides evidence for using serum pepsinogen biomarkers in predicting ESCC. More delicate well-designed cohort studies with high study quality are needed and dose–response analyses should be performed.
Data Availability Statement
Publicly available datasets were analyzed in this study. The data are available by contacting the corresponding author or extracting from originally published research.
Author Contributions
XL and WZ conceived and designed this study. Z-XY and L-BY researched the literature. Z-XY and PH performed the statistical analysis. Z-XY and PX drafted the manuscript. XL, XX, YL, WZ, and L-BY edited and reviewed the manuscript. All authors contributed to the article and approved the submitted version.
Funding
This study was supported by the National Key R&D Program of China (No. 2018YFE0208000), the Guangdong Basic and Applied Basic Research Foundation (No. 2019A1515011599), and the Science and Technology Program of Guangzhou City (No. 202102080404). The funders had no role in the design, analysis, or writing of this manuscript.
Conflict of Interest
The authors declare that the research was conducted in the absence of any commercial or financial relationships that could be construed as a potential conflict of interest.
Publisher’s Note
All claims expressed in this article are solely those of the authors and do not necessarily represent those of their affiliated organizations, or those of the publisher, the editors and the reviewers. Any product that may be evaluated in this article, or claim that may be made by its manufacturer, is not guaranteed or endorsed by the publisher.
Acknowledgments
We would like to show our thanks to the authors of originally published studies; their work achievement is the precondition of our study.
Supplementary Material
The Supplementary Material for this article can be found online at: https://www.frontiersin.org/articles/10.3389/fonc.2022.928672/full#supplementary-material
References
1. Bray F, Ferlay J, Soerjomataram I, Siegel RL, Torre LA, Jemal A. Global Cancer Statistics 2018: Globocan Estimates of Incidence and Mortality Worldwide for 36 Cancers in 185 Countries. CA: Cancer J Clin (2018) 68(6):394–424. doi: 10.3322/caac.21492
2. Pakzad R, Mohammadian-Hafshejani A, Khosravi B, Soltani S, Pakzad I, Mohammadian M, et al. The Incidence and Mortality of Esophageal Cancer and Their Relationship to Development in Asia. Ann Transl Med (2016) 4(2):29. doi: 10.3978/j.issn.2305-5839.2016.01.11
3. Arnold M, Soerjomataram I, Ferlay J, Forman D. Global Incidence of Oesophageal Cancer by Histological Subtype in 2012. Gut (2015) 64(3):381–7. doi: 10.1136/gutjnl-2014-308124
4. Bandla S, Pennathur A, Luketich JD, Beer DG, Lin L, Bass AJ, et al. Comparative Genomics of Esophageal Adenocarcinoma and Squamous Cell Carcinoma. Ann Thorac Surg (2012) 93(4):1101–6. doi: 10.1016/j.athoracsur.2012.01.064
5. Siegel RL, Miller KD, Jemal A. Cancer Statistics, 2017. CA: Cancer J Clin (2017) 67(1):7–30. doi: 10.3322/caac.21387
6. Rustgi AK, El-Serag HB. Esophageal Carcinoma. N Engl J Med (2014) 371(26):2499–509. doi: 10.1056/NEJMra1314530
7. Domper Arnal MJ, Ferrandez Arenas A, Lanas Arbeloa A. Esophageal Cancer: Risk Factors, Screening and Endoscopic Treatment in Western and Eastern Countries. World J Gastroenterol (2015) 21(26):7933–43. doi: 10.3748/wjg.v21.i26.7933
8. Codipilly DC, Qin Y, Dawsey SM, Kisiel J, Topazian M, Ahlquist D, et al. Screening for Esophageal Squamous Cell Carcinoma: Recent Advances. Gastrointestinal Endoscopy (2018) 88(3):413–26. doi: 10.1016/j.gie.2018.04.2352
9. Shimada H, Yajima S, Oshima Y, Hiwasa T, Tagawa M, Matsushita K, et al. Impact of Serum Biomarkers on Esophageal Squamous Cell Carcinoma. Esophagus Off J Japan Esophageal Soc (2012) 9(3):131–40. doi: 10.1007/s10388-012-0332-x
10. Yazbeck R, Jaenisch SE, Watson DI. From Blood to Breath: New Horizons for Esophageal Cancer Biomarkers. World J Gastroenterol (2016) 22(46):10077–83. doi: 10.3748/wjg.v22.i46.10077
11. de Vries AC, Capelle LG, Looman CW, van Blankenstein M, van Grieken NC, Casparie MK, et al. Increased Risk of Esophageal Squamous Cell Carcinoma in Patients With Gastric Atrophy: Independent of the Severity of Atrophic Changes. Int J Cancer (2009) 124(9):2135–8. doi: 10.1002/ijc.23955
12. Almodova Ede C, de Oliveira WK, Machado LF, Grejo JR, da Cunha TR, Colaiacovo W, et al. Atrophic Gastritis: Risk Factor for Esophageal Squamous Cell Carcinoma in a Latin-American Population. World J Gastroenterol (2013) 19(13):2060–4. doi: 10.3748/wjg.v19.i13.2060
13. Huang YK, Yu JC, Kang WM, Ma ZQ, Ye X, Tian SB, et al. Significance of Serum Pepsinogens as a Biomarker for Gastric Cancer and Atrophic Gastritis Screening: A Systematic Review and Meta-Analysis. PLoS One (2015) 10(11):e0142080. doi: 10.1371/journal.pone.0142080
14. Mukoubayashi C, Yanaoka K, Ohata H, Arii K, Tamai H, Oka M, et al. Serum Pepsinogen and Gastric Cancer Screening. Internal Med (Tokyo Japan) (2007) 46(6):261–6. doi: 10.2169/internalmedicine.46.6181
15. Samloff IM, Varis K, Ihamaki T, Siurala M, Rotter JI. Relationships Among Serum Pepsinogen I, Serum Pepsinogen Ii, and Gastric Mucosal Histology. Gastroenterology (1982) 83(1):204–9. doi: 10.1016/0016-5085(82)90176-7
16. Iijima K, Abe Y, Kikuchi R, Koike T, Ohara S, Sipponen P, et al. Serum Biomarker Tests Are Useful in Delineating Between Patients With Gastric Atrophy and Normal, Healthy Stomach. World J Gastroenterol (2009) 15(7):853–9. doi: 10.3748/wjg.15.853
17. Ye W, Held M, Lagergren J, Engstrand L, Blot WJ, McLaughlin JK, et al. Helicobacter Pylori Infection and Gastric Atrophy: Risk of Adenocarcinoma and Squamous-Cell Carcinoma of the Esophagus and Adenocarcinoma of the Gastric Cardia. J Natl Cancer Inst (2004) 96(5):388–96. doi: 10.1093/jnci/djh057
18. Iijima K, Koike T, Abe Y, Yamagishi H, Ara N, Asanuma K, et al. Gastric Hyposecretion in Esophageal Squamous-Cell Carcinomas. Dig Dis Sci (2010) 55(5):1349–55. doi: 10.1007/s10620-009-0853-x
19. Nasrollahzadeh D, Malekzadeh R, Aghcheli K, Sotoudeh M, Merat S, Islami F, et al. Gastric Atrophy and Oesophageal Squamous Cell Carcinoma: Possible Interaction With Dental Health and Oral Hygiene Habit. Br J Cancer (2012) 107(5):888–94. doi: 10.1038/bjc.2012.332
20. Cook MB, Dawsey SM, Diaw L, Blaser MJ, Perez-Perez GI, Abnet CC, et al. Serum Pepsinogens and Helicobacter Pylori in Relation to the Risk of Esophageal Squamous Cell Carcinoma in the Alpha-Tocopherol, Beta-Carotene Cancer Prevention Study. Cancer Epidemiol Biomarkers Prev (2010) 19(8):1966–75. doi: 10.1158/1055-9965.EPI-10-0270
21. Ekheden I, Yang X, Chen H, Chen X, Yuan Z, Jin L, et al. Associations Between Gastric Atrophy and Its Interaction With Poor Oral Health and the Risk for Esophageal Squamous Cell Carcinoma in a High-Risk Region of China: A Population-Based Case-Control Study. Am J Epidemiol (2020) 189(9):931–41. doi: 10.1093/aje/kwz283
22. Ren JS, Kamangar F, Qiao YL, Taylor PR, Liang H, Dawsey SM, et al. Serum Pepsinogens and Risk of Gastric and Oesophageal Cancers in the General Population Nutrition Intervention Trial Cohort. Gut (2009) 58(5):636–42. doi: 10.1136/gut.2008.168641
23. Xue L, Xing L, Wang J, Shen H, Cui J, Mi J, et al. Serum Pepsinogens and Helicobacter Pylori Are Not Associated With Esophageal Squamous Cell Carcinoma in a High-Risk Area in China. Tumori (2013) 99(2):134–8. doi: 10.1700/1283.14181
24. Venerito M, Kohrs S, Wex T, Adolf D, Kuester D, Schubert D, et al. Helicobacter Pylori Infection and Fundic Gastric Atrophy Are Not Associated With Esophageal Squamous Cell Carcinoma: A Case-Control Study. Eur J Gastroenterol Hepatol (2011) 23(10):859–64. doi: 10.1097/MEG.0b013e3283496469
25. Islami F, Sheikhattari P, Ren JS, Kamangar F. Gastric Atrophy and Risk of Oesophageal Cancer and Gastric Cardia Adenocarcinoma–a Systematic Review and Meta-Analysis. Ann Oncol (2011) 22(4):754–60. doi: 10.1093/annonc/mdq411
26. Kunzmann AT, McMenamin ÚC, Spence AD, Gray RT, Murray LJ, Turkington RC, et al. Blood Biomarkers for Early Diagnosis of Oesophageal Cancer: A Systematic Review. Eur J Gastroenterol Hepatol (2018) 30(3):263–73. doi: 10.1097/meg.0000000000001029
27. Yokoyama A, Omori T, Yokoyama T, Kawakubo H, Mori S, Matsui T, et al. Chronic Atrophic Gastritis and Metachronous Gastric Cancer in Japanese Alcoholic Men With Esophageal Squamous Cell Carcinoma. Alcohol Clin Exp Res (2009) 33(5):898–905. doi: 10.1111/j.1530-0277.2009.00908.x
28. Kamangar F, Diaw L, Wei WQ, Abnet CC, Wang GQ, Roth MJ, et al. Serum Pepsinogens and Risk of Esophageal Squamous Dysplasia. Int J Cancer (2009) 124(2):456–60. doi: 10.1002/ijc.23918
29. Hutton B, Salanti G, Caldwell DM, Chaimani A, Schmid CH, Cameron C, et al. The Prisma Extension Statement for Reporting of Systematic Reviews Incorporating Network Meta-Analyses of Health Care Interventions: Checklist and Explanations. Ann Internal Med (2015) 162(11):777–84. doi: 10.7326/M14-2385
30. Stang A. Critical Evaluation of the Newcastle-Ottawa Scale for the Assessment of the Quality of Nonrandomized Studies in Meta-Analyses. Eur J Epidemiol (2010) 25(9):603–5. doi: 10.1007/s10654-010-9491-z
31. Zeng X, Zhang Y, Kwong JS, Zhang C, Li S, Sun F, et al. The Methodological Quality Assessment Tools for Preclinical and Clinical Studies, Systematic Review and Meta-Analysis, and Clinical Practice Guideline: A Systematic Review. J Evid Based Med (2015) 8(1):2–10. doi: 10.1111/jebm.12141
32. Higgins JP, Thompson SG. Quantifying Heterogeneity in a Meta-Analysis. Stat Med (2002) 21(11):1539–58. doi: 10.1002/sim.1186
33. Egger M, Davey Smith G, Schneider M, Minder C. Bias in Meta-Analysis Detected by a Simple, Graphical Test. Bmj (1997) 315(7109):629–34. doi: 10.1136/bmj.315.7109.629
34. Kalantzopoulos GN, Lundvall F, Checchia S, Lind A, Wragg DS, Fjellvag H, et al. In Situ Flow Mas Nmr Spectroscopy and Synchrotron Pdf Analyses of the Local Response of the Bronsted Acidic Site in Sapo-34 During Hydration at Elevated Temperatures. Chemphyschem (2018) 19(4):519–28. doi: 10.1002/cphc.201700973
35. Leja M, Grinberga-Derica I, Bilgilier C, Steininger C. Review: Epidemiology of Helicobacter Pylori Infection. Helicobacter (2019) 24 Suppl 1:e12635. doi: 10.1111/hel.12635
36. Patsopoulos NA, Evangelou E, Ioannidis JP. Sensitivity of Between-Study Heterogeneity in Meta-Analysis: Proposed Metrics and Empirical Evaluation. Int J Epidemiol (2008) 37(5):1148–57. doi: 10.1093/ije/dyn065
37. Yu G, Gail MH, Shi J, Klepac-Ceraj V, Paster BJ, Dye BA, et al. Association Between Upper Digestive Tract Microbiota and Cancer-Predisposing States in the Esophagus and Stomach. Cancer Epidemiol Biomarkers Prev Publ Am Assoc Cancer Res Cosponsored by Am Soc Prev Oncol (2014) 23(5):735–41. doi: 10.1158/1055-9965.EPI-13-0855
38. Rosen R, Amirault J, Liu H, Mitchell P, Hu L, Khatwa U, et al. Changes in Gastric and Lung Microflora With Acid Suppression: Acid Suppression and Bacterial Growth. JAMA Pediatr (2014) 168(10):932–7. doi: 10.1001/jamapediatrics.2014.696
39. Chen X, Winckler B, Lu M, Cheng H, Yuan Z, Yang Y, et al. Oral Microbiota and Risk for Esophageal Squamous Cell Carcinoma in a High-Risk Area of China. PLoS One (2015) 10(12):e0143603. doi: 10.1371/journal.pone.0143603
40. McColl KE. Helicobacter Pylori and Oesophageal Cancer–Not Always Protective. Gut (2007) 56(4):457–9. doi: 10.1136/gut.2006.111385
Keywords: serum pepsinogens, esophageal squamous cell carcinoma, systematic review, meta-analysis research, etiology
Citation: Yang Z-X, Yan L-B, Xie P, Hu P, Zhao W, Lu Y, Xing X and Liu X (2022) Association of Serum Pepsinogens With Esophageal Squamous Cell Carcinoma Risk: A Systematic Review and Meta-Analysis. Front. Oncol. 12:928672. doi: 10.3389/fonc.2022.928672
Received: 26 April 2022; Accepted: 27 May 2022;
Published: 30 June 2022.
Edited by:
Wei Zhang, Northwestern University, United StatesReviewed by:
Xianbin Yu, The University of Chicago, United StatesXialong Cui, The University of Chicago, United States
Copyright © 2022 Yang, Yan, Xie, Hu, Zhao, Lu, Xing and Liu. This is an open-access article distributed under the terms of the Creative Commons Attribution License (CC BY). The use, distribution or reproduction in other forums is permitted, provided the original author(s) and the copyright owner(s) are credited and that the original publication in this journal is cited, in accordance with accepted academic practice. No use, distribution or reproduction is permitted which does not comply with these terms.
*Correspondence: Xudong Liu, eGRsaXUuY25AaG90bWFpbC5jb20=; Wenjing Zhao, emhhb3dqQHN1c3RlY2guZWR1LmNu; Yi Lu, eWx1QGhlYWx0aGVmZmVjdHMub3Jn
†These authors have contributed equally to this work