 Chen Huang
 Yongmei Dai
 Qianshun Chen1
 Hongchao Chen
 Xiao Chen
- 1Shengli Clinical College of Fujian Medical University, Department of Thoracic Surgery, Fujian Provincial Hospital, Fuzhou, China
- 2Shengli Clinical College of Fujian Medical University, Department of Oncology, Fujian Provincial Hospital, Fuzhou, China
- 3College of Mathematics and Data Science (Software College), Minjiang University, Fuzhou, China
Objective: To compare the performance of a deep learning survival network with the tumor, node, and metastasis (TNM) staging system in survival prediction and test the reliability of individual treatment recommendations provided by the network.
Methods: In this population-based cohort study, we developed and validated a deep learning survival model using consecutive cases of newly diagnosed stage I to IV esophageal cancer between January 2004 and December 2015 in a Surveillance, Epidemiology, and End Results (SEER) database. The model was externally validated in an independent cohort from Fujian Provincial Hospital. The C statistic was used to compare the performance of the deep learning survival model and TNM staging system. Two other deep learning risk prediction models were trained for treatment recommendations. A Kaplan–Meier survival curve was used to compare survival between the population that followed the recommended therapy and those who did not.
Results: A total of 9069 patients were included in this study. The deep learning network showed more promising results in predicting esophageal cancer-specific survival than the TNM stage in the internal test dataset (C-index=0.753 vs. 0.638) and external validation dataset (C-index=0.687 vs. 0.643). The population who received the recommended treatments had superior survival compared to those who did not, based on the internal test dataset (hazard ratio, 0.753; 95% CI, 0.556-0.987; P=0.042) and the external validation dataset (hazard ratio, 0.633; 95% CI, 0.459-0.834; P=0.0003).
Conclusion: Deep learning neural networks have potential advantages over traditional linear models in prognostic assessment and treatment recommendations. This novel analytical approach may provide reliable information on individual survival and treatment recommendations for patients with esophageal cancer.
Introduction
Esophageal cancer (EC) is the most common gastrointestinal tumor globally and ranked seventh in terms of incidence and sixth in terms of overall mortality in 2018 (1). Despite progress in the treatment and management of EC in recent years, the long-term survival of patients undergoing esophagectomy remains poor (17.1-55%) (2). The benefits of adjuvant therapy have been debated and inconclusive. Therefore, it is very important to stratify the risk and make individualized treatment recommendations for newly diagnosed patients.
The American Joint Committee on Cancer (AJCC) tumor, node, and metastasis (TNM) staging system is widely used to stratify disease risk, predict patient survival outcomes, and make decisions regarding cancer treatment (3). However, the AJCC staging system is not accurate enough to predict the survival of patients with esophageal cancer who received multimodality treatment (4). Moreover, survival rates in stage-matched cohorts varies widely (5). To improve the precision of EC survival estimations, nomograms have gained popularity as a method for predicting outcomes (6–9). A nomogram is a Cox proportional hazard (CPH) model designed to allow straightforward graphical calculation of the probability of a specific outcome, such as esophageal cancer-specific survival (ECSS). However, these models have some limitations in time–event prediction for the clinical management of patients with cancer, including an accurate assessment of overall survival (OS) and progression time (10). Moreover, it is not sufficient to consider only the linear relationship of clinical features when making treatment decisions (11). Therefore, a better model that focuses on nonlinear variables is required.
Deep learning networks provide insights into the highly complex linear/nonlinear associations between prognostic clinical features and the individual risk of death (12). Matsuo et al. developed a deep learning neural network model that exhibited superior performance compared to the CPH model for survival prediction in women with cervical cancer (13). Katzman et al. developed a CPH deep neural network called DeepSurv (14), which can be used to predict the effects of patient covariates on patient survival. The authors demonstrated that DeepSurv performed better than other state-of-the-art survival methods for modeling the interactions between a patient’s covariates and treatment effectiveness. She et al. found that DeepSurv has a potential benefit in prognostic evaluation and treatment recommendations with respect to lung cancer-specific survival (15).
In this study, we first explored the performance of the DeepSurv model in analyzing the real-world clinical data of patients with esophageal cancer. Second, we evaluated the reliability of the DeepSurv model in providing treatment recommendations based on individual characteristics.
Materials and methods
Eligibility criteria and clinical information
For the training cohort, we selected patients from the Surveillance, Epidemiology, and End Results (SEER) database: SEER 18 Regs Custom Data [with additional treatment fields], Nov 2018 Sub [1975-2016 varying]. We obtained permission to access the database by signing the SEER Research Data Agreement form and submitting it via email. The inclusion criteria were as follows: (1) pathologically confirmed primary stage I to IV EC (only adenocarcinoma and squamous cell carcinoma) between January 2004 and December 2015 and (2) the presence of one malignant primary lesion. The exclusion criteria were as follows: (1) missing clinicopathological data and (2) patients with perioperative mortality (mortality within 30 days after operation). Baseline patient information (sex, age, race, and marital status), tumor characteristics (primary site, histologic grade, histologic type, and TNM stage), SEER code (CS extension, CS mets at DX, regional nodes examined, regional nodes positive, and CS tumor size), and treatment details were collected (Table S1). The outcome of interest in this study was ECSS, which was defined as the interval from diagnosis to death as a result of EC. These cases were randomly divided into training and test cohorts at a ratio of 8 to 2. Another test cohort from our database was provided to externally validate the DeepSurv model. After obtaining institutional review board approval from Fujian Provincial Hospital, we selected patients received esophagectomy from January 2011 to December 2016 in Fujian Provincial Hospital (CHINA dataset), and these patients were completely distinct from those in the SEER database. The requirement for informed consent was waived owing to the retrospective nature of this study. The inclusion criteria specified patients with pathologic stage I to IV; and complete resection of microscopic tumors. Patients with secondary malignancies, perioperative mortality, and missing of clinical records were excluded from the study. A flow chart of dataset construction is shown in Figure S1.
Deep learning model design
We performed survival analysis based on the deep learning model DeepSurv described by Katzman el al. (14) to predict individual patient outcomes. DeepSurv is a multilayer fully connected network composed of input, hidden, and output layers. Nonlinear features are introduced through the hidden layer of the neural network to fit the proportional hazard function under nonlinear conditions. The expression for the hidden layer is f(X)=Relu(θX+b), where Relu is a nonlinear activation function, θ is the parameter matrix, X is the input feature, and b is the bias term. The deep learning model learns the complex relationship between individual covariates and treatment effects by replacing the linear combination of features hβ (x) = βTx with the output hθ(x) of the nonlinear network layer. This model simulates the actual clinical treatment risk of the population and has a strong generalization ability. The model uses weight decay regularization, batch normalization, and dropout to prevent overfitting. The loss function of deep learning is set as the Cox partial likelihood with constraints and is defined as
where θ is a parameter of the neural network, α is the regular coefficient, and is the output of the model. NE represents the number of patients who eventually died (14). The loss function is used to estimate the degree of inconsistency between the predicted value and the real value of the model. The smaller the loss function is, the better the robustness of the model is. The model uses the Adam optimization algorithm to optimize the loss function and update the parameters (16).
Random search was used to optimize the hyper-parameters of the network because it is more efficient than grid search when dealing with high-dimensional data (17). Random search finds optimal model hyper-parameters by selecting a random combination of parameters from the search space. In this study, we performed a randomized hyper-parameter search over the number of layers in [2, 7], the number of neurons in each layer in [4, 100], the learning rate in [0.00001, 0.01]. The model structure was optimized using 500 iterations of random search on the training set for predicting the survival of patients with EC. Hyper-parameters search showed increasing the number of hidden layers can lead to improved model performance until the number of hidden layers exceeded three. So a 5-layer network with three hidden layers was a good choice. Similarly, the number of neurons in each layer was optimized according to random search results.
Data analysis
First, a 5-layer neural network was trained to predict the ECSS of the patients in the training dataset (n=6855) (Figure 1). To validate the prediction performance, we used Harrell’s C statistic and calibration plots to evaluate network discrimination and calibration in the SEER (n=1714) and CHINA (n=500) test datasets. An additional CPH regression model was performed following the backward stepwise approach, using all variables included in the DeepSurv model. The CPH model is a classic model for clinical survival analysis that uses a linear function hβ (x) = βTx to estimate the true risk function h(x). The prediction performances of the DeepSurv, CPH, and TNM staging models were compared using the C statistic.
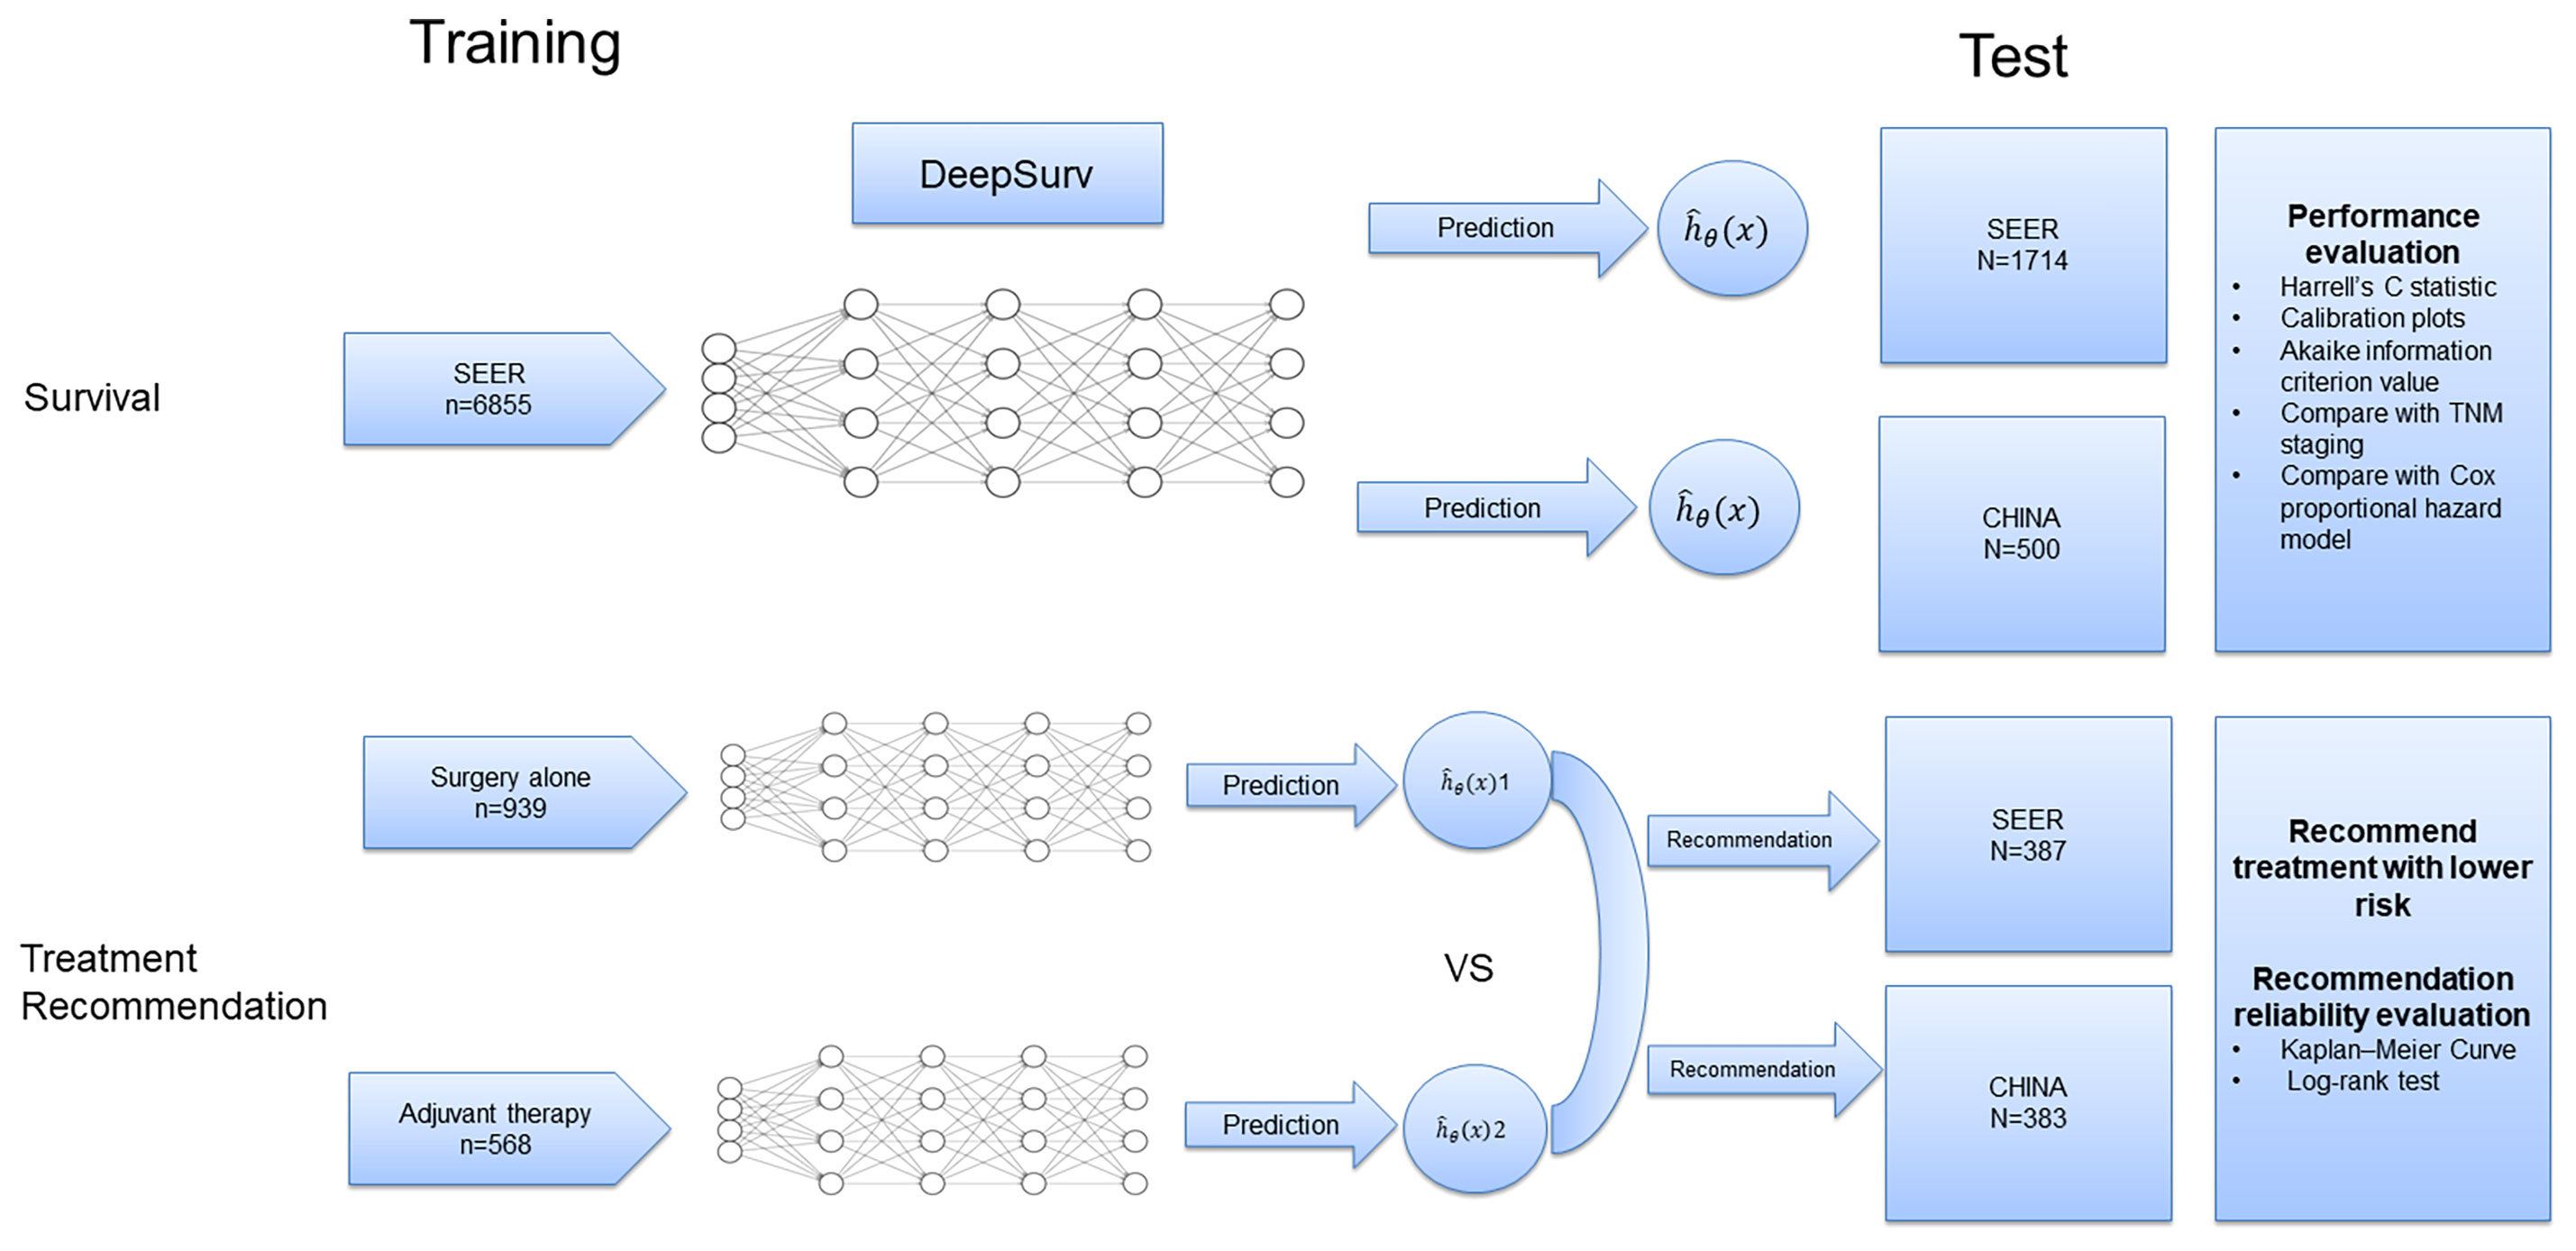
Figure 1 Diagram of the study procedure.
Next, patients who underwent esophagectomy were screened from the three datasets and divided into the surgery alone and adjuvant therapy groups according to whether they received adjuvant radiotherapy and/or chemotherapy (Figure S1). The data in the surgery alone (n=939) and adjuvant therapy (n=568) training sets were used to train two DeepSurv risk prediction models. The survival risk for each patient on different treatment regimens in the test set (SEER: n=387; CHINA: n=383) was predicted, and treatment options with a lower risk were recommended (Figure 1). Finally, patients in the test set were divided into two groups based on whether the recommended treatment was used. We used the Kaplan–Meier method to analyze the ECSS between different groups, and the log-rank test was used to compare survival curves.
Statistical Analysis
A two-sided P value less than 0.05 was considered statistically significant. The Akaike information criterion (AIC) value was calculated to assess the risk of overfitting (18). The deep learning model was developed using Python (version 3.6.7). The CPH regression model and the C statistical were determined by survival, survminer, and rms packages with R statistical software (Version 4.2.0), and the survival curves were plotted using GraphPad Prism 7 (GraphPad Software).
Results
Baseline characteristics and survival
According to the inclusion criteria, 9069 patients with EC were included in this study. The baseline clinical characteristics of the patients are shown in Table 1. A total of 8,569 patients from the SEER database were included. The median (interquartile range) age was 65 (23-101), and the major race was white (7293[95.1%]). The majority of tumors were in the lower third of the esophagus (6091[71.1%]), stage IV disease (1753[20.4%]), and adenocarcinoma (5883[68.6%]). The median (interquartile range) follow-up time was 15 (0-155) months. During the follow-up time, 5469 patients (63.8%) died with their cause of death attributed to EC. There were 500 patients diagnosed with EC in the CHINA database. In that dataset, 227 patients died with their cause of death attributed to EC over a median (interquartile range) follow-up time of 47 (2-155) months.
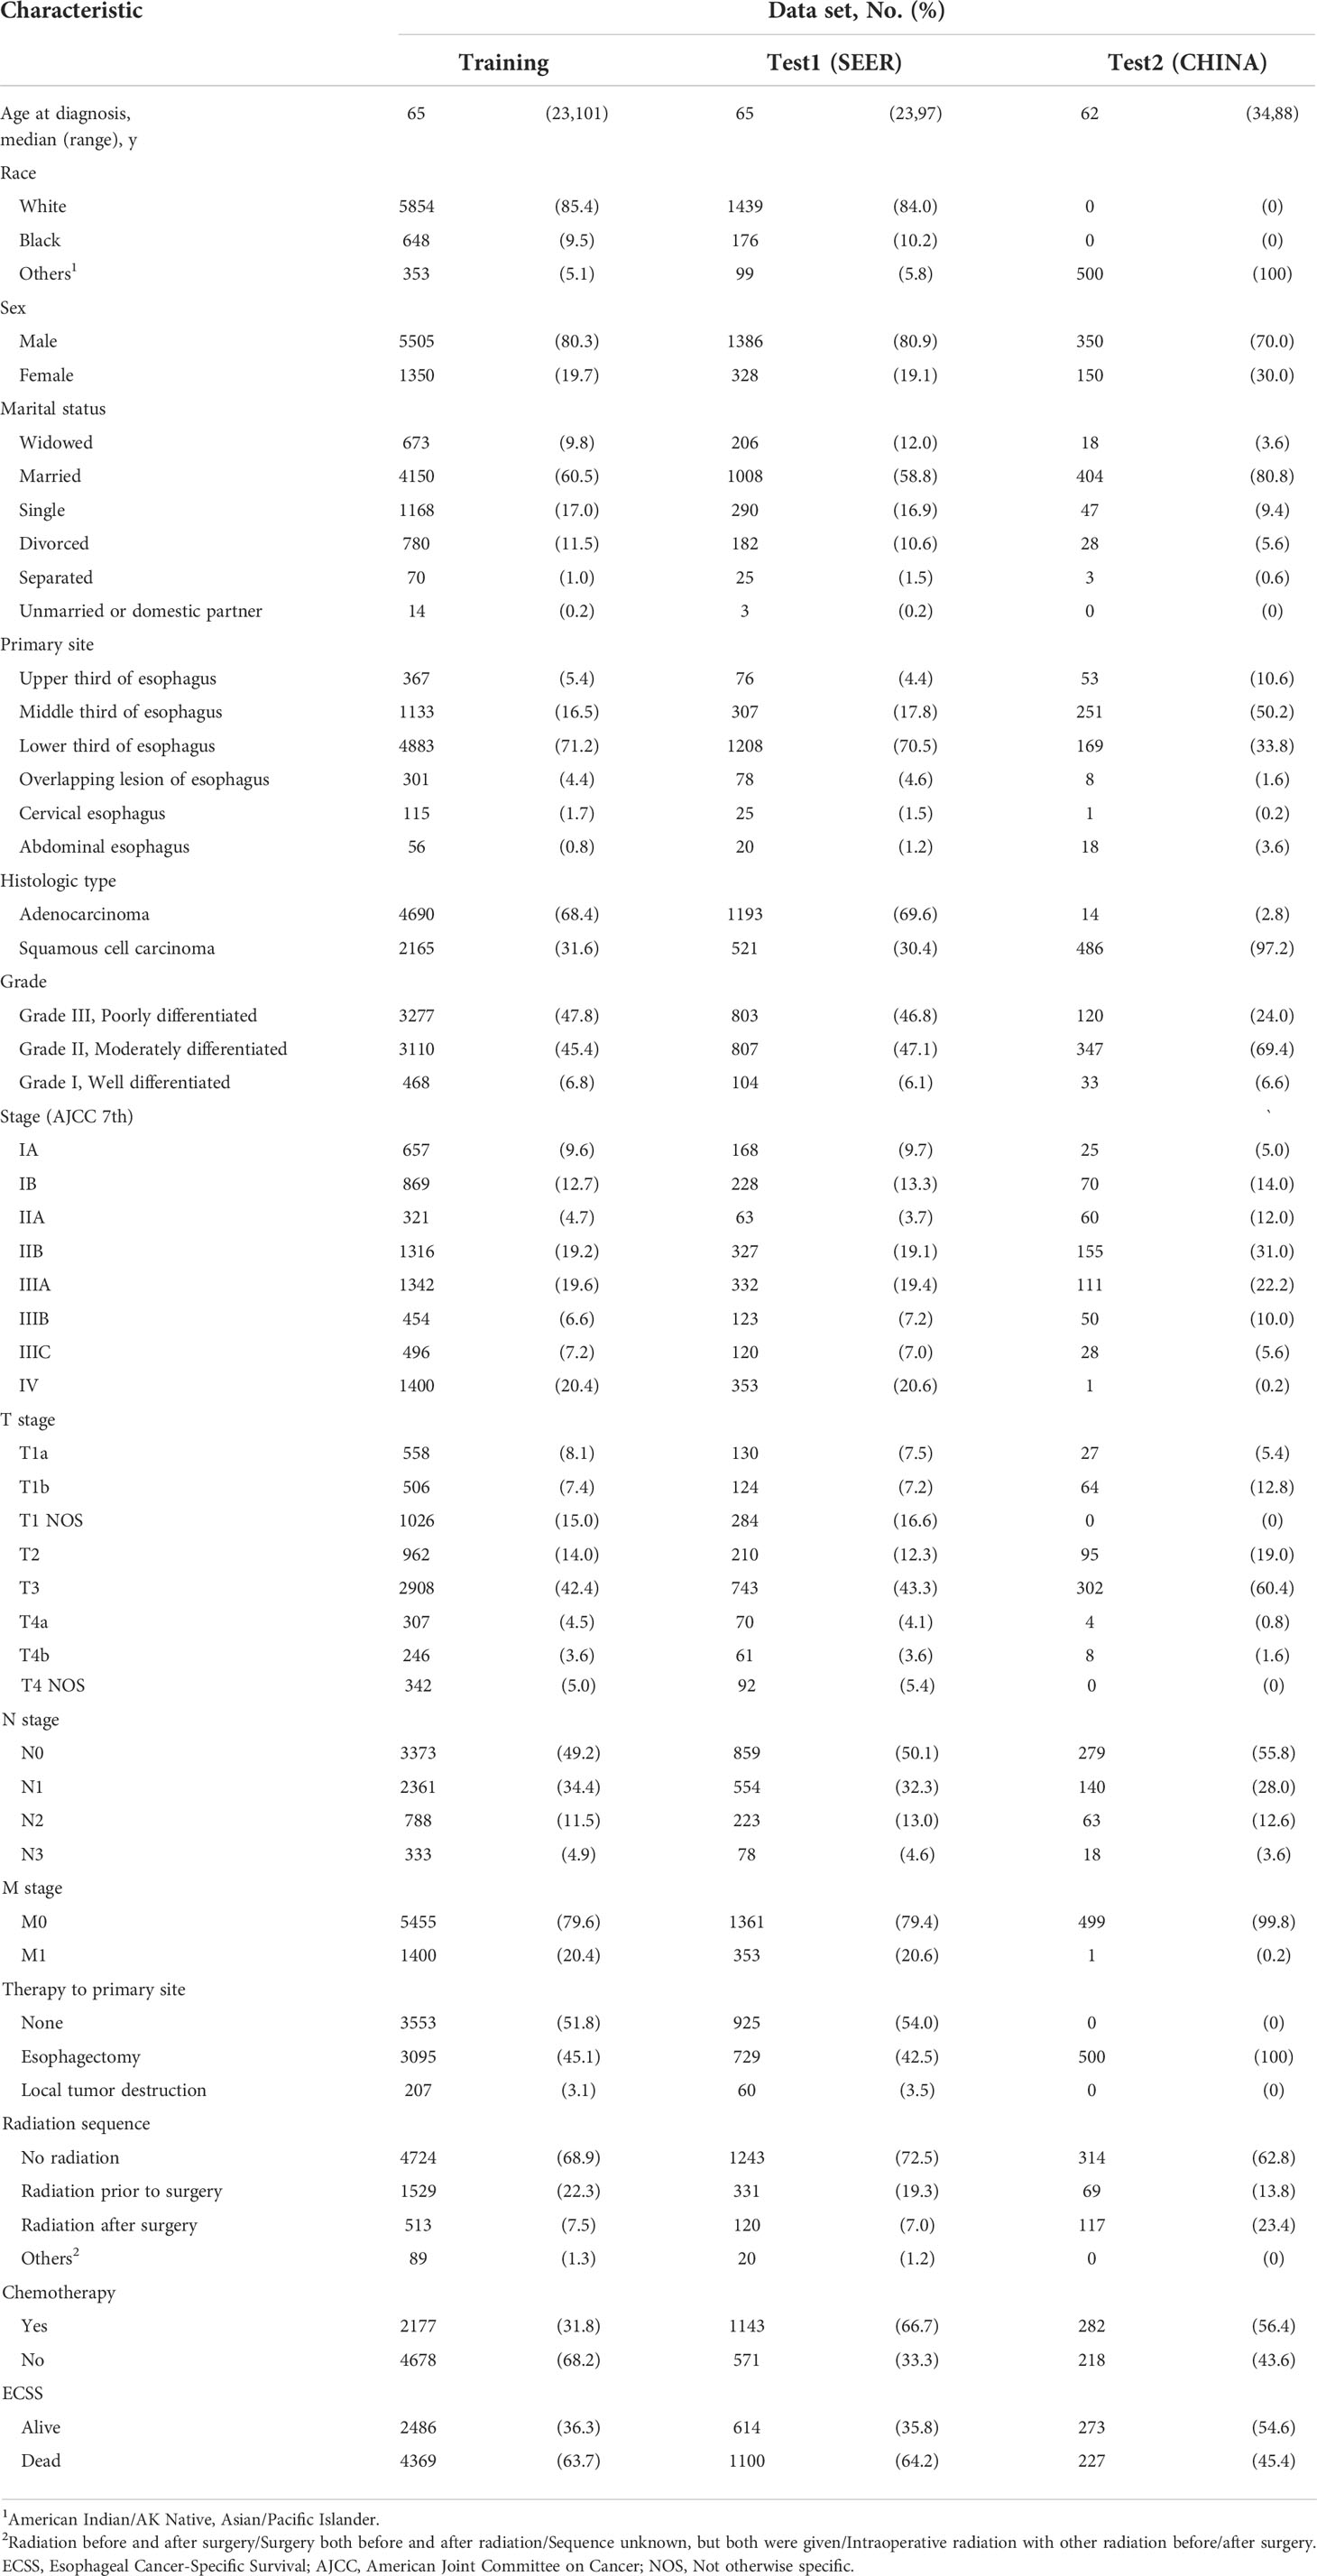
Table 1 Characteristics of patients in the whole data sets of survival analysis.
Training curves
Figure 2A shows the training loss curves of the survival network. The accuracy of the model during the training process was represented by the loss function. The loss function continues to decrease with an increase in the number of iterations. Within 200 epochs, the curve is relatively smooth, indicating that the model has a strong fitting ability and can quickly learn effective discriminant feature information from the training samples. While the model has a good fitting ability on the training set, it also maintains a good generalization ability on the test and validation sets. Figures 2B, C show the training loss curves for the two treatment recommendation models. Owing to the decrease in data diversity in the recommended training set, the decrease in the loss function was smoother than that of the survival model.
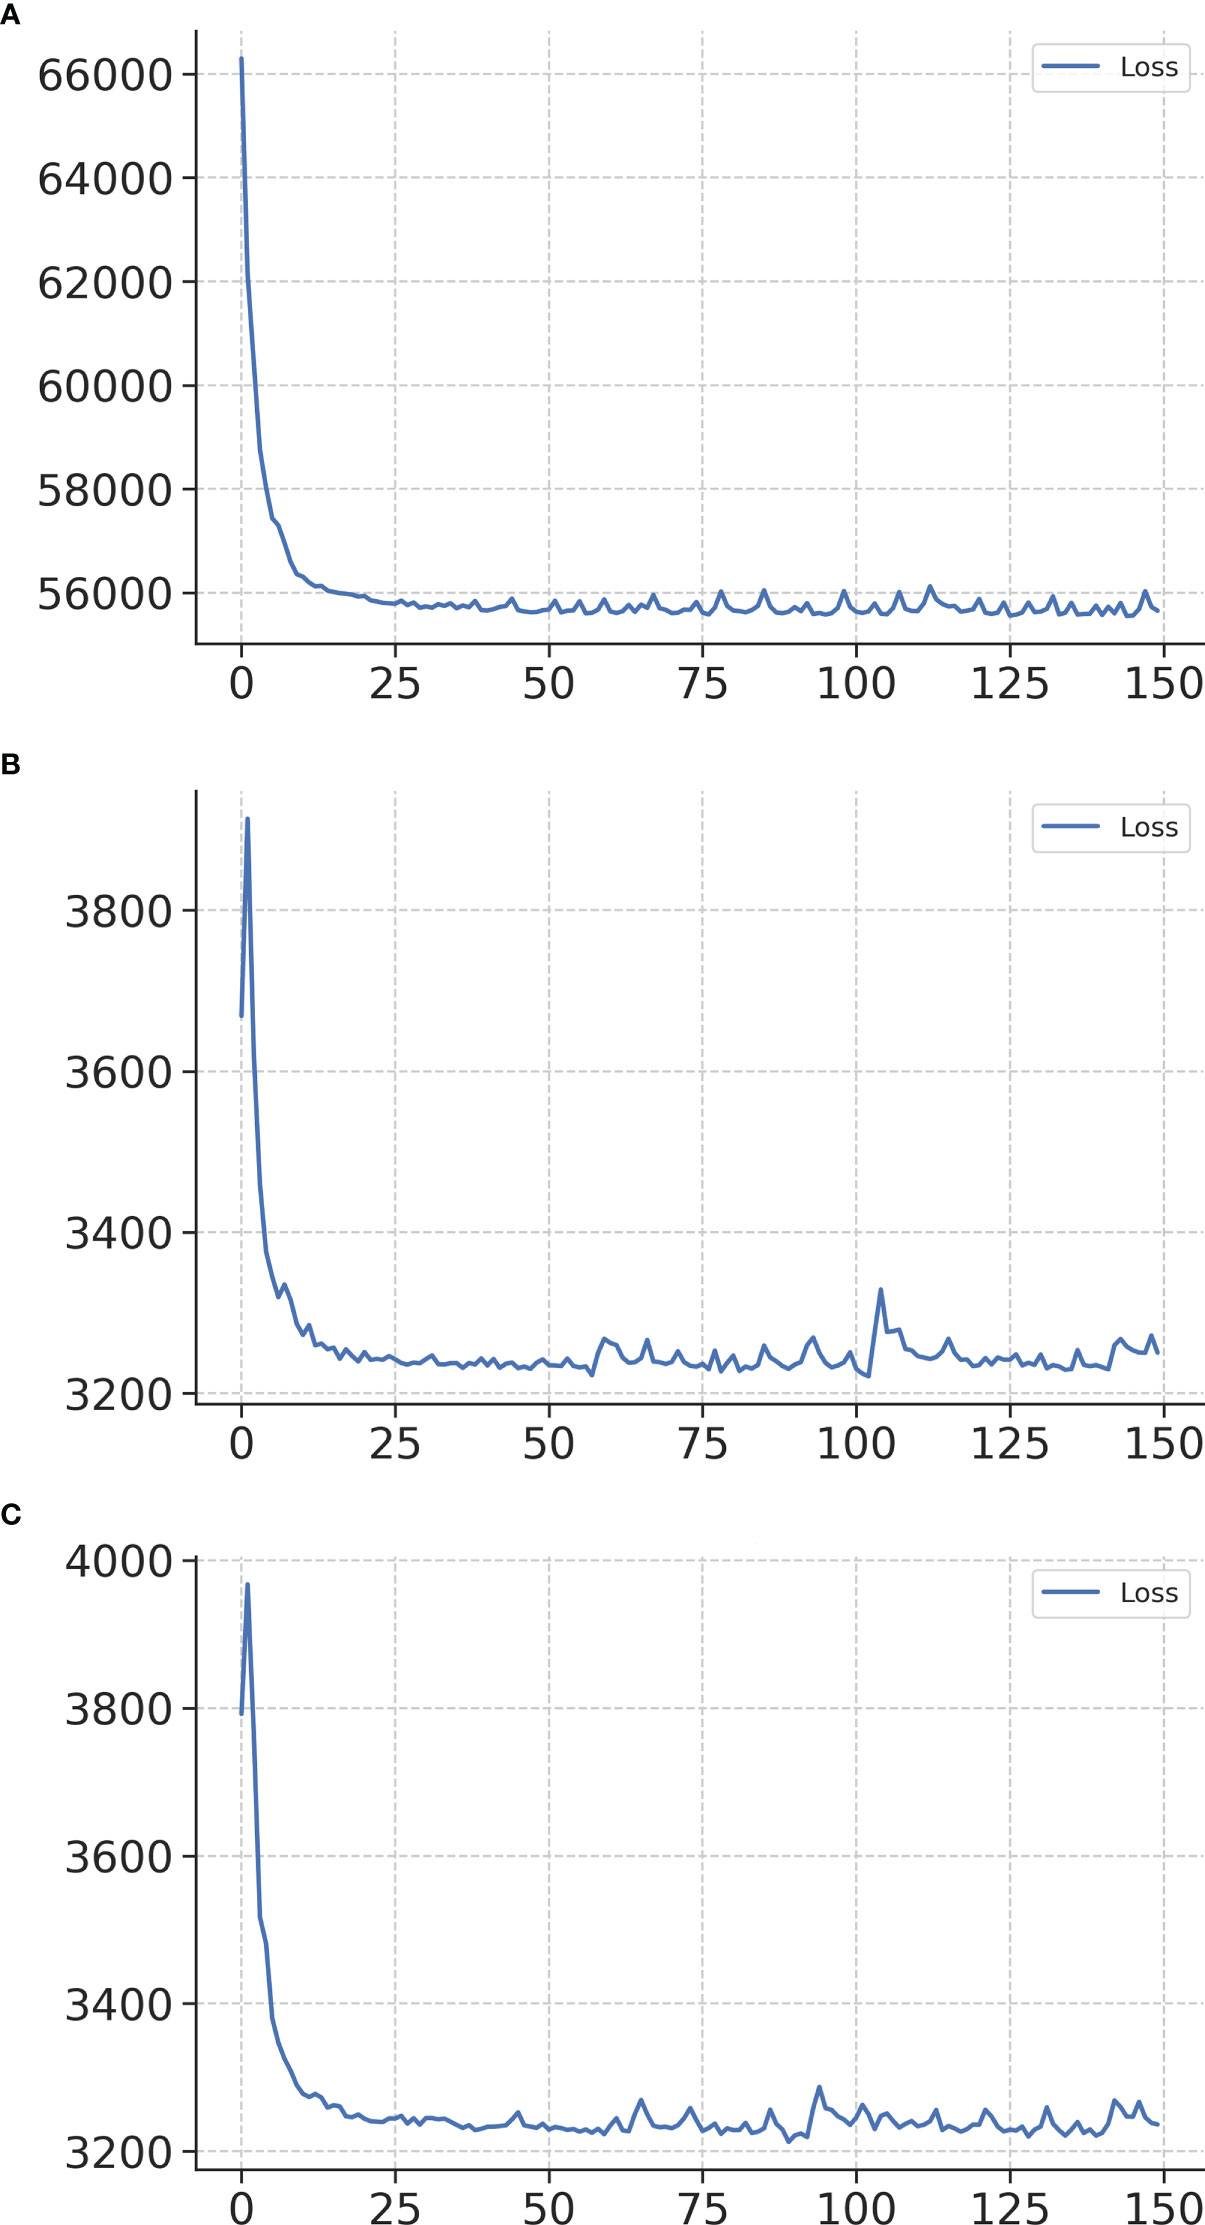
Figure 2 Training loss curves of networks in the survival network (A), treatment recommendation network of surgery alone (B), and treatment recommendation network of adjuvant therapy (C). The x-axis represents the number of iterations, and the y-axis represents the loss function.
Calibration and validation of the prognostic model for ECSS
First, a calibration plot was used to test the consistency between the 3-year and 5-year ECSS predicted by the DeepSurv model and the actual survival of each case in the test dataset. The calibration plot (Figure 3) shows that most points are arranged around a straight line at an angle of 45° to the x-axis, indicating that the predicted value is very close to the actual value.
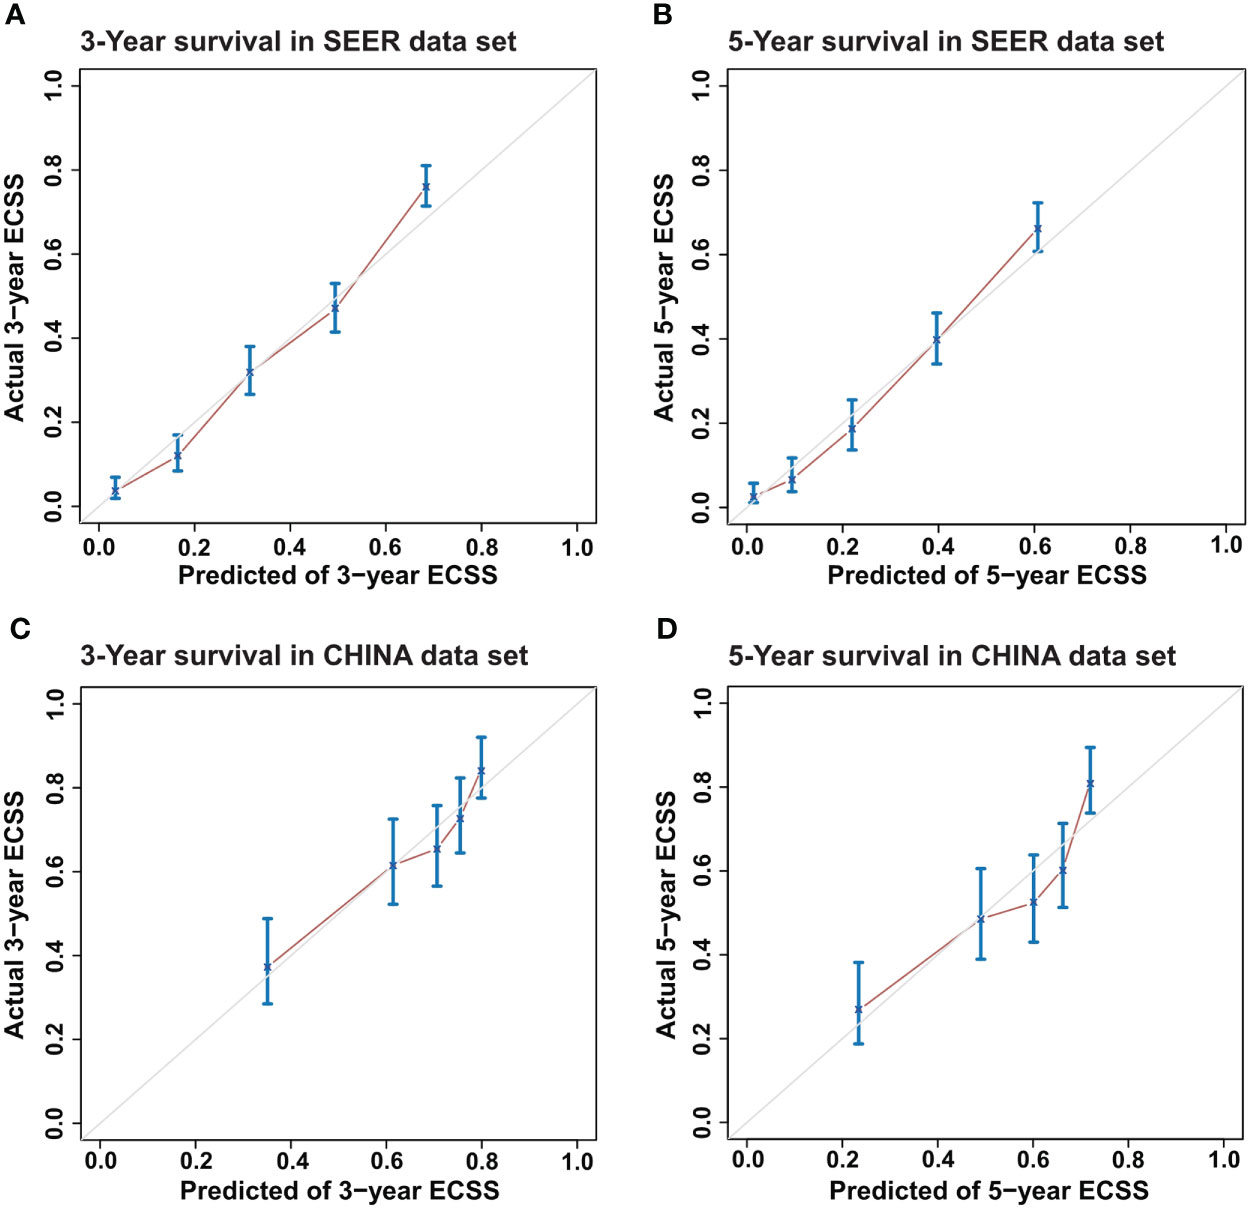
Figure 3 Calibration plots for Esophageal Cancer-Specific Survival (ECSS) for the DeepSurv model. (A) 3-year and (B) 5-year ECSS of Surveillance, Epidemiology, and End Results (SEER) dataset and (C) 3-year and (D) 5-year ECSS of CHINA dataset.
In the SEER test set, the prediction performance of DeepSurv was better than that of TNM staging (C-index=0.753 vs. 0.638), and similar results were obtained using the CHINA test set (C-index=0.687 vs. 0.643). The C-index of the surgery alone model in the SEER and CHINA test sets was 0.734 and 0.689, respectively. The C-index of the adjuvant therapy model in the SEER and CHINA test sets was 0.721 and 0.634, respectively. The feature component weightings in the DeepSurv model are listed in Table S2.
The performances of the CPH and DeepSurv models in predicting the ECSS were also compared. Table 2 lists the factors included in the CPH model. The DeepSurv model performed better than the CPH model in the SEER test set (C-index=0.753 vs. 0.728) and CHINA test set (C-index=0.687 vs. 0.655). The AIC values of the TNM stage, CPH, and DeepSurv model were 70521, 69331 and 69262, respectively.
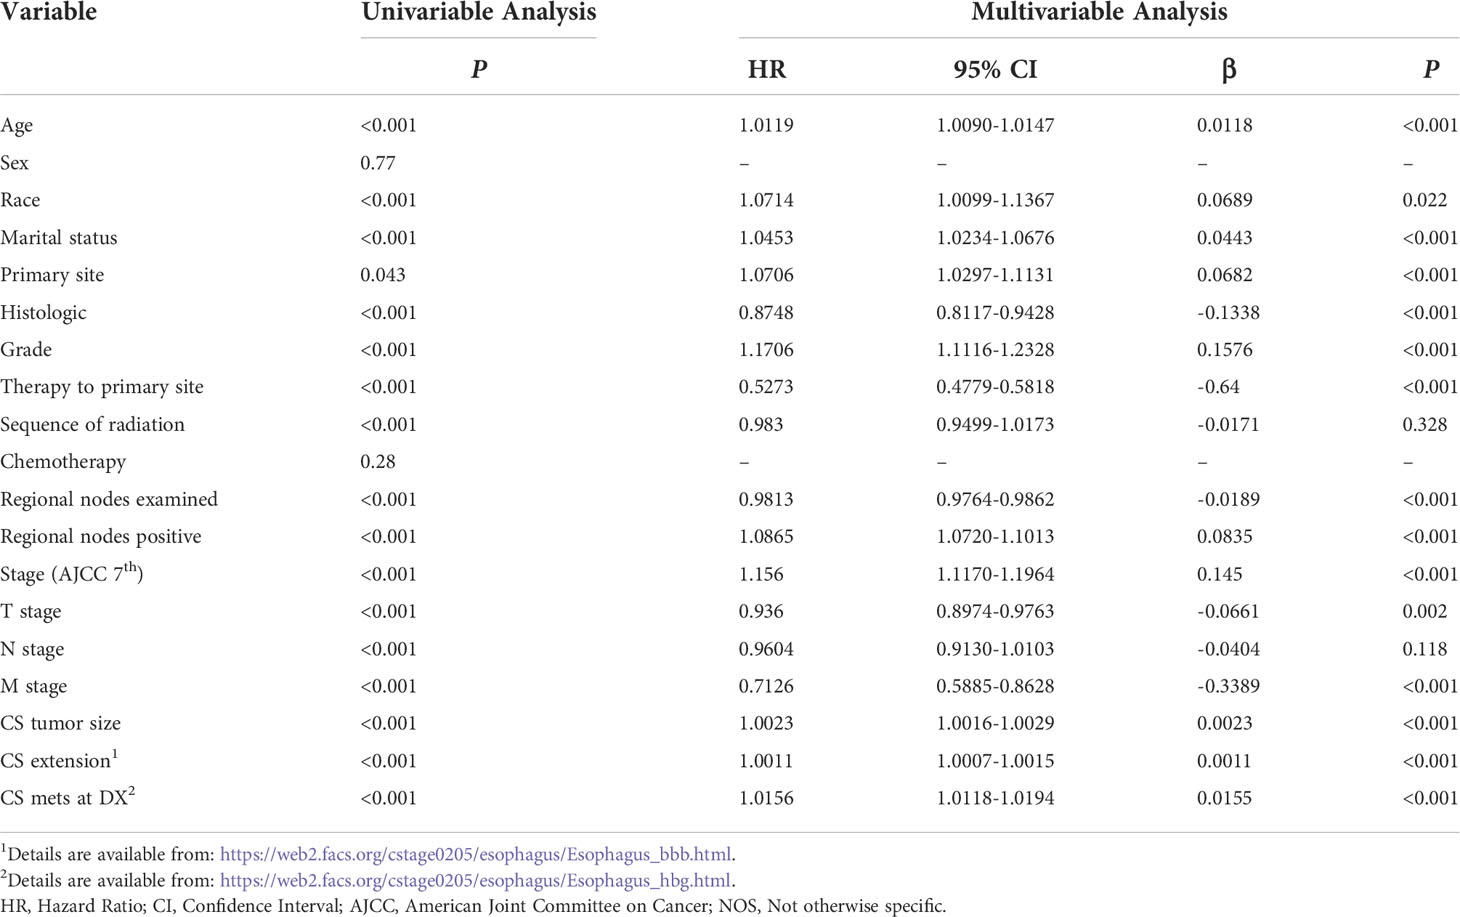
Table 2 The variables included in the Cox proportional hazard model.
Treatment recommender
The baseline clinical characteristics of the patients included in the treatment recommendation study are presented in Table 3. By plotting the Kaplan–Meier survival curve, the clinical prognosis of the two groups of patients (those who followed the treatment recommendation vs. those who did not follow the treatment recommendation) were compared (Figure 4). The survival rate of patients who followed the treatment recommendations was significantly higher than that of patients who did not (SEER: hazard ratio [HR], 0.753; 95% CI, 0.556-0.987; P=0.042 vs. CHINA: HR, 0.633; 95% CI, 0.459-0.834; P=0.0003). ECSS favored surgery alone compared with surgery combined with adjuvant therapy in the subgroup with surgery alone recommendation (SEER: HR, 0.745; 95% CI, 0.543-0.983; P=0.044 vs. CHINA: HR, 0.643; 95% CI, 0.412-0.967; P=0.035). In the subgroup with adjuvant therapy recommendation, patients who only received surgical treatment experienced significantly worse ECSS than those who received surgery combined with adjuvant therapy in the CHINA dataset (HR, 1.657; 95% CI, 1.138-2.639; P=0.012). No significant difference in ECSS was observed between the two treatment opinions in the SEER dataset (HR, 1.782; 95% CI, 0.670-6.252; P=0.225).
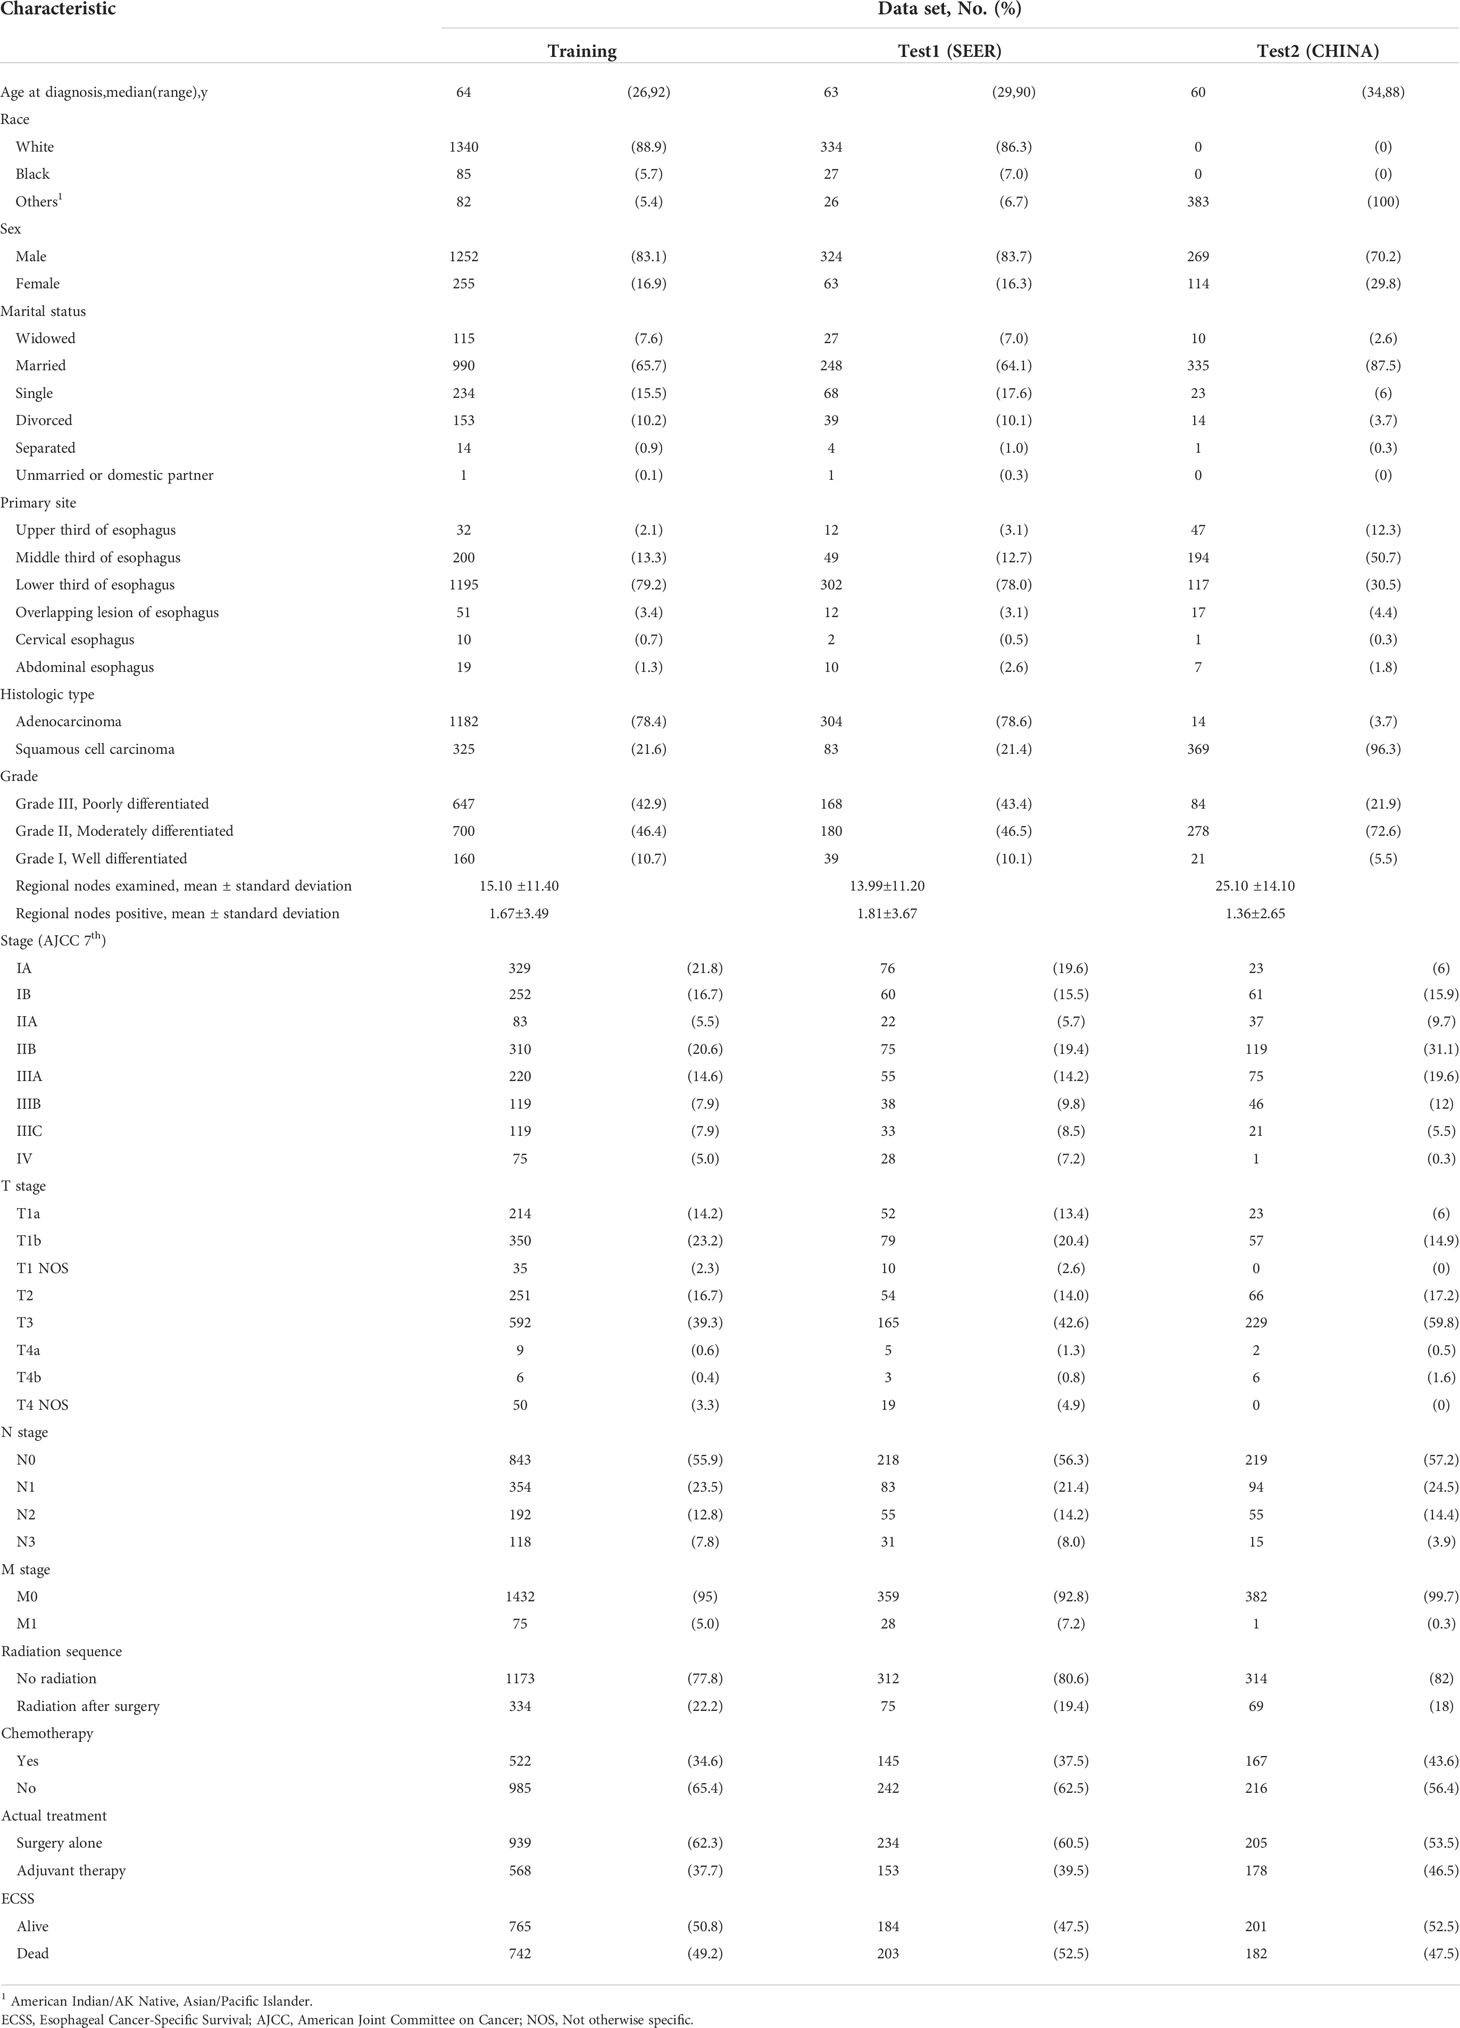
Table 3 Characteristics of patients in the whole data set of treatment recommendation.
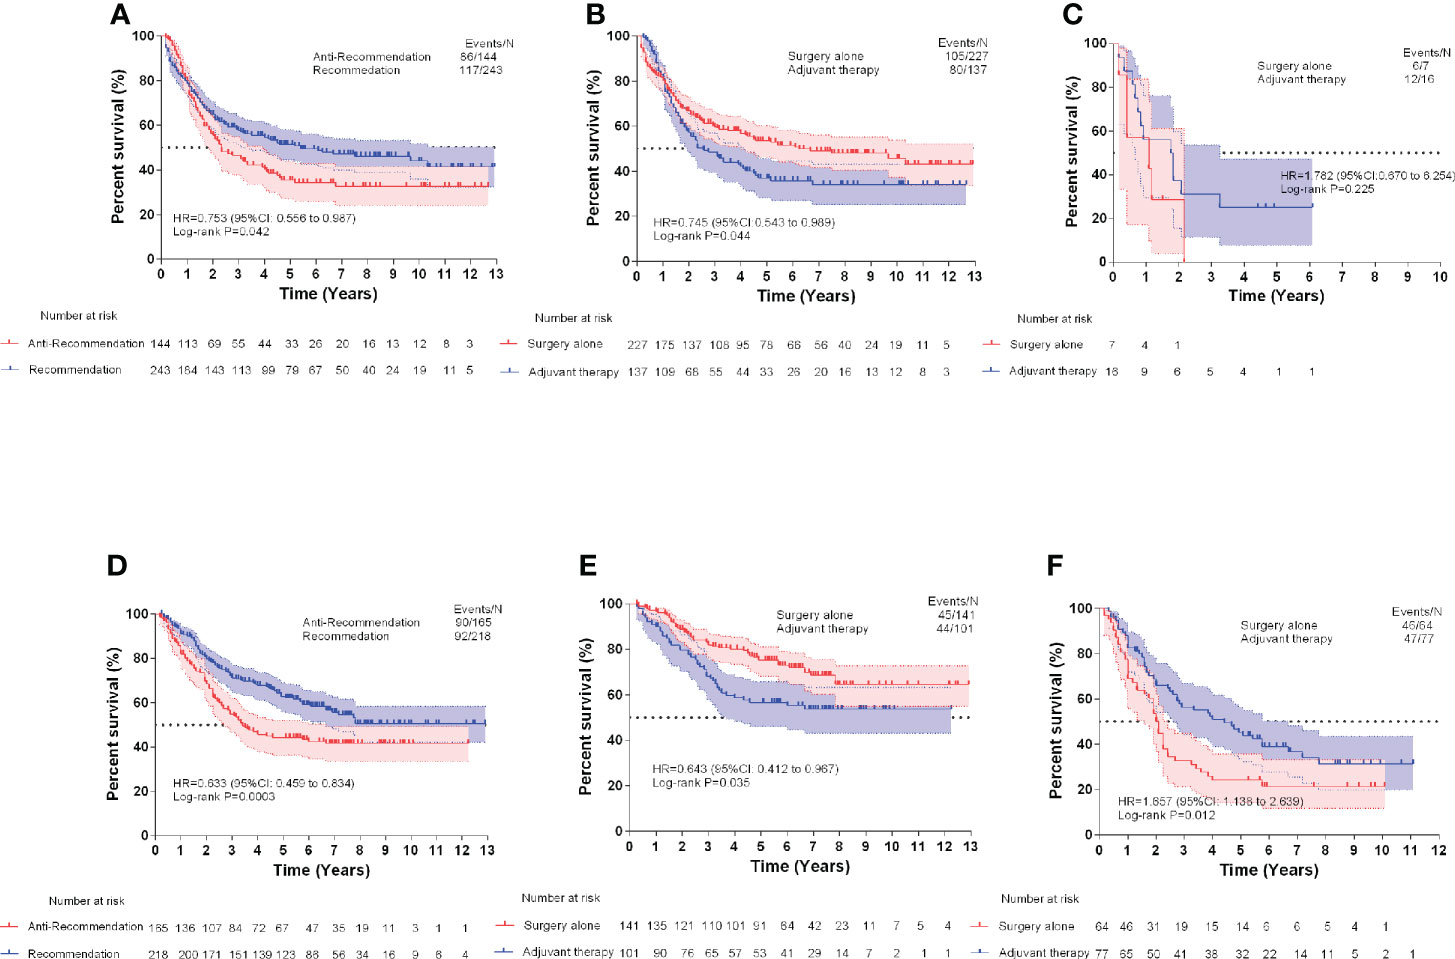
Figure 4 Esophageal cancer-specific survival comparisons of Surveillance, Epidemiology, and End Results (SEER) test dataset (A), SEER surgery alone recommendation test dataset (B), and SEER adjuvant therapy recommendation test dataset (C). Esophageal cancer-specific survival comparisons of CHINA test dataset (D), CHINA surgery alone recommendation test dataset (E), and CHINA adjuvant therapy recommendation test dataset (F).
Model visualization
We have designed an interactive interface to more intuitively display the treatment recommendations provided by the DeepSurv model. The interface includes user input area on the left and treatment recommendation area on the right (Figure 5). Surgeons can input the patient’s prognostic information in the user input area, and click the treatment recommendation button to see the survival risk of different treatment methods in the treatment recommendation area (Supplement Video). This interactive interface helps surgeons to choose treatment options with lower survival risk.
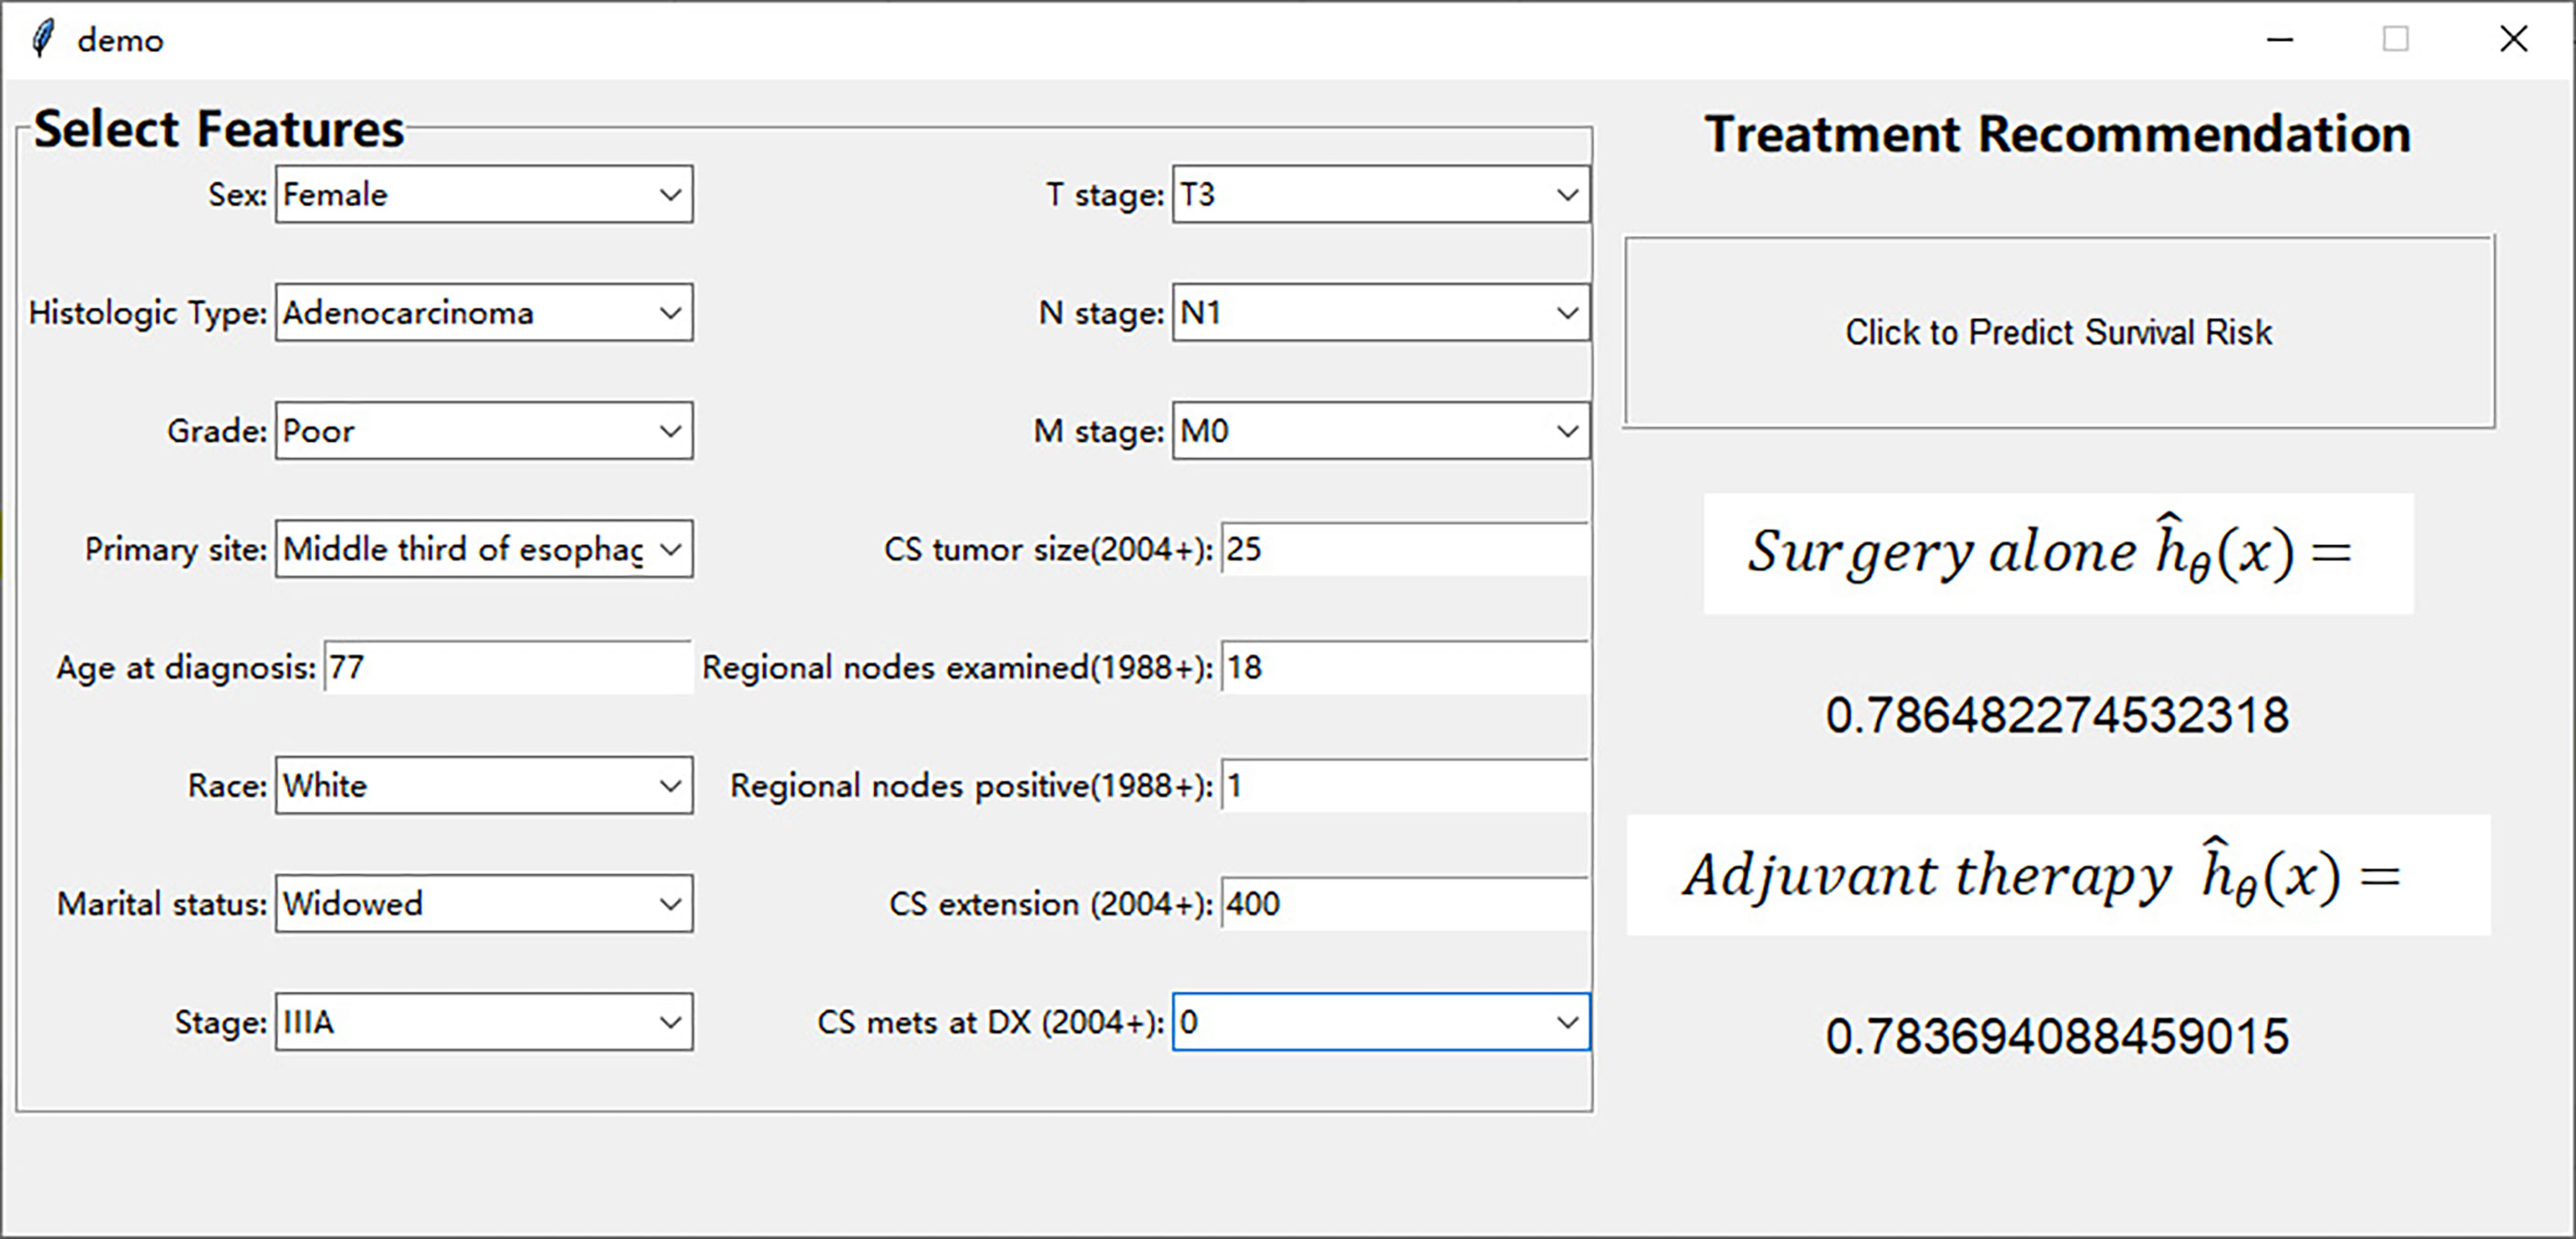
Figure 5 User interface to display the treatment recommendations provided by the DeepSurv model.
Discussion
This study demonstrated the performance of the DeepSurv model in predicting the prognosis of EC patients, providing treatment recommendations, and found that the performance of the deep learning neural network in predicting ECSS was better than that of the CPH model and TNM staging. Additionally, this study found that patients who followed the treatment plan recommended by the DeepSurv model experienced significantly better ECSS than those who did not.
A series of nomograms have been reported to predict the survival of patients with EC (6–9). Shao et al. (8) established a nomogram to predict the survival of patients with EC undergoing radical resection which included seven variables with the C-index of internal and external validation set as 0.66 and 0.65, respectively. Nomogram is a CPH-based risk prediction model that assumes that the risk of death is a linear combination of its covariates. However, in a real clinical scenario, the assumption that the risk function is linear may be oversimplified. Therefore, a more complex survival model is required to better fit survival data to the nonlinear risk function. Neural networks are widely used in the diagnosis of endoscopic and radiological imaging of EC (19–22), evaluation of the depth of tumor invasion and lymph node metastasis (23, 24), treatment response prediction (25), and in other fields. To date, there have been few studies on the application of deep learning neural networks to survival prediction in patients with EC. Mofidi et al. (26) used artificial neural networks to predict the 1-year and 3-year survival rates of postoperative EC patients, with accuracy rates reaching 88% and 91.5%, respectively, while the accuracy rates of TNM staging were only 71.6% and 74.7%, respectively. Sun et al. developed a survival risk prediction model for EC based on nine blood indices (27). Lin et al. developed a 3D attention autoencoder-based survival prediction network for esophageal cancer using pretreatment CT images (28). Rahman and his colleges demonstrated that the Random Survival Forest model performed better than TNM stage for survival prediction of patients after esophagectomy (29). However, these studies generally have the disadvantages of small sample size and lack of external validation.
DeepSurv, first proposed by Katzman et al., is a multilayer perceptron similar to the Faraggi–Simon network (14). The Faraggi–Simon network is a feed-forward neural network, and its advantage is that it can achieve prognostic prediction without performing feature selection on multiple variables. She et al. found that DeepSurv was superior to the traditional linear model for predicting lung cancer-specific survival (15). In this study, for the first time, the DeepSurv model was used to analyze large-scale EC clinical data, and the model was validated using independent external data, which helped address deficiencies in previous studies. This model includes 19 factors and 96 features, whereas the CPH model constructed with the same data includes only 15 variables. The C statistic of the DeepSurv model was better than that of the CPH model and TNM staging in both the SEER and CHINA test datasets, indicating that the DeepSurv model has better discrimination ability. Meanwhile, the DeepSurv model with a low AIC indicated a better model fit. Baseline clinical characteristics revealed that the training cohort was dominated by white adenocarcinoma patients with stage IV disease, and more than half of the patients did not receive surgical treatment. The external validation cohort included all Asian patients; the pathological type was mostly squamous cell carcinoma and the stage was mostly stage IIB. A better C statistic can still be obtained in the validation data that are completely different from the training set, indicating that the DeepSurv model is superior to the TNM and CPH models in predicting the ECSS.
Currently, there is no consensus regarding the use of adjuvant treatment after radical esophagectomy. Studies have shown that postoperative adjuvant radiotherapy can improve the survival rate of patients with lymph node metastasis (30, 31). For pT2-3N0M0 patients without lymph node metastasis, studies have shown that the use of conformal radiotherapy as postoperative radiotherapy may improve overall survival (OS) and disease-free survival rate (32). A retrospective study reported that postoperative adjuvant chemotherapy could improve the survival rate of patients with esophageal squamous cell carcinoma with lymph node metastasis (33). Postoperative adjuvant chemotherapy is recommended for patients with adenocarcinoma of the esophagus and esophagogastric junction (34). However, no large randomized controlled clinical study has confirmed these conclusions. Deng et al. used the nomogram total score as a reference for postoperative adjuvant treatment in EC (7), and found that for patients with scores between 72 and 227, the 5-year OS rate could be improved by at least 10% through postoperative adjuvant therapy. The advantage of the deep learning model for treatment recommendation is that if the clinical features that affect the prognosis are input into the model, the risk of different treatment plans can be immediately obtained, which is conducive to clinical decision making. In our study, the treatment plan recommended by the deep learning model conferred survival benefits to patients. In subgroup analysis, postoperative adjuvant therapy cannot improve the prognosis of patients with recommendations for surgery alone using the deep learning model. This result is similar to that of previous studies, indicating that very low-risk and very high-risk patients have limited benefits from postoperative adjuvant therapy (7). On the other hand, surgery combined with adjuvant therapy significantly improved ECSS in patients with adjuvant therapy recommendations in the CHINA dataset. Unfortunately, no significant difference in the ECSS was observed between the two treatment opinions in the SEER dataset, which may be related to the lack of samples in the adjuvant therapy recommendation subgroup. Our findings show the potential of the deep learning model as a clinical decision-making tool to help guide patient management.
Clearly, deep learning has advantages in analyzing the nonlinear relationship between clinical features and clinical outcomes; however, there are still shortcomings. First, the function of a deep learning network is similar to a black box, which makes the prediction process difficult to interpret. Second, the deep learning model based on a fully connected neural network is more sensitive to noise, and its feature expression ability and robustness still need to be improved. Although the sample of SEER database is large, however, the SEER database has drawbacks: (1) lack of key pathological features that are closely associated with prognosis, such as marginal status, vessel invasion, resection status (R0/R1/R2); (2) there was no information regarding chemotherapy regimen, drugs, dosage, and toxicities; (3) although there is information on the anatomical target field of radiation, further information on specific radiation type is lacking. These data points are incredibly important for prognosticating survival. Therefore, this model needs to be further improved. In addition, because of the single-center design and insufficient number of cases, the external validation of this model is insufficient, and further studies are needed to verify the advantages of the deep learning network in survival prediction.
Conclusions
In this study, for the first time, a neural network-based CPH model was used to analyze the relationship between various clinical features and survival outcomes of patients with EC in a real clinical scenario, and satisfactory results were achieved. As a new analytical tool, the DeepSurv model will likely become more widely applied in outcome prediction and treatment recommendations for patients with EC.
Data availability statement
The data analyzed in this study is subject to the following licenses/restrictions: We obtained permission to access the database after signing and submitting the SEER Research Data Agreement form via email. The data that support the findings of this study are available from the SEER database but restrictions apply to the availability of these data, which were used under license for the current study, and so are not publicly available. Requests to access these datasets should be directed to eHVueXV4dUBzaW5hLmNvbQ==.
Ethic statement
The study was conducted in accordance with the Declaration of Helsinki, and approved by the Ethics Committee of Fujian Provincial Hospital (protocol code k2021-12-042). Patient consent was waived due to the retrospective nature of this study.
Author contributions
CH: Validation, Writing - Original Draft, Writing - Review & Editing, Visualization. YD: Resources, Writing - Original Draft, Writing - Review & Editing, Visualization. QC: Resources. HC: Methodology, Software. YL: Investigation, Data Curation. JW: Investigation, Data Curation. XX: Conceptualization, Project administration, Funding acquisition. XC: Conceptualization, Methodology, Software, Formal analysis, Supervision. All authors contributed to the article and approved the submitted version.
Funding
This research was funded by the Special Fund of Fujian Provincial Finance Department [grant number (2021)917] and Natural Science Foundation of Fujian Province [grant number 2022J01412].
Conflict of interest
The authors declare that the research was conducted in the absence of any commercial or financial relationships that could be construed as a potential conflict of interest.
Publisher’s note
All claims expressed in this article are solely those of the authors and do not necessarily represent those of their affiliated organizations, or those of the publisher, the editors and the reviewers. Any product that may be evaluated in this article, or claim that may be made by its manufacturer, is not guaranteed or endorsed by the publisher.
Supplementary material
The Supplementary Material for this article can be found online at: https://www.frontiersin.org/articles/10.3389/fonc.2022.971190/full#supplementary-material
References
1. Bray F, Ferlay J, Soerjomataram I, Siegel RL, Torre LA, Jemal A. Global cancer statistics 2018: Globocan estimates of incidence and mortality worldwide for 36 cancers in 185 countries. CA Cancer J Clin (2018) 68(6):394–424. doi: 10.3322/caac.21492
2. Saeki H, Sohda M, Sakai M, Sano A, Shirabe K. Role of surgery in multidisciplinary treatment strategies for locally advanced esophageal squamous cell carcinoma. Ann Gastroenterol Surg (2020) 4(5):490–7. doi: 10.1002/ags3.12364
3. Rice T, Gress D, Patil D, Hofstetter W, Kelsen D, Blackstone E. Cancer of the esophagus and esophagogastric junction-major changes in the American joint committee on cancer eighth edition cancer staging manual. CA Cancer J Clin (2017) 67(4):304–17. doi: 10.3322/caac.21399
4. Rizk N, Venkatraman E, Bains M, Park B, Flores R, Tang L, et al. American Joint committee on cancer staging system does not accurately predict survival in patients receiving multimodality therapy for esophageal adenocarcinoma. J Clin Oncol (2007) 25(5):507–12. doi: 10.1200/jco.2006.08.0101
5. Rice T, Ishwaran H, Hofstetter W, Kelsen D, Apperson-Hansen C, Blackstone E. Recommendations for pathologic staging (Ptnm) of cancer of the esophagus and esophagogastric junction for the 8th edition Ajcc/Uicc staging manuals. Dis Esophag (2016) 29(8):897–905. doi: 10.1111/dote.12533
6. Su D, Zhou X, Chen Q, Jiang Y, Yang X, Zheng W, et al. Prognostic nomogram for thoracic esophageal squamous cell carcinoma after radical esophagectomy. PloS One (2015) 10(4):e0124437. doi: 10.1371/journal.pone.0124437
7. Deng W, Zhang W, Yang J, Ni W, Yu S, Li C, et al. Nomogram to predict overall survival for thoracic esophageal squamous cell carcinoma patients after radical esophagectomy. Ann Surg Oncol (2019) 26(9):2890–8. doi: 10.1245/s10434-019-07393-w
8. Shao C, Liu X, Yao S, Li Z, Cong Z, Luo J, et al. Development and validation of a new clinical staging system to predict survival for esophageal squamous cell carcinoma patients: Application of the nomogram. Eur J Surg Oncol (2021) 47(6):1473–80. doi: 10.1016/j.ejso.2020.12.004
9. Shao C, Yu Y, Li Q, Liu X, Song H, Shen Y, et al. Development and validation of a clinical prognostic nomogram for esophageal adenocarcinoma patients. Front Oncol (2021) 11:736573. doi: 10.3389/fonc.2021.736573
10. Randall R, Cable M. Nominal nomograms and marginal margins: What is the law of the line? Lancet Oncol (2016) 17(5):554–6. doi: 10.1016/s1470-2045(16)00072-3
11. Kopecky K, Urbach D, Schwarze M. Risk calculators and decision aids are not enough for shared decision making. JAMA Surg (2019) 154(1):3–4. doi: 10.1001/jamasurg.2018.2446
12. Huang S, Yang J, Fong S, Zhao Q. Artificial intelligence in cancer diagnosis and prognosis: Opportunities and challenges. Cancer Lett (2020) 471:61–71. doi: 10.1016/j.canlet.2019.12.007
13. Matsuo K, Purushotham S, Jiang B, Mandelbaum R, Takiuchi T, Liu Y, et al. Survival outcome prediction in cervical cancer: Cox models vs deep-learning model. Am J Obstet Gynecol (2019) 220(4):381.e1–.e14. doi: 10.1016/j.ajog.2018.12.030
14. Katzman JL, Shaham U, Cloninger A, Bates J, Jiang T, Kluger Y. Deepsurv: Personalized treatment recommender system using a cox proportional hazards deep neural network. BMC Med Res Methodol (2018) 18(1):24. doi: 10.1186/s12874-018-0482-1
15. She Y, Jin Z, Wu J, Deng J, Zhang L, Su H, et al. Development and validation of a deep learning model for non–small cell lung cancer survival. JAMA Netw Open (2020) 3(6):e205842. doi: 10.1001/jamanetworkopen.2020.5842
16. Kingma DP, Ba J. Adam: A method for stochastic optimization. (2014). arXiv:1412.6980. Available at: https://ui.adsabs.harvard.edu/abs/2014arXiv1412.6980K
17. Bergstra J, Bengio Y. Random search for hyper-parameter optimization. J Mach Learn Res (2012) 13(1):281–305. doi: 10.1016/j.chemolab.2011.12.002
18. Cavanaugh JE, Neath AA. Akaike’s information criterion: Background, derivation, properties, and refinements. In: Lovric M, editor. International encyclopedia of statistical science. Berlin, Heidelberg: Springer Berlin Heidelberg (2011). p. 26–9.
19. Tang D, Wang L, Jiang J, Liu Y, Ni M, Fu Y, et al. A novel deep learning system for diagnosing early esophageal squamous cell carcinoma: A multicenter diagnostic study. Clin Trans Gastroenterol (2021) 12(8):e00393. doi: 10.14309/ctg.0000000000000393
20. Gehrung M, Crispin-Ortuzar M, Berman A, O'Donovan M, Fitzgerald R, Markowetz F. Triage-driven diagnosis of barrett's esophagus for early detection of esophageal adenocarcinoma using deep learning. Nat Med (2021) 27(5):833–41. doi: 10.1038/s41591-021-01287-9
21. Cai S, Li B, Tan W, Niu X, Yu H, Yao L, et al. Using a deep learning system in endoscopy for screening of early esophageal squamous cell carcinoma (with video). Gastrointest Endosc (2019) 90(5):745–53.e2. doi: 10.1016/j.gie.2019.06.044
22. Sui H, Ma R, Liu L, Gao Y, Zhang W, Mo Z. Detection of incidental esophageal cancers on chest ct by deep learning. Front Oncol (2021) 11:700210. doi: 10.3389/fonc.2021.700210
23. Wu L, Yang X, Cao W, Zhao K, Li W, Ye W, et al. Multiple level ct radiomics features preoperatively predict lymph node metastasis in esophageal cancer: A multicentre retrospective study. Front Oncol (2020) 9:1548. doi: 10.3389/fonc.2019.01548
24. Nakagawa K, Ishihara R, Aoyama K, Ohmori M, Nakahira H, Matsuura N, et al. Classification for invasion depth of esophageal squamous cell carcinoma using a deep neural network compared with experienced endoscopists. Gastrointest Endosc (2019) 90(3):407–14. doi: 10.1016/j.gie.2019.04.245
25. Hu Y, Xie C, Yang H, Ho JWK, Wen J, Han L, et al. Computed tomography-based deep-learning prediction of neoadjuvant chemoradiotherapy treatment response in esophageal squamous cell carcinoma. Radiother Oncol (2021) 154:6–13. doi: 10.1016/j.radonc.2020.09.014
26. Mofidi R, Deans C, Duff M, de Beaux A, Paterson Brown S. Prediction of survival from carcinoma of oesophagus and oesophago-gastric junction following surgical resection using an artificial neural network. Eur J Surg Oncol (2006) 32(5):533–9. doi: 10.1016/j.ejso.2006.02.020
27. Sun J, Yang Y, Wang Y, Wang L, Song X, Zhao X. Survival risk prediction of esophageal cancer based on self-organizing maps clustering and support vector machine ensembles. IEEE Access (2020) 8:131449–60. doi: 10.1109/ACCESS.2020.3007785
28. Lin Z, Cai W, Hou W, Chen Y, Gao B, Mao R, et al. Ct-guided survival prediction of esophageal cancer. IEEE J BioMed Health Inform (2022) 26(6):2660–9. doi: 10.1109/jbhi.2021.3132173
29. Rahman SA, Walker RC, Maynard N, Trudgill N, Crosby T, Cromwell DA, et al. The augis survival predictor: Prediction of long-term and conditional survival after esophagectomy using random survival forests. Ann Surg (2021). doi: 10.1097/SLA.0000000000004794
30. Yu S, Zhang W, Ni W, Xiao Z, Wang Q, Zhou Z, et al. A propensity-score matching analysis comparing long-term survival of surgery alone and postoperative treatment for patients in node positive or stage iii esophageal squamous cell carcinoma after R0 esophagectomy. Radiother Oncol (2019) 140:159–66. doi: 10.1016/j.radonc.2019.06.020
31. Schreiber D, Rineer J, Vongtama D, Wortham A, Han P, Schwartz D, et al. Impact of postoperative radiation after esophagectomy for esophageal cancer. J Thorac Oncol (2010) 5(2):244–50. doi: 10.1097/JTO.0b013e3181c5e34f
32. Yang J, Zhang W, Xiao Z, Wang Q, Zhou Z, Zhang H, et al. The impact of postoperative conformal radiotherapy after radical surgery on survival and recurrence in pathologic T3n0m0 esophageal carcinoma: A propensity score-matched analysis. J Thorac Oncol (2017) 12(7):1143–51. doi: 10.1016/j.jtho.2017.03.024
33. Lyu X, Huang J, Mao Y, Liu Y, Feng Q, Shao K, et al. Adjuvant chemotherapy after esophagectomy: Is there a role in the treatment of the lymph node positive thoracic esophageal squamous cell carcinoma? J Surg Oncol (2014) 110(7):864–8. doi: 10.1002/jso.23716
Keywords: deep learning, esophageal cancer, DeepSurv, survival prediction, treatment recommendation
Citation: Huang C, Dai Y, Chen Q, Chen H, Lin Y, Wu J, Xu X and Chen X (2022) Development and validation of a deep learning model to predict survival of patients with esophageal cancer. Front. Oncol. 12:971190. doi: 10.3389/fonc.2022.971190
Received: 16 June 2022; Accepted: 20 July 2022;
Published: 10 August 2022.
Edited by:
Ying-Tai Chen, Chinese Academy of Medical Sciences and Peking Union Medical College, ChinaReviewed by:
Ran Wei, Chinese Academy of Medical Sciences and Peking Union Medical College, ChinaZhenhua Lu, Beijing Hospital, China
Copyright © 2022 Huang, Dai, Chen, Chen, Lin, Wu, Xu and Chen. This is an open-access article distributed under the terms of the Creative Commons Attribution License (CC BY). The use, distribution or reproduction in other forums is permitted, provided the original author(s) and the copyright owner(s) are credited and that the original publication in this journal is cited, in accordance with accepted academic practice. No use, distribution or reproduction is permitted which does not comply with these terms.
*Correspondence: Xunyu Xu, eHVueXV4dUBzaW5hLmNvbQ==; Xiao Chen, bmFsYW55dTIwMDBAMTYzLmNvbQ==
†These authors have contributed equally to this work and share first authorship