 Maria P. Gorenflo1
 Erin S. Murphy
 Jennifer Cullen
 Jennifer S. Yu
- 1Cleveland Clinic Lerner College of Medicine, Case Western Reserve University, Cleveland, OH, United States
- 2Department of Radiation Oncology, Cleveland Clinic Foundation, Cleveland, OH, United States
- 3Department of Population and Quantitative Health Sciences, Case Comprehensive Cancer Center, Case Western Reserve University, Cleveland, OH, United States
- 4Department of Cancer Biology, Lerner Research Institute, Cleveland Clinic Foundation, Cleveland, OH, United States
In the United States, an individual’s access to resources, insurance status, and wealth are critical social determinants that affect both the risk and outcomes of many diseases. One disease for which the correlation with socioeconomic status (SES) is less well-characterized is glioblastoma (GBM), a devastating brain malignancy. The aim of this study was to review the current literature characterizing the relationship between area-level SES and both GBM incidence and prognosis in the United States. A query of multiple databases was performed to identify the existing data on SES and GBM incidence or prognosis. Papers were filtered by relevant terms and topics. A narrative review was then constructed to summarize the current body of knowledge on this topic. We obtained a total of three papers that analyze SES and GBM incidence, which all report a positive correlation between area-level SES and GBM incidence. In addition, we found 14 papers that focus on SES and GBM prognosis, either overall survival or GBM-specific survival. Those studies that analyze data from greater than 1,530 patients report a positive correlation between area-level SES and individual prognosis, while those with smaller study populations report no significant relationship. Our report underlines the strong association between SES and GBM incidence and highlights the need for large study populations to assess SES and GBM prognosis to ideally guide interventions that improve outcomes. Further studies are needed to determine underlying socio-economic stresses on GBM risk and outcomes to identify opportunities for intervention.
1 Introduction
Glioblastoma (GBM) is a grade IV glioma that is the most common malignant primary brain tumor, comprising 60% of all cases with an annual incidence of 5.0 per 100,000 (1). According to the Central Brain Tumor Registry of the United States (CBTRUS), over 63,000 Americans were diagnosed with GBM between 2015 and 2019 (2). Standard of care currently involves surgical resection followed by radiation therapy and chemotherapy, but even with this aggressive treatment, the overall five-year survival rate is only 5% (3). Many efforts have been made over the years to better elucidate the underlying biological and physiological basis of GBM, but the socioeconomic factors underlying disease development and outcomes have received less attention. When considering the United States, where access to quality healthcare largely depends on an individual’s economic resources, such as income and health insurance, socioeconomic factors are particularly crucial to analyze with respect to the incidence and prognosis of any disease, including GBM. Previous studies have uncovered correlations between area-level socioeconomic metrics and either GBM or other gliomas (4–7) in the United States on the regional, state, and national levels. Here, we report a comprehensive review to synthesize current knowledge regarding the correlations between socioeconomic status (SES) and GBM incidence and prognosis in the United States.
2 Methods
A review of studies was conducted by querying those published between January 1, 1990, and June 1, 2022, on Google Scholar (Google Scholar, RRID : SCR_008878), PubMed (PubMed, RRID : SCR_004846), Scopus (Scopus, RRID : SCR_022559), and Web of Science (Web of Science, RRID : SCR_022706). The Cochrane database (Cochrane Library, RRID : SCR_013000) was searched to determine that no identical review had previously been conducted. The terms used for these searches were “socioeconomic status,” “SES,” “income,” “glioblastoma,” and “GBM.” All studies found using this method were initially recorded, then further filtered. The criteria for selection were studies that analyzed patients in the United States and characterized a relationship between SES and either GBM incidence, GBM-specific survival, or overall survival (OS) in patients with GBM. SES involved either a measurement of income itself, an aggregate index for SES involving income, defined economic variables (such as education, poverty, unemployment, rent, and house value measures), or a self-identified SES measurement whose components were not specified. SES was also measured on either the individual or area level. Use of these search criteria led to identification of 80 studies. These studies were then individually reviewed by full-text analysis and synthesized in a narrative review. Studies were excluded if the target population was outside of the United States, if the cancer analyzed was not GBM, if SES was not included as a variable, or if the outcome measured was not GBM incidence or disease-specific or overall survival of GBM patients (Figure 1). The full-text analysis yielded a final list of 16 studies (three for GBM incidence and 14 for GBM prognosis, including one study that measured both) that were included in the Results. The following characteristics were recorded: title, year, authors, participants, data sources, SES measure, methodology, dependent outcomes, and key findings.
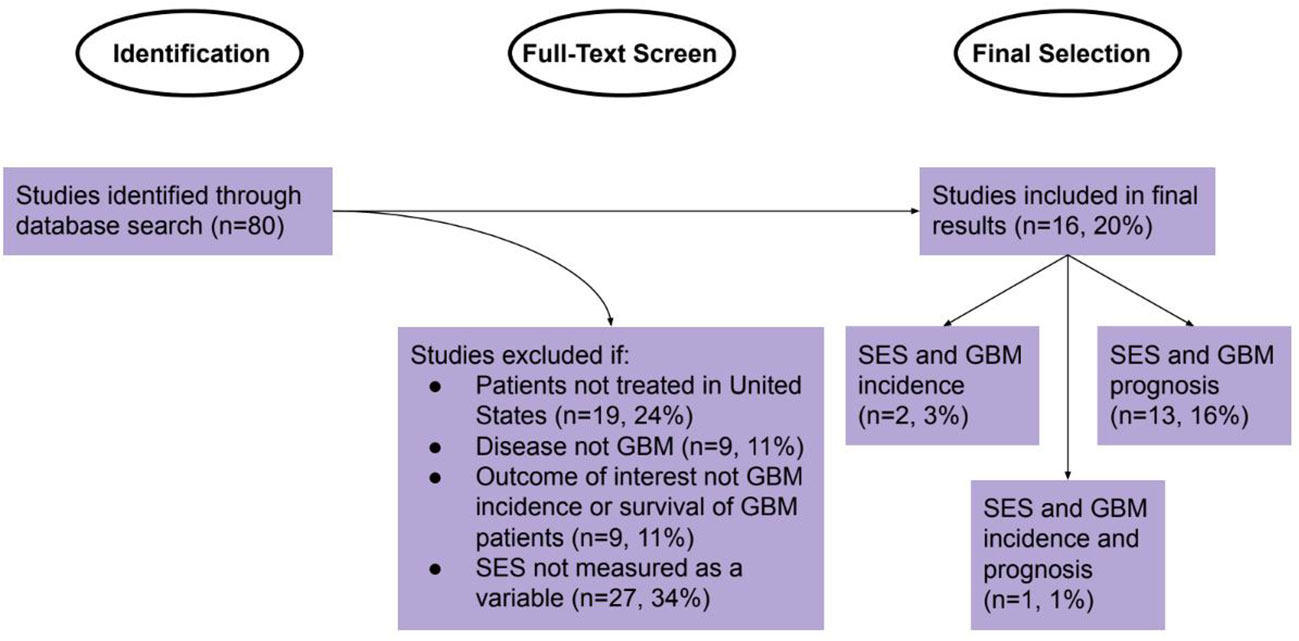
Figure 1 Identification, Screening, and Selection of Studies for Review.
3 Results
Overall, 16 studies met the criteria for inclusion: two for SES and GBM incidence, 13 for SES and GBM specific survival or OS, and one for SES and both GBM incidence and OS. The GBM incidence papers analyzed between 3,832 and 45,696 patients and were published between 2005 and 2019 (Table 1). The GBM survival and OS papers analyzed between 116 and 61,346 patients and were published between 2007 and 2022; 12 papers measured OS as their outcome, one measured GBM-specific mortality, and one measured both (Table 2).
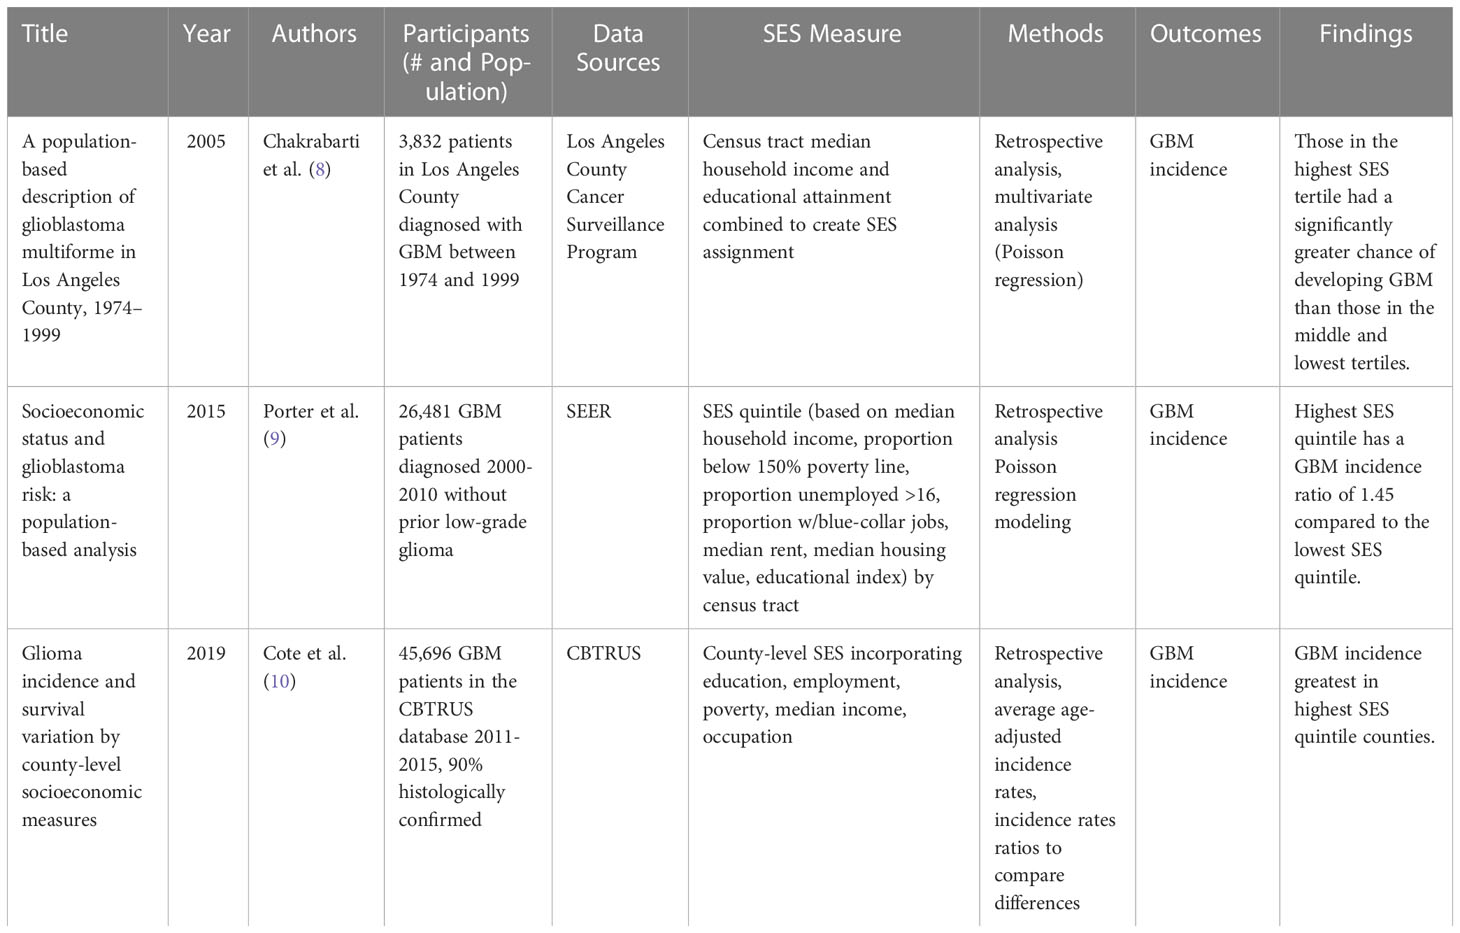
Table 1 Area-level socioeconomic status and GBM incidence.
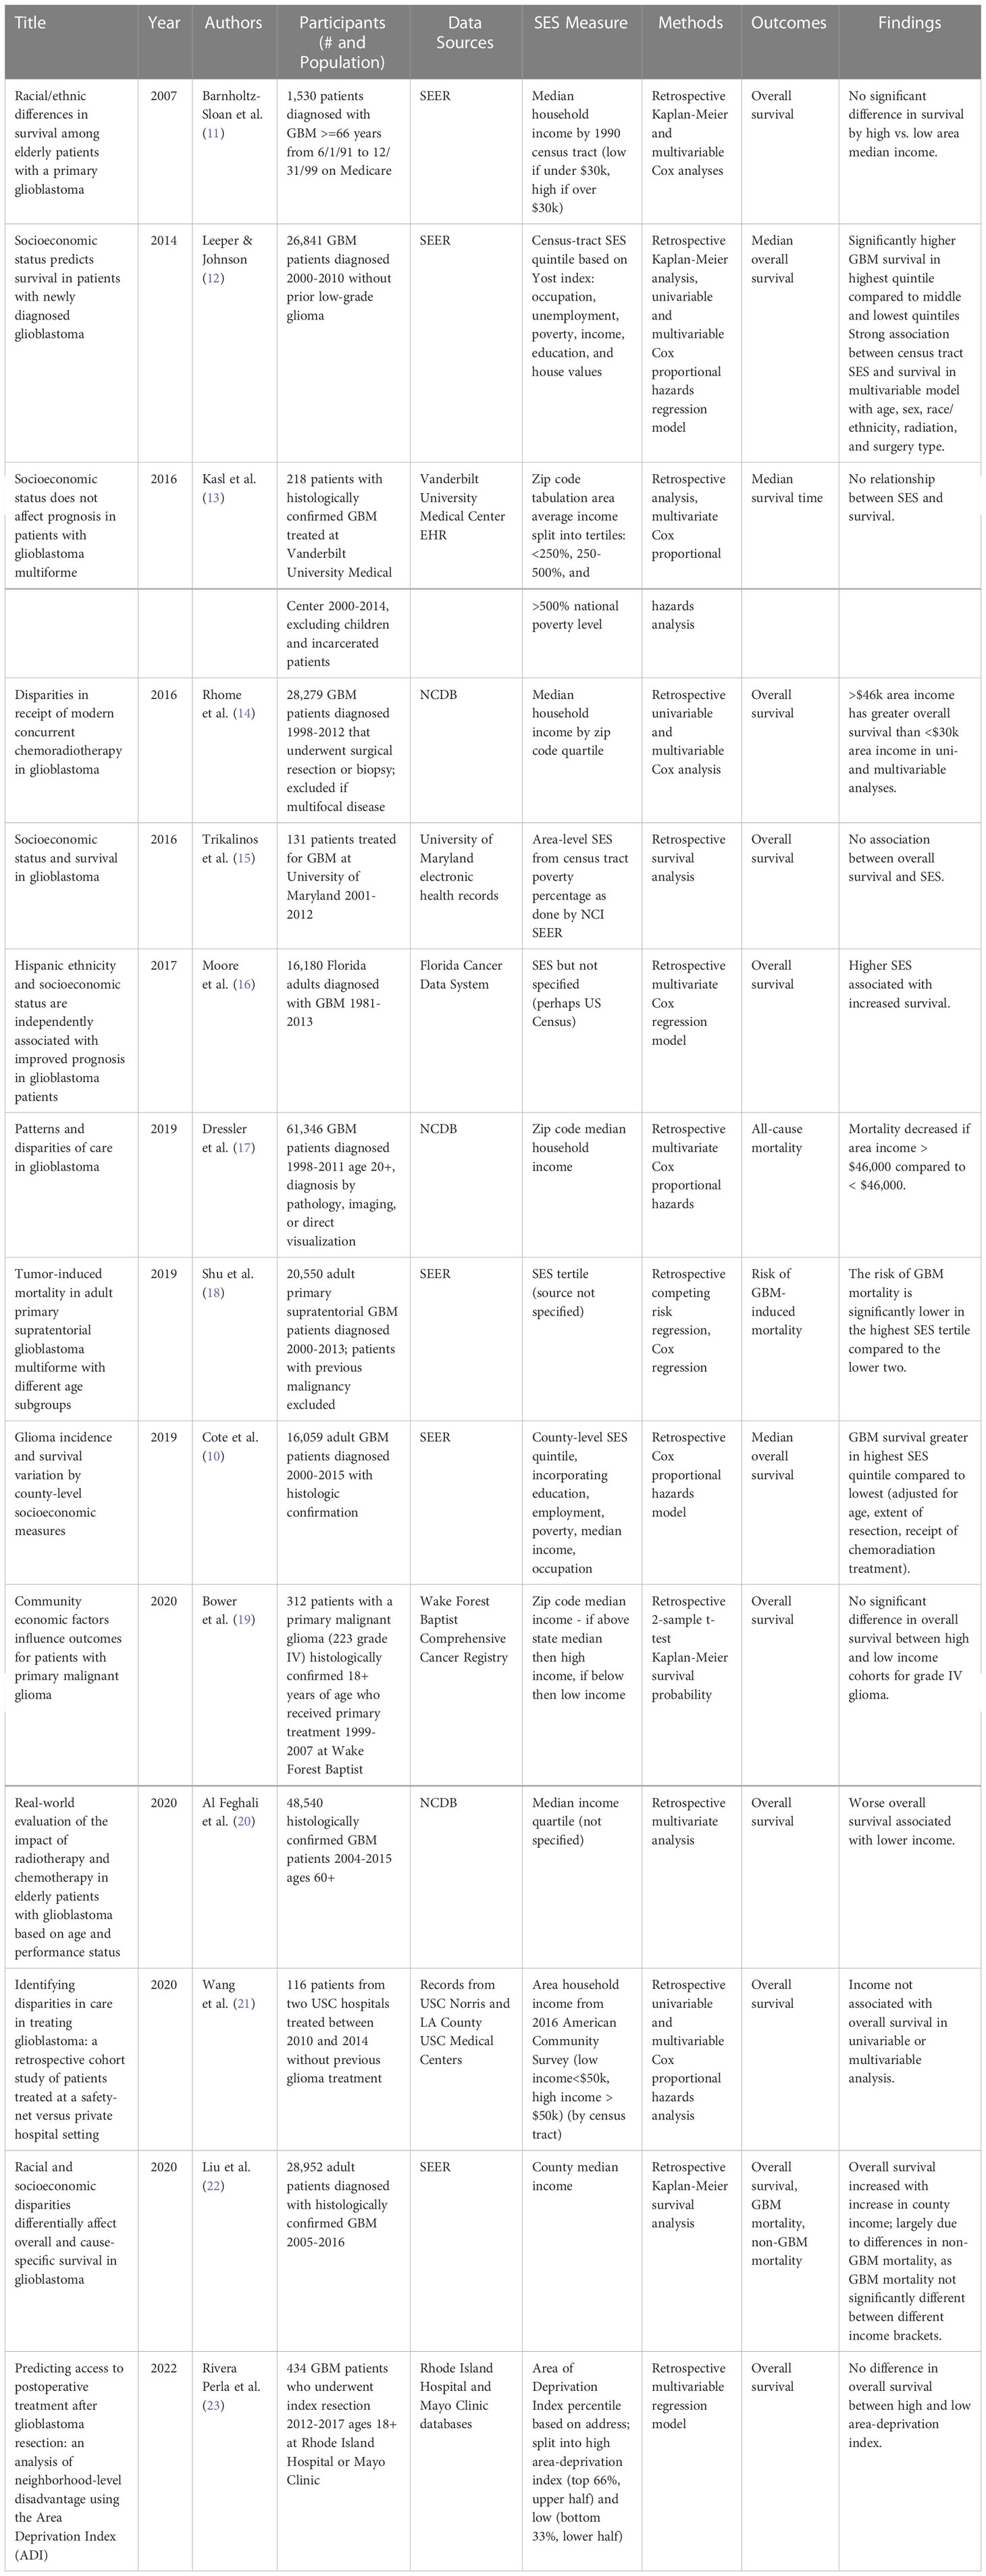
Table 2 Area-level socioeconomic status and survival in GBM patients.
All papers utilized area-level, not individual-level, SES measures; three examined the county level, four at the zip code level, six at the census tract level, one at the address level using a pre-existing index, and three were not specified. SES was measured solely by income in eight of the papers – either average, median, or quintile/quartile/tertile. Six papers utilized an aggregate SES metric involving income as well as other variables, and two papers did not specify their SES measurement. All three papers that correlated SES to incidence of GBM found a greater incidence of GBM in higher SES regions (Table 1). Of the 14 papers that correlated SES to patient survival, the eight with greater than 1,530 patients analyzed found that patients living in regions with higher SES experienced longer survival on average. The six studies with ≤ 1,530 patients found no significant relationship between area-level SES and survival in GBM patients, highlighting the need for larger patient studies (Table 2).
With respect to patient population, nine papers analyzed SES and either GBM incidence or prognosis from national databases. Specifically, six papers obtained GBM patient information from the Surveillance, Epidemiology, and End Results Program (SEER), three papers acquired data from the National Cancer Database (NCDB), and one paper included incidence data from the CBTRUS. Another five papers obtained data from university hospital records, and the two remaining papers analyzed GBM records from state- or city-level databases. GBM incidence studies, in aggregate, contained data for patients diagnosed between 1974 and 2015, while GBM prognosis studies included patient data between 1981 and 2017.
4 Discussion
This review uncovered a positive correlation between both area-level SES and GBM incidence, as well as area-level SES and survival in GBM patients in studies with larger sample sizes. When considering these results, it is important to keep in mind that SES is measured at the level of a geographic region, so it cannot be applied to individual-level SES associations with GBM incidence or prognosis. Individuals who live in an area with a higher SES experience a higher rate of GBM incidence, but an individual with a higher SES does not necessarily display a greater risk of developing GBM.
When considering the positive association between SES and GBM incidence, it is important to examine the interface between these variables and age distribution. Higher SES areas tend to have a greater life expectancy (24), and the average age of onset for GBM is 64 years of age (25). However, all three papers that examined this relationship utilized age-adjusted GBM incidence (8–10), so age differences between high and low SES regions should not explain this relationship. Another important consideration is race and ethnicity, as there is ample evidence that non-Hispanic whites are the most at-risk for developing GBM (2, 10), and that this group is over-represented in high SES regions. However, two of the papers analyzing SES and GBM incidence controlled for race in their incidence calculations (8, 10), and the third stratified incidence calculations by race, demonstrating that non-Hispanic white, white Hispanic, and black patients experience greater GBM incidence as area-level SES increases (9). Additionally, one may consider that patients in high SES regions may have greater access to diagnostic modalities that reveal GBM, artificially increasing GBM diagnoses in these regions. Clinical suspicion for GBM begins with apparent space-occupying lesions on computer tomography or magnetic resonance imaging, and GBM typically progresses to severe signs and symptoms, such as seizure, even if initial presentation was non-specific (26). Therefore, it is unlikely that many patients would progress through their entire disease course without proper diagnosis either pre- or post-mortem. Overall, it remains unclear why there is a direct relationship between SES and GBM incidence.
The positive association between SES and survival in GBM patients, on the other hand, was only observed in studies with larger sample sizes. This is likely due to the variability in metrics used to assess SES and the heterogeneity in SES at different geographical (e.g., census tract, zip code, versus county) regions. This association could be explained by a multitude of factors, the first being type of health care insurance. Insured GBM patients have a better prognosis than those uninsured (27), patients with private insurance survive longer than those on Medicaid (28), and non-Medicaid patients survive longer than those on Medicaid or who are uninsured (29). Therefore, perhaps individuals in high SES areas are more likely to have private insurance, leading to better access to care and therefore better prognosis.
Another factor explaining this relationship may be the type of treatment received. GBM patients living in higher SES regions have a greater chance of receiving radiation, and those who receive this treatment have greater OS (30–32). The same can be said for GBM patients who receive triple therapy (surgery, radiation, and chemotherapy) (33, 34). An additional consideration is clinical trial participation: those living in greater SES regions are more likely to participate in clinical trials (23), which is correlated with improved OS (35) and allows for more salvage therapy options. Interestingly, it does not appear that Karnofsky Performance Status differs between those living in high and low SES regions (19, 23). Therefore, this relationship cannot be explained by patients in low SES regions presenting with more severe disease than those in high SES regions and may instead reflect differences in access to quality care.
There are several limitations to the conclusions that can be drawn from this review. First, due to the ecological fallacy, interpretation must remain on the area level and cannot be applied to individuals with high or low SES. Second, this study is not a systematic review or meta-analysis, as it was not anticipated that there would be many studies that would qualify for quantitative analysis. Consequently, it is possible that additional qualifying studies exist that were missed by the identification process. Third, while there was no overlap in patient data in Table 1 (SES and GBM incidence), there is likely substantial patient overlap in Table 2 (SES and GBM prognosis), as multiple studies included either SEER or NCDB data in varying time periods that overlapped between 2005 and 2010. Therefore, there are likely redundant conclusions pulled from approximately half of these studies (including 10, 12, 14, 17, 18, 20, 22). It is critical to note that while there appears to be a positive correlation between area-level SES and GBM prognosis, several of the studies characterizing this relationship analyze many of the same patients. Finally, due to publication bias, it is possible that more studies than those included here were conducted that found no association between area-level SES and GBM incidence or survival but remain unpublished due to negative results.
Placing these results in a broader context, the relationship between area-level SES and cancer incidence appears to depend on the cancer site in question. Past studies reveal that the risk of gastric, colorectal, larynx, cervix, penile, and liver cancer are greater in low SES regions, whereas the risk of melanoma, thyroid, and testicular cancer are greater in high SES regions (36–39). On the other hand, it appears that there is a positive correlation between cancer prognosis and area-level SES across cancer type, including breast cancer (40), Hodgkin lymphoma (41), non-small cell lung cancer (42), liver, kidney, colorectal, and prostate cancers (43), and various childhood cancers (44). Therefore, the relationship between SES and GBM prognosis is comparable to other cancer sites.
In this review, both greater GBM incidence and survival of GBM patients in high SES regions were observed, specifically in studies with larger sample sizes. As research continues to be conducted on the social determinants of health related to GBM, it will be important to utilize these findings to improve patient outreach, clinical trial enrollment, and education in those areas where patients are more likely to develop GBM or exhibit worse prognosis from the disease. Hopefully, as treatments for GBM become more effective, such interventions will reduce disparities in health care and outcomes in those living in regions of varying SES.
Author contributions
JY conceived of and provided critical edits for the manuscript. MG performed literature searches and drafted the manuscript. AS performed literature searches and provided edits for the manuscript. EM and JC provided major edits for the manuscript. All authors contributed to the article and approved the submitted version.
Funding
This work was funded by NIH/NINDS R01NS094199, R01NS092641, R01NS124081, VeloSano, Cleveland Clinic, Amy Post Foundation, and Case Comprehensive Cancer Center.
Conflict of interest
The authors declare that the research was conducted in the absence of any commercial or financial relationships that could be construed as a potential conflict of interest.
Publisher’s note
All claims expressed in this article are solely those of the authors and do not necessarily represent those of their affiliated organizations, or those of the publisher, the editors and the reviewers. Any product that may be evaluated in this article, or claim that may be made by its manufacturer, is not guaranteed or endorsed by the publisher.
References
1. Ostrom QT, Cote DJ, Ascha M, Kruchko C, Barnholtz-Sloan JS. Adult glioma incidence and survival by race or ethnicity in the united states from 2000 to 2014. JAMA Oncol (2018) 4(9):1254–62.
2. Ostrom QT, Price M, Neff C, Cioffi G, Waite KA, Kruchko C, et al. CBTRUS statistical report: Primary brain and other central nervous system tumors diagnosed in the united states in 2015–2019. Neuro-Oncol (2022) 24(Supplement_5):v1–95.
4. Ryan CS, Juhn YJ, Kaur H, Wi CI, Ryu E, King KS, et al. Long-term incidence of glioma in Olmsted county, Minnesota, and disparities in postglioma survival rate: A population-based study. Neuro-Oncol Pract (2020) 7(3):288–98.
5. Deb S, Pendharkar AV, Schoen MK, Altekruse S, Ratliff J, Desai A. The effect of socioeconomic status on gross total resection, radiation therapy and overall survival in patients with gliomas. J Neurooncol (2017) 132(3):447–53.
6. Demers PA, Vaughan TL, Schommer RR. Occupation, socioeconomic status, and brain tumor mortality: A death certificate-based case-control study. J Occup Med (1991) 33(9):1001–6.
7. Plascak JJ, Fisher JL. Area-based socioeconomic position and adult glioma: A hierarchical analysis of surveillance epidemiology and end results data. PloS One (2013) 8(4):e60910.
8. Chakrabarti I, Cockburn M, Cozen W, Wang YP, Preston-Martin S. A population-based description of glioblastoma multiforme in Los Angeles county, 1974–1999. Cancer (2005) 104(12):2798–806.
9. Porter AB, Lachance DH, Johnson DR. Socioeconomic status and glioblastoma risk: A population-based analysis. Cancer Causes Control (2015) 26(2):179–85.
10. Cote DJ, Ostrom QT, Gittleman H, Duncan KR, CreveCoeur TS, Kruchko C, et al. Glioma incidence and survival variations by county-level socioeconomic measures. Cancer (2019) 125(19):3390–400.
11. Barnholtz-Sloan JS, Maldonado JL, Williams VL, Curry WT, Rodkey EA, Barker FG, et al. Racial/ethnic differences in survival among elderly patients with a primary glioblastoma. J Neurooncol (2007) 85(2):171.
12. Leeper H, Johnson D. P17.43: SOCIOECONOMIC STATUS PREDICTS SURVIVAL IN PATIENTS WITH NEWLY DIAGNOSED GLIOBLASTOMA. Neuro-Oncol (2014) 16(Suppl 2):ii97–7.
13. Kasl RA, Brinson PR, Chambless LB. Socioeconomic status does not affect prognosis in patients with glioblastoma multiforme. Surg Neurol Int (2016) 7(Suppl 11):S282–90.
14. Rhome R, Fisher R, Hormigo A, Parikh RR. Disparities in receipt of modern concurrent chemoradiotherapy in glioblastoma. J Neurooncol (2016) 128(2):241–50.
15. Trikalinos NA, Kwok Y, Goloubeva O, Mehta M, Sausville E. Socioeconomic status and survival in glioblastoma. Int J Clin Exp Med (2016) 9(2):4131–6.
16. Moore KJ, Richardson A, Koru-Sengul T, Ivan ME. 164 Hispanic ethnicity and socioeconomic status are independently associated with improved prognosis in glioblastoma patients. Neurosurgery (2017) 64(CN_suppl_1):241.
17. Dressler EV, Liu M, Garcia CR, Dolecek TA, Pittman T, Huang B, et al. Patterns and disparities of care in glioblastoma. Neuro-Oncol Pract (2019) 6(1):37–46.
18. Shu C, Yan X, Zhang X, Wang Q, Cao S, Wang J. Tumor-induced mortality in adult primary supratentorial glioblastoma multiforme with different age subgroups. Future Oncol (2019) 15(10):1105–14.
19. Bower A, Hsu FC, Weaver KE, Yelton C, Merrill R, Wicks R, et al. Community economic factors influence outcomes for patients with primary malignant glioma. Neuro-Oncol Pract (2020) 7(4):453–60.
20. Al Feghali KA, Buszek SM, Elhalawani H, Chevli N, Allen PK, Chung C. Real-world evaluation of the impact of radiotherapy and chemotherapy in elderly patients with glioblastoma based on age and performance status. Neuro-Oncol Pract (2020) 8(2):199–208.
21. Wang T, Pham A, Yoo S, Attenello FJ, Jennelle R, Wagle N, et al. Identifying disparities in care in treating glioblastoma: A retrospective cohort study of patients treated at a safety-net versus private hospital setting. World Neurosurg (2020) 137:e213–20.
22. Liu EK, Yu S, Sulman EP, Kurz SC. Racial and socioeconomic disparities differentially affect overall and cause-specific survival in glioblastoma. J Neurooncol (2020) 149(1):55–64.
23. Rivera Perla KM, Tang OY, Durfey SNM, Vivas-Buitrago T, Sherman WJ, Parney I, et al. Predicting access to postoperative treatment after glioblastoma resection: an analysis of neighborhood-level disadvantage using the area deprivation index (ADI). J Neurooncol (2022) 158(3):349–357. doi: 10.1007/s11060-022-04020-9
24. Chetty R, Stepner M, Abraham S, Lin S, Scuderi B, Turner N, et al. The association between income and life expectancy in the united states, 2001-2014. JAMA (2016) 315(16):1750–66.
25. Ladomersky E, Scholtens DM, Kocherginsky M, Hibler EA, Bartom ET, Otto-Meyer S, et al. The coincidence between increasing age, immunosuppression, and the incidence of patients with glioblastoma. Front Pharmacol (2019) 10:200. doi: 10.3389/fphar.2019.00200
26. McKinnon C, Nandhabalan M, Murray SA, Plaha P. Glioblastoma: Clinical presentation, diagnosis, and management. BMJ (2021) 374:n1560.
27. Chandra A, Rick JW, Dalle Ore C, Lau D, Nguyen AT, Carrera D, et al. Disparities in health care determine prognosis in newly diagnosed glioblastoma. Neurosurg Focus FOC (2018) 44(6):E16.
28. Brown DA, Himes BT, Kerezoudis P, Chilinda-Salter YM, Grewal SS, Spear JA, et al. Insurance correlates with improved access to care and outcome among glioblastoma patients. Neuro-Oncol (2018) 20(10):1374–82.
29. Rong X, Yang W, Garzon-Muvdi T, Caplan JM, Hui X, Lim M, et al. Influence of insurance status on survival of adults with glioblastoma multiforme: A population-based study. Cancer (2016) 122(20):3157–65.
30. Pollom EL, Fujimoto DK, Han SS, Harris JP, Tharin SA, Soltys SG. Newly diagnosed glioblastoma: Adverse socioeconomic factors correlate with delay in radiotherapy initiation and worse overall survival. J Radiat Res (Tokyo) (2018) 59(suppl_1):i11–8.
31. Aizer AA, Ancukiewicz M, Nguyen PL, Shih HA, Loeffler JS, Oh KS. Underutilization of radiation therapy in patients with glioblastoma. Cancer (2014) 120(2):238–43.
32. Huang B, Dolecek TA, Chen Q, Garcia CR, Pittman T, Villano JL. Characteristics and survival outcomes associated with the lack of radiation in the treatment of glioblastoma. Med Oncol (2018) 35(5):74.
33. Lu VM, Shah AH, Eichberg DG, Quinones-Hinojosa A, Esquenazi Y, Komotar RJ, et al. Geographic disparities in access to glioblastoma treatment based on Hispanic ethnicity in the united states: Insights from a national database. J Neurooncol (2020) 147(3):711–20.
34. Lu VM, Lewis CT, Esquenazi Y. Geographic and socioeconomic considerations for glioblastoma treatment in the elderly at a national level: A US perspective. Neuro-Oncol Pract (2020) 7(5):522–30.
35. Field KM, Rosenthal MA, Yilmaz M, Tacey M, Drummond K. Comparison between poor and long-term survivors with glioblastoma: Review of an Australian dataset. Asia Pac J Clin Oncol (2014) 10(2):153–61.
36. Boscoe FP, Johnson CJ, Sherman RL, Stinchcomb DG, Lin G, Henry KA. The relationship between area poverty rate and site-specific cancer incidence in the united states. Cancer (2014) 120(14):2191–8.
37. Doubeni CA, Doubeni AR, Myers AE. Diagnosis and management of ovarian cancer. Am Fam Physician (2016) 93(11):937–44.
38. Uthman OA, Jadidi E, Moradi T. Socioeconomic position and incidence of gastric cancer: A systematic review and meta-analysis. J Epidemiol Community Health (2013) 67(10):854.
39. Shebl FM, Capo-Ramos DE, Graubard BI, McGlynn KA, Altekruse SF. Socioeconomic status and hepatocellular carcinoma in the united states. Cancer Epidemiol Biomarkers Prev (2012) 21(8):1330–5.
40. Smith EC, Ziogas A, Anton-Culver H. Delay in surgical treatment and survival after breast cancer diagnosis in young women by Race/Ethnicity. JAMA Surg (2013) 148(6):516–23.
41. Smith EC, Ziogas A, Anton-Culver H. Association between insurance and socioeconomic status and risk of advanced stage Hodgkin lymphoma in adolescents and young adults. Cancer (2012) 118(24):6179–87.
42. Tannenbaum SL, Koru-Sengul T, Zhao W, Miao F, Byrne MM. Survival disparities in non–small cell lung cancer by race, ethnicity, and socioeconomic status. Cancer J (2014) 20(4):237–245.
43. Kish JK, Yu M, Percy-Laurry A, Altekruse SF. Racial and ethnic disparities in cancer survival by neighborhood socioeconomic status in surveillance, epidemiology, and end results (SEER) registries. JNCI Monogr (2014) 2014(49):236–43.
Keywords: glioblastoma, socioeconomic status, social determinants, public health, health disparities, race, ethnicity, survival
Citation: Gorenflo MP, Shen A, Murphy ES, Cullen J and Yu JS (2023) Area-level socioeconomic status is positively correlated with glioblastoma incidence and prognosis in the United States. Front. Oncol. 13:1110473. doi: 10.3389/fonc.2023.1110473
Received: 28 November 2022; Accepted: 01 March 2023;
Published: 17 March 2023.
Edited by:
Christine Marosi, Medical University of Vienna, AustriaReviewed by:
Toral Patel, University of Texas Southwestern Medical Center, United StatesAlissa A. Thomas, University of Vermont, United States
Copyright © 2023 Gorenflo, Shen, Murphy, Cullen and Yu. This is an open-access article distributed under the terms of the Creative Commons Attribution License (CC BY). The use, distribution or reproduction in other forums is permitted, provided the original author(s) and the copyright owner(s) are credited and that the original publication in this journal is cited, in accordance with accepted academic practice. No use, distribution or reproduction is permitted which does not comply with these terms.
*Correspondence: Jennifer S. Yu, eXVqMkBjY2Yub3Jn