 Alexa R. Heaton1,2
 Peter R. Rehani1Anna Hoefges2
 Angelica F. Lopez3
 Amy K. Erbe2
 Paul M. Sondel2,4*
 Melissa C. Skala1,3*
- 1Morgridge Institute for Research, Madison, WI, United States
- 2Department of Human Oncology, University of Wisconsin, Madison, WI, United States
- 3Department of Biomedical Engineering, University of Wisconsin, Madison, WI, United States
- 4Department of Pediatrics, University of Wisconsin, Madison, WI, United States
Introduction: Metabolic reprogramming of cancer and immune cells occurs during tumorigenesis and has a significant impact on cancer progression. Unfortunately, current techniques to measure tumor and immune cell metabolism require sample destruction and/or cell isolations that remove the spatial context. Two-photon fluorescence lifetime imaging microscopy (FLIM) of the autofluorescent metabolic coenzymes nicotinamide adenine dinucleotide (phosphate) (NAD(P)H) and flavin adenine dinucleotide (FAD) provides in vivo images of cell metabolism at a single cell level.
Methods: Here, we report an immunocompetent mCherry reporter mouse model for immune cells that express CD4 either during differentiation or CD4 and/or CD8 in their mature state and perform in vivo imaging of immune and cancer cells within a syngeneic B78 melanoma model. We also report an algorithm for single cell segmentation of mCherry-expressing immune cells within in vivo images.
Results: We found that immune cells within B78 tumors exhibited decreased FAD mean lifetime and an increased proportion of bound FAD compared to immune cells within spleens. Tumor infiltrating immune cell size also increased compared to immune cells from spleens. These changes are consistent with a shift towards increased activation and proliferation in tumor infiltrating immune cells compared to immune cells from spleens. Tumor infiltrating immune cells exhibited increased FAD mean lifetime and increased protein-bound FAD lifetime compared to B78 tumor cells within the same tumor. Single cell metabolic heterogeneity was observed in both immune and tumor cells in vivo.
Discussion: This approach can be used to monitor single cell metabolic heterogeneity in tumor cells and immune cells to study promising treatments for cancer in the native in vivo context.
1 Introduction
Metabolic reprogramming is a hallmark of cancer (1, 2). Cancer cells increase their metabolic activity to fuel rapid cell proliferation. At the same time, fast tumor growth leads to poor vascularization, decreased oxygen availability, increased metabolic waste products, and increased acidity in the tumor microenvironment (TME). To survive, cancer cells increase their metabolic plasticity and adapt to the available nutrients. Whereas healthy cells primarily metabolize glucose using oxidative phosphorylation, cancer cells primarily metabolize glucose using glycolysis (3–7). Immune cells also undergo metabolic changes during tumorigenesis that correlate to immune cell phenotype and function (1, 8, 9). Some immune cell reprogramming is critical for increased proliferation, activation, and cytokine release while other reprogramming is necessary to compete with cancer cells for nutrients in the TME. For example, many lymphocytes shift toward increased glycolysis upon stimulation to support proliferation and cytokine release, however, nutrient competition in the TME is fierce as cancer cells also increase glucose uptake (1, 2). This nutrient competition can lead to detrimental effects on the immune cells such as exhaustion or dysfunction, which further promote tumorigenesis. Improved understanding of tumor and immune cell metabolism and their complex interplay in the TME will improve clinical outcomes in cancer. This knowledge could guide the development of therapies aimed at modifying metabolism to limit tumor cell metabolism and promote healthy immune cell metabolism.
Current techniques to measure tumor and immune cell metabolism require destruction of the sample and/or single cell isolations that remove relevant spatial context and may limit collection of rare cell populations. There is a need for methods that can monitor metabolic changes within intact in vivo samples that maintain the native TME. Intravital optical metabolic imaging (OMI) resolves many of these shortcomings by providing in vivo, label free, single cell imaging of metabolic changes. These metabolic changes are quantified with the fluorescence intensities and lifetimes of metabolic coenzymes NAD(P)H and FAD, which are autofluorescent molecules present in all cells (10–12). The fluorescence of NADH and NADPH are difficult to separate spectrally, so their combined fluorescence will be referred to here as NAD(P)H. These metabolic coenzymes shuttle electrons during most metabolic processes, where NAD(P)H is an electron donor and FAD is an electron acceptor. NAD(P)H and FAD intensity changes are often quantified using the optical redox ratio, defined here as the intensity of NAD(P)H divided by the sum of the intensity of NAD(P)H plus FAD, which monitors changes in the oxidation-reduction state of the cell (10–13). A decrease in optical redox ratio here indicates a more oxidized environment. The fluorescence lifetime, the time a molecule remains in its excited state before relaxing back to ground state, informs on the protein binding activity of NAD(P)H and FAD as well as changes in the cellular microenvironment. The fluorescence lifetimes of free versus protein-bound NAD(P)H and FAD are distinct and can be quantified using fluorescence lifetime imaging microscopy (FLIM) (11–15). FLIM of NAD(P)H and FAD reports on changes in free and protein-bound lifetimes due to microenvironmental factors and preferred binding partners, while also providing relative proportions of free and protein-bound pools. Previous studies have illustrated that OMI can quantify tumor cell (16–23) or immune cell (24–29) metabolic changes separately. However, imaging of in vivo metabolic changes in immune cells between different tissues of origin and uncoupling tumor cell and immune cell metabolism within the same tissue has not been well studied in the context of melanoma.
Here we demonstrate in vivo optical metabolic imaging, a fluorescent reporter mouse model, and single cell segmentation approaches to quantify immune cell and tumor cell metabolism in vivo. As proof-of-principle for this method, we show that: 1) immune cell metabolism within spleens differs from metabolism of tumor infiltrating immune cells, 2) tumor cells and tumor infiltrating immune cells also differ metabolically, and 3) single cell metabolic heterogeneity is present in both immune and tumor cells populations in vivo. Overall, this approach can be used to monitor single cell metabolic heterogeneity in tumor cells and immune cells to study promising treatments for cancer in the native in vivo context.
2 Materials and methods
2.1 CD4 mCherry reporter mouse breeding, tumor inoculation, and surgery
Animals were housed and treated under an animal protocol approved by the Institutional Animal Care and Use Committee at the University of Wisconsin-Madison. The CD4 mCherry reporter mouse model was made using Cre-lox methods by crossing CD4-Cre mice (Jax 022071) with floxed H2B-mCherry mice (Jax 023139) at the University of Wisconsin Biomedical Research Model Services (Figure S1) (30, 31). H2B-mCherry homozygous/CD4cre hemizygous mice were successfully bred and genotyped to confirm mCherry labeling to all CD4+ cells that expressed CD4 either during differentiation or in their mature state. The reporter mCherry was chosen to avoid spectral overlap with autofluorescence of NAD(P)H and FAD, and to confirm the identity of in vivo cells with CD4 expression presently or in their lineage (32–34).
B78-D14 (B78) melanoma is a poorly immunogenic cell line derived from B78-H1 melanoma cells, which were originally derived from B16 melanoma (35–37). These cells were obtained from Ralph Reisfeld (Scripps Research Institute) in 2002. B78 cells were transfected with functional GD2/GD3 synthase to express the disialoganglioside GD2 (36, 37), which is overexpressed on the surface of many human tumors including melanoma (38). These B78 cells were also found to lack melanin. B78 cells were grown in RPMI-1640 (Gibco) supplemented with 10% FBS and 1% penicillin/streptomycin, with periodic supplementation with 400 μg G418 and 500 μg Hygromycin B per mL. Mycoplasma testing was performed every 6 months. B78 tumors were engrafted by intradermal flank injection of 2×10⁶ tumor cells (39). We have previously developed successful immunotherapy regimens for mice bearing these B78 tumors, enabling the cure of mice with measurable tumors (~100 mm3 volume) (40–42). These cured mice have demonstrated tumor-specific T-cell mediated memory, as detected by rejection of rechallenge with the same vs. immunologically distinct tumors. Here, we continue our investigation of the B78 tumor model and expand our work into the metabolic field. Tumor size was determined using calipers and volume approximated as:
Intravital imaging of the mouse tumors (n = 2) was performed in untreated mice when tumors were well established (280-340 mm3), 5-6 weeks after inoculation. Immediately prior to tumor imaging, skin flap surgery exposed flank tumors. Mice were anesthetized with isoflurane, then the skin around the tumor was cut into a flap and separated from the body cavity so that the tumor laid flat on the imaging stage while still connected to the vasculature (43–45). Mice were placed on a specialized microscope stage for imaging and kept in a heating chamber (air maintained at 37°C) during imaging. An imaging dish insert and PBS for coupling were used with surgical tape to secure skin flap tumors (Figure 1).
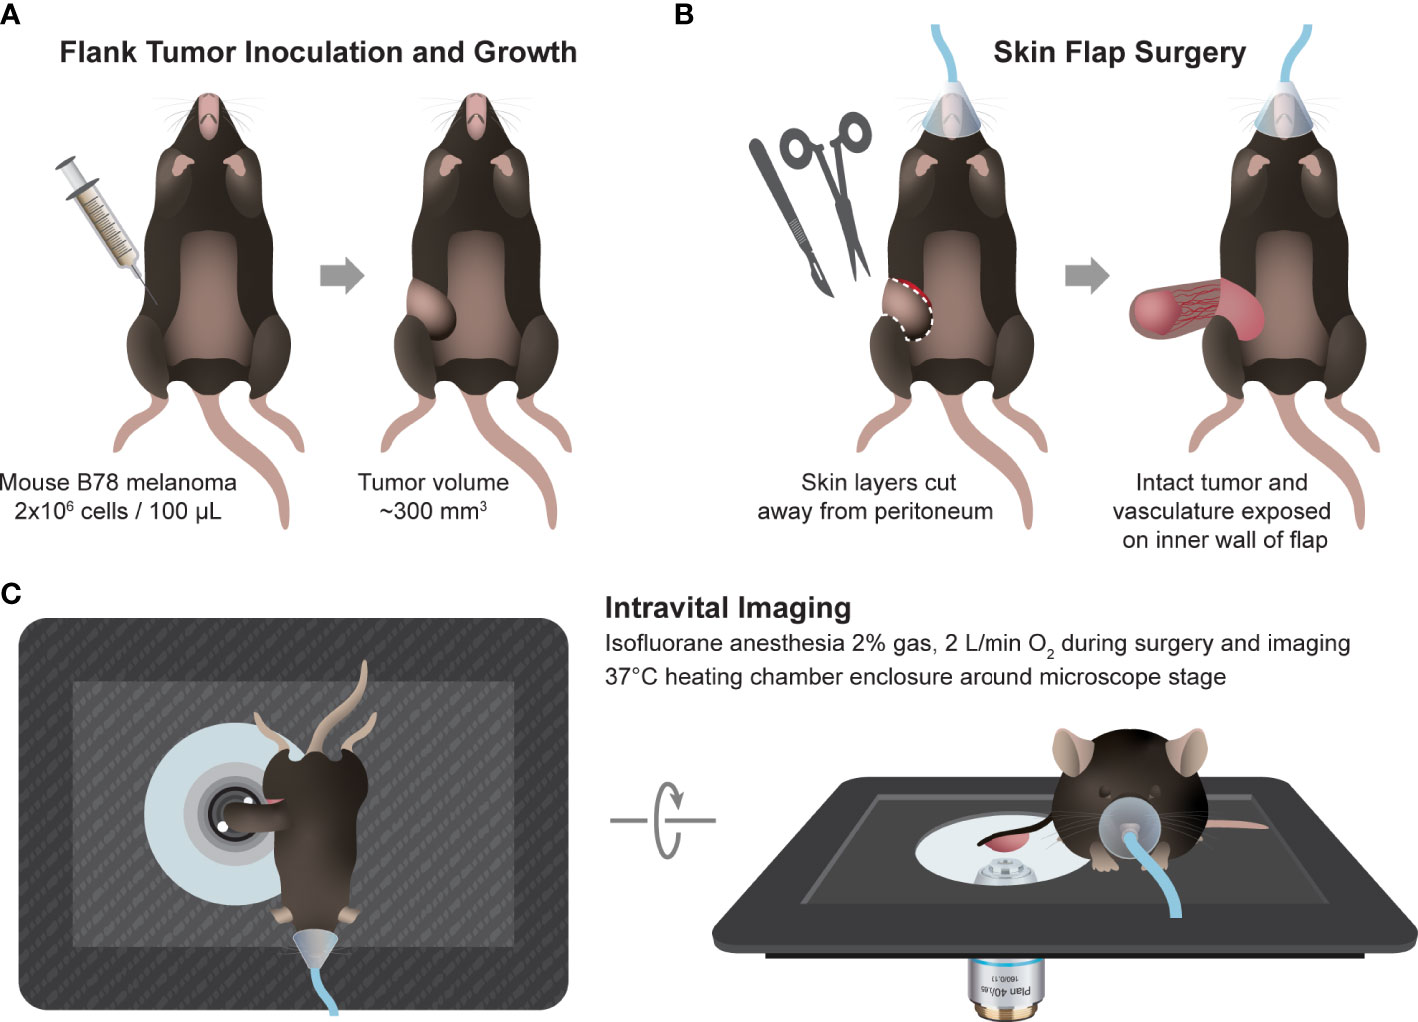
Figure 1 In vivo multiphoton imaging experimental workflow. (A) Workflow began with intradermal inoculation of 2×10⁶ B78 melanoma cells on mouse flank. Tumors were monitored weekly until they reached ~300 mm3 volume. (B) On the day of imaging, the mouse was anesthetized, and tumor skin flap surgery was performed where dermal and subcutaneous skin layers were gently cut away from the peritoneum revealing the tumor with intact vasculature. (C) The tumor and skin flap were placed on a glass slide for imaging and the mouse on a specially designed microscope stage. Throughout in vivo imaging, the mouse was kept under anesthesia and inside a heating chamber that enclosed the microscope stage.
2.2 Multiphoton imaging
Intravital/in vivo imaging was performed live, as described in 2.1 above (Figure 1). Ex vivo imaging of whole spleens was performed immediately following intravital imaging and euthanasia. Excised spleens were secured to an imaging dish with PBS coupling and tape. Ex vivo imaging was completed within one hour post mouse euthanasia, accurately capturing splenic metabolism based on our previous work that showed that ex vivo metabolism is statistically identical to in vivo metabolism for up to 12 hours post euthanasia (46). In vitro imaging of CD3+ splenic T cells was performed following negative selection magnetic bead separation with an EasySep™ Mouse T Cell Isolation Kit (STEMCELL Technologies) and cells were plated on a glass imaging dish.
Autofluorescence images were captured with a custom-built multi-photon microscope (Bruker) using an ultrafast femtosecond laser (InSight DSC, Spectra Physics). Fluorescence lifetime measurements were performed using time-correlated single photon counting electronics (Becker & Hickl). Fluorescence emission, in FLIM mode, was detected simultaneously in three channels using bandpass filters of 466/40 nm (NAD(P)H), 514/30 nm (FAD), and 650/45 nm (mCherry) prior to detection with three GaAsP photomultiplier tubes (Hamamatsu). All three fluorophores were simultaneously excited using a previously reported wavelength mixing approach (47, 48) with two-photon excitation at 750 nm (tunable line, λ1) and 1041 nm (fixed line, λ2), and two-color two-photon excitation at 872 nm (λ2c-2p):
Briefly, the laser source tuned to 750 nm (NAD(P)H excitation) was delayed and collimated with the secondary laser line fixed at 1041 nm (mCherry excitation) for spatial and temporal overlap at each raster-scanned focal point (2-color excitation of FAD with 750 nm + 1041 nm). During wavelength mixing in FLIM mode, typical power was 0.9-1.9 mW for the 750 nm laser and 0.7-1.0 mW for the 1041 laser. Second-harmonic generation (SHG) images, in galvo mode, of collagen fibers and mCherry-expressing immune cells were detected using bandpass filters of 514/30 nm (collagen/SHG) and 650/45 nm (mCherry) at 1041 nm excitation (typical power 2.7-3.0 mW). There will be some SHG contribution to the FAD channel from our 1041 nm laser, but we can distinguish SHG signal from true FAD signal due to the clear morphology and lifetime differences between collagen fibers and FAD-containing cells. Sum frequency generation (SFG) signal (436 nm) generated via our wavelength mixing setup is excluded using these bandpass filters (47, 48). A phasor plot was used to confirm that no mCherry signal was present in the FAD channel. All images were acquired with a 40×/1.13 NA water-immersion objective (Nikon) at 512×512 pixel resolution and an optical zoom of 1.0-2.0. A daily fluorescence standard measurement was collected by imaging a YG fluorescent bead (Polysciences Inc.) and verifying the measured lifetime with reported lifetime values. NAD(P)H and FAD intensity and lifetime images were acquired to sample metabolic behavior of B78 tumor and immune cells across 3-8 fields of view and multiple depths within each tissue.
2.3 Multiphoton image analysis
2.3.1 Fluorescence lifetime fitting
The fluorescence lifetimes of free and protein-bound NAD(P)H and FAD are distinct, and these lifetimes along with their weights can be recovered with a two-exponential fit function. Therefore, fluorescence lifetime decays for both NAD(P)H and FAD were fit to the following bi-exponential function in SPCImage:
For NAD(P)H, τ1 corresponds to the free lifetime, τ2 corresponds to the protein-bound lifetime, and the weights (α1, α2; α1 + α2 = 1) correspond to the proportion of free and protein-bound NAD(P)H, respectively (11, 14, 15). Conversely for FAD, τ1 corresponds to the protein-bound lifetime and τ2 corresponds to the free lifetime (13, 15, 49). An instrument response function was measured using SHG (900 nm excitation) from urea crystals for input into the decay fit procedure. The following fluorescence lifetime endpoints were calculated from the fitted model: τ1, τ2, α1, and α2 for both NAD(P)H and FAD; along with the optical redox ratio (Table 1) (10, 11).
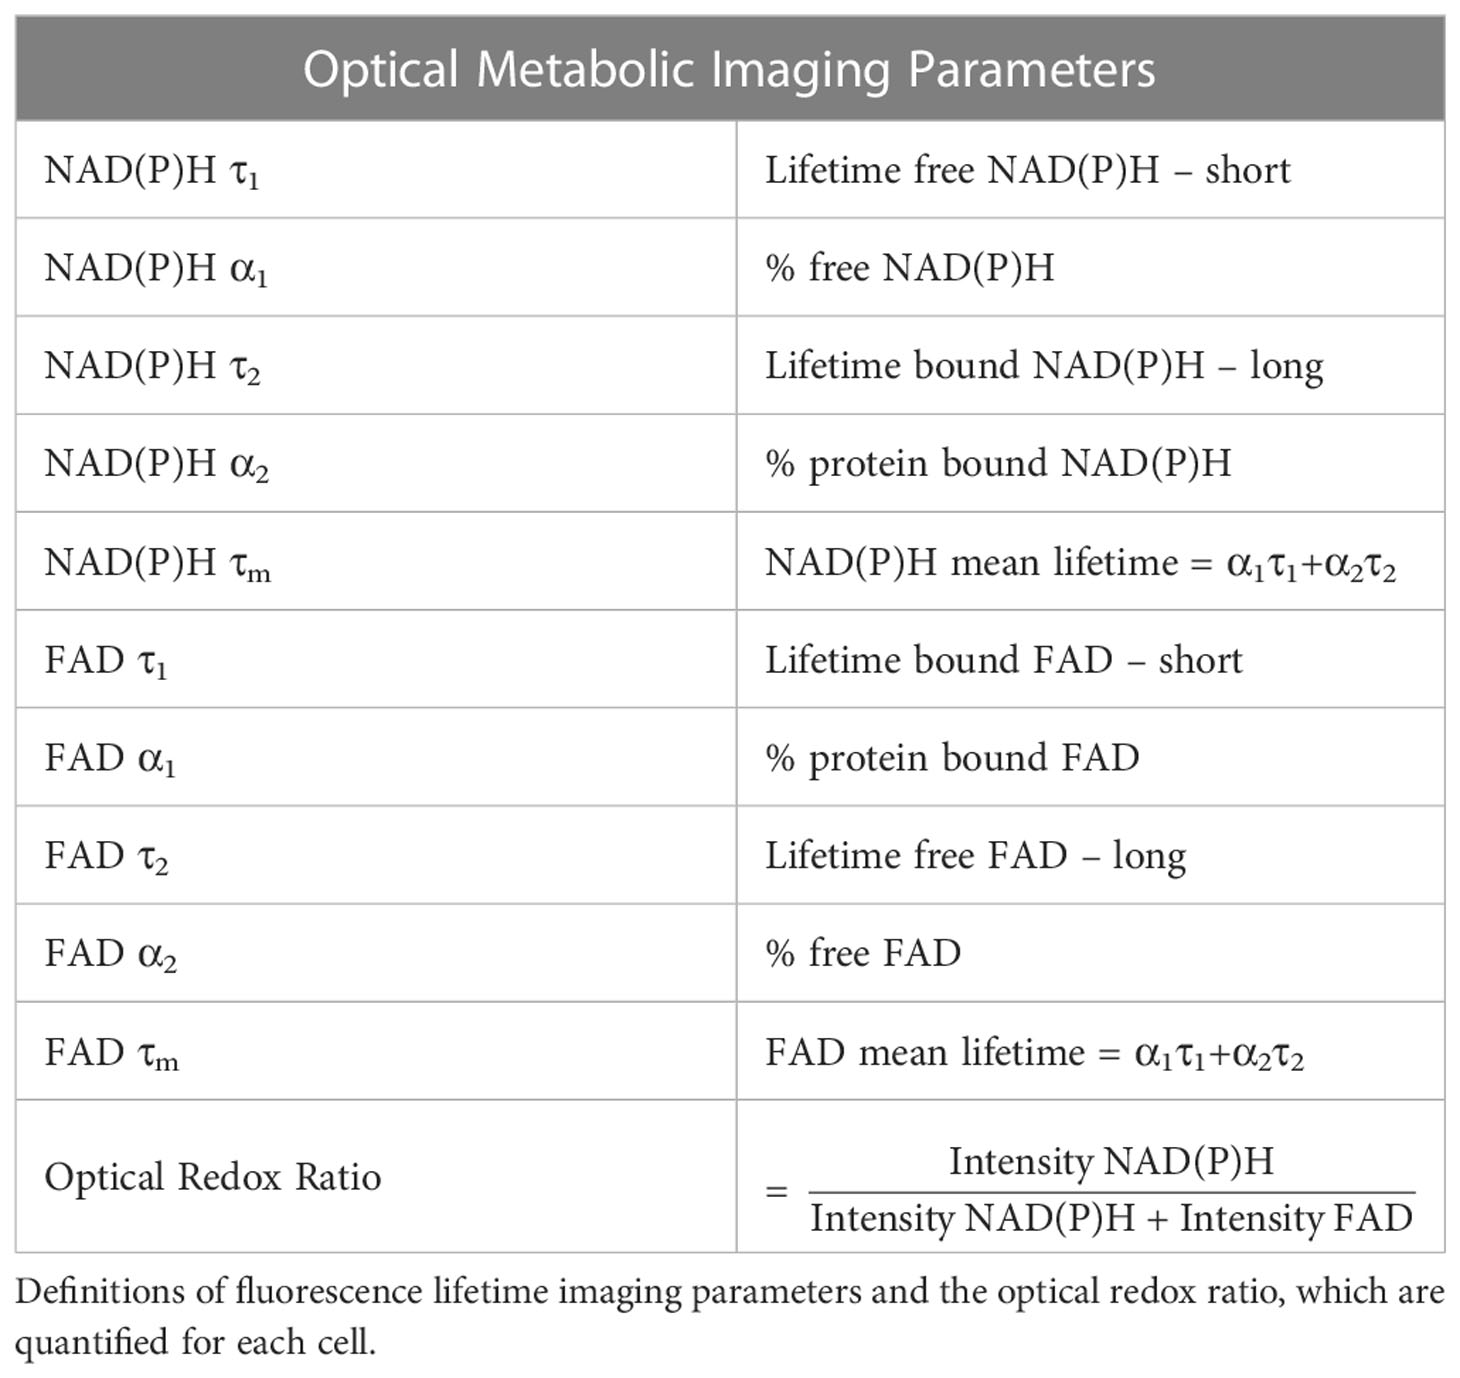
Table 1 Optical metabolic imaging parameters.
2.3.2 Manual cell segmentation
Manual immune and tumor cell segmentation was performed through a custom CellProfiler pipeline. Immune cells were segmented based on their mCherry intensity. Tumor cells were segmented based on their NAD(P)H intensity. For both cell types, single cells were circled and segmented as whole cells to include both nucleus and cytoplasm. The resulting segmented images were saved as masks. Using these masks and the raw imaging data from 2.3.1, fluorescence lifetime variables and redox ratio values were calculated for each individual cell. Calculations were performed using RStudio.
2.3.3 Automated immune cell segmentation
Automated immune cell segmentation was performed through a custom Python based pipeline (Figure S2). Intensity and lifetime images of mCherry, thresholded to a predefined lifetime range of 800-1500 ps to reduce non-specific signal, were passed in as initial inputs to the pipeline. Initial global and local thresholding of intensity images through a series of standard thresholding methods – otsu, yen, min, triangle, local, and their combinations – was used to differentiate foreground vs. background (50, 51, 52). Next, a left-merge intersection was performed to combine the thresholded intensity image and the range-limited lifetime image. A canny edge detector was used to identify and label individual regions of interest (ROIs) in the resulting image. ROIs were expanded through a first round of binary dilation or closing to ensure proper coverage of cell bodies. Border clearing was performed to remove any partial cells followed by an edge detection step. A second round of binary dilation or closing was then performed. Following ROI generation, a small-item filter was used based on ROI area to limit noise and non-specific elements in the mask. Ensemble voting was performed via combinatorial analysis of intensity image thresholding and ROI region expansion methods. A maximum intensity projection was generated for each outcome, and a single ‘best’ binary mask was established by maximizing Dice coefficients compared against hand-segmented ground truth images for every image in the dataset. The segmentation and dilation procedures explained above resulted in whole cell immune cell masks that encompassed both nuclei and cytoplasm. These masks were qualitatively confirmed by visual inspection of whole cell segmentation. Whole cell masks were also quantitatively confirmed by performing mask dilations of 1, 2, and 3 pixels – which did not statistically differ (p>0.05) from the original masks for any fluorescence intensity or lifetime parameter. Final automated segmentation mask quality and accuracy was assessed through calculations of the Dice coefficient for each mask (Table S1). As needed, automated masks were also manually improved using Napari. Using these automated masks and the raw imaging data from 2.3.1, fluorescence lifetime variables and redox ratio values were calculated for each cell. Calculations of these single cell OMI parameters were performed using RStudio (Version 4.1.0).
2.4 Multiplex immunofluorescence
Excised tissues were formalin fixed and paraffin-embedded for antibody staining with a panel of fluorescent markers (CD4, mCherry, and CD8). Embedded sections were deparaffinized and hydrated prior to antigen retrieval and placement in blocking solution. Next, primary antibodies were sequentially applied upon removal of blocking solution at the following dilutions and incubation times: CD4 – 1:500 for 15 min, mCherry – 1:500 for 10 min, and CD8 –1:250 for 15 min. Secondary antibodies were then added following each primary antibody incubation using rat and rabbit secondary antibodies. The following staining dyes were added after secondary antibody washes at 1:100 dilution for 10 min: CD4 – Opal-dye 520, mCherry – Opal-dye 570, CD8 – Opal dye 620. Finally, stained sections were incubated in DAPI for 5 min at room temperature for nuclear labeling and mounted on coverslips for imaging. Imaging was performed at 40× using a Vectra multispectral imaging system (Akoya Biosciences) and a spectral library was generated to separate spectral curves for each of the fluorophores. Resulting images were analyzed using Nuance and inForm software (Akoya Biosciences).
2.5 Flow cytometry
Tumors and spleens were harvested from euthanized mice. Spleens were then dissociated into a single cell suspension and filtered with a 70 μm filter. Red blood cells were lysed using 1 mL ddH2O for 10 seconds, then spleen cells were stored in PBS on ice until aliquoted into flow cytometry tubes. Tumors were cut into ~1 mm chunks using surgical scissors. The tumor chunks were collected in gentleMACS C tubes (Miltenyi Biotec) containing 2.5 mL of RPMI 1640 + 10% fetal bovine serum, 100 U/mL penicillin, 100 μg/mL streptomycin, and 2 mM L-glutamine. 100μL of DNAse I solution in RPMI 1640 (2.5 mg/mL, Sigma-Aldrich) and 100 μL collagenase IV solution in RPMI 1640 (25 mg/mL, Gibco) were then added and the samples were run on a MacsQuant Octo Dissociator (Miltenyi Biotec) using the preset dissociation protocol for mouse tumor dissociations. After dissociation, the tumors were filtered through a 70 μm cell strainer, washed with 10 ml PBS, and stored on ice until being aliquoted in flow cytometry tubes.
Flow cytometry tubes containing 2-5x10⁶ tumor or spleen cells were labeled and stained with 0.5 μL GhostRed780 (Tonbo Biosciences) in 500μL of PBS per sample and light protected at 4°C for 20-30 minutes. Samples were then washed with flow buffer (PBS +2% FBS). Fc block was not used here. In the meantime, a master mix containing all antibody markers was prepared and aliquoted at 50 μL per flow tube (Table S2). Fluorescence minus one controls (FMOs) were also prepared for each marker minus live/dead. Cells were stained with surface markers for 30-45 min at 4°C in the dark. After staining, samples were washed in flow buffer and data acquired on an Attune™ NxT flow cytometer (Thermo Fisher) with manufacturer provided acquisition software. This instrument was maintained by the Flow Cytometry Core Lab through the University of Wisconsin Carbone Cancer Center, which performs daily quality control checks and instrument calibration using Attune™ Performance Tracking Beads (Thermo Fisher, cat 4449754). This cytometer was equipped with the following excitation lasers: 488nm (BL), 561nm (YL), 405m (VL), and 633nm (RL). The cytometer was equipped with the following channel/bandpass filter combinations: BL1 (530/30), BL2 (590/40), BL3 (695/40), YL1 (585/16), YL2 (620/15), YL3 (695/40), YL4 (780/60), VL1 (440/50), VL2 (512/25), VL3 (603/48), VL4 (710/50), RL1 (670/14), RL2 (720/30), and RL3 (780/60). Data were analyzed using FlowJo version 10.7.1 (FlowJo LLC, Becton Dickinson & Company (BD) 2006-2020). Gates were determined using FMOs. Gating strategies for each immune cell population are defined in Table 2.
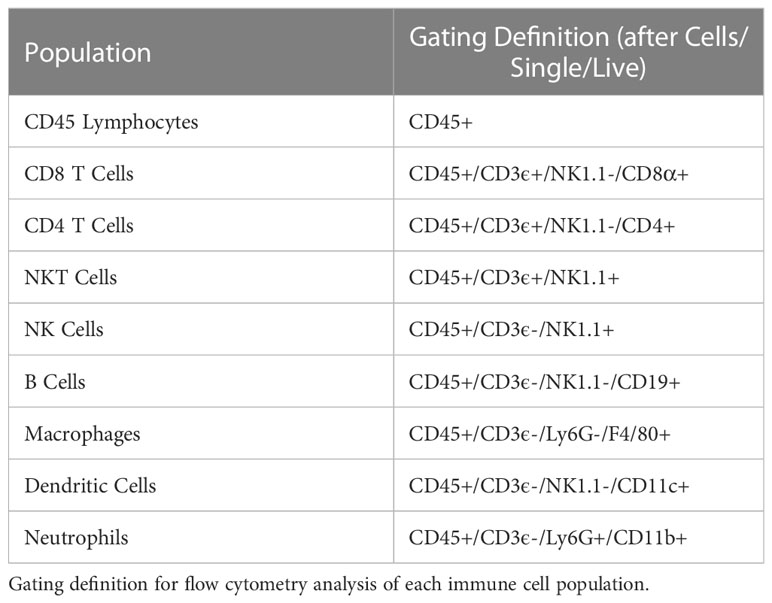
Table 2 Flow cytometry gating strategies.
2.6 Heatmaps
Z-score heatmaps were created using the Complex Heatmap package (RStudio) (53, 54). Hierarchical clustering of single cells was performed based on twelve OMI parameters (NAD(P)H τm, τ1, τ2, α1, α2; FAD τm, τ1, τ2, α1, α2; cell size; optical redox ratio) and calculated using Ward’s method. Labels for cell type, tissue type, and mouse were added afterwards and not included in cluster analysis.
2.7 Statistical analysis
Mann–Whitney statistical tests for non-parametric, unpaired comparisons were performed to assess differences in OMI parameters between cell types. This test was chosen because these data distributions were not assumed to be parametric. Results are represented as dot plots showing mean ± standard deviation where each dot represents a single cell (GraphPad Prism 9). Effect size was also calculated to assess differences in OMI parameters between cell types using Glass’s Δ because comparisons of very large sample sizes of individual cells almost always pass traditional significance tests unless the population effect size is truly zero (55). Glass’s Δ is defined as the difference between the mean of the experimental group (M1) and the mean of the control group (M2) divided by the standard deviation of the control group (σcontrol).
A Glass’s Δ > 0.8 was chosen to indicate significant effect size based on previous studies (22, 56, 57). When comparing immune cells from different tissues, the immune cells from the spleen were designated as the control. When comparing tumor cells and immune cells within the tumor, immune cells were designated as the control. Here, we report the absolute value of Glass’s Δ. The OMI heatmaps represent Z-score (4 standard deviations ± from the mean of all cells in the heatmap) for each OMI parameter per cell type (RStudio) (53). A Z-score of 0 indicates that data point score is identical to the mean score.
3 Results
3.1 CD4 mCherry reporter mouse demonstrates mCherry expression in all CD4 T cells as well as most CD8 T cells and NKT cells
Multiphoton images of ex vivo isolated CD3+ splenic T cells illustrate successful nuclear mCherry-expression (red) by all T cell populations within the CD4 mCherry reporter mouse (Figure 2A left) with no mCherry present in the C57BL/6 wild type mouse (Figure 2A right). As expected, both reporter and wild type mice exhibit endogenous NAD(P)H (blue) in all T cells. Multiplex immunofluorescence images from reporter mouse spleen (Figure 2B left) and B78 tumor (Figure 2B right) illustrate mCherry-expression by several subsets of immune cells including CD4+mCherry+ (yellow arrow) and CD8+mCherry+ (magenta arrow) T cells as well as other immune cells. Quantitative cell population analysis via flow cytometry in reporter mouse spleens and B78 tumors (Figure 2C) indicates efficient mCherry-expression by all CD4+ T cells (70-100%), with mCherry labeling also occurring in other cells known to express CD4 during differentiation including CD8 T cells and NKT cells (70-100%) as well as B cells, dendritic cells, and macrophages (<20%). The data also indicates very low mCherry expression by cells that do not typically express CD4 during differentiation, including NK cells and neutrophils (<20%). During maturation, high CD4 expression is expected for CD4 and CD8 T cells as well as NKT cells while CD4 is expressed to a minor extent on macrophages, B cells, dendritic cells, and some monocytes (32–34). When comparing mCherry mean fluorescence intensity (MFI) of these more mature immune cell populations, CD8 T cells, CD4 T cells, and NKT cells exhibited the brightest mCherry signal with significantly lower MFI for all other populations (Figure S3). Additionally, the mCherry MFI of NK cells, B cells, macrophages, dendritic cells, and neutrophils overlapped with our negative control – a spleen from a wild type C57BL/6 mouse (Figure S3). Overall, the Cre-lox methods used to create this reporter mouse (Figure S1) were successful at labeling the majority of T cell and NKT populations known to express CD4 in either their mature state or during maturation. This reporter mouse model may be a useful tool to researchers performing tumor immunotherapy work where visualization of T cells via mCherry-expression is beneficial, especially for techniques where secondary methods can be used to further identify subsets of mCherry+ cells, if desired. If a highly specific CD4 T cell model is needed, this model may not be the optimal choice.
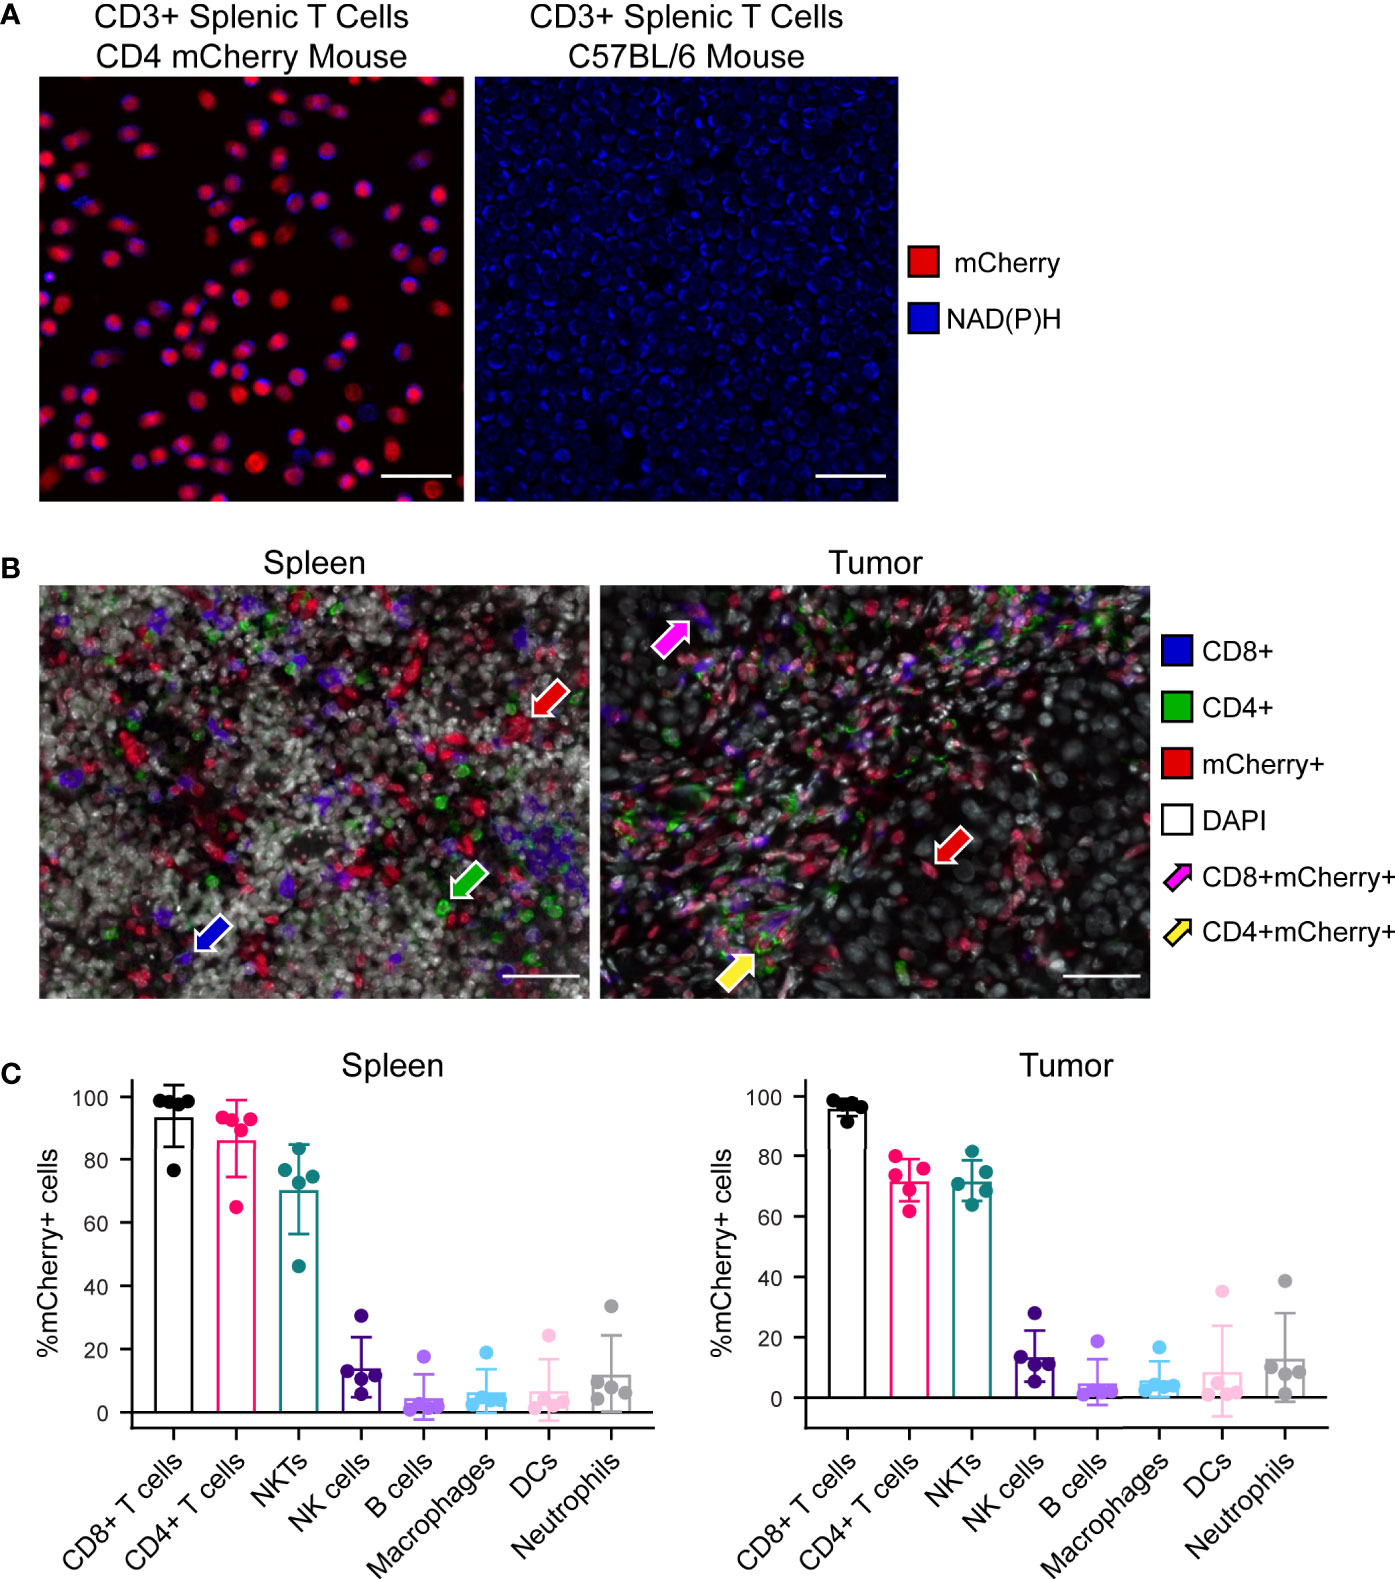
Figure 2 Characterization of CD4 mCherry reporter mouse tissues. (A) Ex vivo two-photon images of isolated CD3+ splenic T cells at 40× illustrate nuclear mCherry labeling of all T cell populations (red) within the reporter mouse (left) which colocalizes well with the metabolic coenzyme NAD(P)H also present in all T cells (blue), primarily in the cytoplasm. Within the unlabeled wild type C57BL/6 mouse (right), NAD(P)H but not mCherry is present in all T cells (blue). Cell density is higher for the wild type C57BL/6 image (right) compared to reporter mouse. Scale bar 25 μm. (B) Representative 40× multiplex immunofluorescence images from reporter mouse spleen (left) and B78 melanoma tumor (right) illustrates mCherry labeling of several subsets of immune cells. CD4+mCherry- cells with only green membrane (green arrow), CD8+mCherry- cells with only blue membrane (blue arrow), CD4-CD8-mCherry+ with only red nuclei (red arrow), CD4+mCherry+ with both red nuclei and green membrane (yellow arrow), CD8+mCherry+ with both red nuclei and blue membrane (magenta arrow). Scale bar 50 μm. (C) Quantitative cell population analysis by flow cytometry in both spleens (left) and B78 melanoma tumors (right) indicates efficient mCherry expression by the majority of CD4+ T cells (70-100%) with mCherry expression also occurring in other cells known to express CD4 during differentiation, including CD8 T cells and NKT cells (70-100%) as well as B cells, dendritic cells, and macrophages (<20%). The data also indicates very low mCherry expression by cells that do not typically express CD4 during differentiation, including NK cells and neutrophils (<20%) (n = 5 untreated mice, mean ± SD).
3.2 Intravital imaging enables concurrent visualization of tumor and immune cells
Intravital imaging of reporter mouse tumors was performed using a skin flap surgery method (Figure 1) to image B78 melanoma tumor and immune cell subsets live. Representative in vivo fluorescence intensity tumor images (Figure 3A left, middle) highlight mCherry-expressing immune cells (red) infiltrated into the tumor tissue and within the vasculature as well as autofluorescent NAD(P)H (blue) and FAD (green) expressed and detected in all cells. Collagen fibers (endogenous SHG signal, white) and their interaction with mCherry-expressing immune cells were also visualized within the TME, where some immune cells are co-localized with collagen fibers (Figure 3A right). Ex vivo imaging of freshly excised reporter mouse spleens was completed within one hour post mouse euthanasia, accurately capturing splenic metabolism based on our previous work that showed that ex vivo metabolism is statistically identical to in vivo metabolism for up to 12 hours post euthanasia (46). Representative ex vivo fluorescence intensity spleen images (Figure 3B) highlight mCherry-expressing immune cells (red) within the spleen tissue and lining the vasculature. Autofluorescent NAD(P)H (blue) and FAD (green) can be detected in all cells. Optical redox ratio images inform on tumor and immune cell redox balance in both tumor and spleen tissues (Figure 3C). Representative in vivo fluorescence lifetime images of the tumor and spleen show the mean lifetime of mCherry, NAD(P)H, and FAD mapped to their location with each cell (Figure 3D). The mCherry mean lifetime values (typical τm = 1,300-1,500 ps) help distinguish mCherry+ cells from nonspecific red autofluorescence in vivo (58–61). The NAD(P)H and FAD mean lifetime values inform on protein-binding and other environmental changes within the cell. Our imaging technology provides clear, concurrent images of both B78 and mCherry+ immune cells from both cancerous and healthy tissues. This imaging approach may be helpful to researchers performing immunotherapy, infectious disease, and autoimmune disorder research where the focus is on both the immune system and local tissues.
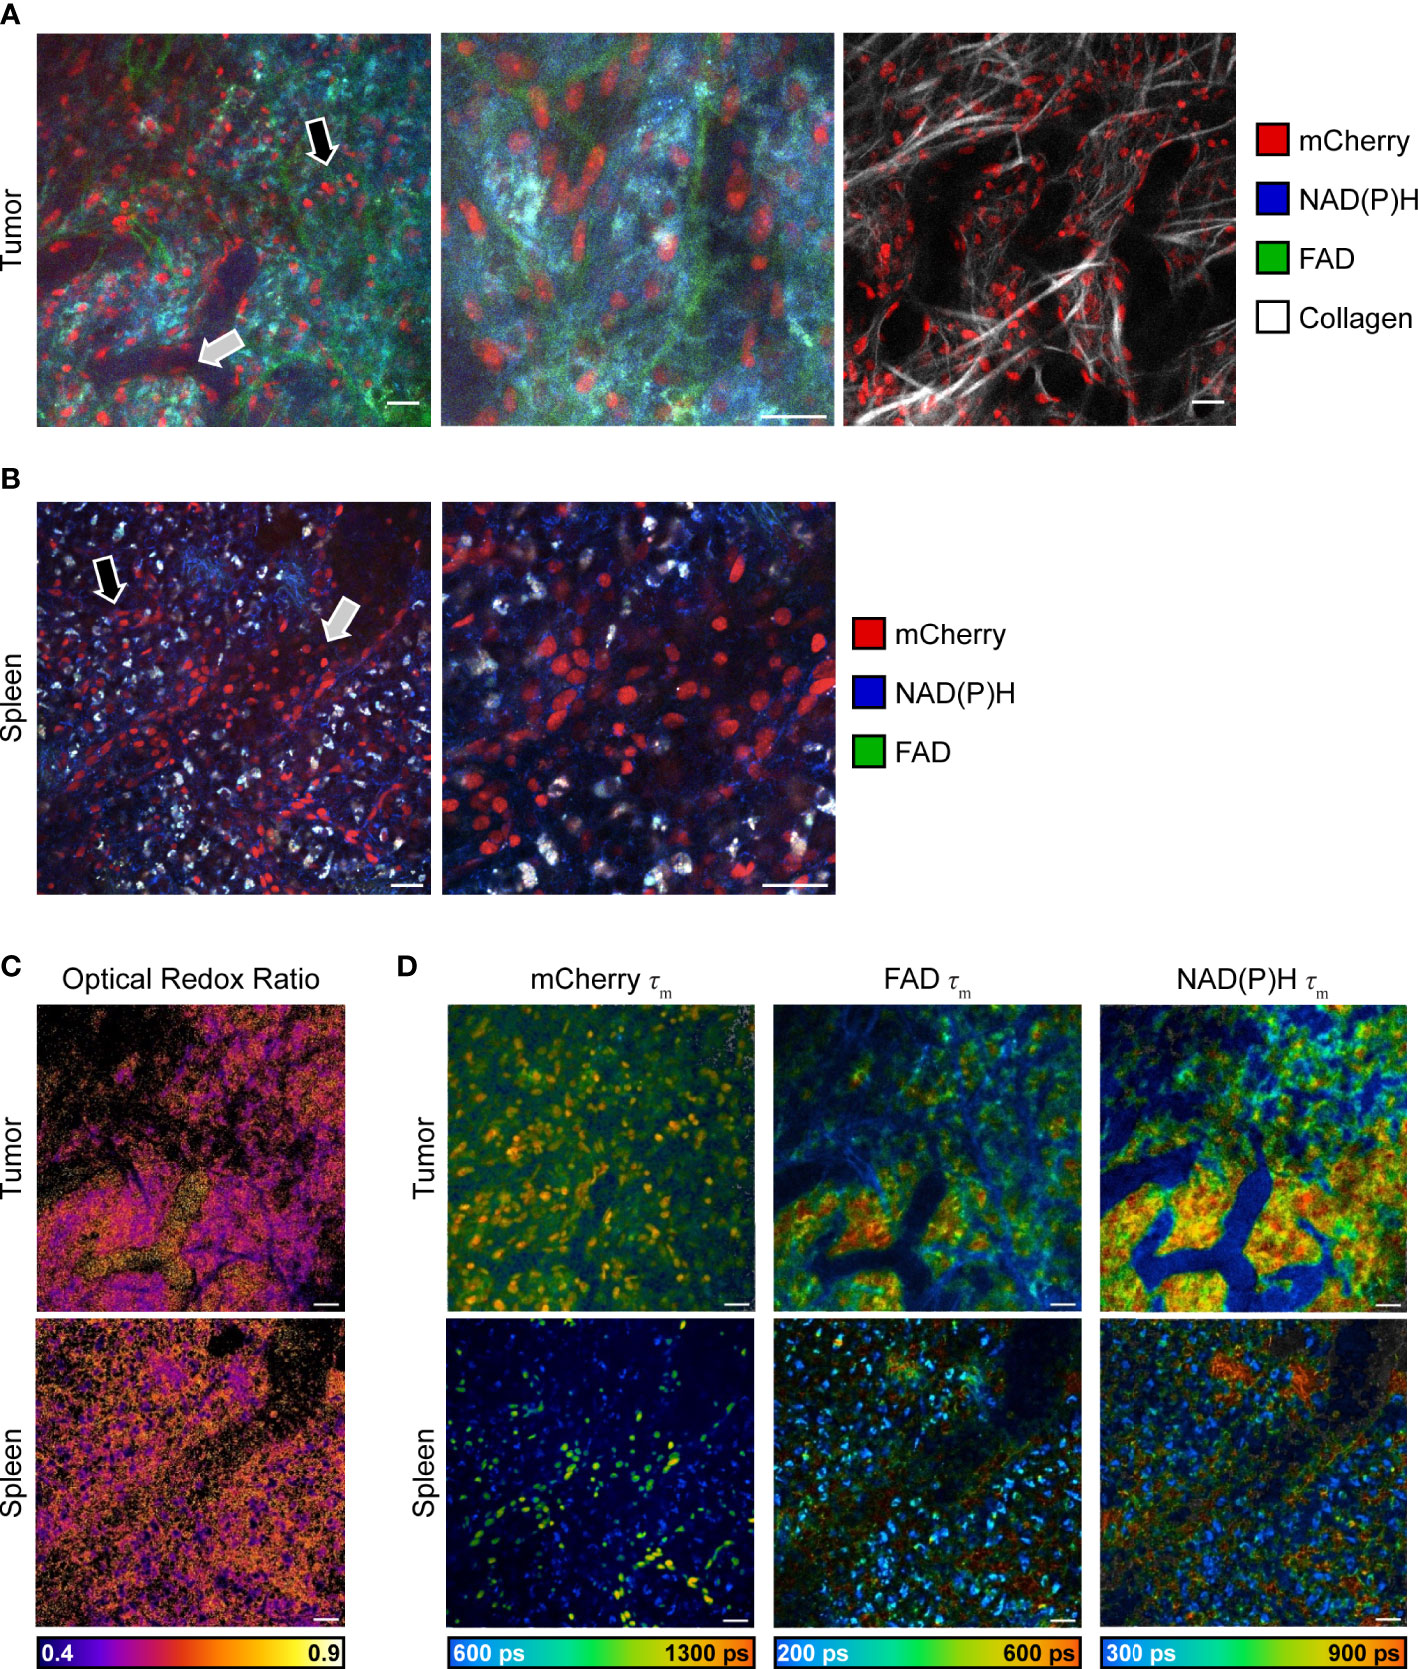
Figure 3 In vivo multiphoton images of immune and tumor cell populations. (A) Representative in vivo fluorescence intensity images of B78 melanoma growing in an untreated CD4 mCherry reporter mouse, live during skin flap surgery. Images (left and center) of all fluorophores show mCherry-expressing immune cells (red) infiltrating into tumor tissue (black arrow) and within vasculature (gray arrow) as well as autofluorescent NAD(P)H (blue) and FAD (green) expressed by all cells. Center image is a zoom of 2.0, inset from left image. Right image shows mCherry-expressing immune cells (red) interacting with collagen fibers (white) within the tumor microenvironment. Scale bar 25 μm. (B) Representative ex vivo fluorescence intensity images of spleen from untreated CD4 mCherry reporter mouse, spleen imaged immediately after euthanasia and excision. Images of all fluorophores show mCherry-labeled immune cells (red) within spleen tissue (black arrow) and vasculature (gray arrow) as well as autofluorescent NAD(P)H (blue) and FAD (green) expressed by all cells. Right image is a zoom of 2.0, inset from left image. Scale bar 25 μm. (C) Optical redox ratio images (the intensity of NAD(P)H divided by intensity of NAD(P)H plus FAD) show cellular redox balance within tumor (top) and spleen (bottom). Scale bar 25 μm. (D) Representative in vivo fluorescence lifetime images of B78 melanoma growing in an untreated CD4 mCherry reporter mouse. mCherry τm images show mCherry-expressing immune cells and their corresponding mean lifetime (τm) values that are used to distinguish mCherry-expressing cells (typical τm = 1,300-1,500 ps) from nonspecific red autofluorescence in vivo. NAD(P)H and FAD τm images show NAD(P)H and FAD intensity and corresponding mean lifetime values that provide insight into tumor metabolism. ps, picoseconds. Scale bar 25 μm.
3.3 Automated immune cell segmentation algorithm provides fast, reproducible, single cell metabolic information
To obtain quantitative metabolic information from the images we acquired, single cell segmentation was performed. Traditionally, cell segmentation has been performed manually. However, in vivo and ex vivo images often have low signal to noise ratios, additional cell types that complicate analysis, and poorly distinguished cell boundaries – all of which makes the manual segmentation process difficult and slow. Manual segmentation also introduces variability between researchers. To promote faster and more reproducible segmentation, an automated single cell segmentation method was developed (Figures 4A, S2) to segment immune cells. This custom Python algorithm provided unbiased, accurate segmentation masks and validated results against hand segmented ground truth masks (Figures 4B, C). The automated segmentation algorithm performed the segmentation in a fraction of the time required to segment the images manually – on the order of seconds compared to hours. Additionally, this automated method combined both fluorescence intensity and fluorescence lifetime images to create the most accurate immune cell mask – a step that helps differentiate true mCherry signal from nonspecific red autofluorescence in the tissue. The algorithm also allowed rapid iteration of cell segmentation to provide the most optimized mask. The final immune cell masks were high quality and closely matched the manually segmented masks (Table S1). Dice coefficient accuracy metrics were calculated to compare images, where Dice scores range from 0 (no overlap) to 1 (perfect match). The image segmentation field typically considers 0.5 the minimum acceptable Dice coefficient, with higher regard for segmentation techniques that produce Dice coefficients in the 0.6-0.7 range (62–64). Our automated segmentation algorithm performed better on images from the spleen (Dice coefficients average 0.663) compared to images from the tumors (Dice coefficients average 0.590). Immune cell size was more heterogenous and signal to noise was worse within the tumor images, likely contributing to this difference in performance.
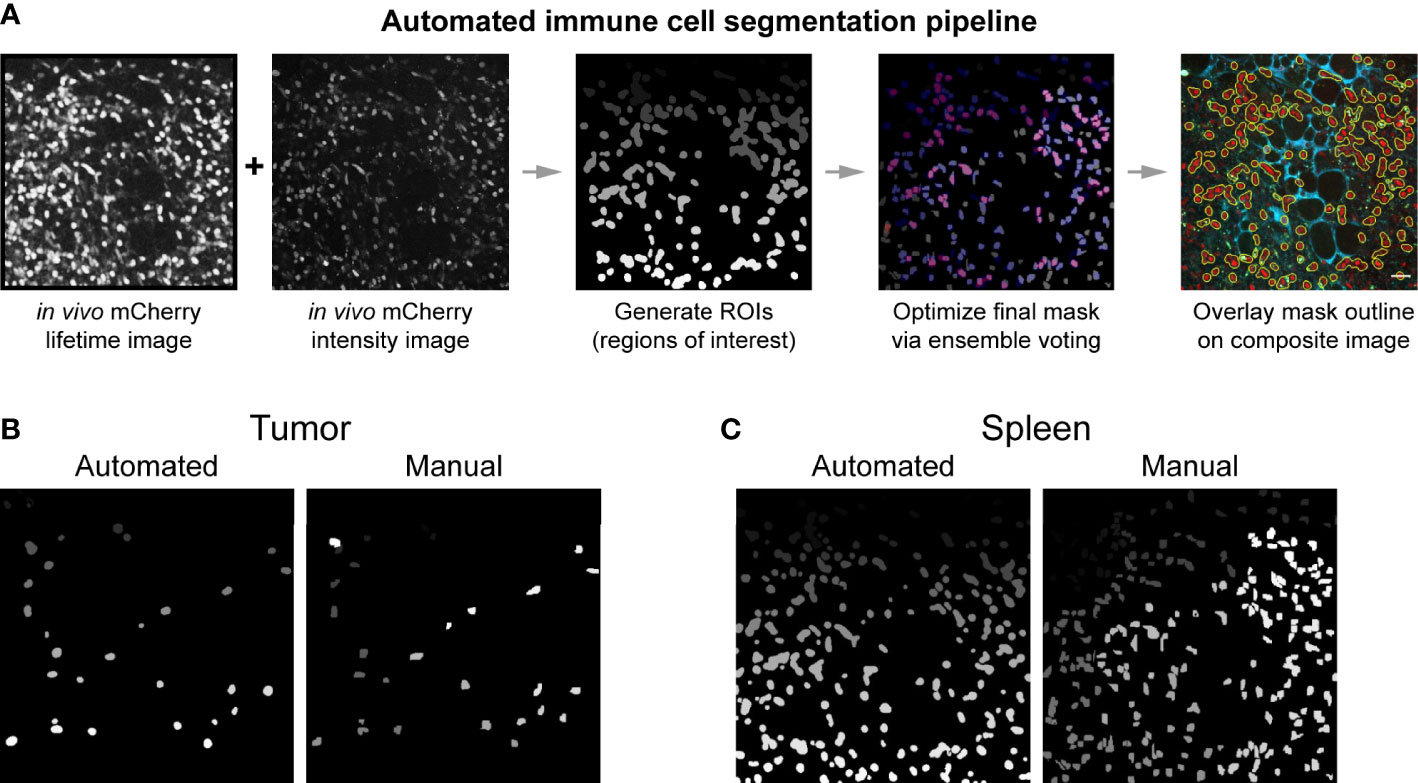
Figure 4 Automated immune cell segmentation pipeline to analyze in vivo multiphoton optical metabolic images. (A) Flowchart showing automated segmentation pipeline analysis on a single example image for mCherry-expressing immune cells. Pipeline developed in Python. This pipeline enables the extraction of metabolic data from each immune cell. (B, C) Representative examples of the comparison between an automated segmentation mask versus a manual segmentation mask of immune cells in a (B) B78 tumor (Mouse 2 FOV 7) and (C) spleen (Mouse 1 FOV6) field of view. Dice coefficient scores were also calculated to show quantitative accuracy between automated masks and manual masks, as shown in Table S1. All fields of view (FOV) 300 × 300 μm.
3.4 Optical metabolic imaging distinguishes immune cells from healthy and cancerous tissue origin
Using these techniques, we then quantified single cell mCherry+ immune cell OMI parameters from spleens and B78 tumors. Immune cells from B78 tumors exhibited significantly decreased FAD τm compared to immune cells from spleens (Figure 5A, Glass’s Δ > 0.8). Immune cells from B78 tumors also exhibited significantly increased FAD α1, the proportion of protein-bound FAD, compared to immune cells from spleens (Figure 5A, Glass’s Δ > 0.8). Additionally, immune cells from B78 tumors are significantly larger in size compared to immune cells from spleens (Figure 5A, Glass’s Δ > 0.8). Finally, immune cells from B78 tumors exhibited decreased NAD(P)H τm compared to immune cells from spleens; though the p value indicates substantial significance (p<0.0001), only a trend is observed using the more conservative Glass’s Δ test (Figure 5A, Glass’s Δ = 0.5366). We also visualized single cell heterogeneity based on OMI parameters from immune cells within spleens and tumors using a heatmap of z-scores where each column is a single immune cell (Figure 5B). The OMI parameters cluster cells best by tissue type (spleen vs. tumor) with some clustering by mouse. When the OMI parameters are plotted without the optical redox ratio, we continue to see consistent clustering by tissue type (Figure S4). Taken together, these data show that in vivo OMI can distinguish immune cells from different tissues of origin and visualize single cell heterogeneity in metabolism.
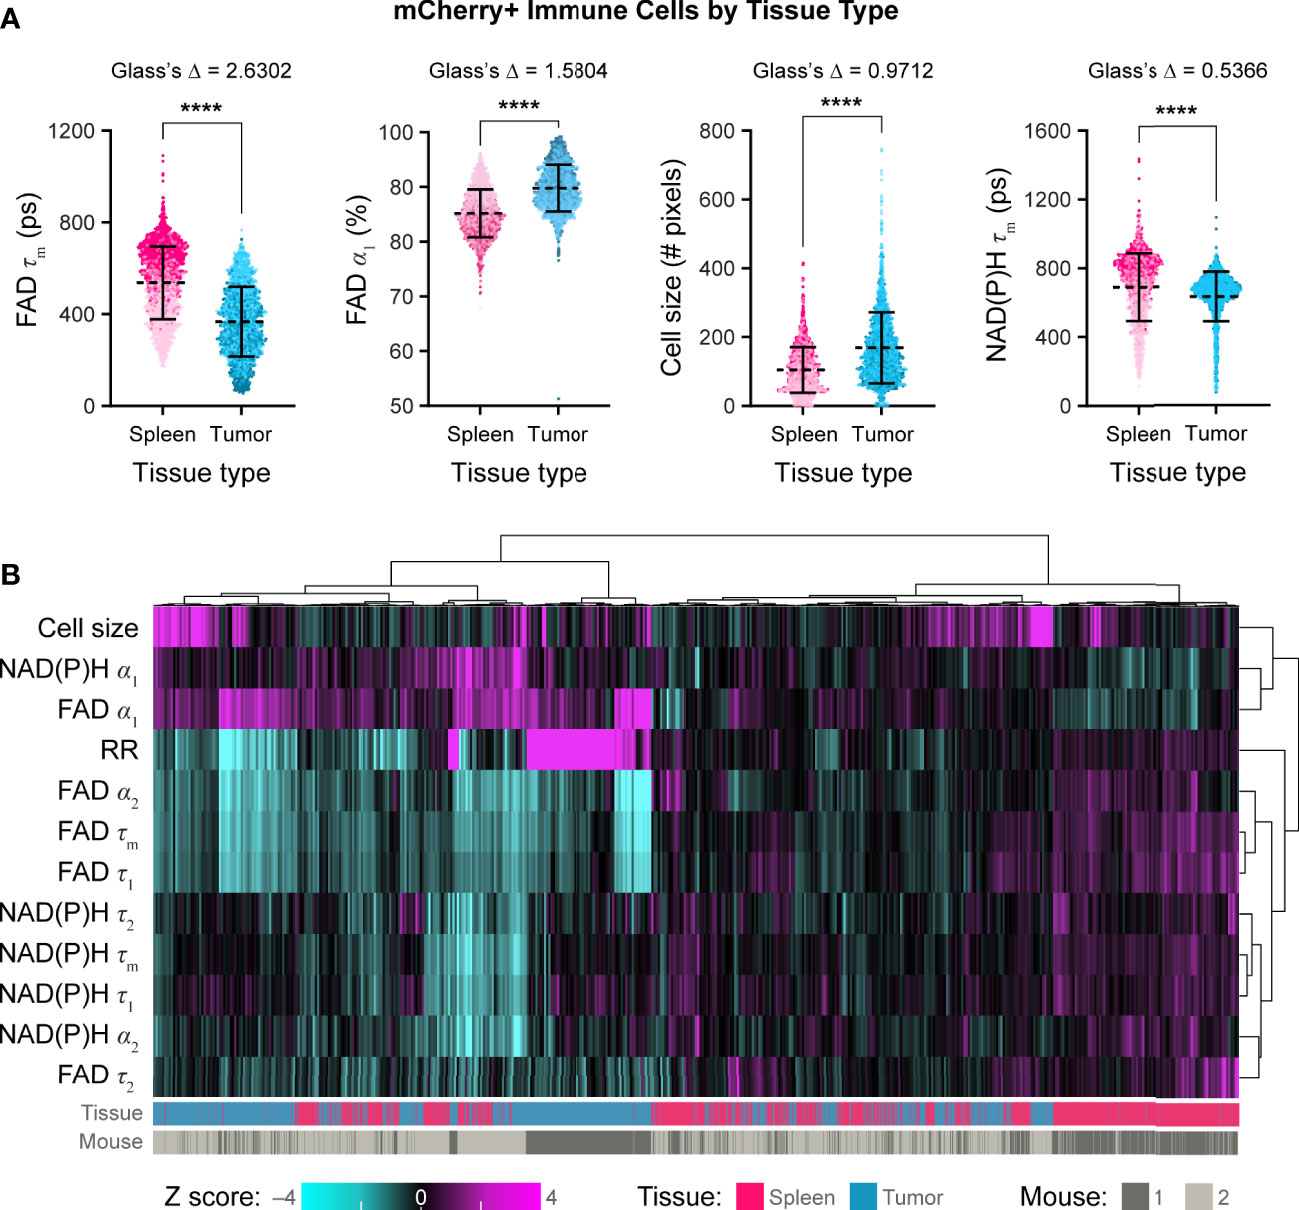
Figure 5 In vivo optical metabolic imaging of mCherry+ immune cells within tumor and spleen discriminates metabolic changes based on tissue type. (A) Single cell mCherry+ immune cell OMI parameters from spleen (n = 1672 cells) and B78 tumor (n =1688 cells) across n = 2 mice. Immune cells from B78 tumors exhibit significantly decreased FAD τm (361 ps vs. 554 ps) and significantly increased FAD α1 (90% vs. 85%) compared to immune cells from spleens (Glass’s Δ >0.8). Immune cells from B78 tumors are significantly larger in size (149 pixels vs. 95 pixels) compared to immune cells from spleens (Glass’s Δ >0.8). Immune cells from B78 tumors exhibit decreased NAD(P)H τm (667 ps vs. 734 ps) compared to immune cells from spleens; though the p value indicates substantial significance (p<0.0001), only a trend is observed using the more conservative Glass’s Δ test (Glass’s Δ = 0.5366). Data points colored to reflect individual replicates acquired on different days. Bars indicate mean ± SD, Mann-Whitney U Test, **** p<0.0001 shown for reference; all Mann-Whitney U Test comparisons are significant due to the large sample size so Glass’s Δ was also included as a more conservative significance test, see Methods. (B) Heatmap of z-scores of 12 OMI parameters from immune cells within both spleens and tumors. Hierarchical clustering of single cells indicates data clusters best by tissue type. Each column is a single cell (n = 3360 cells).
3.5 Optical metabolic imaging distinguishes tumor and infiltrating immune cells within the same tumor
We also quantified single cell OMI parameters from B78 tumor cells versus tumor infiltrating mCherry+ immune cells within the same tumor. Tumor infiltrating immune cells exhibited significantly increased FAD τm compared to B78 tumor cells within the same tumor (Figure 6A, Glass’s Δ > 0.8). Tumor infiltrating immune cells also exhibited significantly increased FAD τ1, the lifetime of protein-bound FAD, compared to B78 tumor cells within the same tumor (Figure 6A, Glass’s Δ > 0.8). Additionally, tumor infiltrating immune cells exhibited a decreased FAD α1 and NAD(P)H τm compared to B78 tumor cells; though the p values both indicate substantial significance (p<0.0001), only a trend is observed using the more conservative Glass’s Δ test (Figure 6A, FAD α1 Glass’s Δ = 0.5746, NAD(P)H τm Glass’s Δ = 0.4448). We visualized single cell heterogeneity based on OMI parameters from tumor infiltrating immune cells and B78 tumor cells within the same tumors using a heatmap of z-scores where each column is a single cell (Figure 6B). The OMI parameters cluster cells best by mouse (mouse 1 vs. mouse 2) indicating variability in the different tumor microenvironments in the two mice. We also observed heterogeneity in OMI between the two tumors that were imaged on different days, which was especially prominent within the optical redox ratio parameter. Interestingly, when the OMI parameters are plotted without the optical redox ratio, cells cluster based on both the mouse and cell type (tumor infiltrating immune cell vs. tumor cell) (Figure S5). Taken together, these data show that in vivo OMI can distinguish tumor infiltrating immune cells from B78 tumor cells, all within the same tumor environment, and visualize single cell heterogeneity in metabolism.

Figure 6 In vivo optical metabolic imaging within tumors discriminates infiltrating immune and tumor cells. (A) Single cell OMI parameters from infiltrating mCherry+ immune cells (n = 1688 cells) and B78 tumor cells (n =1455 cells) within the tumors from n = 2 mice. Immune cells from the B78 tumors exhibit significantly increased FAD τm (361 ps vs. 306 ps) and FAD τ1 (213 ps vs. 174 ps) compared to B78 tumors cells (Glass’s Δ > 0.8). Immune cells from B78 tumors exhibit decreased FAD α1 (89% vs. 91%) compared to B78 tumor cells; though the p value indicates substantial significance (p<0.0001), only a trend is observed using the more conservative Glass’s Δ test (Glass’s Δ = 0.5746). Immune cells from B78 tumors exhibit decreased NAD(P)H τm (667 ps vs. 686 ps) compared to B78 tumor cells; though the p value indicates substantial significance (p<0.0001), only a trend is observed using the more conservative Glass’s Δ test (Glass’s Δ = 0.4448). Data points colored to reflect individual replicates acquired on different days. Bars indicate mean ± SD, Mann-Whitney U Test, ****p<0.0001 shown for reference; all Mann-Whitney U Test comparisons are significant due to the large sample size so Glass’s Δ was also used as a more conservative significance test, see Methods. (B) Heatmap of z-scores of 12 OMI parameters from immune cells and tumor cells within B78 tumors. Hierarchical clustering of single cells indicates data clusters best by mouse with some clustering by cell type. Each column is a single cell (n = 3143 cells).
4 Discussion
Metabolic reprogramming plays an active role in cancer progression (1, 2). Complex metabolic changes occur in parallel for both tumor and infiltrating immune cell populations in the TME. To improve clinical cancer outcomes, an improved understanding of tumor and immune cell metabolism and their interplay in vivo is greatly needed. Here, we demonstrated the potential power of intravital OMI to help fulfill this need by imaging single cell metabolism in tumor and immune cells in vivo.
Our mCherry reporter mouse model enabled in vivo tracking and segmentation of single immune cells. We showed that this immunocompetent mouse model had efficient mCherry-expression in nearly all T cells (CD4 and CD8) and NKT cells as well as a few other immune cell subsets via multiphoton imaging, multiplex immunofluorescence, and flow cytometry assays. Immune cell mCherry-expression was also shown to be consistent between spleen and B78 melanoma tumor tissues. The low mCherry expression observed on NK cells and neutrophils, which do not typically express CD4 during differentiation, is likely due to low levels of baseline, non-targeted mCherry expression in the floxed H2B-mCherry strain (Jax 023139) prior to introduction of Cre, which has been reported by Jackson Labs. Additionally, the mCherry reporter allowed simultaneous detection of NAD(P)H and FAD autofluorescence in vivo without fluorescence interference from the reporter. This reporter mouse model may be a useful tool to researchers performing tumor immunotherapy studies where visualization of CD3+ immune cells (such as CD4 T, CD8 T, or NKT cells) via mCherry-expression is beneficial.
In vivo OMI provided clear visualization of tumor and immune cells within both spleen and tumor tissues. We observed tumor infiltrating immune cells, immune cells within and lining blood vessels, and immune cells co-localized with collagen fibers. We captured autofluorescence changes within the healthy and diseased tissue context and visualized single cell heterogeneity in metabolism within immune cells and tumor cells. We note that the FAD channel includes contributions from other endogenous fluorophores in cells [e.g., lipofuscin, flavin mononucleotide (FMN)] and the extracellular matrix (e.g., collagen, elastin). The extracellular matrix signals from fibers are easily segmented from cells based on location and morphology. We do not anticipate that lipofuscin and FMN strongly affect our FAD signal changes because metabolic perturbations (cyanide) confirm expected changes in FAD intensity and lifetime. Additionally, the lifetimes of FMN and lipofuscin are longer and shorter, respectively, than the FAD lifetime observed in this study and in prior works (15, 65–68). Therefore, we label this the FAD channel to reflect its presence while acknowledging the caveat of other sources of contrast. Taken together, this in vivo imaging platform is a valuable technique to probe metabolic changes within intact, unlabeled tissues that better preserves the TME.
We also reported an automated segmentation algorithm that provided robust segmentation of single immune cells from our in vivo images. The algorithm incorporated both fluorescence intensity and lifetime information for more accurate cell segmentation while dramatically reducing segmentation time (seconds vs. hours for automated vs. manual segmentation). Dice coefficients to compare the accuracy of the automated segmentation algorithm to manual segmentation showed robust results, with the spleen images providing the highest agreement. Overall, this automated segmentation algorithm enabled single cell segmentation and quantification of metabolism within mCherry-expressing immune cells in vivo and ex vivo.
Optical metabolic imaging parameters discriminated immune cells from spleen and cancerous tissues of origin. Immune cells from B78 tumors are larger with an increase in protein-binding of FAD and decreased FAD τm and NAD(P)H τm compared to immune cells in spleens. We have previously shown that T cell activation correlates with a decrease in FAD τm and NAD(P)H τm along with an increase in FAD α1 (27), as we also showed here, providing confidence in our findings for immune cells from B78 tumors in vivo. Further, our observed decrease in FAD τm in immune cells within the tumor compared to spleen trends the same as our previously reported work with macrophages in tumors vs. skin (26). Additionally, the observed decrease in FAD τm found in immune cells within B78 tumors versus spleens may be partly due to decreased pH within the TME which has been shown to influence autofluorescence lifetime (69, 70). We also observed a significant increase in immune cell size from B78 tumors compared to spleens. This size difference is expected as immune cell size typically increases during stimulation, activation, and proliferation, which can occur within the tumor microenvironment (27, 71–74). Our analysis of single cell heterogeneity based on all OMI parameters showed clustering of immune cells based on tissue of origin – spleen versus tumor. Therefore, our metabolic imaging is sufficient to distinguish immune cell population features based on size and metabolic differences within the TME compared to spleen.
Finally, metabolic imaging parameters also showed differences between immune cells and tumor cells within the same tumor environment. We found that tumor infiltrating immune cells exhibited an increase in FAD τm and lifetime of protein-bound FAD (FAD τ1) with a decrease in amounts of protein-bound FAD (FAD α1) and NAD(P)H τm compared to the B78 tumors cells within the same tumor. This increase in FAD τm in non-malignant, infiltrating immune cells compared to B78 tumor cells trends the same as other reported work comparing FAD lifetime of non-malignant breast cells vs. breast cancer cells (17). We also observed a significant increase in the lifetime of protein-bound FAD (FAD τ1) for tumor infiltrating immune cells compared to B78 tumor cells. The fluorescence lifetime of protein-bound FAD changes with varying NAD+ concentrations due to increased FAD quenching in the presence of NAD+. So, this increase in protein-bound FAD may be indicative of a decrease in NAD+ concentration in infiltrating immune cells versus tumor cells (13, 75). Similarly, prior work has shown a comparable decrease in the NAD(P)H τm of macrophages compared to breast cancer cells (24) and non-malignant brain cells compared to glioblastoma (76). Taken together, tumor infiltrating immune cells exhibited an increase in FAD τm and lifetime of protein-bound FAD with a decrease in amounts of protein-bound FAD and NAD(P)H τm – which may be indicative of a shift towards a more glycolytic metabolism. These findings are in trend with prior work where it has been widely reported that many cancer cells primarily metabolize glucose using glycolysis (3–7). Heterogeneity analysis of all OMI parameters in immune and tumor cells within the same melanoma tumors showed clustering by mouse – highlighting the heterogeneity that occurs within each unique TME, even though these were mice from the same strain (nearly genetically identical), and each was implanted with the exact same B78 melanoma cells. However, when the OMI parameters are plotted without the optical redox ratio, cells cluster based on mouse and cell type (tumor infiltrating immune cell vs. tumor cell), indicating that the fluorescence lifetime parameters can capture differences in the metabolism of the immune vs. tumor cells. The optical redox ratio is an intensity-based measurement with increased sensitivity to day-to-day changes in laser power, laser alignment, tissue autofluorescence differences, and tissue composition differences such as increased presence of red blood cells. These factors make the redox ratio more sensitive to artifacts compared to fluorescence lifetime measurements that are self-referenced. Some of the observed immune cell metabolic heterogeneity may be partly attributed to the presence of three main mCherry+ immune cell types composing this group: CD4 T cells, CD8 T cells, and NKT cells. As these cells play different roles, their metabolic phenotypes also differ especially in the context of the TME. For example, activated CD4 T cells have been shown to rely more heavily on oxidative phosphorylation compared to their CD8 T cell counterparts in mice (77, 78). Similarly, CD8 T cells have been shown to be less sensitive to oxygen changes, which may result in differences compared to CD4 T cells within the hypoxic TME (79, 80). In contrast, NKT cells suppress glycolysis in the TME and rely on enhanced oxidative phosphorylation for function (81, 82). Heterogeneity within the TME itself may also contribute to the observed immune and tumor cell metabolic heterogeneity, influenced by factors such as pH as well as nutrient and oxygen availability. For example, tumor cells that are closer in proximity to blood vessels – resulting in higher oxygen concentrations and more nutrients – contain higher mitochondrial content, exhibit increased mitochondrial respiration, have a higher optical redox ratio, and exhibit a more aggressive phenotype compared to tumor cells far away from blood vessels (83–85). Immune cells are also affected by environmental factors, for example, more acidic pH (often due to an increase in lactate) in the TME inhibits mobility and tumor infiltration of both CD4 and CD8 T cells (86, 87). These factors, and many more, contribute to the metabolic heterogeneity we observed within our tumor and immune cell populations. Overall, we showed the versatility of in vivo OMI, our mCherry reporter mouse, and single cell segmentation to study single cell metabolic heterogeneity within different tissues and cell types of interest in the context of melanoma.
Although in vivo OMI provides information on metabolic changes across cells and tissues in vivo, alone it is not sufficient to specify a biological mechanism. Combining our live, spatial imaging with additional assays such as metabolite measurements via mass spectrometry or radiolabel tracing of glucose should identify specific metabolic pathways and possible drug targets (88–91). There is also great potential to use this in vivo imaging platform to assess drug, and especially immunotherapy, treatments in vivo, work that we are currently pursuing (40–42). Future studies may include the analyses done here – in mice receiving immunotherapy regimens known to be effective compared to those from which tumors are resistant or escape – in combination with other analyses of immune cell function, phenotype, and gene expression to identify metabolic patterns characteristic of effective anti-tumor immunity. We note that though only two animals were imaged in this study, single cell statistical power was high (3360 immune cells, 1455 tumor cells). In future studies focused on biological endpoints such as immunotherapy regimens, we will include additional animals. Ultimately, this imaging approach could provide insight into tumor and immune cell metabolism in a label free, in vivo manner to develop more effective cancer therapies.
Data availability statement
The original contributions presented in the study are included in the article/Supplementary Material, further inquiries can be directed to the corresponding author/s. The code presented in this study is available and deposited on GitHub at the following link: https://github.com/skalalab/heaton_a-automated_immune_cell_segmentation.
Ethics statement
The animal study was reviewed and approved by Institutional Animal Care and Use Committee at University of Wisconsin-Madison.
Author contributions
AHe designed the experiments, collected the data, designed and performed the analysis, interpreted the data, generated the figures, and drafted the manuscript for this study. PR designed and performed the analysis and assisted in editing the manuscript. AHo assisted in collecting the data, designing and performing the analysis, and editing the manuscript. AL assisted in performing the analysis. AE assisted in designing the experiments, interpreting the data, and editing the manuscript. PS and MS assisted in designing the experiments and analysis, interpreting the data, and editing the manuscript. All authors contributed to the article and approved the submitted version.
Funding
This work was funded by a Morgridge Interdisciplinary Postdoctoral Fellowship to AHe; The Midwest Athletes against Childhood Cancer (MACC) Fund; Stand Up to Cancer; The St. Baldrick’s Foundation; The Crawdaddy Foundation; The Cancer Research Institute; The Alex’s Lemonade Stand Foundation; and the National Institutes of Health [R35 CA197078, 5P30 CA014520-40, UL1 TR002373, P01 CA250972, R01 CA205101, and U54 CA232568].
Acknowledgments
We would like to thank Karla Esbona, Rebecca Baus, and the University of Wisconsin Translational Research Initiatives in Pathology laboratory (TRIP), supported by the UW Department of Pathology and Laboratory Medicine, UWCCC (P30 CA014520) and the Office of The Director – NIH (S10OD023526) for use of its facilities and services. We would also like to thank the University of Wisconsin Carbone Cancer Center Flow Cytometry Laboratory and the Biomedical Research Model Services for facilities and services. We further acknowledge Tiffany Heaster for training and helpful conversations, Alexander Rakhmilevich for advice and manuscript editing, Dan Pham for T cell isolation assistance, Steven Trier for practical guidance, Emmanuel Contreras Guzman for computational assistance, and Matt Stefely for figure formatting assistance.
Conflict of interest
The authors declare that the research was conducted in the absence of any commercial or financial relationships that could be construed as a potential conflict of interest.
Publisher’s note
All claims expressed in this article are solely those of the authors and do not necessarily represent those of their affiliated organizations, or those of the publisher, the editors and the reviewers. Any product that may be evaluated in this article, or claim that may be made by its manufacturer, is not guaranteed or endorsed by the publisher.
Supplementary material
The Supplementary Material for this article can be found online at: https://www.frontiersin.org/articles/10.3389/fonc.2023.1110503/full#supplementary-material
References
1. Renner K, Singer K, Koehl GE, Geissler EK, Peter K, Siska PJ, et al. Metabolic hallmarks of tumor and immune cells in the tumor microenvironment. Front Immunol (2017) 8:248(MAR). doi: 10.3389/fimmu.2017.00248
2. Roy DG, Kaymak I, Williams KS, Ma EH, Jones RG. Immunometabolism in the tumor microenvironment. Annu Rev Cancer Biol (2020) 5:137–59. doi: 10.1146/annurev-cancerbio-030518-055817
3. Warburg O, Wind F, Negelein E. The metabolism of tumors in the body. J Gen Physiol (1926) 8(6):519–305. doi: 10.1136/bmj.1.3653.74-a
4. Warburg O. On the origin of cancer cells. Science (1956) 123:(309). doi: 10.1126/science.123.3191.309
5. Vander Heiden MG, Cantley LC, Thompson CB. Understanding the warburg effect: The metabolic requirements of cell proliferation. Science (2009) 324(5930):1029–33. doi: 10.1126/science.1160809
6. Lunt SY, Vander Heiden MG. Aerobic glycolysis: Meeting the metabolic requirements of cell proliferation. Annu Rev Cell Dev Biol (2011) 27:441–64. doi: 10.1146/annurev-cellbio-092910-154237
7. DeBerardinis RJ, Chandel NS. We need to talk about the warburg effect. Nat Metab (2020) 2(2):127–295. doi: 10.1038/s42255-020-0172-2
8. Ghesquière B, Wong BW, Kuchnio A, Carmeliet P. Metabolism of stromal and immune cells in health and disease. Nature (2014) 511(7508):167–76. doi: 10.1038/nature13312
9. Mockler MB, Conroy MJ, Lysaght J. Targeting T cell immunometabolism for cancer immunotherapy; understanding the impact of the tumor microenvironment. Front Oncol (2014) 4:107(May). doi: 10.3389/fonc.2014.00107
10. Chance B, Schoener B, Oshino R, Itshak F, Nakase Y. Oxidation-reduction ratio studies of mitochondria in freeze-trapped samples. NADH and flavoprotein fluorescence signals. J Biol Chem (1979) 254(11):4764–71. doi: 10.1016/s0021-9258(17)30079-0
11. Georgakoudi I, Quinn KP. Optical imaging using endogenous contrast to assess metabolic state. Annu Rev Biomed Eng (2012) 14(1):351–675. doi: 10.1146/annurev-bioeng-071811-150108
12. Kolenc OI, Quinn KP. Evaluating cell metabolism through autofluorescence imaging of NAD(P)H and FAD. Antioxid Redox Signaling (2019) 30(6):875–95. doi: 10.1089/ars.2017.7451
13. Skala MC, Riching KM, Gendron-Fitzpatrick A, Eickhoff J, Eliceiri KW, White JG, et al. In vivo multiphoton microscopy of NADH and FAD redox states, fluorescence lifetimes, and cellular morphology in precancerous epithelia. Proc Natl Acad Sci (2007) 104(49):19494–995. doi: 10.1073/pnas.0708425104
14. Lakowicz JR, Szmacinski H, Nowaczyk K, Johnson ML. Fluorescence lifetime imaging of free and protein-bound NADH. Proc Natl Acad Sci USA (1992) 89(4):1271–755. doi: 10.1073/pnas.89.4.1271
15. Datta R, Heaster TM, Sharick JT, Gillette AA, Skala MC. Fluorescence lifetime imaging microscopy: Fundamentals and advances in instrumentation, analysis, and applications. J Biomed Optics (2020) 25(07):15. doi: 10.1117/1.jbo.25.7.071203
16. Trinh AL, Chen H, Chen Y, Hu Y, Li Z, Siegel ER, et al. Tracking functional tumor cell subpopulations of malignant glioma by phasor fluorescence lifetime imaging microscopy of NADH. Cancers (2017) 9(12):1–135. doi: 10.3390/cancers9120168
17. Ayuso JM, Gillette A, Lugo-Cintrón K, Acevedo-Acevedo S, Gomez I, Morgan M, et al. Organotypic microfluidic breast cancer model reveals starvation-induced spatial-temporal metabolic adaptations. EBioMedicine (2018) 37:144–57. doi: 10.1016/j.ebiom.2018.10.046
18. Bower AJ, Li J, Eric J, Marina Marjanovic C, Spillman DR, Boppart SA. High-speed imaging of transient metabolic dynamics using two-photon fluorescence lifetime imaging microscopy. Optica (2018) 5(10):12905. doi: 10.1364/optica.5.001290
19. Sharick JT, Jeffery JJ, Karim MR, Walsh CM, Esbona K, Cook RS, et al. Cellular metabolic heterogeneity in vivo is recapitulated in tumor organoids. Neoplasia (US) (2019) 21(6):615–265. doi: 10.1016/j.neo.2019.04.004
20. Lukina MM, Shimolina LE, Kiselev NM, Zagainov VE, Komarov DV, Zagaynova EV, et al. Interrogation of tumor metabolism in tissue samples ex vivo using fluorescence lifetime imaging of NAD(P)H. Methods Appl Fluorescence (2020) 8(1):1–11. doi: 10.1088/2050-6120/ab4ed8
21. Pascua SM, McGahey GE, Ma N, Wang JJ, Digman MA. Caffeine and cisplatin effectively targets the metabolism of a triple-negative breast cancer cell line assessed via phasor-FLIM. Int J Mol Sci (2020) 21(7):1–13. doi: 10.3390/ijms21072443
22. Sharick JT, Walsh CM, Sprackling CM, Pasch CA, Pham DL, Esbona K, et al. Metabolic heterogeneity in patient tumor-derived organoids by primary site and drug treatment. Front Oncol (2020) 10:553(May). doi: 10.3389/fonc.2020.00553
23. Parshina YP, Komarova AD, Bochkarev LN, Kovylina TA, Plekhanov AA, Klapshina LG, et al. Simultaneous probing of metabolism and oxygenation of tumors In vivo using FLIM of NAD(P)H and PLIM of a new polymeric Ir(III) oxygen sensor. Int J Mol Sci (2022) 23(18):1–24. doi: 10.3390/ijms231810263
24. Szulczewski JM, Inman DR, Entenberg D, Ponik SM, Aguirre-Ghiso J, Castracane J, et al. In vivo visualization of stromal macrophages via label-free FLIM-based metabolite imaging. Sci Rep (2016) 6:1–9. doi: 10.1038/srep25086
25. Sagar MAK, Cheng KP, Ouellette JN, Williams JC, Watters JJ, Eliceiri KW. Machine learning methods for fluorescence lifetime imaging (FLIM) based label-free detection of microglia. Front Neurosci (2020) 14:931(September). doi: 10.3389/fnins.2020.00931
26. Heaster TM, Heaton AR, Sondel PM, Skala MC. Intravital metabolic autofluorescence imaging captures macrophage heterogeneity across normal and cancerous tissue. Front Bioeng Biotechnol (2021) 9:644648(April). doi: 10.3389/fbioe.2021.644648
27. Walsh AJ, Mueller KP, Tweed K, Jones I, Walsh CM, Piscopo NJ, et al. Classification of T-cell activation via autofluorescence lifetime imaging. Nat Biomed Eng (2021) 5:77–88. doi: 10.1101/536813
28. Kröger M, Scheffel J, Shirshin EA, Schleusener J, Meinke MC, Lademann J, et al. Label-free imaging of M1 and M2 macrophage phenotypes in the human dermis in vivo using two-photon excited FLIM. ELife (2022) 11:1–23. doi: 10.7554/eLife.72819
29. Miskolci V, Tweed KE, Lasarev MR, Britt EC, Walsh AJ, Zimmerman LJ, et al. In vivo fluorescence lifetime imaging of macrophage intracellular metabolism during wound responses in zebrafish. ELife (2022) 11:1–24. doi: 10.7554/ELIFE.66080
30. Lee PP, Fitzpatrick DR, Beard C, Jessup HK, Lehar S, Makar KW, et al. A critical role for Dnmt1 and DNA methylation in T cell development, function, and survival. Immunity (2001) 15(5):763–74. doi: 10.1016/S1074-7613(01)00227-8
31. Peron SP, Freeman J, Iyer V, Guo C, Svoboda K. A cellular resolution map of barrel cortex activity during tactile behavior. Neuron (2015) 86(3):783–995. doi: 10.1016/j.neuron.2015.03.027
32. Vremec D, Pooley J, Hubertus H, Wu L, Shortman K. CD4 and CD8 expression by dendritic cell subtypes in mouse thymus and spleen. J Immunol (2000) 164(6):2978–865. doi: 10.4049/jimmunol.164.6.2978
33. McLellan AD, Kapp M, Eggert A, Linden C, Bommhardt U, Bröcker EB, et al. Anatomic location and T-cell stimulatory functions of mouse dendritic cell subsets defined by CD4 and CD8 expression. Blood (2002) 99(6):2084–935. doi: 10.1182/blood.V99.6.2084
34. Mak TW, Saunders ME. The T cell receptor: Structure of its proteins and genes. In: The immune response: Basic and clinical principles. Burlington, MA, USA: Elsevier Inc (2006). p. 311–40. doi: 10.1016/B978-0-12-088451-3.50038-7
35. Silagi S. Control of pigment production in mouse melanoma cells in vitro. evocation and maintenance. J Cell Biol (1969) 43(2):263–74. doi: 10.1083/jcb.43.2.263
36. Haraguchi M, Yamashiro S, Yamamoto A, Furukawa K, Takamiya K, Lloyd KO, et al. Isolation of GD3 synthase gene by expression cloning of GM2 a-2,8-Sialyltransferase CDNA using anti-GD2 monoclonal antibody. Proc Natl Acad Sci (1994) 91(October):10455–59. doi: 10.1073/pnas.91.22.10455
37. Becker JC, Varki N, Gillies SD, Furukawa K, Reisfeld RA. An antibody-interleukin 2 fusion protein overcomes tumor heterogeneity by induction of a cellular immune response. Proc Natl Acad Sci USA (1996) 93(15):7826–315. doi: 10.1073/pnas.93.15.7826
38. Nazha B, Inal C, Owonikoko TK. Disialoganglioside GD2 expression in solid tumors and role as a target for cancer therapy. Front Oncol (2020) 10:1000(July). doi: 10.3389/fonc.2020.01000
39. Carlson PM, Mohan M, Rodriguez M, Subbotin V, Sun CX, Patel RB, et al. Depth of tumor implantation affects response to in situ vaccination in a syngeneic murine melanoma model. J Immunother Cancer (2021) 9(4):1–8. doi: 10.1136/jitc-2020-002107
40. Morris ZS, Guy EI, Francis DM, Gressett MM, Werner LR, Carmichael LL, et al. In situ tumor vaccination by combining local radiation and tumor-specific antibody or immunocytokine treatments. Cancer Res (2016) 76(13):3929–41. doi: 10.1158/0008-5472.CAN-15-2644
41. Morris ZS, Guy EI, Werner LR, Carlson PM, Heinze CM, Kler JS, et al. Tumor-specific inhibition of In situ vaccination by distant untreated tumor sites. Cancer Immunol Res (2018) 6(7):825–34. doi: 10.1158/2326-6066.cir-17-0353
42. Aiken TJ, Komjathy D, Rodriguez M, Stuckwisch A, Feils A, Subbotin V, et al. Short-course neoadjuvant in situ vaccination for murine melanoma. J ImmunoTher Cancer (2022) 10(1):1–10. doi: 10.1136/jitc-2021-003586
43. Conway JRW, Warren SC, Timpson P. Context-dependent intravital imaging of therapeutic response using intramolecular FRET biosensors. Methods (2017) 128:78–94. doi: 10.1016/j.ymeth.2017.04.014
44. Seynhaeve ALB, Ten Hagen TLM. Intravital microscopy of tumor-associated vasculature using advanced dorsal skinfold window chambers on transgenic fluorescent mice. J Visualized Experiments (2018) 131):1–10. doi: 10.3791/55115
45. Scheele CLGJ, Herrmann D, Yamashita E, Lo Celso C, Jenne CN, Oktay MH, et al. Multiphoton intravital microscopy of rodents. Nat Rev Methods Primers (2022) 2(89). doi: 10.1038/s43586-022-00168-w
46. Walsh AJ, Poole KM, Duvall CL, Skala MC. Ex vivo optical metabolic measurements from cultured tissue reflect in vivo tissue status. J Biomed Optics (2012) 17(11):1160155. doi: 10.1117/1.jbo.17.11.116015
47. Mahou P, Zimmerley M, Loulier K, Matho KS, Labroille G, Morin X, et al. Multicolor two-photon tissue imaging by wavelength mixing. Nat Methods (2012) 9(8):815–185. doi: 10.1038/nmeth.2098
48. Stringari C, Abdeladim L, Malkinson G, Mahou P, Solinas X, Lamarre I, et al. Multicolor two-photon imaging of endogenous fluorophores in living tissues by wavelength mixing. Sci Rep (2017) 7(1):1–11. doi: 10.1038/s41598-017-03359-8
49. Ramanujam N. Fluorescence spectroscopy of neoplastic and non-neoplastic tissues. Neoplasia (U S) (2000) 2:89–117. doi: 10.2115/fiber.14.43
50. Otsu N. A threshold selection method from Gray-level histograms. IEEE Trans Syst Man Cybernetics (1979) 9(1):62–6. doi: 10.1109/TSMC.1979.4310076
51. Balabanian F, da Silva ESA, Pedrini H. Image thresholding improved by global optimization methods. Appl Artif Intell (2017) 31(3):197–2085. doi: 10.1080/08839514.2017.1300050
52. Mayala S, Haugsøen JB. Threshold estimation based on local minima for nucleus and cytoplasm segmentation. BMC Med Imaging (2022) 22(77):1–125. doi: 10.1186/s12880-022-00801-w
53. Gu Z, Gu L, Eils R, Schlesner M, Brors B. Circlize implements and enhances circular visualization in r. Bioinformatics (2014) 30(19):2811–125. doi: 10.1093/bioinformatics/btu393
54. Gu Z, Eils R, Schlesner M. Complex heatmaps reveal patterns and correlations in multidimensional genomic data. Bioinformatics (2016) 32(18):2847–495. doi: 10.1093/bioinformatics/btw313
55. Glass GV. Primary, secondary, and meta-analysis of research. Educational Researcher (1974) 5(10):3–8. doi: 10.2307/1174772
56. Sawilowsky SS. Very Large and huge effect sizes. J Modern Appl Stat Methods (2009) 8(2):597–99. doi: 10.22237/jmasm/1257035100
57. Gillette AA, Babiarz CP, Vandommelen AR, Pasch CA, Clipson L, Matkowskyj KA, et al. Autofluorescence imaging of treatment response in neuroendocrine tumor organoids. Cancers (2021) 13(8):1–17. doi: 10.3390/cancers13081873
58. Merzlyak EM, Goedhart J, Shcherbo D, Bulina ME, Shcheglov AS, Fradkov AF, et al. Bright monomeric red fluorescent protein with an extended fluorescence lifetime. Nat Methods (2007) 4(7):555–57. doi: 10.1038/nmeth1062
59. Gu L, Hall DJ, Qin Z, Anglin E, Joo J, David J, et al. In vivo time-gated fluorescence imaging with biodegradable luminescent porous silicon nanoparticles. Nat Commun (2013) 4:2326. doi: 10.1038/ncomms3326
60. Penjweini R, Kim J, Brenner MD, Sackett DL, Chung JH, Knutson JR, et al. Intracellular oxygen mapping using a myoglobin-MCherry probe with fluorescence lifetime imaging. J Biomed Optics (2018) 23(10):1. doi: 10.1117/1.jbo.23.10.107001
61. Štefl M, Herbst K, Rübsam M, Benda A, Knop M. Single-color fluorescence lifetime cross-correlation spectroscopy in vivo. Biophys J (2020) 119(7):1359–705. doi: 10.1016/j.bpj.2020.06.039
62. Cutler KJ, Stringer C, Wiggins PA, Mougous JD. Omnipose: A high-precision morphology-independent solution for bacterial cell segmentation. Nat Methods (2022) 19:1438–48. doi: 10.1101/2021.11.03.467199
63. Stringer C, Wang T, Michaelos M, Pachitariu M. Cellpose: A generalist algorithm for cellular segmentation. Nat Methods (2021) 18(1):100–1065. doi: 10.1038/s41592-020-01018-x
64. Stringer C, Pachitariu M. Cellpose 2.0: How to train your own model. BioRxiv (2022). doi: 10.1101/2022.04.01.486764
65. Kunz WS, Kunz W. Contribution of different enzymes to flavoprotein fluorescence of isolated rat liver mitochondria. Biochim Biophys Acta (1985) 841(3):237–465. doi: 10.1016/0304-4165(85)90064-9
66. Zipfel WR, Williams RM, Christiet R, Nikitin AY, Hyman BT, Webb WW. Live tissue intrinsic emission microscopy using multiphoton-excited native fluorescence and second harmonic generation. Proc Natl Acad Sci United States America (2003) 100(12):7075–805. doi: 10.1073/pnas.0832308100
67. Varone A, Xylas J, Quinn KP, Pouli D, Sridharan G, McLaughlin-Drubin ME, et al. Endogenous two-photon fluorescence imaging elucidates metabolic changes related to enhanced glycolysis and glutamine consumption in precancerous epithelial tissues. Cancer Res (2014) 74(11):3067–755. doi: 10.1158/0008-5472.CAN-13-2713
68. Kalinina S, Freymueller C, Naskar N, von Einem B, Reess K, Sroka R, et al. Bioenergetic alterations of metabolic redox coenzymes as nadh, fad and fmn by means of fluorescence lifetime imaging techniques. Int J Mol Sci (2021) 22(11):1–15. doi: 10.3390/ijms22115952
69. Islam MS, Honma M, Nakabayashi T, Kinjo M, Ohta N. PH dependence of the fluorescence lifetime of FAD in solution and in cells. Int J Mol Sci (2013) 14(1):1952–635. doi: 10.3390/ijms14011952
70. Schmitz R, Tweed K, Walsh C, Walsh AJ, Skala MC. Extracellular PH affects the fluorescence lifetimes of metabolic Co-factors. J Biomed Optics (2021) 26(05):1–105. doi: 10.1117/1.jbo.26.5.056502
71. Teague TK, Munn L, Zygourakis K, McIntyre BW. Analysis of lymphocyte activation and proliferation by video microscopy and digital imaging. Cytometry (1993) 14(7):772–825. doi: 10.1002/cyto.990140710
72. Iritani BM, Delrow J, Grandori C, Gomez I, Klacking M, Carlos LS, et al. Modulation of T-lyphocyte development, growth and cell size by the myc antagonist and transcriptional repressor Mad1. Eur Mol Biol Organ (2002) 21(18):4820–305. doi: 10.1093/emboj/cdf492
73. Rathmell JC, Elstrom RL, Cinalli RM, Thompson CB. Activated akt promotes increased resting T cell size, CD28-independent T cell growth, and development of autoimmunity and lymphoma. Eur J Immunol (2003) 33(8):2223–325. doi: 10.1002/eji.200324048
74. Pearce EL. Metabolism in T cell activation and differentiation. Curr Opin Immunol (2010) 22(3):314–20. doi: 10.1016/j.coi.2010.01.018
75. Maeda-Yorita K, Aki K. Effect of nicotinamide adenine potentials dinucleotide of lipoamide on the dehydrogenase from pig heart. J Biochem (1984) 96(3):683–905. doi: 10.1093/oxfordjournals.jbchem.a134886
76. Schroeder AB, Pointer KB, Clark PA, Datta R, Kuo JS, Eliceiri KW. Metabolic mapping of glioblastoma stem cells reveals NADH fluxes associated with glioblastoma phenotype and survival. J Biomed Optics (2020) 25(03):15. doi: 10.1117/1.jbo.25.3.036502
77. Cao Y, Rathmell JC, Macintyre AN. Metabolic reprogramming towards aerobic glycolysis correlates with greater proliferative ability and resistance to metabolic inhibition in CD8 versus CD4 T cells. PloS One (2014) 9(8):1–155. doi: 10.1371/journal.pone.0104104
78. Klein Geltink RI, Kyle RL, Pearce EL. Unraveling the complex interplay between T cell metabolism and function. Annu Rev Immunol (2018) 36(1):461–885. doi: 10.1146/annurev-immunol-042617-053019
79. Cham CM, Driessens G, O’Keefe JP, Gajewski TF. Glucose deprivation inhibits multiple key gene expression events and effector functions in CD8+ T cells. Eur J Immunol (2008) 38(9):2438–505. doi: 10.1002/eji.200838289
80. Palmer CS, Hussain T, Duette G, Weller TJ, Ostrowski M, Sada-Ovalle I, et al. Regulators of glucose metabolism in CD4+ and CD8+ T cells. Int Rev Immunol (2016) 35(6):477–885. doi: 10.3109/08830185.2015.1082178
81. Kumar A, Pyaram K, L. Yarosz E, Hong H, Lyssiotis CA, Giri S, et al. Enhanced oxidative phosphorylation in NKT cells is essential for their survival and function. Proc Natl Acad Sci USA (2019) 116(15):7439–485. doi: 10.1073/pnas.1901376116
82. Liu X, Li L, Si F, Huang L, Zhao Y, Zhang C, et al. NK and NKT cells have distinct properties and functions in cancer. Oncogene (2021) 40(27):4521–375. doi: 10.1038/s41388-021-01880-9
83. Skala MC, Fontanella A, Lan L, Izatt JA, Dewhirst MW. Longitudinal optical imaging of tumor metabolism and hemodynamics. J Biomed Optics (2010) 15(1):0111125. doi: 10.1117/1.3285584
84. Lyssiotis CA, Kimmelman AC. Metabolic interactions in the tumor microenvironment. Trends Cell Biol (2017) 27(11):863–755. doi: 10.1016/j.tcb.2017.06.003
85. Kumar S, Sharife H, Kreisel T, Mogilevsky M, Bar-Lev L, Grunewald M, et al. Intra-tumoral metabolic zonation and resultant phenotypic diversification are dictated by blood vessel proximity. Cell Metab (2019) 30(1):201–211.e6. doi: 10.1016/j.cmet.2019.04.003
86. Haas R, Smith J, Rocher-Ros V, Nadkarni S, Montero-Melendez T, Acquisto FD’, et al. Lactate regulates metabolic and proinflammatory circuits in control of T cell migration and effector functions. PloS Biol (2015) 13(7):1–24. doi: 10.1371/journal.pbio.1002202
87. Guerra L, Bonetti L, Dirk B. Metabolic modulation of immunity: A new concept in cancer immunotherapy. Cell Rep (2020) 32(1):1078485. doi: 10.1016/j.celrep.2020.107848
88. Leone RD, Zhao L, Englert JM, Sun IM, Oh MH, Sun IH, et al. Glutamine blockade induces divergent metabolic programs to overcome tumor immune evasion. Science (2019) 366(6468):1013–21. doi: 10.1126/science.aav2588
89. Ma EH, Verway MJ, Johnson RM, Roy DG, Steadman M, Hayes S, et al. Metabolic profiling using stable isotope tracing reveals distinct patterns of glucose utilization by physiologically activated CD8+ T cells. Immunity (2019) 51(5):856–70.e5. doi: 10.1016/j.immuni.2019.09.003
90. Sullivan MR, Danai LV, Lewis CA, Chan SH, Dan Y. G, Kunchok T, et al. Quantification of microenvironmental metabolites in murine cancers reveals determinants of tumor nutrient availability. ELife (2019) 8:1–27. doi: 10.7554/eLife.44235
Keywords: intravital imaging, immune cells, melanoma, metabolism, murine models, multiphoton/two-photon imaging, autofluorescence
Citation: Heaton AR, Rehani PR, Hoefges A, Lopez AF, Erbe AK, Sondel PM and Skala MC (2023) Single cell metabolic imaging of tumor and immune cells in vivo in melanoma bearing mice. Front. Oncol. 13:1110503. doi: 10.3389/fonc.2023.1110503
Received: 28 November 2022; Accepted: 02 March 2023;
Published: 20 March 2023.
Edited by:
Narasimhan Rajaram, University of Arkansas, United StatesReviewed by:
Chiara Stringari, Délégation Ile-de-France Sud (CNRS), FranceCaigang Zhu, University of Kentucky, United States
Suman Ranjit, Georgetown University, United States
Copyright © 2023 Heaton, Rehani, Hoefges, Lopez, Erbe, Sondel and Skala. This is an open-access article distributed under the terms of the Creative Commons Attribution License (CC BY). The use, distribution or reproduction in other forums is permitted, provided the original author(s) and the copyright owner(s) are credited and that the original publication in this journal is cited, in accordance with accepted academic practice. No use, distribution or reproduction is permitted which does not comply with these terms.
*Correspondence: Melissa C. Skala, bWNza2FsYUB3aXNjLmVkdQ==; Paul M. Sondel, cG1zb25kZWxAaHVtb25jLndpc2MuZWR1