 Qiang Wang1†
 Xiaorui Zhang2†
 Yuxin Zhong3Shijing Wei1Li Li4
 Wenqiang Wei5
 Fen Liu2
 Yong Li6,7*
 Shaoming Wang5*
- 1Department of Anesthesiology, National Cancer Center/National Clinical Research Center for Cancer/Cancer Hospital, Chinese Academy of Medical Sciences and Peking Union Medical College, Beijing, China
- 2Department of Epidemiology and Biostatistics, School of Public Health, Capital Medical University, Beijing, China
- 3Department of Pancreatic and Gastric Surgery, National Cancer Center/National Clinical Research Center for Cancer/Cancer Hospital, Chinese Academy of Medical Sciences and Peking Union Medical College, Beijing, China
- 4Medical Records Department, National Cancer Center/National Clinical Research Center for Cancer/Cancer Hospital, Chinese Academy of Medical Sciences and Peking Union Medical College, Beijing, China
- 5National Central Cancer Registry, National Cancer Center/National Clinical Research Center for Cancer/Cancer Hospital, Chinese Academy of Medical Sciences and Peking Union Medical College, Beijing, China
- 6Department of Thoracic Surgery, National Cancer Center/National Clinical Research Center for Cancer/Cancer Hospital, Chinese Academy of Medical Sciences and Peking Union Medical College, Beijing, China
- 7Department of Thoracic Surgery, National Cancer Center/National Clinical Research Center for Cancer/Hebei Cancer Hospital, Chinese Academy of Medical Sciences, Langfang, China
Purpose: This analysis aimed to investigate the clinical characteristics and changing trajectories of gastric cancer (GC) and esophageal cancer (EC).
Methods: We collected data from a large cancer hospital in Beijing, China, from 2010 to 2019. Joinpoint regression was used to analyze the trends of histological characteristics and comorbidities.
Results: From 2010 to 2019, there were a total of 10,083 EC patients and 14,244 GC patients. Patients were mainly men and diagnosed at 55-64 years old. Metabolic comorbidity was the most common comorbidity, with hypertension being predominant. The percentages of stage I showed significant increases for EC [average annual percent change (AAPC): 10.5%] and GC (AAPC: 9.7%) patients. We also observed an increasing trend of EC and GC patients over 65 years old. For EC patients, esophageal squamous cell carcinoma (93.1%) remained as the prioritized subtype, and the middle third of the esophagus was the most common site. EC patients with three or more comorbidities increased from 0.1% to 2.2% (AAPC, 27.7%; 95% CI, 14.7% to 42.2%). For GC patients, adenocarcinoma accounts for 86.9% of the total cases, and cardia was the most common site. The ulcerative comorbidity rate decreased from 2.0% to 1.2% (AAPC, −6.1%; 95% CI, −11.6% to −0.3%).
Conclusion: ESCC remained as the prioritized histological subtype, and the middle third of the esophagus was the most common site of EC. The majority of GC patients had adenocarcinoma, and the cardia was the most common site. There was an increasing trend of patients diagnosed at stage I. These findings provide scientific evidence to guide future treatment.
1 Introduction
Esophageal cancer (EC) and gastric cancer (GC) are common malignant tumors of the digestive tract. According to estimates from GLOBOCAN in 2020, EC and GC rank as the fifth and seventh most common cancers. Worldwide, an estimated 1.7 million new cancer cases and almost 1.3 million cancer deaths of EC and GC occurred in 2020 (1). Due to their close anatomical location, EC and GC share some common risk factors and epidemiological characteristics. Meanwhile, the screening method for upper gastrointestinal tract cancer (UGIC), including EC and GC, is endoscopic examination in China (2). Both EC and GC can be screened by a single endoscopic examination. In addition, EC and GC also demonstrate histological heterogeneity and have various histologic features (3–5). Esophageal squamous cell carcinoma (ESCC) and esophageal adenocarcinoma (EAC) are the most common histological subtypes of EC. The common subsite of EC was classified as the upper, middle, and lower third of the esophagus. Approximately 90% of GCs are adenocarcinomas, and GC can be subdivided into two main subsites: gastric cardia cancer (GCC) and gastric non-cardia cancer (GNCC). In addition, patients with EC or GC often have one or more comorbidities. The presence of comorbidities increases the disease burden and influences the prevention, detection, treatment decisions, and outcomes (6, 7).
Given the heavy disease burden associated with EC and GC, the Chinese government has launched some screening programs, including two cancer screening and early detection programs in rural areas in 2005 and 2007, respectively, and the Cancer Screening Programs in Urban China launched in 2012 (8). Over the past decade, marked advances have been made in the Chinese cancer prevention and control of EC and GC (9). However, cancer remains a heavy burden in China, and the new EC and GC cases in China account for 53.7% and 43.9% of the world’s new cases, respectively (1).
Although the need to understand the clinical characteristics of EC and GC is well recognized, research conducted on the trajectories of histologic subtypes, subsites, and comorbidity patterns in patients with EC or GC is still limited. To improve the diagnosis and treatment of EC and GC, clinical and pathological characteristics such as histologic subtypes, subsites, and comorbidity patterns need to be considered. This analysis aimed to assess the long-term changing trajectories of EC and GC overall and by sex, age group, histological subtypes, subsites, and comorbidity patterns. The identified changing trajectories in our analysis may help us understand the changing trends and the underlying etiological mechanisms and provide scientific data support for the current cancer diagnosis and treatment in China.
2 Materials and methods
2.1 Study design and participants
We collected clinical and pathological data from inpatients with EC or GC from the Cancer Hospital, Chinese Academy of Medical Sciences in Beijing, China, from 2010 to 2019, which is the largest cancer hospital in Asia, and enrolled patients across China. Patients with double cancer of EC or GC were included in the analysis for gastric and esophageal cancers. We used the 10th edition of the International Classification of Diseases (ICD-10) for case identification: esophageal cancer (C15.0–C15.5, C15.8–C15.9) and gastric cancer (C16.0–C16.6, C16.8–C16.9). If the site classification was not in the ICD-10 code, it was not included in the analysis. Cases with missing information on the year of diagnosis or age at diagnosis were excluded. Our final analytic sample included 10,083 EC patients and 14,244 GC patients. The study was approved by the Institutional Review Board of the Cancer Hospital, Chinese Academy of Medical Sciences (Ethical approval number: 20/386-2582, Supplementary File 1).
2.2 Data extraction
We extracted individual patient-level and tumor-related data for all cases. Patient-level data included their age at diagnosis (<55, 55–64, ≥65 years), sex, year of diagnosis, and the type of comorbidities. Tumor-related data included the stage of cancer at diagnosis, cancer subsites, and histologic subtypes. The comorbidity patterns were classified according to the type of comorbidities, including ulcerative comorbidities, inflammatory comorbidities, metabolic comorbidities, and polyp comorbidities. Ulcerative comorbidities include duodenal and gastric ulcer. Inflammatory comorbidities include ulcerative colitis, appendicitis, atrophic gastritis, and gastritis. Metabolic comorbidities include hypercholesterolemia, hypertension, hyperlipidemia, and diabetes. Polyp comorbidities include intestinal polyps, esophageal polyps, and gastric polyps. The cancer stages were reclassified according to the Tumor–Node–Metastasis staging system (7th edition) maintained by the American Joint Committee on Cancer (AJCC). Cancer subsites and histologic subtypes were identified by ICD-10. GCC was defined with site code C16.0, which presented the cardioesophageal, esophagogastric, and gastroesophageal junctions. GNCC was classified with site codes C16.1–C16.9.
2.3 Statistical analysis
The distribution of clinical and pathological data was examined overall and by age groups (<55, 55–64, and ≥65 years). Categorical variables were expressed by number and (percentage per group), and the difference was assessed with the χ2 test. We further analyzed the trends of histological subtypes, subsites, and comorbidity patterns using the joinpoint regression analysis. The joinpoint regression analysis was performed using Open Source software version 4.9.1.0. The independent variable was the year. The inflection point of time grouping was selected according to the distribution of data. The dependent variables were percentages per year for cancer stages, histological subtypes, subsites, and comorbidity patterns. The maximum number of joinpoints was predefined based on the number of data points (10). Linear segmented regression analysis was utilized for the model, and log transformation of the data was performed to determine the annual percentage change in the slope along with 95% CI.
To assess the robustness of the results, sensitivity analyses were conducted. We excluded patients with unclear or missing stage information. Furthermore, sensitivity analysis was performed to explore whether trends of stage change varied by age (<55, 55–64, and ≥65 years) and sex.
Analyses were performed using R (version 4.1.1) and GraphPad Prism 9 software. All statistical tests were two-sided, with significance defined as P <0.05.
3 Results
3.1 Clinical characteristics of EC and GC patients
There were 10,083 EC patients and 14,244 GC patients during 2010–2019. Tables 1, 2 show the clinical characteristics of EC and GC patients. Cancer patients were mainly men [EC: 8,432 (83.6%); GC: 10,455 (73.4%)], diagnosed at the age group of 55-64 years [EC: 4,154 (41.2%); GC: 5,245 (36.8%)], and diagnosed at stages III (EC: 3,597 [35.7%]; GC: 4,180 [29.3%]). The most common comorbidity was hypertension [EC: 2,714 (26.9%); GC: 2,939 (20.6%)] (Table S1). For EC patients, the middle third of the esophagus was the most common site [3,429 (34.0%)], and the most common histological subtype was ESCC [9,392 (93.1%)]. For GC patients, cardia was the most common site accounting for 28.9% of the 14,244 cases followed by the gastric antrum [3,737 (26.2%)]. Gastric adenocarcinoma (GA) was the most common histological subtype [12,381 (86.9%)].
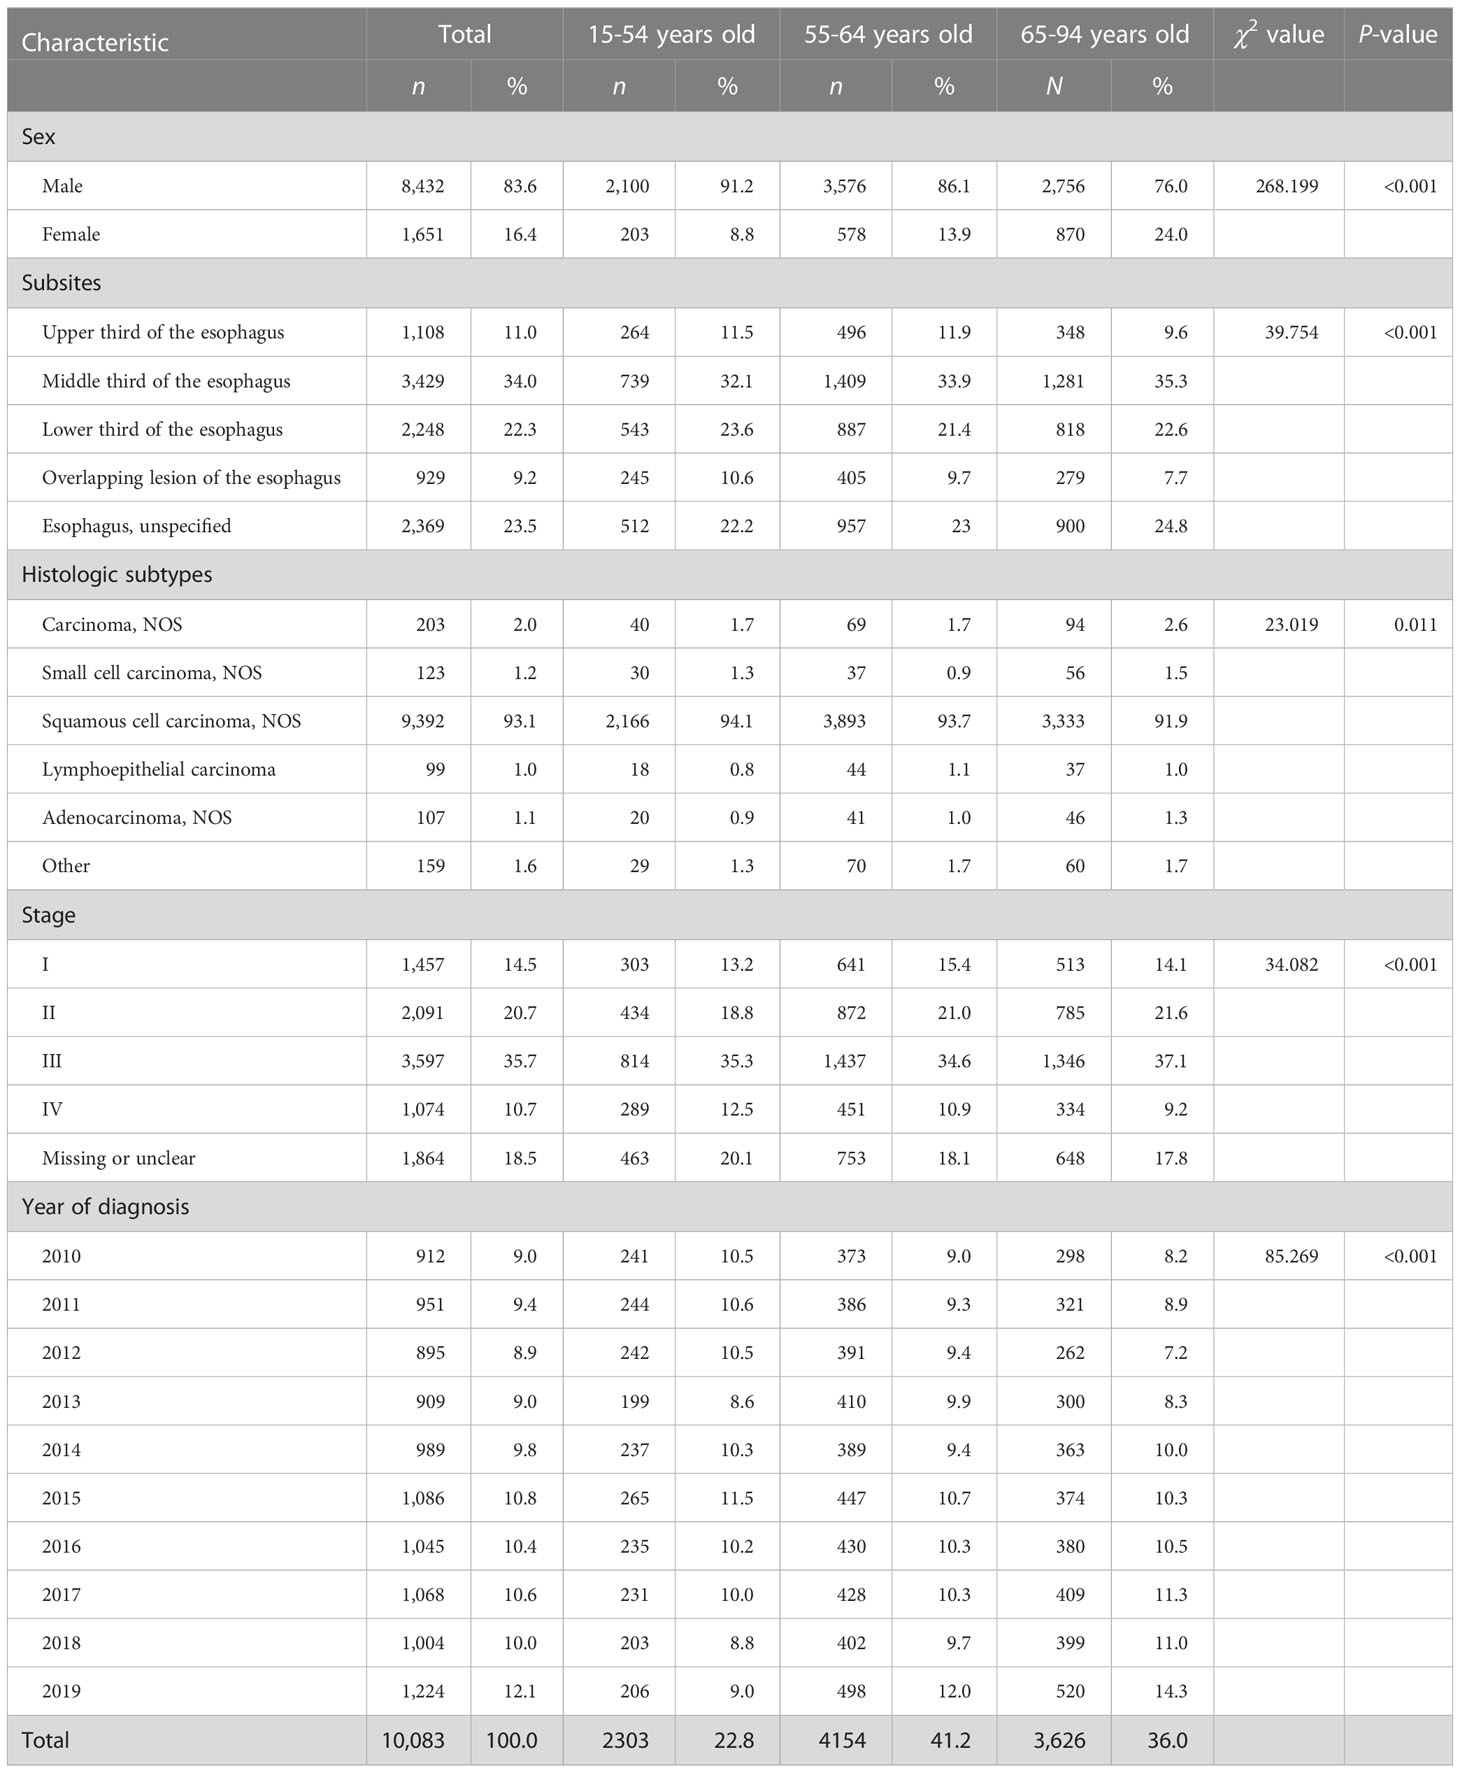
Table 1 Demographics and clinicopathological characteristics of esophageal cancer patients.

Table 2 Demographics and clinicopathological characteristics of gastric cancer patients.
3.2 Changing trajectories of sex and age in EC and GC patients
As shown in Tables 3, 4, we found an overall stable trend in the distributions of sex of EC and GC patients from 2010 to 2019. An increasing trend of percentages of patients over 65 years old was observed for EC [average annual percent change (AAPC), 3.2%; 95% CI, 1.9% to 4.5%] and GC (AAPC, 2.3%; 95% CI, 1.0% to 3.6%).
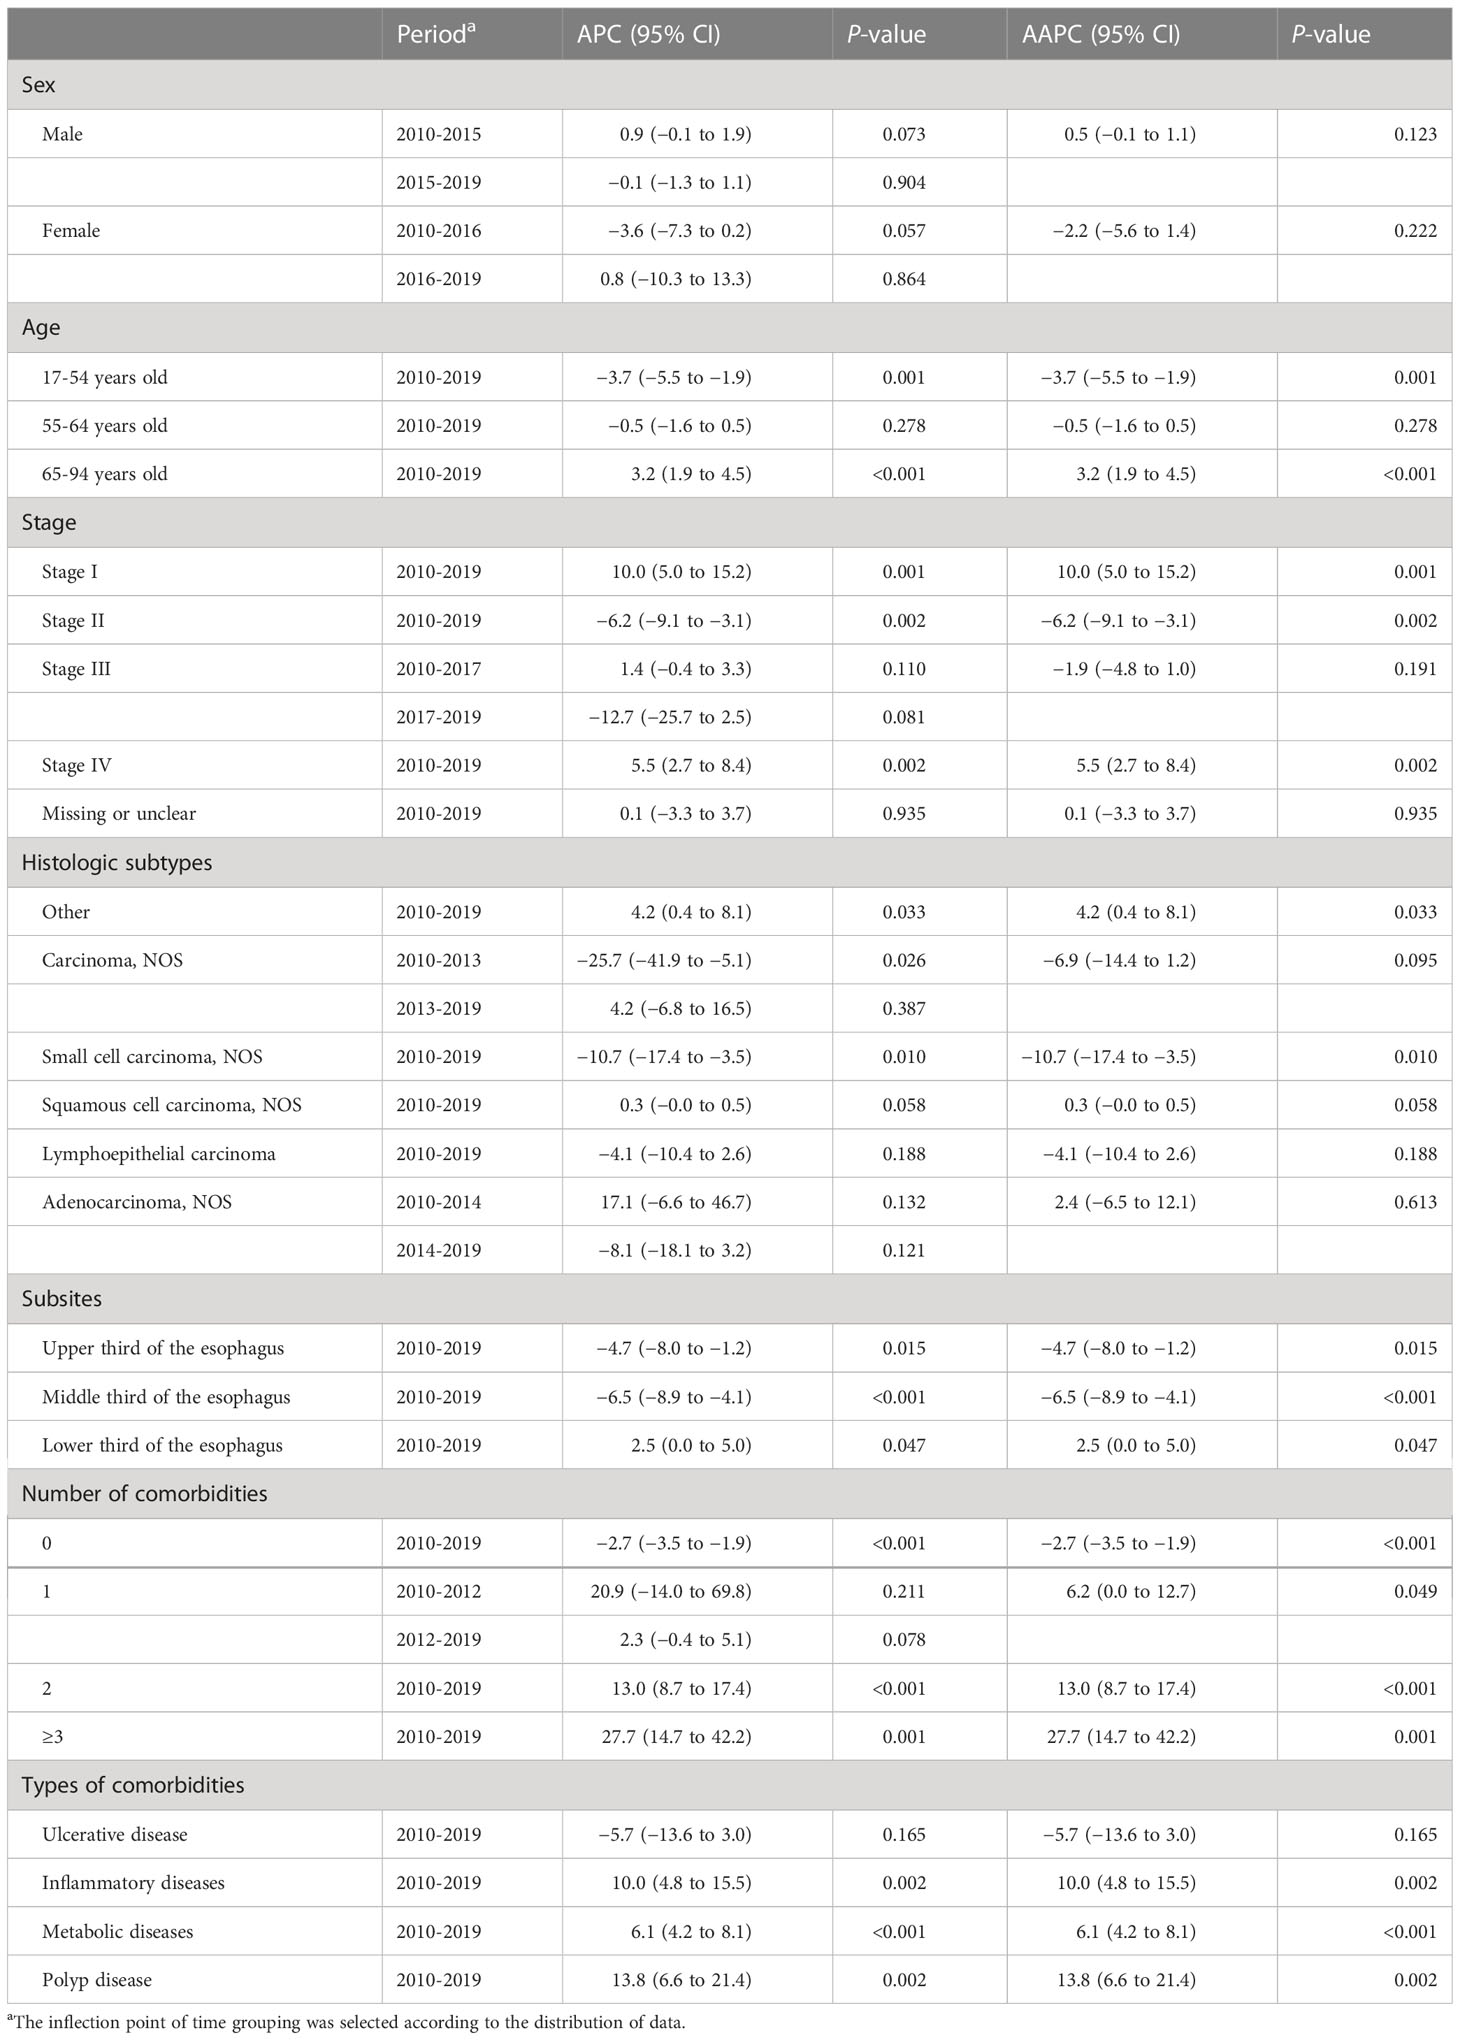
Table 3 Joinpoint average percent change (APC), average annual percent change (AAPC), and 95% confidence intervals (CI) for the clinical characteristics of esophageal cancer patients, 2010–2019.
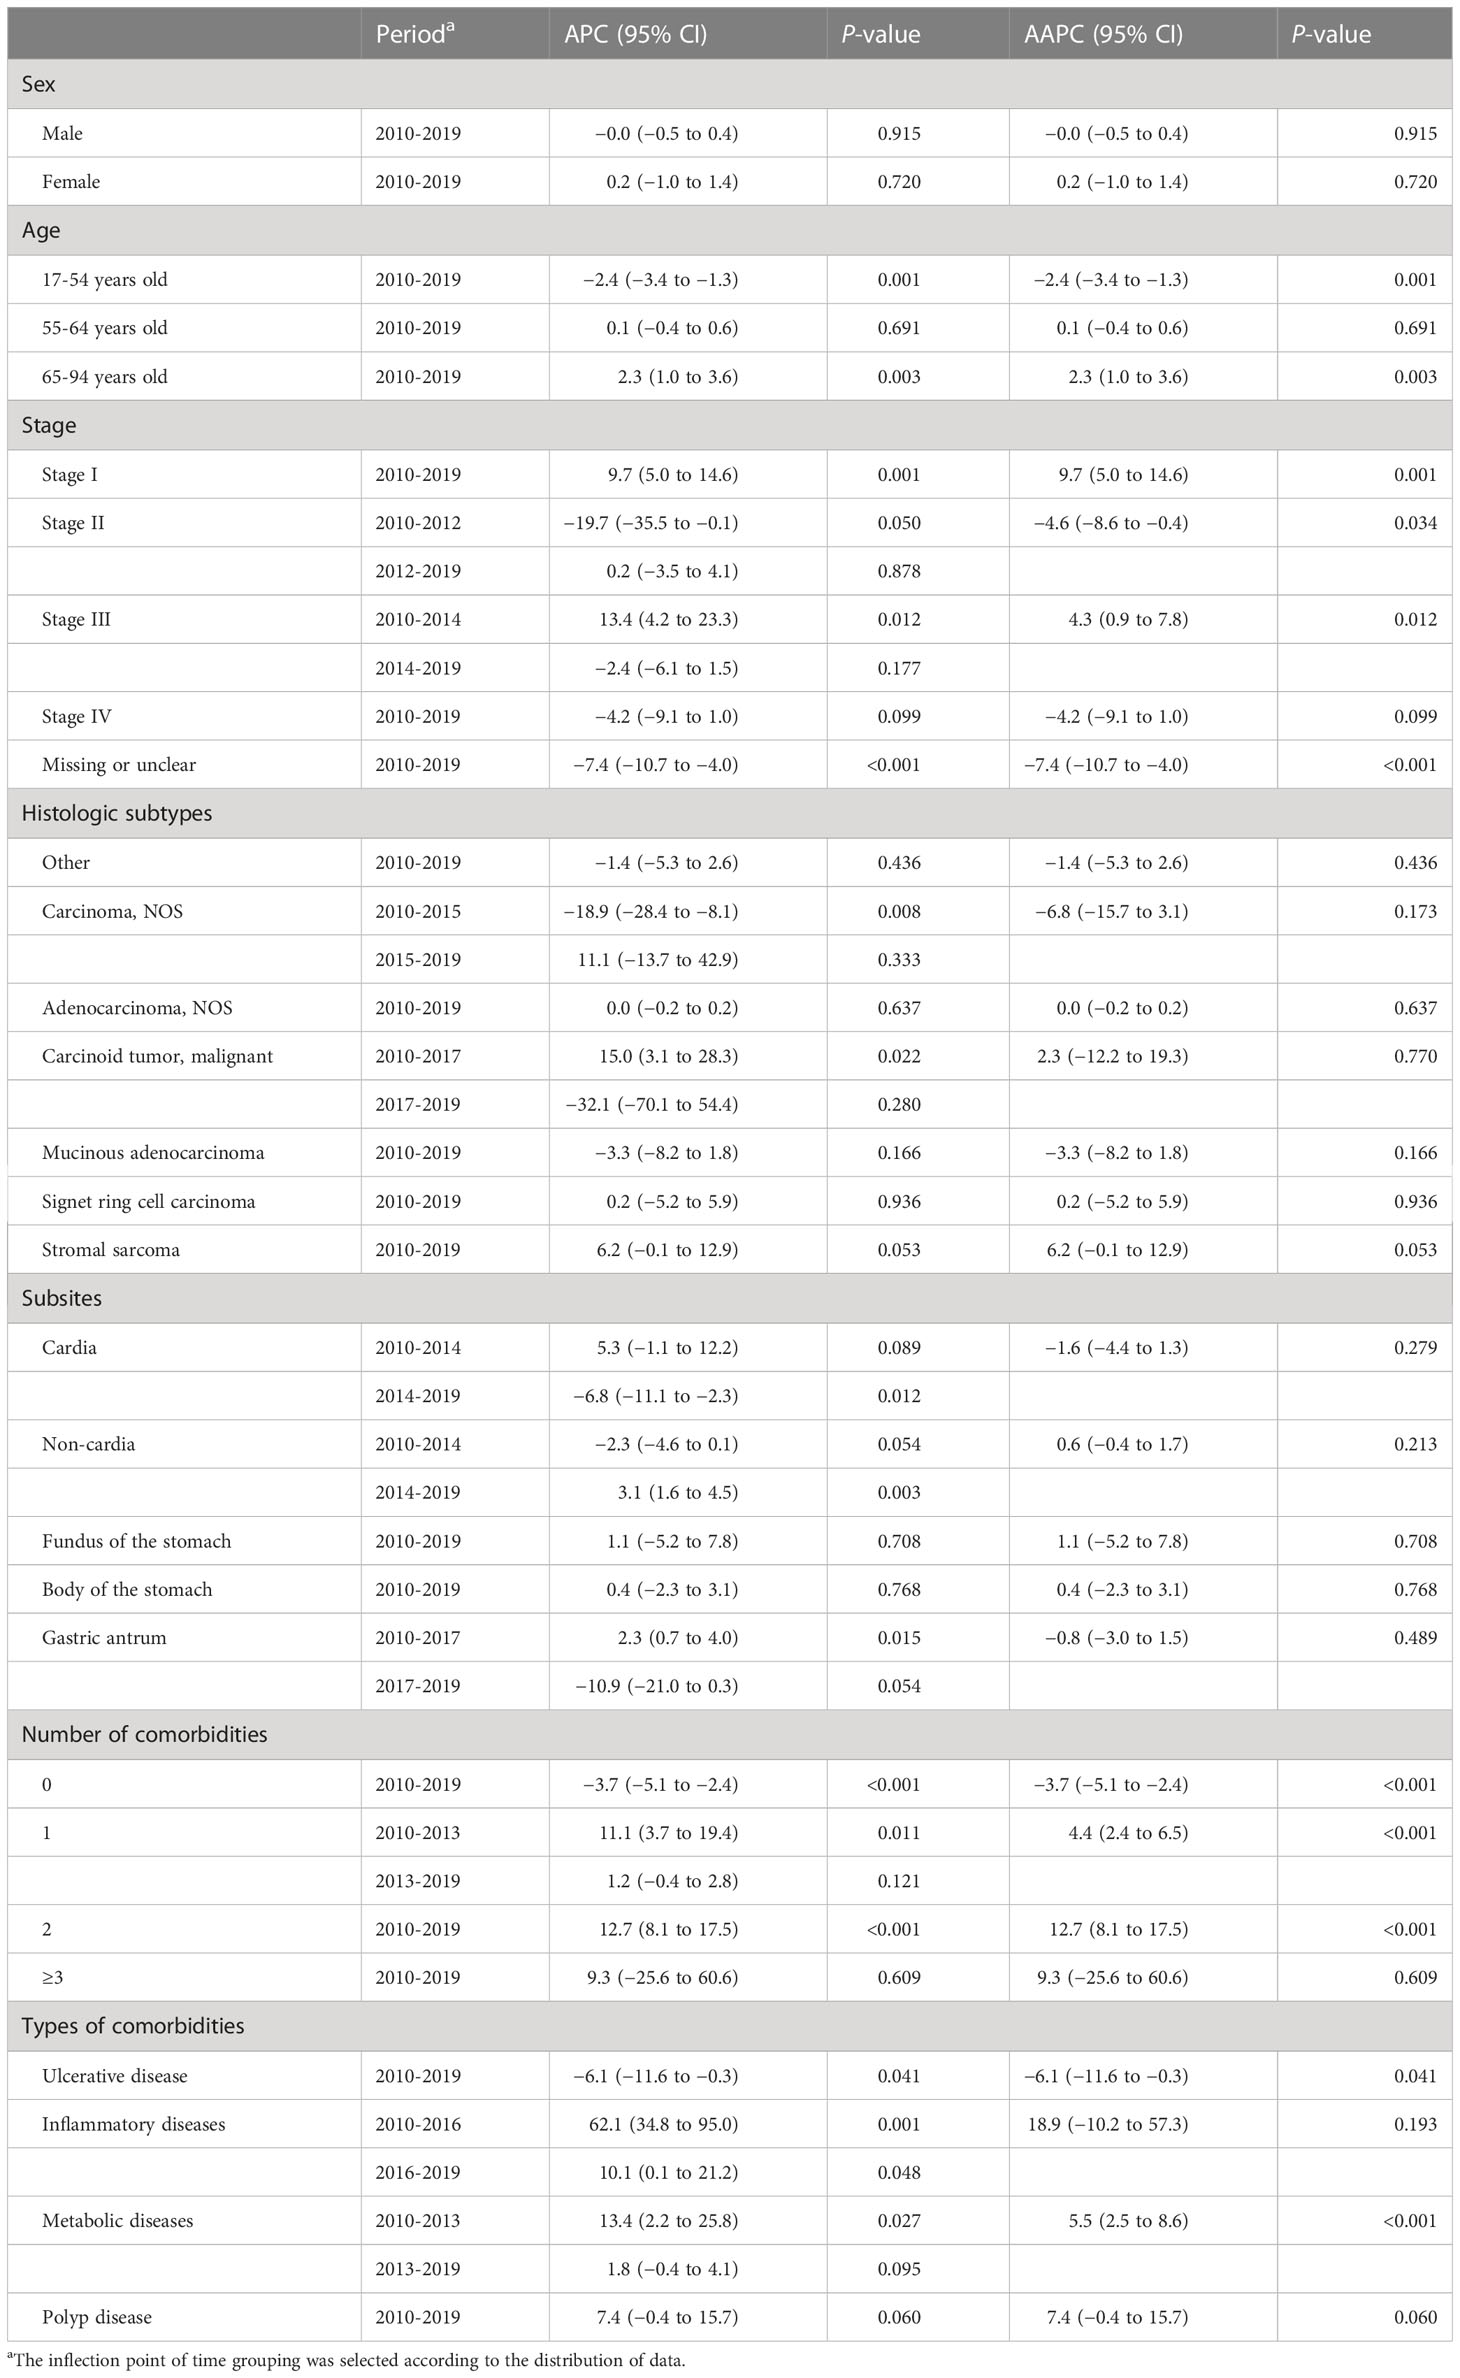
Table 4 Joinpoint average percent change (APC), average annual percent change (AAPC), and 95% confidence intervals (CI) for the clinical characteristics of gastric cancer patients, 2010–2019.
3.3 Changing trajectories of stage in EC and GC patients
For EC patients, stage-specific comparisons revealed significant increases in the percentages of stage I or stage IV (AAPC for stage I, 10.5%; 95% CI, 5.0% to 15.2%; stage IV, 5.5%; 95% CI, 2.7% to 8.4%), while the percentages of stage II decreased from 2010 to 2019 (AAPC, −6.2%; 95% CI, −9.1% to −3.1%) (Table 3, Figure 1A). The identified stage-changing trajectories significantly varied by age and sex (Tables S2, S3). We found that the percentages of stage IV showed significant increases in men and in the age group of 55-64 years.

Figure 1 Stage distribution for all cancers from 2010 to 2019: (A) esophageal cancer and (B) gastric cancer.
For GC patients, there were significant increases in the percentages of stage I and III cases from 2010 to 2019 (AAPC for stage I, 9.7%; 95% CI, 5.0% to 14.6%; stage III, 4.3%; 95% CI, 0.9% to 7.8%). However, we observed a decreasing trend of percentages in GC patients diagnosed at stage II (AAPC, −4.6%; 95% CI, −8.6% to −0.4%) (Table 4, Figure 1B). Further analyses on the trends of age- and sex-specific percentages of stage for GC patients are shown in Tables S2, S3. Significant increasing trends were found in women and under the age of 55 with stage III.
The results of the sensitivity analysis were similar to those of the main analysis (Figure S1, Tables S4–S7). But we also observed significantly decreased trends of percentages in GC patients with stage IV by age (<55, 55–64, and ≥65 years) and sex.
3.4 Changing trajectories of comorbidity patterns in EC and GC patients
There has been an increase in EC patients with comorbidities from 2010 to 2019 (Figures S2A, B), and the patients with three or more comorbidities increased from 0.1% to 2.2% (AAPC, 27.7%; 95% CI, 14.7% to 42.2%) (Table 3). Further analyses on the trends of comorbidity patterns are shown in Table 3. The inflammatory comorbidity rate for EC patients increased from 1.6% in 2010 to 6.7% in 2019 (AAPC, 10.0%; 95% CI, 4.8% to 15.5%). The metabolic comorbidity rate increased from 18.0% to 35.9%, with a marked increase since 2010 (AAPC, 6.1%; 95% CI, 4.2% to 8.1%). The polyp comorbidity rate increased from 0.2% in 2010 to 1.4% in 2019 (AAPC, 13.8%; 95% CI, 6.6% to 21.4%). Metabolic and inflammatory comorbidities showed the same trends in different age groups (Table S8).
The percentages of GC patients with comorbidities also showed an increasing trend (Figures S2, D), and the trends of patients with one or two comorbidities had statistical significance (AAPC for one comorbidity, 4.4%; 95% CI, 2.4% to 6.5%; two comorbidities, 12.7%; 95% CI, 8.1% to 17.5%). For comorbidity patterns, the metabolic comorbidity rate increased from 18.8% to 30.1% (AAPC, 5.5%; 95% CI, 2.5% to 8.6%). The ulcerative comorbidity rate decreased from 2.0% to 1.2% (AAPC, −6.1%; 95% CI, −11.6% to −0.3%) (Table 4). Ulcerative comorbidity showed different trends in age groups, with the rate decreasing in patients over 65 years old but not in other age groups (Table S8).
3.5 Changing trajectories of histological subtypes and subsites in EC patients
The trends of EC cancer histological subtypes and subsites are shown in Figures 2A, B. We found overall stable trends of the distributions of ESCC (AAPC, 0.3%; 95% CI, −0.0% to 0.5%) and EAC (AAPC, 2.4%; 95% CI, −6.5% to 12.1%) from 2010 to 2019 (Table 3). The trends of histological subtypes varied by age (Table S9). We found a slight upward trend of percentages in ESCC patients over 65 years old. In addition, we investigated the trends of EC cancer histological subtypes by stage and found that the percentages of ESCC showed an increase in stage I and stage IV (Table S10).
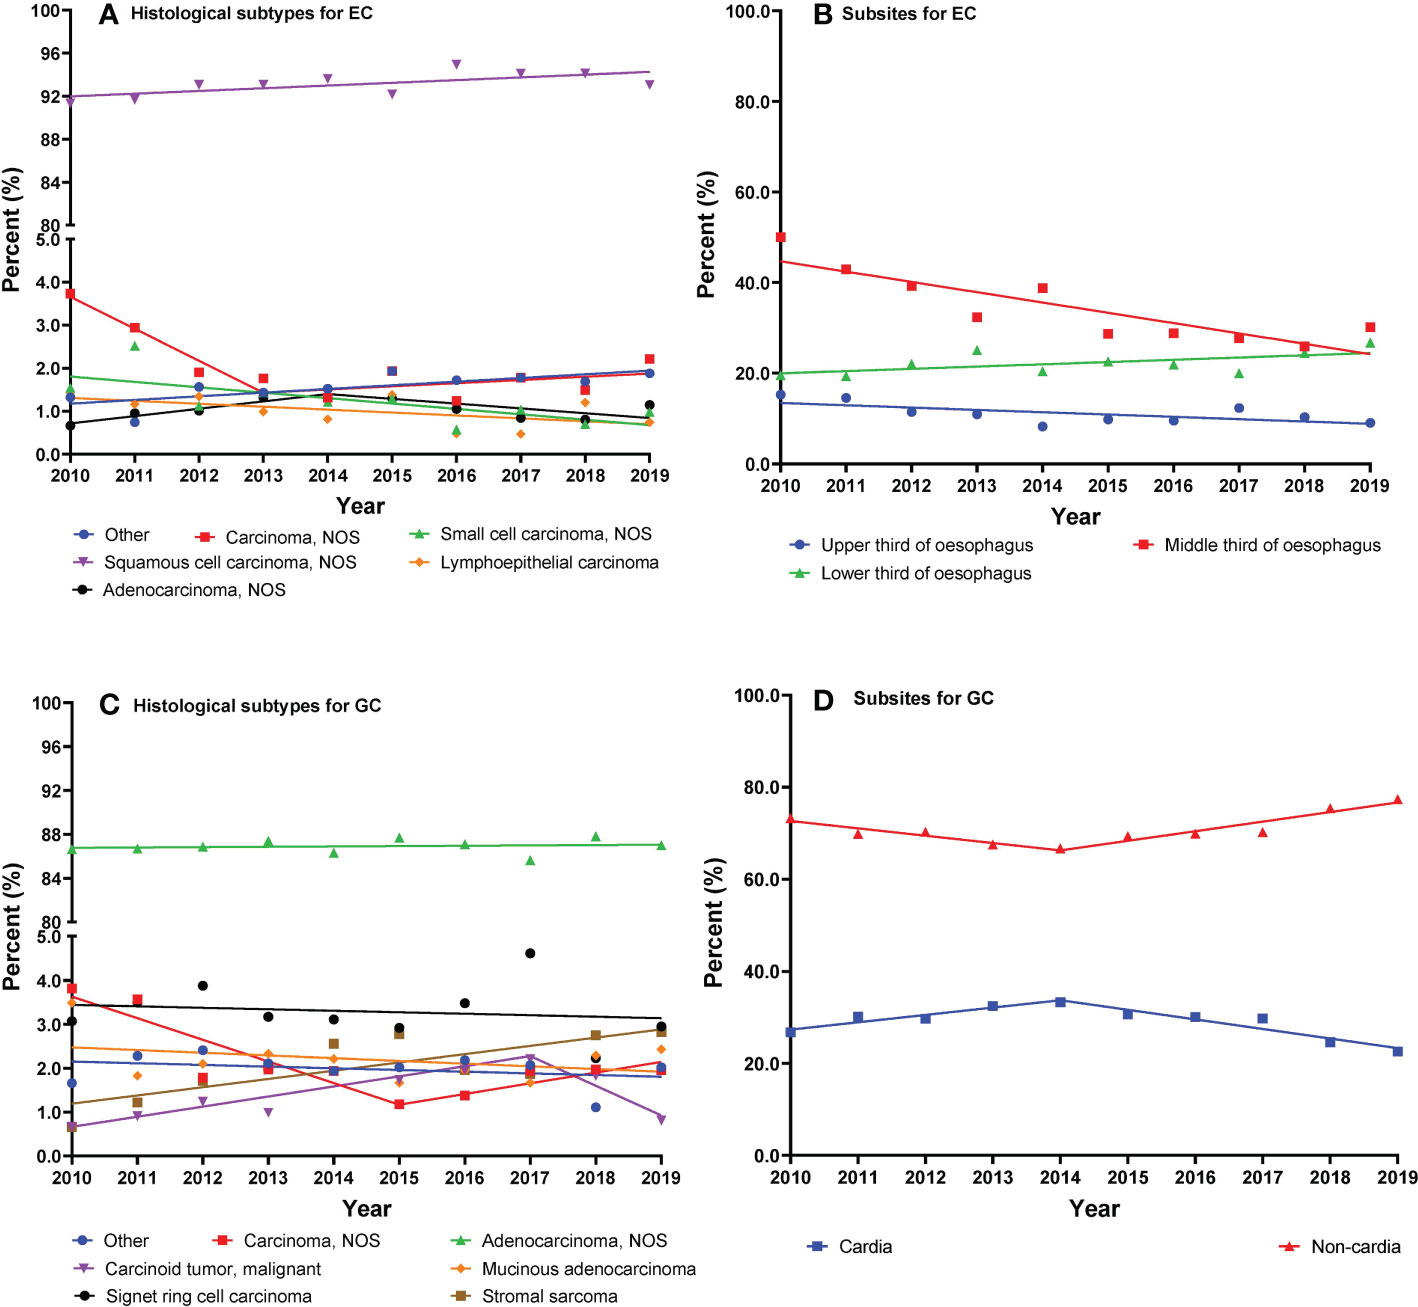
Figure 2 (A–D) Trajectories of cancer histological subtypes or subsites (lines are modeled by segmental line regression and points represent actual data).
As shown in Table 3, we observed a decreasing trend of the middle third of the esophagus from 2010 to 2019 (AAPC, −6.5%; 95% CI, −8.9% to −4.1%). Moreover, the percentages of the lower third of the esophagus showed an increasing trend (AAPC, 2.5%; 95% CI, 0.0% to 5.0%). We investigated the trends of EC subsites by category of sex (Table S11). The percentage of the middle third of the esophagus decreased in both men and women. However, the percentages of the lower third of the esophagus increased in men and remained stable in women.
3.6 Changing trajectories of histological subtypes and subsites in GC patients
The trends of GC cancer histological subtypes and subsites are shown in Figures 2C, D. The percentages of GA showed a stable trend from 2010 to 2019 (AAPC, 0.0%; 95% CI, −0.2% to 0.2%) (Table 4). We present the trends of histological subtypes by category of age groups (Table S8). GA showed a significant decrease in younger patients from 2010 to 2017 and a stable trend from 2017 to 2019. Conversely, a significant increase of GA in elderly patients was observed from 2010 to 2016, after which the percentages remained stable from 2016 to 2019. We observed an increasing trend of gastric stromal sarcoma in elderly patients from 2010 to 2019. In addition, we investigated the trends of GC cancer histological subtypes by stage and found that the percentages of GA showed an increase in stage I but a decrease in stage IV (Table S12).
As shown in Table 4, we observed that the percentages of GCC decreased from 33.3% in 2014 to 22.6% in 2019 (APC, −6.8%; 95% CI, −11.1% to −2.3%). We investigated the changing trends of subsites of GC by sex (Table S11). The percentages of GCC have significantly decreased in men from 2014 to 2019 and in women from 2012 to 2019.
4 Discussion
In this analysis, we found that the majority of EC and GC patients were men and were diagnosed at 55-64 years old. An increasing trend of percentages of patients over 65 years old was observed. The most common comorbidity was metabolic comorbidity, with hypertension being predominant. Although an increasing trend in patients diagnosed at stage I was observed from 2010 to 2019, it was still lower than that of the later stage. We observed that the middle third of the esophagus was the most common site and ESCC remained as the prioritized histological subtype of EC in China. We found overall stable trends of the distributions in ESCC and EAC from 2010 to 2019, although ESCC specifically presented an increased trend in the proportion of patients diagnosed at stages I and IV. The majority of GC patients had adenocarcinoma, and cardia was the most common site.
4.1 Clinical characteristics of EC and GC patients
Similar to existing evidence, we found that most EC and GC patients were diagnosed at the age of 55-64 years (11). The upward trend in the age group over 65 has some reference significance for the current screening program. The guidelines in China recommended EC and GC screening in the population between the ages of 40 and 69 years, and the age limit in urban areas was expanded to 74 years old in 2016 (12). With the increase in life expectancy, the aggravation of population aging, and the changing of age composition of EC and GC patients, the screening age can be formulated according to the specific situation of the population in different regions, so as to allocate medical resources better.
We observed that EC and GC patients were mainly men, which was consistent with previous findings (1, 13–15). Stable patterns of sex differences were found in this analysis, with a ratio of approximately 5.0:1 for EC and 3.0:1 for GC. However, the male-to-female ratio for EC in our analysis was higher than the result of the study of Zeng et al. (2.9:1) (11), being attributed to the fact that we conducted our analysis involving a single center. Similar patterns of sex differences were reported with a significant male predominance of EC and GC and a stable incidence rate ratio for EC and GC from 2003 to 2012 (4).
As for the primary site, the middle third of the esophagus was the most common site of EC, consistent with the result of Hajmanoochehri et al. (16). The cardia was the most common site accounting for 28.9% of GC cases, which was in line with the results from the USA and Germany (17, 18). The Chinese guidelines for the early diagnosis and treatment of upper gastrointestinal cancer recommended taking biopsies from the abnormal parts of the esophageal mucosa, especially positive areas with iodine staining; if there are no positive areas, a mucosal biopsy is performed at any position 25 cm from the incisors. The guidelines also recommended taking biopsies from the cardia for GC. The distribution of subsites of EC and GC in this analysis was consistent with current guidelines (12). Moreover, these findings provide further evidence for the clinical diagnosis and treatment of EC and GC and that clinicians should pay more attention to these common subsites during endoscopic examination and clinical treatments.
In addition, our result explained that ESCC remained as the prioritized histological subtype of EC, which was consistent with previous findings in most of Asia and Sub-Saharan Africa (19, 20). For ESCC, the overall burden was concentrated in Asia, where more than 400,000 new cases occurred in the world. Over 50% of cases of ESCC were estimated in China alone (5). But in the USA and other Western countries, EAC is the major type of EC (19). For GC, the most common histological subtype was GA, which was consistent with international studies (21, 22). The GNCC case burden was high in Asia and also in South and Central America. The patterns for GCC were slightly different from GNCC, with the highest burden in Eastern Asia and parts of Oceania and Western Asia (5). Major risk factor differences may contribute to distinct geographic patterns (1, 23).
4.2 Changing trajectories of comorbidity patterns in EC and GC patients
There has been an increase in EC and GC patients with comorbidities from 2010 to 2019, which was consistent with previous findings (24, 25). In this analysis, an increasing trend of percentages of patients over 65 years old was observed for EC and GC. Previous studies have also found that the cancer incidence rate gradually increased among the older population (26). Population aging and increment in life expectancy have led to an increasing number of older patients, which may have contributed to the concurrent increase of patients with comorbidity (27). In addition, improvements in hospital registration systems may also be contributing to the increase in the number of complications. Existing studies have shown that the incidence of cancer is mainly attributable to environmental and lifestyle factors (28) and chronic infection (29). A new study suggests that the prevalence of gastrointestinal cancers is inversely associated with hypertension and diabetes (30). According to a study published in China, there was also a positive correlation between diabetes and the mortality of cancer (31). In this analysis, the most common comorbidity pattern was metabolic comorbidity, with hypertension being predominant. Previous studies also reported that metabolic comorbidity was the prioritized comorbidity pattern of EC and GC (6, 7). For EC patients, the polyp comorbidity rate increased from 2010 to 2019. Moreover, polyp comorbidity rate in EC patients increased from 2010 to 2019. Diagnostic improvements and screening programs could be responsible for this situation (25). For GC patients, the ulcerative comorbidity rate decreased from 2010 to 2019. In China, improvements in the treatment of gastric ulcers included the introduction of antibiotic treatment of pylorus in 1999 (32) and first-line ulcer therapy in 2007 (33).
4.3 Changing trajectories of stage in EC and GC patients
In terms of stage at diagnosis, we found that EC and GC cases were mainly diagnosed at stage III. This was also consistent with the result of Zeng et al. (11). The analysis by Zeng et al. was based on cross-sectional data, but our analysis described changing trajectories in stages based on longitudinal data. Stage-specific comparisons revealed significant increases in the percentages of EC patients diagnosed at stages I and IV from 2010 to 2019. Recent results from the Surveillance, Epidemiology, and End Results (SEER) data also showed an upward trend of the late stage for EC patients (34). For GC patients, there were significant increases in the percentages of stage I and III cases. Previous studies have also found that the percentage of stage I in GC patients increased gradually from 1998 to 2018 (35). The Chinese government has launched some screening programs. The endoscopic screening program for upper gastrointestinal cancer showed that a one-time endoscopic screening program was associated with a significant decrease in upper gastrointestinal cancer incidence and mortality (2). Another cancer screening program in urban areas covered 18 provinces and cities, including Beijing, where this study was conducted (36). Previous studies showed that early-stage cancer cases accounted for a higher proportion after endoscopy screening (37). The patients in this study came from Beijing, which is one of the urban cancer screening coverage areas, and patients across China were enrolled. Moreover, we did observe an increasing trend in the percentages of stage I in our analyses, which may be the result of a combination of factors, including screening and changes in risk factors.
4.4 Changing trajectories of histological subtypes and subsites in EC patients
We analyzed many details about the trends of the percentages of EC and found that ESCC and EAC showed stable trends from 2010 to 2019. A hospital-based analysis of EAC in Japan showed conflicting results. An increase in the percentages of EAC was reported from 2007 to 2014 (20). In this analysis, the percentages of ESCC showed a slight upward trend in patients over 65 years old from 2010 to 2019. According to the present Chinese guidelines on upper gastrointestinal cancer screening and surveillance, the target population is 40-69 years old (12). From this, the elderly population may need to be aware of cancer screening and diagnosis. Although the percentages of ESCC increased in the stage I and IV groups in this analysis, the most significant increase was in stage I, which may be due to the rising awareness of early treatment. We observed that EC of the middle third of the esophagus decreased from 2010 to 2019, and the percentages of the middle third of the esophagus have significantly decreased in both men and women. In a previous study, the percentages of the middle third of the esophagus showed an upward trend from 2006 to 2008 in high-risk areas of upper gastrointestinal cancer in China (38). The changes in the percentages of high and non-high incidence areas of EC may be different and need to be further explored.
4.5 Changing trajectories of histological subtypes and subsites in GC patients
We observed that the percentages of GCC decreased from 33.3% in 2014 to 22.6% in 2019. A hospital-based study in Japan had consistently reported that there was a decrease in the percentages of GCC from 2007 to 2015 (14). The percentages of GCC decreased from 2014 to 2019 in a hospital-based study, which may be due to treatment of a major environmental risk factor, such as the treatment of Helicobacter pylori. A previous study showed that H. pylori infection was a strong risk factor not only for GNCC but also for CGC in Chinese adults (23). The decreasing trend in GCC in this analysis contrasts with the results from Western countries, which may be due to GCC having a different etiologic background from different countries. Most studies in Europe, the USA, and Australia have reported either null or reduced risks of GCC associated with H. pylori infection (39, 40).
In this analysis, the percentages of gastric stromal sarcoma showed a significant upward trend in patients over 65 years old from 2010 to 2019. A previous study suggested that gastric stromal sarcoma is common in middle-aged and elderly men (41). Gastric stromal sarcoma is the most common gastrointestinal stromal tumor (GIST) (42). No environmental risk factors for gastric stromal sarcoma are currently known. Familial predisposition due to germline mutations of KIT or PDGFRA is the most common but a very rare known risk factor (42, 43). Future basic and experimental studies are required to help elucidate the underlying etiological mechanisms of gastric stromal sarcoma.
There are a few strengths associated with our analysis. We investigated the distributions of the histological subsites of EC and GC in China with over 24,000 cancer cases across 10 years. Secondly, the accurate and detailed information collected in this study enabled us to evaluate the 10-year changing trajectories for EC and GC overall and by sex, age group, histological subtypes, or subsites. Our study has several limitations. First, this is a single-center hospital-based study, which limited its generalizability to other populations. Further study is needed to include more hospitals covering different geographic regions and areas with various economic development levels. Secondly, the time span of this study is somewhat short, and some meaningful results may not have been obtained. Thirdly, we did not collect information on personal habits and survival outcomes; therefore, we were unable to evaluate these variables in our analysis.
In conclusion, we described the clinical characteristics and trends of esophageal and gastric cancer based on 10 years of longitudinal data. According to our results, EC and GC patients were mainly men and diagnosed in the age group of 55-64 years. Metabolic comorbidity predominates in EC and GC patients. Although we observed an increasing trend of the percentages of patients diagnosed at stage I from 2010 to 2019, most patients were still diagnosed at the late stage. The middle third of the esophagus and the cardia were the most common sites of EC and GC, respectively. Moreover, changing trajectories of comorbidity patterns could have influenced the decision to operate a patient. These findings provide scientific evidence to help us identify the high-risk population for cancer screening and guide future clinical diagnosis and treatment for EC and GC.
Data availability statement
The datasets presented in this article are not readily available because we collected the clinical and pathological data of inpatients with EC or GC from a large cancer hospital. These data cannot be shared without permission. Requests to access the datasets should be directed to d2FuZ3NoYW9taW5nQGNpY2Ftcy5hYy5jbg==.
Author contributions
SMW and YL gave substantial contributions to the conception or the design of the manuscript. QW and XZ were responsible for the data analysis and wrote the original draft. YZ and SJW revised the manuscript draft critically. LL and WW were responsible for the visualization. FL completed the data curation. SMW provided funding support. All authors contributed to the article and approved the submitted version.
Funding
This research was funded by grants from the Beijing Natural Science Foundation (Grant No. 7222153), Beijing Nova Program (No. Z201100006820069), Beijing Hope Run Special Fund of Cancer Foundation of China (LC2021A06), and CAMS Innovation Fund for Medical Sciences (CIFMS, grant number: 2021-I2M-1-023).
Conflict of interest
The authors declare that the research was conducted in the absence of any commercial or financial relationships that could be construed as a potential conflict of interest.
Publisher’s note
All claims expressed in this article are solely those of the authors and do not necessarily represent those of their affiliated organizations, or those of the publisher, the editors and the reviewers. Any product that may be evaluated in this article, or claim that may be made by its manufacturer, is not guaranteed or endorsed by the publisher.
Supplementary material
The Supplementary Material for this article can be found online at: https://www.frontiersin.org/articles/10.3389/fonc.2023.1126841/full#supplementary-material
References
1. Sung H, Ferlay J, Siegel RL, Laversanne M, Soerjomataram I, Jemal A, et al. Global cancer statistics 2020: GLOBOCAN estimates of incidence and mortality worldwide for 36 cancers in 185 countries. CA Cancer J Clin (2021) 71(3):209–49. doi: 10.3322/caac.21660
2. Chen R, Liu Y, Song G, Li B, Zhao D, Hua Z, et al. Effectiveness of one-time endoscopic screening programme in prevention of upper gastrointestinal cancer in China: a multicentre population-based cohort study. Gut (2021) 70(2):251–60. doi: 10.1136/gutjnl-2019-320200
3. Smyth EC, Lagergren J, Fitzgerald RC, Lordick F, Shah MA, Lagergren P, et al. Oesophageal cancer. Nat Rev Dis Primers (2017) 3:17048. doi: 10.1038/nrdp.2017.48
4. Wang S, Zheng R, Arnold M, Abnet C, Zeng H, Zhang S, et al. Global and national trends in the age-specific sex ratio of esophageal cancer and gastric cancer by subtype. Int J Cancer (2022) 151(9):1447–61. doi: 10.1002/ijc.34158
5. Arnold M, Ferlay J, van Berge Henegouwen MI, Soerjomataram I. Global burden of oesophageal and gastric cancer by histology and subsite in 2018. Gut (2020) 69(9):1564–71. doi: 10.1136/gutjnl-2020-321600
6. Faiz Z, van Putten M, Verhoeven RHA, van Sandick JW, Nieuwenhuijzen GAP, van der Sangen MJC, et al. Impact of age and comorbidity on choice and outcome of two different treatment options for patients with potentially curable esophageal cancer. Ann Surg Oncol (2019) 26(4):986–95. doi: 10.1245/s10434-019-07181-6
7. Koseki Y, Hikage M, Fujiya K, Kamiya S, Tanizawa Y, Bando E, et al. Utility of a modified age-adjusted charlson comorbidity index in predicting cause-specific survival among patients with gastric cancer. Eur J Surg Oncol (2021) 47(8):2010–5. doi: 10.1016/j.ejso.2021.01.026
8. Chen W, Li H, Zheng R, Ren J, Shi J, Cao M, et al. An initial screening strategy based on epidemiologic information in esophageal cancer screening: a prospective evaluation in a community-based cancer screening cohort in rural China. Gastrointest Endosc (2021) 93(1):110–8.e2. doi: 10.1016/j.gie.2020.05.052
9. Zeng H, Chen W, Zheng R, Zhang S, Ji JS, Zou X, et al. Changing cancer survival in China during 2003-15: a pooled analysis of 17 population-based cancer registries. Lancet Glob Health (2018) 6(5):e555–e67. doi: 10.1016/S2214-109X(18)30127-X
10. National Cancer Institute. Joinpoint trend analysis software (2020). Available at: https://surveillance.cancer.gov/help/joinpoint/setting-parameters/method-and-parameters-tab/number-of-joinpoints.
11. Zeng H, Ran X, An L, Zheng R, Zhang S, Ji JS, et al. Disparities in stage at diagnosis for five common cancers in China: a multicentre, hospital-based, observational study. Lancet Public Health (2021) 6(12):e877–e87. doi: 10.1016/S2468-2667(21)00157-2
12. National Health Commission of the People's Republic of China. Technical scheme for screening, early diagnosis and early treatment of upper gastrointestinal cancer (2019). Available at: http://www.gov.cn/zhengce/zhengceku/2019-11/19/5453477/files/21bbfeb04d3141e187777a63205e1a50.pdf.
13. Diers J, Baum P, Wagner JC, Matthes H, Pietryga S, Baumann N, et al. Hospital volume following major surgery for gastric cancer determines in-hospital mortality rate and failure to rescue: a nation-wide study based on German billing data (2009-2017). Gastric Cancer (2021) 24(4):959–69. doi: 10.1007/s10120-021-01167-8
14. Koizumi S, Motoyama S, Watanabe N, Matsuhashi T, Iijima K. Chronological changes in the gastric cancer subsite in akita, Japan: The trends from the data of a hospital-based registration system. Tohoku J Exp Med (2018) 246(2):131–40. doi: 10.1620/tjem.246.131
15. Yang S, Lin S, Li N, Deng Y, Wang M, Xiang D, et al. Burden, trends, and risk factors of esophageal cancer in China from 1990 to 2017: an up-to-date overview and comparison with those in Japan and south Korea. J Hematol Oncol (2020) 13(1):146. doi: 10.1186/s13045-020-00981-4
16. Hajmanoochehri F, Mohammadi N, Nasirian N, Hosseinkhani M. Patho-epidemiological features of esophageal and gastric cancers in an endemic region: a 20-year retrospective study. Asian Pac J Cancer Prev (2013) 14(6):3491–7. doi: 10.7314/apjcp.2013.14.6.3491
17. Lee E, Liu L, Zhang J, Stern MC, Barzi A, Hwang A, et al. Stomach cancer disparity among Korean americans by tumor characteristics: Comparison with non-Hispanic whites, Japanese americans, south koreans, and Japanese. Cancer Epidemiol Biomarkers Prev (2017) 26(4):587–96. doi: 10.1158/1055-9965.EPI-16-0573
18. Hiripi E, Jansen L, Gondos A, Emrich K, Holleczek B, Katalinic A, et al. Survival of stomach and esophagus cancer patients in Germany in the early 21st century. Acta Oncol (2012) 51(7):906–14. doi: 10.3109/0284186X.2012.673732
19. Abnet CC, Arnold M, Wei WQ. Epidemiology of esophageal squamous cell carcinoma. Gastroenterology (2018) 154(2):360–73. doi: 10.1053/j.gastro.2017.08.023
20. Koizumi S, Motoyama S, Iijima K. Is the incidence of esophageal adenocarcinoma increasing in Japan? trends from the data of a hospital-based registration system in akita prefecture, Japan. J Gastroenterol (2018) 53(7):827–33. doi: 10.1007/s00535-017-1412-4
21. Shah SC, McKinley M, Gupta S, Peek RM Jr., Martinez ME, Gomez SL. Population-based analysis of differences in gastric cancer incidence among races and ethnicities in individuals age 50 years and older. Gastroenterology (2020) 159(5):1705–14.e2. doi: 10.1053/j.gastro.2020.07.049
22. Islami F, DeSantis CE, Jemal A. Incidence trends of esophageal and gastric cancer subtypes by race, ethnicity, and age in the united states, 1997-2014. Clin Gastroenterol Hepatol (2019) 17(3):429–39. doi: 10.1016/j.cgh.2018.05.044
23. Yang L, Kartsonaki C, Yao P, de Martel C, Plummer M, Chapman D, et al. The relative and attributable risks of cardia and non-cardia gastric cancer associated with helicobacter pylori infection in China: a case-cohort study. Lancet Public Health (2021) 6(12):e888–e96. doi: 10.1016/S2468-2667(21)00164-X
24. Zhang HS, Choi DW, Kim HS, Kang HJ, Jhang H, Jeong W, et al. Increasing disparities in the proportions of active treatment and 5-year overall survival over time by age groups among older patients with gastric cancer in Korea. Front Public Health (2022) 10:1030565. doi: 10.3389/fpubh.2022.1030565
25. Cavallin F, Scarpa M, Cagol M, Alfieri R, Ruol A, Sileni VC, et al. Esophageal cancer clinical presentation: Trends in the last 3 decades in a Large Italian series. Ann Surg (2018) 267(1):99–104. doi: 10.1097/SLA.0000000000002048
26. Ju W, Zheng R, Zhang S, Zeng H, Sun K, Wang S, et al. Cancer statistics in Chinese older people, 2022: current burden, time trends, and comparisons with the US, Japan, and the republic of Korea. Sci China Life Sci (2022) Advance online publication. doi: 10.1007/s11427-022-2218-x
27. Xia C, Dong X, Li H, Cao M, Sun D, He S, et al. Cancer statistics in China and United States, 2022: profiles, trends, and determinants. Chinese Med J (2022) 135(5):584–90. doi: 10.1097/CM9.0000000000002108
28. Feng RM, Zong YN, Cao SM, Xu RH. Current cancer situation in China: good or bad news from the 2018 global cancer statistics? Cancer Commun (Lond) (2019) 39(1):22. doi: 10.1186/s40880-019-0368-6
29. de Martel C, Georges D, Bray F, Ferlay J, Clifford GM. Global burden of cancer attributable to infections in 2018: a worldwide incidence analysis. Lancet Glob Health (2020) 8(2):e180–e90. doi: 10.1016/S2214-109X(19)30488-7
30. Lu L, Mullins CS, Schafmayer C, Zeissig S, Linnebacher M. A global assessment of recent trends in gastrointestinal cancer and lifestyle-associated risk factors. Cancer Commun (Lond). (2021) 41(11):1137–51. doi: 10.1002/cac2.12220
31. Chen W, Xia C, Zheng R, Zhou M, Lin C, Zeng H, et al. Disparities by province, age, and sex in site-specific cancer burden attributable to 23 potentially modifiable risk factors in China: a comparative risk assessment. Lancet Glob Health (2019) 7(2):e257–e69. doi: 10.1016/S2214-109X(18)30488-1
32. Zhang W, Xiao S, Hu F, Hu P, Xu Z. Consensus opinion on some problems of helicobacter pylori. World Chin J Digestol. (2000) 8(2):219–20. doi: 10.3969/j.issn.1009-3079.2000.02.029
33. Survey Collaboration Organization. Investigation report on the treatment of peptic ulcer in China. Chin J Digestion (2007) 27(2):114–7. doi: 10.3760/j.issn:0254-1432.2007.02.011
34. Corona E, Yang L, Esrailian E, Ghassemi KA, Conklin JL, May FP. Trends in esophageal cancer mortality and stage at diagnosis by race and ethnicity in the united states. Cancer Causes Control (2021) 32(8):883–94. doi: 10.1007/s10552-021-01443-z
35. Niu P, Huang H, Zhao L, Wang T, Zhang X, Wang W, et al. Clinicopathological characteristics, survival outcomes, and genetic alterations of younger patients with gastric cancer: Results from the China national cancer center and cBioPortal datasets. Cancer Med (2022) 11(16):3057–73. doi: 10.1002/cam4.4669
36. Chen W, Li N, Cao M, Ren J, Shi J, Chen H, et al. Preliminary analysis of cancer screening program in urban China from 2013 to 2017. China Cancer (2020) 29(1):1–6. doi: 10.1136/gutjnl-2019-320200
37. Guan CT, Song GH, Li BY, Gong YW, Hao CQ, Xue LY, et al. Endoscopy screening effect on stage distributions of esophageal cancer: A cluster randomized cohort study in China. Cancer Sci (2018) 109(6):1995–2002. doi: 10.1111/cas.13606
38. Chen W, Zheng R, Chen Z, Sun X, He Y, Wen D, et al. Epidemic of upper gastrointestinal cancers in four high risk areas with esophageal cancer in China. China Cancer (2011) 20(8):557–60.
39. Cavaleiro-Pinto M, Peleteiro B, Lunet N, Barros H. Helicobacter pylori infection and gastric cardia cancer: systematic review and meta-analysis. Cancer Causes Control (2011) 22(3):375–87. doi: 10.1007/s10552-010-9707-2
40. Helicobacter and Cancer Collaborative Group. Gastric cancer and helicobacter pylori: a combined analysis of 12 case control studies nested within prospective cohorts. Gut (2001) 49(3):347–53. doi: 10.1136/gut.49.3.347
41. Casali PG, Abecassis N, Aro HT, Bauer S, Biagini R, Bielack S, et al. Gastrointestinal stromal tumours: ESMO-EURACAN clinical practice guidelines for diagnosis, treatment and follow-up. Ann Oncol (2018) 29(Suppl 4):iv68–78. doi: 10.1093/annonc/mdy095
42. Blay JY, Kang YK, Nishida T, von Mehren M. Gastrointestinal stromal tumours. Nat Rev Dis Primers (2021) 7(1):22. doi: 10.1038/s41572-021-00254-5
Keywords: esophageal cancer, gastric cancer, subsite, histological subtype, comorbidity
Citation: Wang Q, Zhang X, Zhong Y, Wei S, Li L, Wei W, Liu F, Li Y and Wang S (2023) Clinical characteristics and changing trajectories of esophageal cancer and gastric cancer in China from 2010 to 2019: An analysis of a hospital-based database of 24,327 patients. Front. Oncol. 13:1126841. doi: 10.3389/fonc.2023.1126841
Received: 18 December 2022; Accepted: 23 February 2023;
Published: 13 March 2023.
Edited by:
Hui Li, Fudan University, ChinaReviewed by:
Ching-Chieh Yang, Chi Mei Medical Center, TaiwanChenghao Zhanghuang, Kunming Children’s Hospital, China
Copyright © 2023 Wang, Zhang, Zhong, Wei, Li, Wei, Liu, Li and Wang. This is an open-access article distributed under the terms of the Creative Commons Attribution License (CC BY). The use, distribution or reproduction in other forums is permitted, provided the original author(s) and the copyright owner(s) are credited and that the original publication in this journal is cited, in accordance with accepted academic practice. No use, distribution or reproduction is permitted which does not comply with these terms.
*Correspondence: Shaoming Wang, d2FuZ3NoYW9taW5nQGNpY2Ftcy5hYy5jbg==; Yong Li, bGl5b25nZG9jdG9yQDEyNi5jb20=
†These authors have contributed equally to this work