 Jing Li
 Ying Song1,2†
 Guangjun Li
 Sen Bai
- 1Radiotherapy Physics & Technology Center, Cancer Center, West China Hospital, Sichuan University, Chengdu, China
- 2Machine Intelligence Laboratory, College of Computer Science, Chengdu, China
Purpose: Image segmentation can be time-consuming and lacks consistency between different oncologists, which is essential in conformal radiotherapy techniques. We aimed to evaluate automatic delineation results generated by convolutional neural networks (CNNs) from geometry and dosimetry perspectives and explore the reliability of these segmentation tools in rectal cancer.
Methods: Forty-seven rectal cancer cases treated from February 2018 to April 2019 were randomly collected retrospectively in our cancer center. The oncologists delineated regions of interest (ROIs) on planning CT images as the ground truth, including clinical target volume (CTV), bladder, small intestine, and femoral heads. The corresponding automatic segmentation results were generated by DeepLabv3+ and ResUNet, and we also used Atlas-Based Autosegmentation (ABAS) software for comparison. The geometry evaluation was carried out using the volumetric Dice similarity coefficient (DSC) and surface DSC, and critical dose parameters were assessed based on replanning optimized by clinically approved or automatically generated CTVs and organs at risk (OARs), i.e., the Planref and Plantest. Pearson test was used to explore the correlation between geometric metrics and dose parameters.
Results: In geometric evaluation, DeepLabv3+ performed better in DCS metrics for the CTV (volumetric DSC, mean = 0.96, P< 0.01; surface DSC, mean = 0.78, P< 0.01) and small intestine (volumetric DSC, mean = 0.91, P< 0.01; surface DSC, mean = 0.62, P< 0.01), ResUNet had advantages in volumetric DSC of the bladder (mean = 0.97, P< 0.05). For critical dose parameters analysis between Planref and Plantest, there was a significant difference for target volumes (P< 0.01), and no significant difference was found for the ResUNet-generated small intestine (P > 0.05). For the correlation test, a negative correlation was found between DSC metrics (volumetric, surface DSC) and dosimetric parameters (δD95, δD95, HI, CI) for target volumes (P< 0.05), and no significant correlation was found for most tests of OARs (P > 0.05).
Conclusions: CNNs show remarkable repeatability and time-saving in automatic segmentation, and their accuracy also has a certain potential in clinical practice. Meanwhile, clinical aspects, such as dose distribution, may need to be considered when comparing the performance of auto-segmentation methods.
1 Introduction
Preoperative radiotherapy is currently considered to be the standard treatment for locally advanced rectal cancer and has been proven to reduce local recurrence (1–3). With the development of radiotherapy technology, such as intensity modulated radiotherapy (IMRT) and volumetric modulated arc therapy (VMAT), the target volume can receive a highly conformal dose distribution (4). In addition, it has been proven that IMRT and VMAT are dosimetrically superior to other conformal techniques in protecting organs at risk (OARs) in rectal cancer (5). Thus, the accurate delineation of the clinical target volume (CTV) and OARs is crucial for treatment planning in rectal cancer.
Interobserver differences occur during manual delineation, which depend on oncologists’ clinical experience, resulting in significant changes in dose distributions (6). Multiple studies have applied deep learning methods to automatic segmentation to solve the problem of time consumption and the lack of consistency in manual contouring (7–9). Based on the planning computed tomography (pCT) images, the oncologists’ delineated regions of interest (ROIs) as a training set. These structures are imported into deep learning models with CT images, and their corresponding features are extracted to train models according to the framework characteristics of different models.
The accuracy of automatic segmentation requires clinical evaluation. Objective evaluation metrics such as the volumetric Dice similarity coefficient (volumetric DSC) and Hausdorff distance (HD) are widely used, and some studies have carried out dosimetry assessments (10–12). However, clinical evaluation of the quality of deep learning delineation has limitations (13). Considering the different accuracy requirements of CTVs and OARs in clinical practice, it is necessary to combine their clinical importance and tolerant errors and carry out a comprehensive evaluation from the perspectives of geometry and dosimetry.
We carried out a retrospective study of radiotherapy patients with rectal cancer. CTV and OARs were segmented manually as the ground truth (GT), two convolutional neural networks we have trained—DeepLabv3+ and ResUNet—were used for automatic delineation (13), and a common method Atlas-based Auto segmentation (ABAS) was used as a comparison. Our research aimed to explore the clinical impact of auto-segmentation results from a dosimetric perspective.
2 Materials and methods
2.1 Patient data
The retrospective study was approved by the ethics committee of West China Hospital in 2019, with no extra health risks and no need for patient consent. Rectal cancer patients from February 2018 to April 2019 at West China Hospital were chosen randomly and metastases in advanced patients were ignored. Each patient was immobilized in a supine position with arms over the head using a radiotherapy thermoplastic mold, and this position was applied during simulation and treatment. The contrast-enhanced CT images (tube voltage, 120 kVp; matrix size, 512 × 512; voxel resolution, 0.9 × 0.9 × 3.0 mm in left-right, antero-posterior and cranio-caudal directions) were acquired as patient pCT on the same CT scanner (SOMATOM Definition AS, Siemens Healthcare).
Based on the pCT, a radiation oncologist manually segmented the CTV and OARs of rectal cancer by referring to Radiation Therapy Oncology Group consensus guidelines. Then, the structures were modified and approved by a senior expert physician and labelled as ground truth, including CTVGT, bladderGT, small intestineGT, left femoral headGT and right femoral headGT.
2.2 Automatic segmentation
DeepLabv3+ and ResUNet, two typical CNNs, were used for automating delineation. DeepLabv3+ employs an atrous spatial pyramid pooling module and concat aggregation for the extraction and integration of high-level features, and ResUNet has shortcut connections for each level of features (13). The pCT images of all patients were imported into the models to obtain the mask of each structure on every CT slice. The two-dimensional masks were then converted to a three-dimensional structure in DICOM format, imported to the treatment planning system (TPS), and labelled as ROIDeepLabv3+ and ROIResUNet, respectively. The network models were uploaded onto github (https://github.com/hujunjiescu/DeepRadiology_rectum), and the architecture diagram was shown in Figure 1.
CNN models had the same training settings. The contouring tasks were worked out based on the Pytorch deep learning framework using Python. The experiments were performed on a Linux operating system workstation with the CPU Intel Xeon E5-2620 v3@ 2.4GHz, GPU NVIDIA Tesla K40 Xp, and 64 GB RAM. The loss function for the optimization was the weighted cross-entropy, which was defined as:
where N, C, w, y, and a denoted the batch size, number of classes, weight factor, ground truth sets, and prediction sets, respectively. The batch size N was set at 10, the weight factor w at 2, and the total training epoch T at 100. The stochastic gradient descent method was used to optimize the network with the initial learning rate set as 0.01, which was multiplied by for the epoch t. The segmentation results were rewritten into DICOM RT structure (RS) files based on their original spatial resolutions.
The ABAS worked on CT datasets using a multi-patient atlas. We randomly selected 5 atlas patients from the CNN training set, then their pCT images and manual contoured structures were imported to ABAS software (Version 2.01.00, Elekta CMS, Inc.). The Simultaneous Truth And Performance Level Evaluation (STAPLE) algorithm was used to fuse the multiple single-subject atlas auto-segmentation sets into one multi-subject auto-segmentation set (6).
2.3 Treatment plans
To evaluate the clinical dosimetry value of the two automatic delineation methods, a two-round optimization protocol was performed using TPS (Raystation, version 4.7.5, Raystation Laboratories, Stockholm, Sweden): 1) The corresponding PTV was obtained based on CTV expanded with a three-dimensional margin of 5 mm; 2) The dose prescription was set to 50.4Gy/28 fraction to the PTV; 3) Two full arcs, one from 181 to 180° clockwise and the other from 180 to 181° counterclockwise, were designed using the VMAT technique and 6 MV photons; 4) The initial optimization parameters applied to the first round VMAT planning were shown in Table 1, and in the second round, the weight of Parameter4 was set to 100, and the weight of Max EUD objectives was set to 0.01.
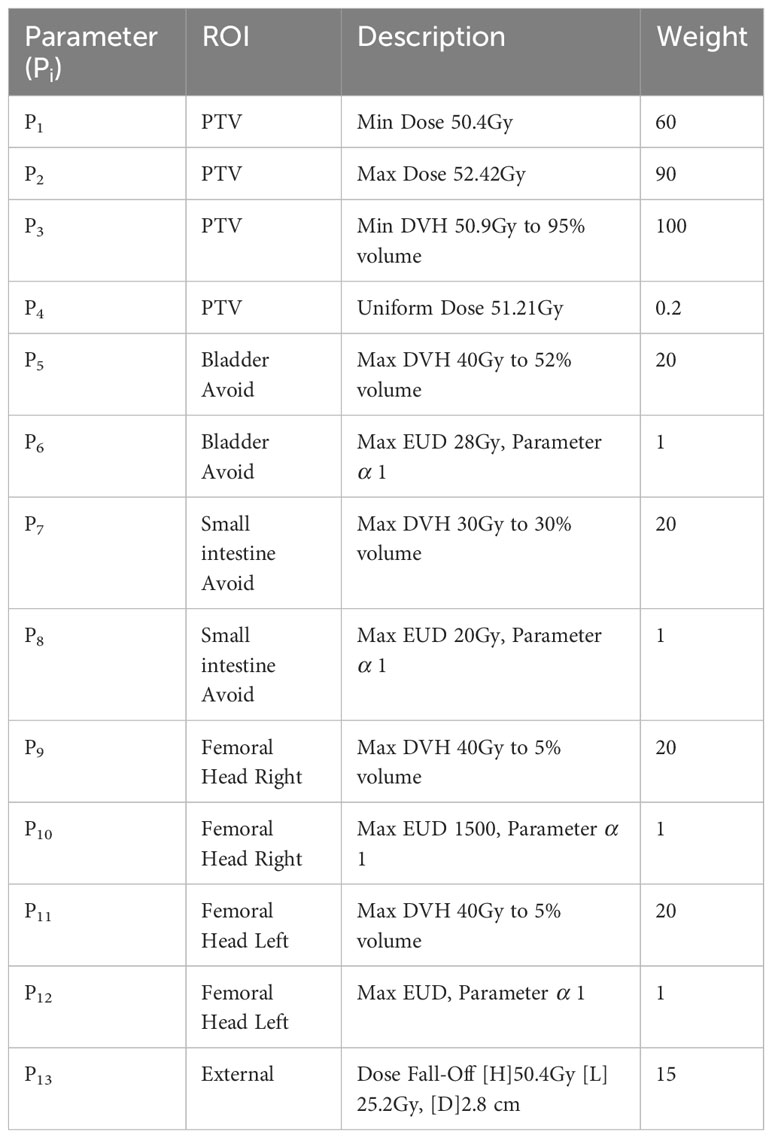
Table 1 Initial planning objective set for plan optimization.
Taking the difficulty of CTV delineation into consideration, we divided the results of the three auto-segmentation methods into CTV and OAR groups and introduced them as optimization objectives separately to obtain Plantest: 1) the plan optimized using CTVDeepLabv3+ and OARGT labelled Plan1; 2) the plan optimized using CTVResUNet and OARGT labelled Plan2; 3) the plan optimized using CTVABAS and OARGT labelled Plan3; 4) the plan optimized using CTVGT and OARDeepLabv3+ labelled Plan4; 5) the plan optimized using CTVGT and OARResUNet labelled Plan5; and 6) the plan optimized using CTVGT and OARABAS labelled Plan6. In addition, we obtained a Planref optimized using ROIGT, calculated characteristic dose parameters of ROIGT in all plans, and compared parameters extracted from Plantest with those from the Planref respectively.
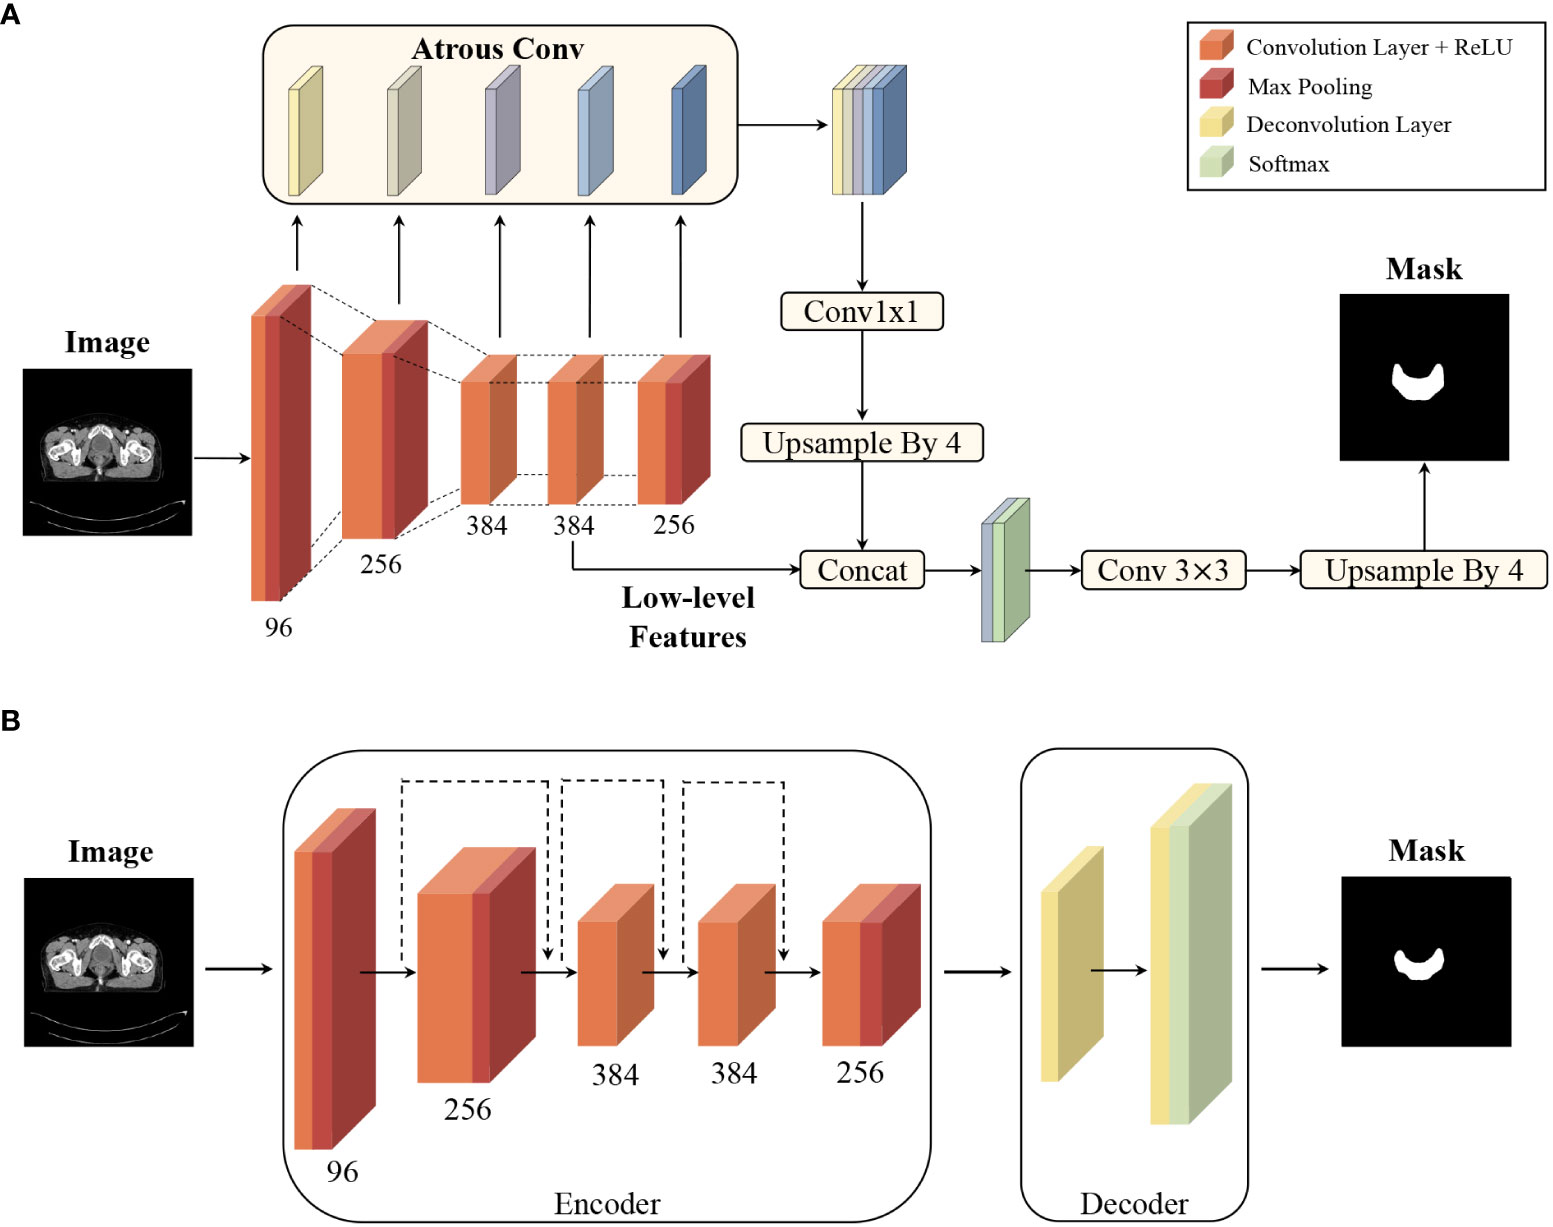
Figure 1 Convolutional neural network architecture diagram: (A) architecture of DeepLabv3+ for segmentation, and (B) architecture of ResUNet for segmentation. The two networks had been implemented using data sets from 199 patients (training set with 98 cases, validation set with 38 cases, and test set with 63 cases) in previous study (13).
2.4 Evaluation metrics and statistical analysis
In terms of geometry, two DSCs were used to evaluate quantitatively, which were calculated on the overlap of the ROI structures. The ROIs were converted from RS files to thresholding masks, and the masks were divided into slices corresponding to the CT images. The mathematical operations were carried out based on all mask slices of a certain structure and the average was obtained as DSC value.
The volume similarity was usually evaluated by volumetric DSC, calculated using:
where V1 were the ROIs of ground truth set and V2 were the corresponding auto-segmentation structures. Volumetric DSC varies between 0 (no overlap) and 1 (complete overlap), which indicates the degree of overlap between ROIGT and auto-segmentation results.
To characterize the proportion of the contour edges that need to be redrawn, the surface DSC was applied to assess the agreement between just the surface of two contours (14). The surface DSC represents the proportion of units with acceptable distance, and the acceptable tolerance τ was defined as the 95th percentile of the distance difference contoured by two oncologists for each structure. As shown in Figure 2, the masks of two ROIs to be compared were used to extract the contour surface and labelled S, then the surface border was expanded by τ both inside and outside to get B(τ). Currently, the parts of one structure’s S that does not coincide with the other structure’s B(τ) were regarded as exceeding the tolerance.
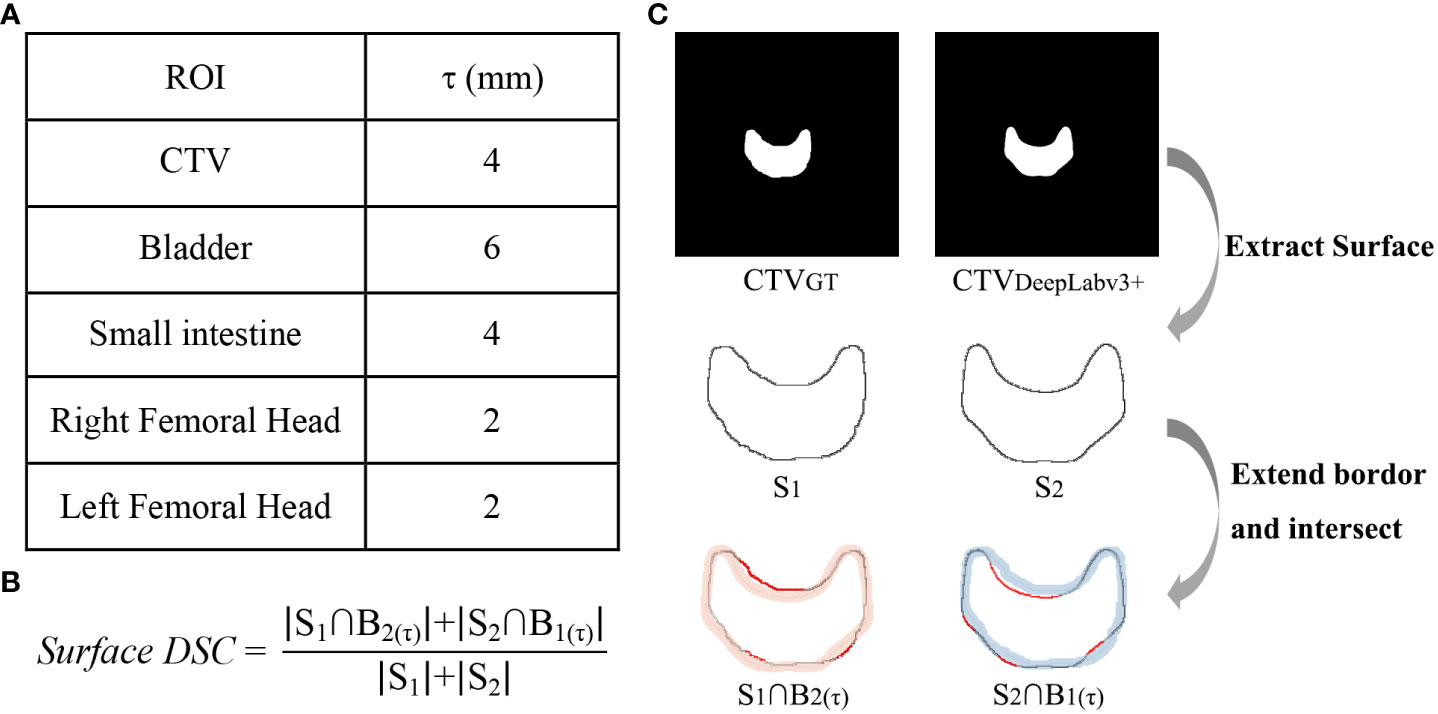
Figure 2 Calculation method of surface DSC. (A) acceptable tolerance τ value, (B) surface DSC formula, (C) the calculation process taken CTV as an example, in which the red lines in and were the part that exceeds the tolerance.
In addition, the clinical practicability of contours delineated automatically is evaluated by the accuracy of the dose distribution in plan design. The characteristic dosimetry parameters of ROIGT in every plan were extracted for comparison. D2 (Dn representing the absolute dose of n% volume) and D98 were extracted to signify hot spots and cold spots for all structures, respectively (4). V50.4 for CTV indicated whether CTV received enough dose, while the conformal index (, where TV is target volume, TVRI is the target volume covered by the 95% prescription dose, and VRI is the volume of the 95% prescription dose) and homogeneity index () were used to evaluate PTV (15, 16). Moreover, relative dose parameters Vn (volume percentage receiving radiation Gy) related to acute or late toxicity of OARs were obtained for all plans, including V30, V40, V50 of the bladder, V15, V45, V50 of the small intestine, and V40, V45 of the femoral head (17–20).
The collected data were analyzed using SPSS Statistics software (version 26.0, SPSS Inc., Chicago, IL, United States). Normality tests were performed on all datasets of geometric and dosimetric parameters. Paired samples t tests or Wilcoxon signed rank tests were chosen for group comparison with statistical significance set at P value< 0.05 (2-tailed). To make a more intuitive comparison, we calculated the absolute difference between the dose parameters extracted from the Planref and the Plantest, denoted as DAbs, and carried out a statistical description. In particular, Vn, HI, and CI were relative values and directly subtracted, while Dn were absolute values and converted to normalized dose difference () (21, 22). In addition, we used the Pearson test to check whether volumetric and surface DSC were correlated and explore whether the geometric metrics of a structure were correlated with its corresponding dose parameters, and the degree of linear correlation.
3 Results
Forty-seven rectal cancer patients were included in the study. The median age was 54 years, with a interquartile range (IQR) of 13.97, and other characteristics are shown in Table 2. For patients diagnosed with stage IV disease, the study ignored metastases in the training and evaluation. In 5 cases, the structures were not successfully generated from the ABAS software.
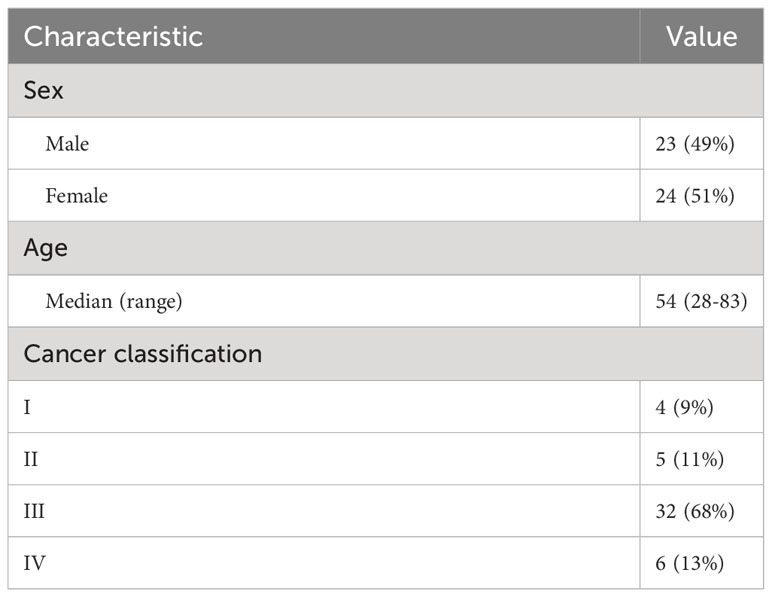
Table 2 Characteristics of 47 patients.
The statistical analysis results of volumetric and surface DSC are shown in Figure 3. In general, the volumetric and surface DSC of the three automatic segmentation results were significantly different, except for the surface DSC of the bladder structure delineated by DeepLabv3+ and ResUNet (P = 0.78). For CTV, DeepLabv3+ showed the best performance on volumetric DSC (mean = 0.96, P< 0.01) and surface DSC (mean = 0.96, P< 0.01). The DSCs of CNNs automatic contouring bladder were significantly higher than those of ABAS (P< 0.01), although there was no significant difference in surface DSC between the two CNNs, the mean value of ResUNet was slightly higher than that of DeepLabv3+ (BladderDeepLabv3+ vs. BladderResUNet, 0.82 vs. 0.85, P = 0.78). In the delineation of the small intestine, DeepLabv3+ showed significant advantages, whose mean DSCs (volumetric DSC, 0.91; surface DSC, 0.62) were greater than those of the other two groups (P< 0.01), as well as a lower standard deviation (volumetric DSC, 0.05; surface DSC, 0.10). For the segmentation of the right and left femoral head, ABAS achieved the best performance, then the ResUNet, and DeepLabv3+ ranked the last based on the volumetric DSC (mean for the right femoral head, ABAS vs. ResUNet vs. DeepLabv3+, 0.94 vs. 0.85 vs. 0.84, P< 0.01) and surface DSC (mean for the right femoral head, ABAS vs. ResUNet vs. DeepLabv3+, 0.84 vs. 0.70 vs. 0.67, P< 0.01), despite more outliers in volumetric DSC of ABAS. The ground truth and the automatic delineation of a random case were shown in Figure 4.
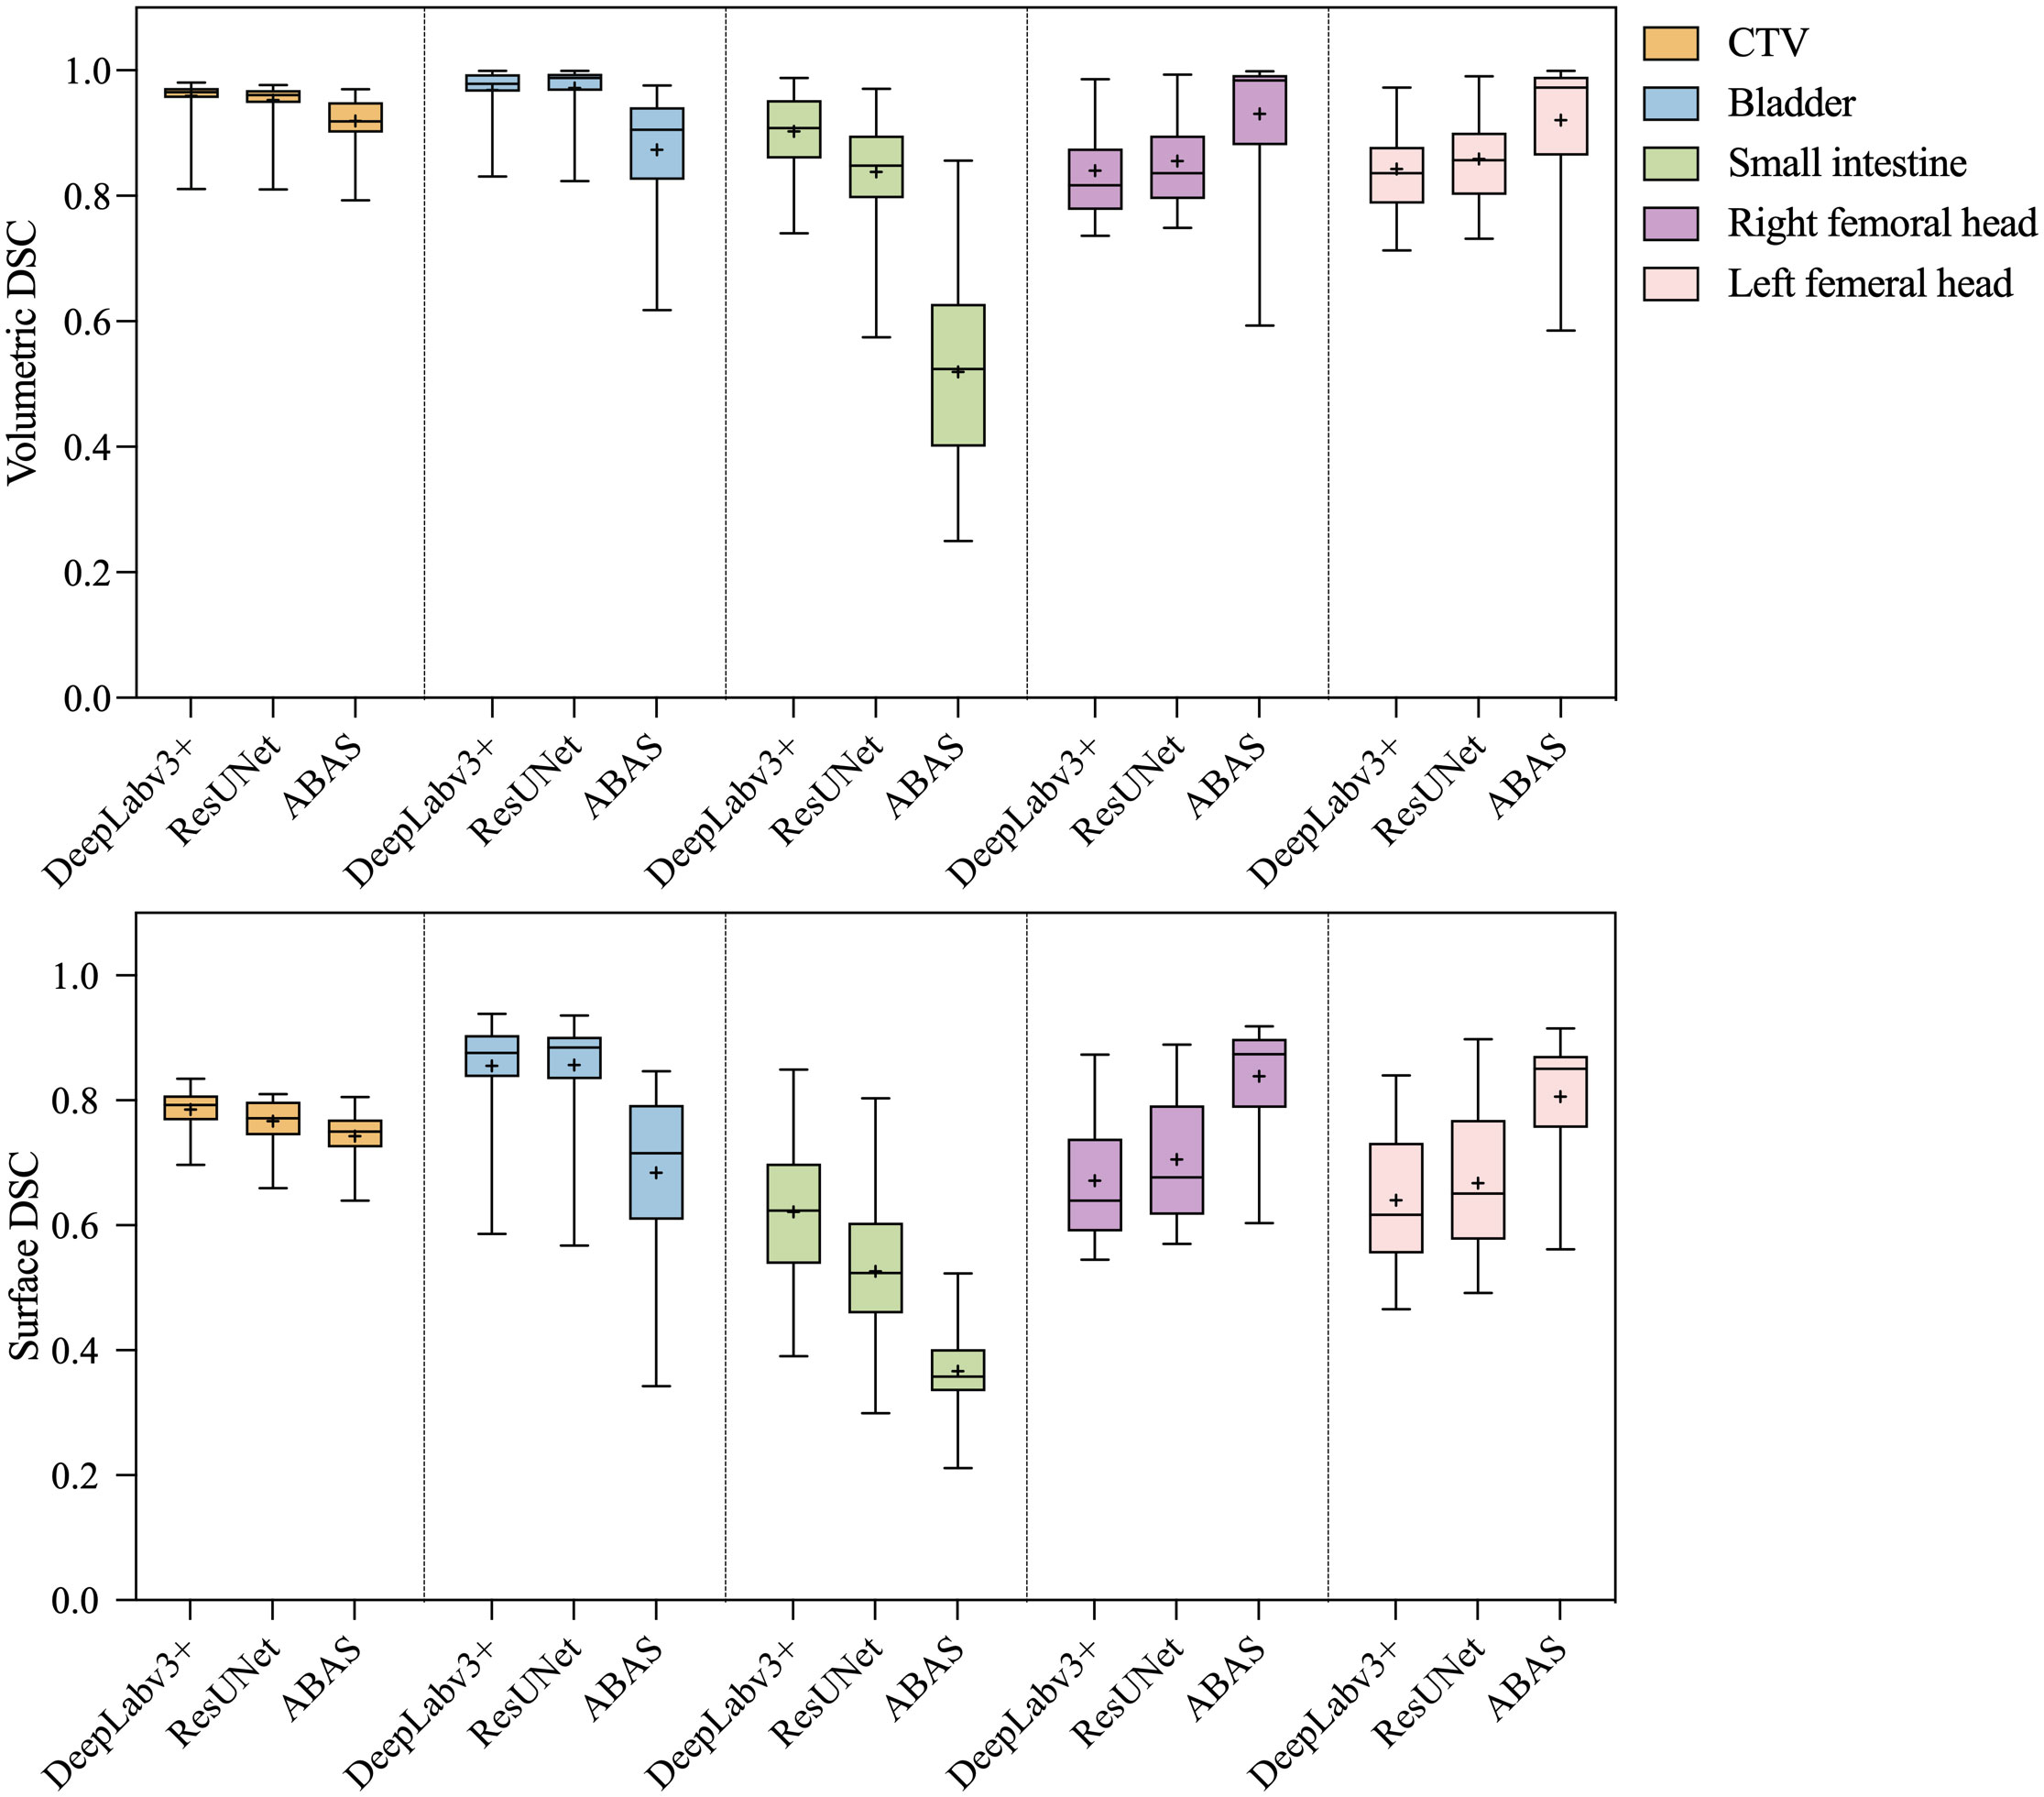
Figure 3 Statistical analysis results of volumetric and surface DSC. The paired- sample tests were performed between the three auto-segmentation results at a significance level of 0.05(2-tailed), and the missing data in the ABAS dataset (n=42) were replaced with the mean.
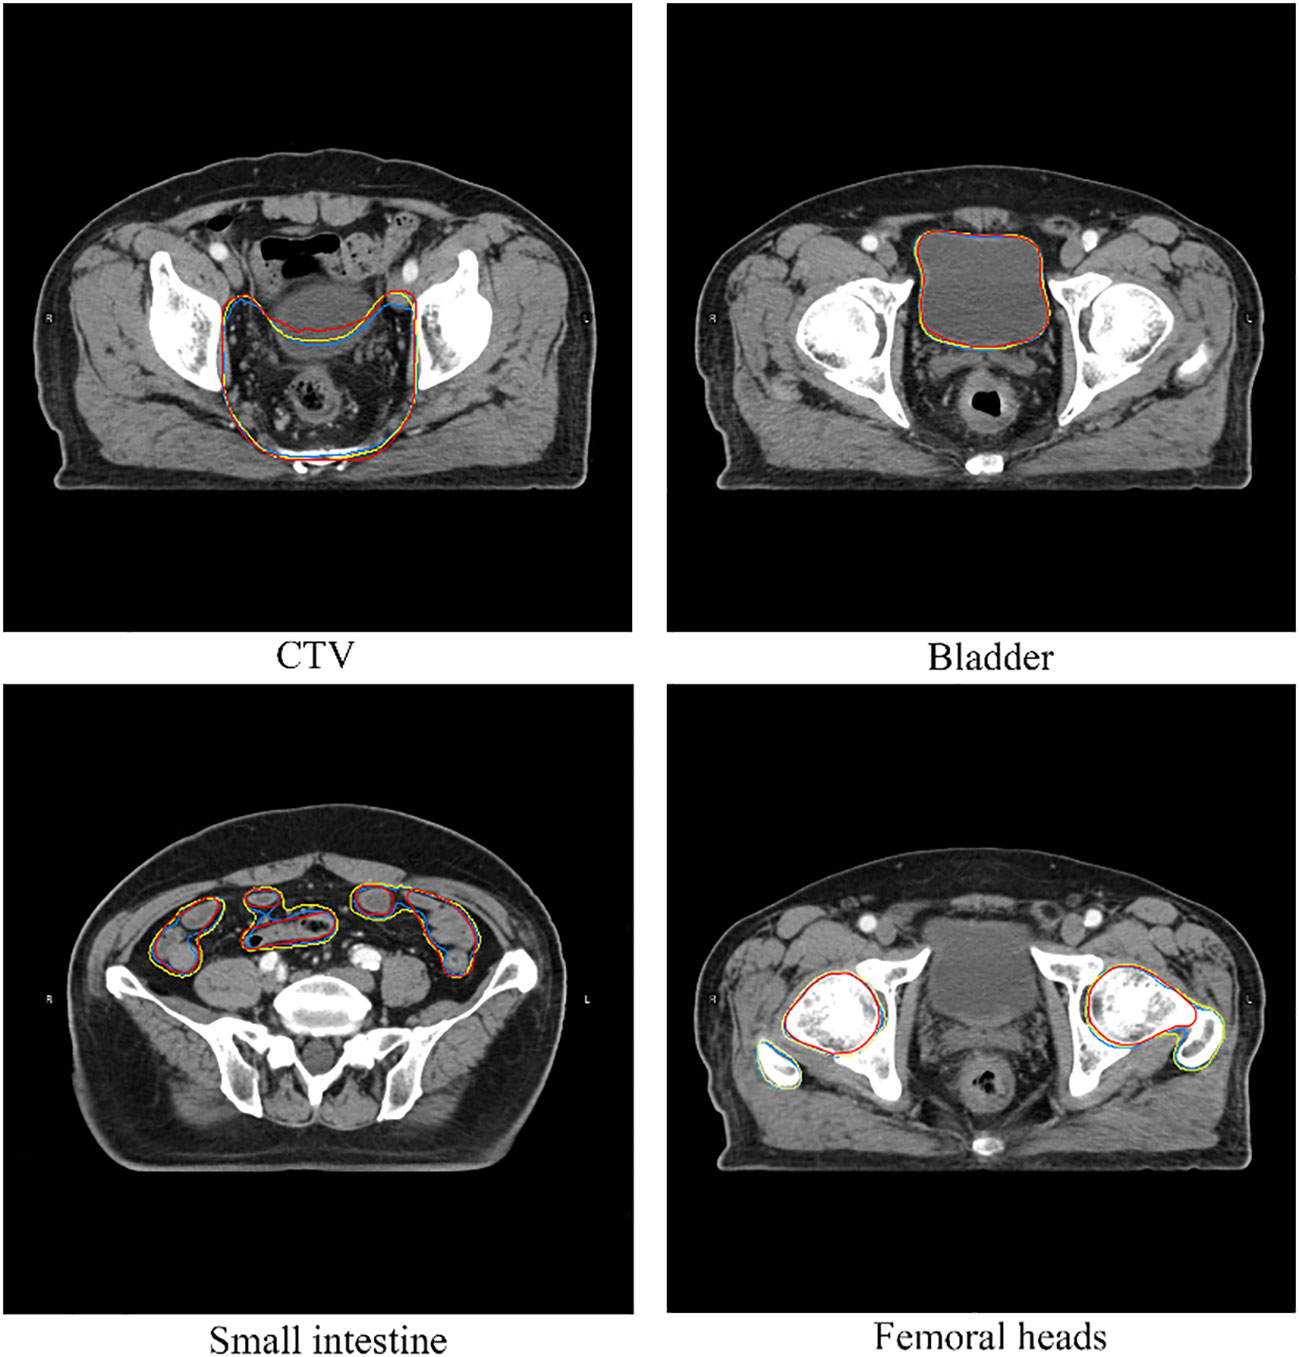
Figure 4 A case of structures comparison. The red line represents ground truth, the yellow line represents automatic segmentation of DeepLabv3+, the blue line represents automatic segmentation of ResUNet.
The DAbs of the dose parameters between Plantest and Planref were shown in Table 3, and it contained descriptive statistics and results of statistical tests. We observed a statistical difference in dose distribution of real CTV between the Planref and Plan 1-3 (P< 0.01), which used automatically delineated CTV as an inverse optimization parameter. The difference, however, was that some dose parameters of real OAR in Plan1 were not significantly different from the Planref (P > 0.05), which showed a similar trend to the outperformance of DeepLabv3+ in geometric evaluation. When we introduced the auto-segmentation OAR groups into the inverse plan, we found that only critical dose parameters of the small intestine between Plan5 and the Planref had no statistical difference (P > 0.05), but the small intestine generated by ResUNet was not optimal in the geometric assessment (volumetric DSC, mean = 0.84; surface DSC, mean = 0.52).

Table 3 Statistical analysis of dose parameter difference between test and reference plans.
Although the volumetric and surface DSCs of all structures were numerically different, there was a correlation between them (P< 0.01). The correlation analysis results of geometric metrics and dose parameters were shown in Table 4. The volumetric and surface DSCs of CTV generated by ResUNet were correlated with all dose parameters in target volume (P< 0.05) in Plan2, on the other hand, the volumetric DSC of the three CTV groups were correlated with δD95, δD98, HI, and CI (P< 0.05) respectively in Plan 1-3 . For the bladder, the volumetric DSC of ResUNet results was correlated with all dose parameters of the bladder in Plan5, and δD2 in Plan 4-6 was correlated with both DSC metrics. There were few correlation indexes in the small intestine, only volumetric DSC vs. V15 and surface DSC vs. V45/V50. In the results of bilateral femoral heads, both DSC metrics of two CNNs were correlated with the corresponding δD2 in Plan 4-5.
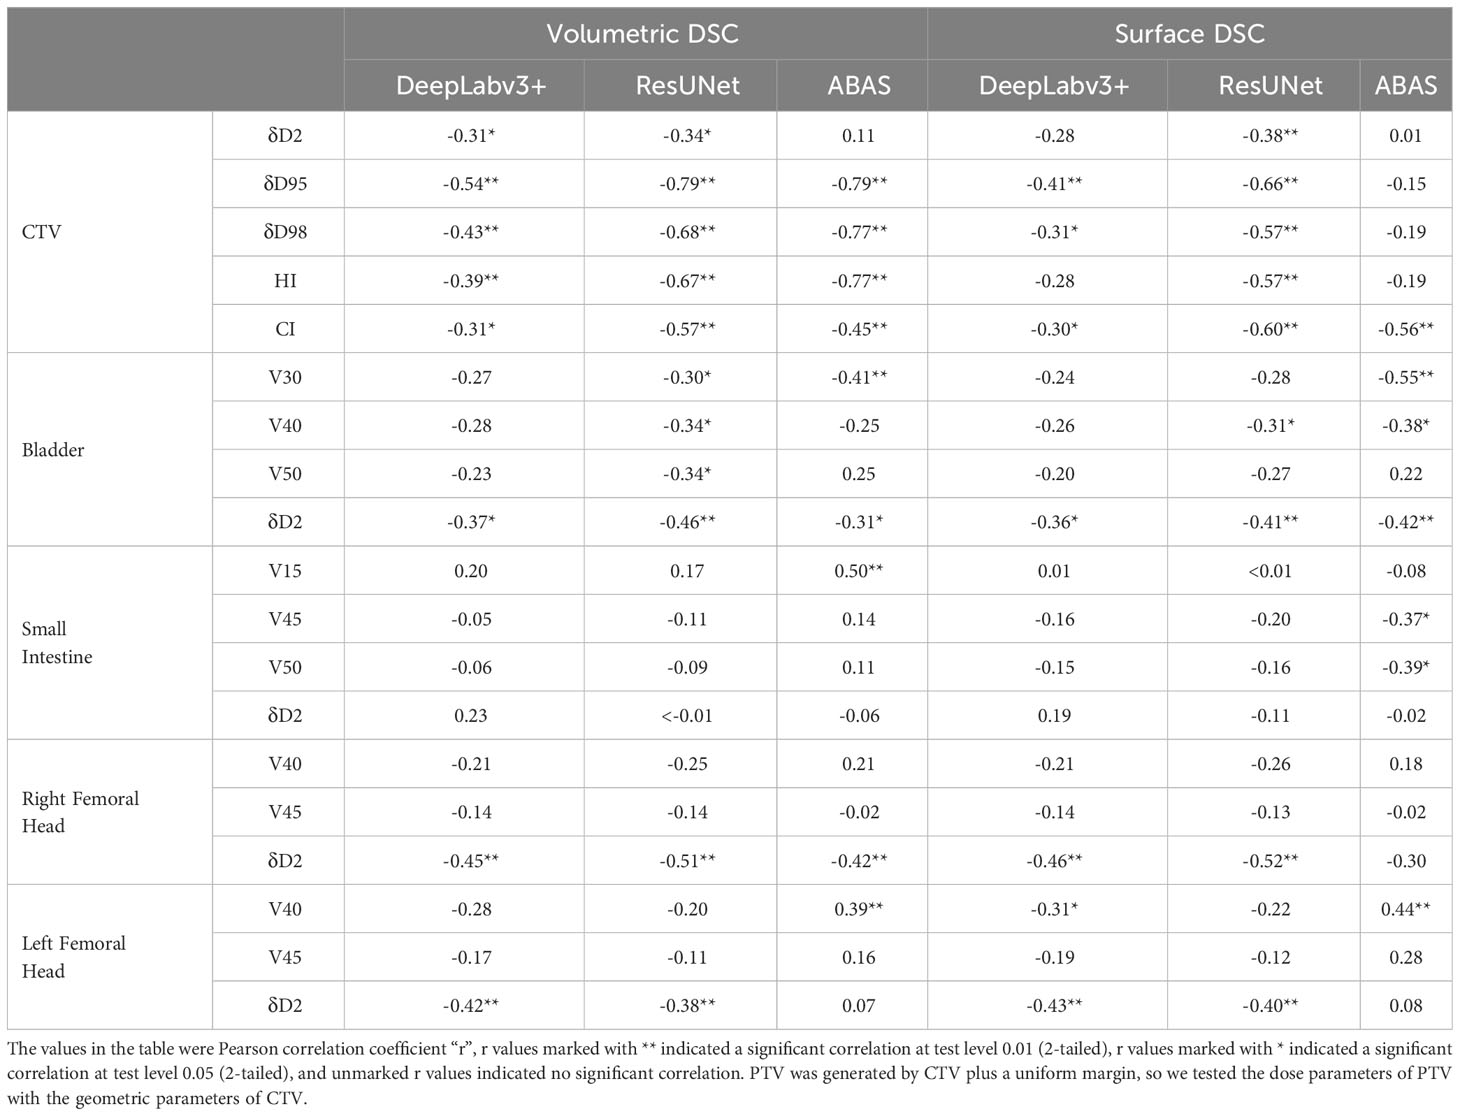
Table 4 Pearson correlation analysis between geometric parameters and corresponding multiple dose parameters of the same structure.
4 Discussion
In our retrospective study, geometric and dosimetric evaluations of CTV and OARs for rectal cancer were carried out using manually segmented structures as the ground truth, while commercial software ABAS generated structures as reference. The results showed that the CNN models had a remarkable performance in accuracy and repeatability of automatic segmentation, but their performance in geometric metrics and dose parameters was not completely consistent.
The effect of automatic segmentation requires objective metrics for evaluation. Volumetric DSC is the most commonly used metric and describes the degree of overlap between two structures; however, it weights all misplaced segmentations equally and cannot characterize the distance of the ROI surface. For example, a structure with more proportion needs to be modified slightly and takes a long time may obtain a high volumetric DSC, while a structure requiring a large amount of modification locally and a short time-consuming may have a low volumetric DSC. For the description of surface distance, a commonly used metric is the HD, which represents the maximum of the shortest distances from any delineated point to the other contour (23). At the same time, the limitation lies in its description of the maximum surface distance rather than the degree of surface difference of the entire structure. Therefore, our study includes the surface DSC. This metric has the function of subjective and objective assessment, which contains tolerable interobserver subjective errors, describes the degree of overlap from the perspective of the entire structure, and to a certain extent characterizes the potential cost of modification. Some studies have counted the time spent on performing manually correcting auto-contouring (24). In our previous study, we calculated the computing time of CNNs, in which the average time for generating a case was about 28 s for DeepLabv3+ and 35 s for ResUNet; and we recorded the manual correction time of the results, in which the average cost for CTVDeepLabv3+, CTVResUNet, and all OARs was about 11 min, 7 min, and below 5 min respectively (13). With large inter-observer variability, it can still be determined that the manual contouring time is much greater than the total time of automatic contouring and manual modification.
Besides geometric accuracy, the effect of automatically generated ROIs on treatment planning should also be considered. Since the dose distribution is affected by mechanical and physical factors and cannot fully fit the edge of the structure, parts of the automatic contouring that are not perfectly consistent with clinical ground truth may be covered by the isodose lines, which perhaps can be considered as the “robustness” of the structure. Therefore, the evaluation of automatic delineation results should be combined with dosimetry results rather than a single geometric evaluation. There are many methods for dose evaluation; the simplest is to transplant a reference plan into different ROI sets and calculate the dose parameters for comparison (15). However, these parameters do not exist dose distribution replanned using different optimization objects is hardly consistent with the reference plan. Another method is to generate a plan for each group of ROIs and compare their dose characteristics without any reference. We consult the evaluation method for interobserver variation, which assesses plans generated from different ROI sets by calculating the dose parameters of the reference structures (25). Based on this method, we add the definition of “ground truth”, design plans using CTV and OAR groups separately and carry out dosimetry evaluation by ROIGT. The results indicate that some crucial dose parameters in the actual plan have no significant difference from the reference plan even if the structure of automatic segmentation cannot completely overlap with ROIGT, especially in the automatically delineated OARs. Interestingly, it can be seen from Plan1 that DeepLabv3+ has a smaller effect on OAR dose distribution, following a similar trend to its dominance in DSC metrics. However, ResUNet-generated small intestine did not show an advantage in the geometric assessment, but its dose parameters in Plan5 did not differ from those in Planref. Therefore, we cannot only pursue the improvement of geometric metrics, perhaps the performance assessment of auto-segmentation methods should be combined with dose evaluation, as the latter is more relevant to clinical outcome (26).
At present, our institution has established an integrated platform for automatic delineation (including head, chest, abdomen, pelvis, etc.), which is connected to TPS and CT workstations through the hospital’s internal network. The platform can realize CT image transmission, conversion between RS files and masks, and continuous input of abnormal cases (such as recognizing the skull as the femoral head) to improve network performance. This is also a key step in the real application of artificial intelligence to the clinic. The auto-segmentation assessment should integrate subjective and objective methods, but the subjective assessment will introduce inter-observer variability, so it needs multi-center external validation (27). This is a limitation of this study, and we plan to extend the integrated platform to other hospitals and collect data for external validation. In addition, the dose evaluation method also needs to be further improved. In this study, all structures are divided into CTV and OAR groups, and the results may be more targeted and reliable if each structure is taken as a separate variable of the optimization object. In terms of analysis methods, the paired test of dose parameters was used in this study; and what if directly compare RT Dose files and assess dose difference from both global and local perspectives.
5 Conclusion
In this study, we evaluated the automatic segmentation results from the perspectives of geometry and dosimetry. The results showed the advantages of speed and repeatability of deep learning in ROI delineation, which is of great help to the routine workflow of radiotherapy. The auto-segmentation function of CNNs is a stability tool for VMAT and IMRT treatment plan design, and it may have further potential in adaptive radiotherapy, which requires repeat CT scans and CTV delineation before each treatment fraction (28). Moreover, with the advancement of MR-Linac, automatic segmentation based on magnetic resonance images has been applied to adaptive radiotherapy, which poses a great challenge to the speed, accuracy, and effect on the dose distribution of the networks (29, 30).
The characteristics of convolutional neural networks are different, and the segmentation effect on the ROIs of rectal cancer also differs. We can integrate the two networks or classify them according to the advantageous structure of each network; however, whether further exploration can bring better results requires a comprehensive clinical evaluation.
Data availability statment
The original contributions presented in the study are included in the article. Further inquiries can be directed to the corresponding author.
Ethics statement
The studies involving humans were approved by Ethics Committee on Biomedical Research, West China Hospital of Sichuan University. The studies were conducted in accordance with the local legislation and institutional requirements. Written informed consent for participation was not required from the participants or the participants’ legal guardians/next of kin in accordance with the national legislation and institutional requirements.
Author contributions
JL, YS, and SB contributed to conception and design of the study. SB and GL contributed to administrative support and provision of study materials. YS organized the database. JL, YW, and LL collected the data. JL performed the statistical analysis. All authors contributed to the manuscript and approved the submitted version.
Funding
This work was supported by the National Natural Science Foundation of China, grant numbers 81972848; Cancer Precision Radiotherapy Spark Program of China International Medical Foundation, grant number 2019-N-11-04; Sichuan Province Science and Technology Support Program, grant number 2021YFS0143; Sichuan University Innovation Research Project, grant number 2022SCUH0021.
Conflict of interest
The authors declare that the research was conducted in the absence of any commercial or financial relationships that could be construed as a potential conflict of interest.
Publisher’s note
All claims expressed in this article are solely those of the authors and do not necessarily represent those of their affiliated organizations, or those of the publisher, the editors and the reviewers. Any product that may be evaluated in this article, or claim that may be made by its manufacturer, is not guaranteed or endorsed by the publisher.
References
1. Abraha I, Aristei C, Palumbo I, Lupattelli M, Trastulli S, Cirocchi R, et al. Preoperative radiotherapy and curative surgery for the management of localised rectal carcinoma. Cochrane Database Syst Rev (2018) 10(10):CD002102. doi: 10.1002/14651858.CD002102.pub3
2. Qiaoli W, Yongping H, Wei X, Guoqiang X, Yunhe J, Qiuyan L, et al. Preoperative short-course radiotherapy (5 × 5 Gy) with delayed surgery versus preoperative long-course radiotherapy for locally resectable rectal cancer: a meta-analysis. Int J Colorectal Dis (2019) 34(12):2171–83. doi: 10.1007/s00384-019-03433-9
3. Rahbari NN, Elbers H, Askoxylakis V, Motschall E, Bork U, Büchler MW, et al. Neoadjuvant radiotherapy for rectal cancer: meta-analysis of randomized controlled trials. Ann Surg Oncol (2013) 20(13):4169–82. doi: 10.1245/s10434-013-3198-9
4. Lobefalo F, Bignardi M, Reggiori G, Tozzi A, Tomatis S, Alongi F, et al. Dosimetric impact of inter-observer variability for 3D conformal radiotherapy and volumetric modulated arc therapy: the rectal tumor target definition case. Radiat Oncol (2013) 8:176. doi: 10.1186/1748-717X-8-176
5. Clivio A, Clivio A, Fogliata A, Franzetti-Pellanda A, Nicolini G, Vanetti E, et al. Volumetric-modulated arc radiotherapy for carcinomas of the anal canal: A treatment planning comparison with fixed field IMRT. Radiother Oncol (2009) 92(1):118–24. doi: 10.1016/j.radonc.2008.12.020
6. Tao CJ, Yi JL, Chen NY, Ren W, Cheng J, Tung S, et al. Multi-subject atlas-based auto-segmentation reduces interobserver variation and improves dosimetric parameter consistency for organs at risk in nasopharyngeal carcinoma: A multi-institution clinical study. Radiother Oncol (2015) 115(3):407–11. doi: 10.1016/j.radonc.2015.05.012
7. Kosmin M, Ledsam J, Romera-Paredes B, Mendes R, Moinuddin S, de Souza D, et al. Rapid advances in auto-segmentation of organs at risk and target volumes in head and neck cancer. Radiother Oncol (2019) 135:130–40. doi: 10.1016/j.radonc.2019.03.004
8. McQuinlan Y, Brouwer CL, Lin Z, Gan Y, Sung Kim J, van Elmpt W, et al. An investigation into the risk of population bias in deep learning autocontouring. Radiother Oncol (2023) 186:109747. doi: 10.1016/j.radonc.2023.109747
9. Liao W, Luo X, He Y, Dong Y, Li C, Li K, et al. Comprehensive evaluation of a deep learning model for automatic organs at risk segmentation on heterogeneous computed tomography images for abdominal radiation therapy. Int J Radiat Oncol Biol Phys (2023) S0360-3016(23):00520–5. doi: 10.1016/j.ijrobp.2023.05.034
10. Wang T, Lei Y, Tian S, Jiang X, Zhou J, Liu T, et al. Learning-based automatic segmentation of arteriovenous malformations on contrast CT images in brain stereotactic radiosurgery. Med Phys (2019) 46(7):3133–41. doi: 10.1002/mp.13560
11. Burbach JP, Kleijnen JP, Reerink O, Seravalli E, Philippens ME, Schakel T, et al. Inter-observer agreement of MRI-based tumor delineation for preoperative radiotherapy boost in locally advanced rectal cancer. Radiother Oncol (2016) 118(2):399–407. doi: 10.1016/j.radonc.2015.10.030
12. van Dijk LV, Van den Bosch L, Aljabar P, Peressutti D, Both S, Steenbakkers R JHM, et al. Improving automatic delineation for head and neck organs at risk by Deep Learning Contouring. Radiother Oncol (2020) 142:115–23. doi: 10.1016/j.radonc.2019.09.022
13. Song Y, Hu J, Wu Q, Xu F, Nie S, Zhao Y, et al. Automatic delineation of the clinical target volume and organs at risk by deep learning for rectal cancer postoperative radiotherapy. Radiother Oncol (2020) 145:186–92. doi: 10.1016/j.radonc.2020.01.020
14. Nikolov S, Blackwell S, Zverovitch A, Mendes R, Livne M, De Fauw J, et al. Clinically applicable segmentation of head and neck anatomy for radiotherapy: deep learning algorithm development and validation study. J Med Internet Res (2021) 23(7):e26151. doi: 10.2196/26151
15. Stanley J, Dunscombe P, Lau H, Burns P, Lim G, Liu HW, et al. The effect of contouring variability on dosimetric parameters for brain metastases treated with stereotactic radiosurgery. Int J Radiat Oncol Biol Phys (2013) 87(5):924–31. doi: 10.1016/j.ijrobp.2013.09.013
16. Grégoire V, Mackie TR. State of the art on dose prescription, reporting and recording in Intensity-Modulated Radiation Therapy (ICRU report No. 83) Cancer Radiother (2011) 15(6-7):555–9. doi: 10.1016/j.canrad.2011.04.003
17. Kiliç D, Çatli S, Ülger Ş, Kapucu LÖ. Is there any impact of PET/CT on radiotherapy planning in rectal cancer patients undergoing preoperative IMRT? Turk J Med Sci (2015) 45(1):129–35. doi: 10.3906/sag-1312-149
18. Robertson JM, Lockman D, Yan D, Wallace M. The dose-volume relationship of small bowel irradiation and acute grade 3 diarrhea during chemoradiotherapy for rectal cancer. Int J Radiat Oncol Biol Phys (2008) 70(2):413–8. doi: 10.1016/j.ijrobp.2007.06.066
19. Gallagher MJ, Brereton HD, Rostock RA, Zero JM, Zekoski DA, Poyss LF, et al. A prospective study of treatment techniques to minimize the volume of pelvic small bowel with reduction of acute and late effects associated with pelvic irradiation. Int J Radiat Oncol Biol Phys (1986) 12(9):1565–73. doi: 10.1016/0360-3016(86)90279-8
20. Letschert JG, Lebesque JV, de Boer RW, Hart AA, Bartelink H. Dose-volume correlation in radiation-related late small-bowel complications: a clinical study. Radiother Oncol (1990) 18(4):307–20. doi: 10.1016/0167-8140(90)90111-9
21. Shiraishi S, Moore KL. Knowledge-based prediction of three-dimensional dose distributions for external beam radiotherapy. Med Phys (2016) 43(1):378. doi: 10.1118/1.4938583
22. Song Y, Hu J, Liu Y, Hu H, Huang Y, Bai S, et al. Dose prediction using a deep neural network for accelerated planning of rectal cancer radiotherapy. Radiother Oncol (2020) 149:111–6. doi: 10.1016/j.radonc.2020.05.005
23. Sha X, Wang H, Sha H, Xie L, Zhou Q, Zhang W, et al. Clinical target volume and organs at risk segmentation for rectal cancer radiotherapy using the Flex U-Net network. Front Oncol (2023) 13:1172424. doi: 10.3389/fonc.2023.1172424
24. Qiu W, Zhang W, Ma X, Kong Y, Shi P, Fu M, et al. Auto-segmentation of important centers of growth in the pediatric skeleton to consider during radiation therapy based on deep learning. Med Phys (2023) 50(1):284–96. doi: 10.1002/mp.15919
25. Jansen EP, Nijkamp J, Gubanski M, Lind PA, Verheij M. Interobserver variation of clinical target volume delineation in gastric cancer. Int J Radiat Oncol Biol Phys (2010) 77(4):1166–70. doi: 10.1016/j.ijrobp.2009.06.023
26. Xia X, Wang J, Li Y, Peng J, Fan J, Zhang J, et al. An artificial intelligence-based full-process solution for radiotherapy: A proof of concept study on rectal cancer. Front Oncol (2021) 10:616721. doi: 10.3389/fonc.2020.616721
27. Defeudis A, Mazzetti S, Panic J, Micilotta M, Vassallo L, Giannetto G, et al. MRI-based radiomics to predict response in locally advanced rectal cancer: comparison of manual and automatic segmentation on external validation in a multicenter study. Eur Radiol Exp (2022) 6(1):19. doi: 10.1186/s41747-022-00272-2
28. Nijkamp J, Marijnen C, van Herk M, van Triest B, Sonke JJ. Adaptive radiotherapy for long course neo-adjuvant treatment of rectal cancer. Radiother Oncol (2012) 103(3):353–9. doi: 10.1016/j.radonc.2012.02.013
29. Li L, Xu B, Zhuang Z, Li J, Hu Y, Yang H, et al. Accurate tumor segmentation and treatment outcome prediction with DeepTOP. Radiother Oncol (2023) 183:109550. doi: 10.1016/j.radonc.2023.109550
Keywords: automatic segmentation, deep learning, rectal neoplasms, radiotherapy, CNN
Citation: Li J, Song Y, Wu Y, Liang L, Li G and Bai S (2023) Clinical evaluation on automatic segmentation results of convolutional neural networks in rectal cancer radiotherapy. Front. Oncol. 13:1158315. doi: 10.3389/fonc.2023.1158315
Received: 03 February 2023; Accepted: 11 August 2023;
Published: 05 September 2023.
Edited by:
Gozde Akar, Middle East Technical University, TürkiyeReviewed by:
Qiu Tang, School of Medicine, Zhejiang University, ChinaJiazhou Wang, Fudan University, China
Copyright © 2023 Li, Song, Wu, Liang, Li and Bai. This is an open-access article distributed under the terms of the Creative Commons Attribution License (CC BY). The use, distribution or reproduction in other forums is permitted, provided the original author(s) and the copyright owner(s) are credited and that the original publication in this journal is cited, in accordance with accepted academic practice. No use, distribution or reproduction is permitted which does not comply with these terms.
*Correspondence: Sen Bai, YmFpc2VuQHNjdS5lZHUuY24=
†These authors have contributed equally to this work and shared first authorship