 Hongwei Qian
 Zhihong Shen1,2†
 Yanhua Huang
- 1Department of Hepatobiliary and Pancreatic Surgery, Shaoxing People’s Hospital, Shaoxing, China
- 2Shaoxing Key Laboratory of Minimally Invasive Abdominal Surgery and Precise Treatment of Tumor, Shaoxing, China
- 3Department of Ultrasound, Shaoxing People’s Hospital, Shaoxing, China
Background: Hepatocellular cancer (HCC) is one of the most common tumors worldwide, and Ki-67 is highly important in the assessment of HCC. Our study aimed to evaluate the value of ultrasound radiomics based on intratumoral and peritumoral tissues in predicting Ki-67 expression levels in patients with HCC.
Methods: We conducted a retrospective analysis of ultrasonic and clinical data from 118 patients diagnosed with HCC through histopathological examination of surgical specimens in our hospital between September 2019 and January 2023. Radiomics features were extracted from ultrasound images of both intratumoral and peritumoral regions. To select the optimal features, we utilized the t-test and the least absolute shrinkage and selection operator (LASSO). We compared the area under the curve (AUC) values to determine the most effective modeling method. Subsequently, we developed four models: the intratumoral model, the peritumoral model, combined model #1, and combined model #2.
Results: Of the 118 patients, 64 were confirmed to have high Ki-67 expression while 54 were confirmed to have low Ki-67 expression. The AUC of the intratumoral model was 0.796 (0.649-0.942), and the AUC of the peritumoral model was 0.772 (0.619-0.926). Furthermore, combined model#1 yielded an AUC of 0.870 (0.751-0.989), and the AUC of combined model#2 was 0.762 (0.605-0.918). Among these models, combined model#1 showed the best performance in terms of AUC, accuracy, F1-score, and decision curve analysis (DCA).
Conclusion: We presented an ultrasound radiomics model that utilizes both intratumoral and peritumoral tissue information to accurately predict Ki-67 expression in HCC patients. We believe that incorporating both regions in a proper manner can enhance the diagnostic performance of the prediction model. Nevertheless, it is not sufficient to include both regions in the region of interest (ROI) without careful consideration.
1 Introduction
Hepatocellular carcinoma (HCC) is one of the most commonly diagnosed cancer, with more than 700,000 new HCC cases and 600,000 deaths in the world every year (1). Although surgical resection is the primary treatment for HCC with well-preserved liver function, the 5-year survival rate is only 10%-20% (2), due to a high recurrence rate after operation (3).
Ki-67 is an antigen associated with cell proliferation (4), playing a role in the therapeutic response and prognosis of malignant tumors (5). The Ki-67 proliferation index (PI) is commonly used as a prognostic indicator in various cancers (6–8). In HCC patients, high Ki-67 expression is associated with aggressive tumor characteristics and adverse outcomes (9). Accurately identifying Ki-67 expression is crucial, and the current evaluation of Ki-67 mainly depends on surgical pathology or needle biopsy. However, surgical pathology is a time-consuming process, and needle biopsy may not capture the complete heterogeneity of the tumor. Therefore, a noninvasive preoperative approach is needed to predict Ki-67 status and guide personalized treatment in HCC patients.
Previous research has indicated that radiomics (10), which involves converting medical images into imaging features and selecting those highly related to tumors, holds the potential to predict tumor phenotype, classification, stage, and other biological behaviors (11–13). For instance, Wu et al. (14) analyzed computer tomography (CT) findings of HCC patients and predicted the Ki-67 expression level based on texture features extracted from CT images. Similarly, Fan et al. (15) developed a nomogram based on radiomics features and clinical factors from enhanced magnetic resonance imaging (MRI) images, showing promising diagnostic performance.
The peritumoral tissue, which is the tissue surrounding the tumor, can also provide valuable information about tumor initiation and progression (16). By using radiomics to analyze peritumoral tissue, it is possible to predict Ki-67 expression in tumors (17). And in HCC, peritumoral tissue was thought to be associated with MVI and invasiveness (18, 19).However, few studies have evaluated the relationship between peritumoral tissues and Ki-67 expression in HCC patients.
CT, MR, and US play crucial roles in the evaluation of HCC: CT can provide high-resolution images and has high sensitivity and specificity for diagnosing HCC. MR can provide more detailed anatomical and functional information, such as liver metabolism and perfusion. US is a non-invasive, real-time, and repeatable imaging technique that holds high value for early diagnosis and treatment monitoring of HCC (20, 21). By combining radiomics, ultrasound has the potential to offer enhanced insights into HCC (22). Against this backdrop, our study aimed to assess the predictive value of radiomics features extracted from intratumoral and peritumoral tissues using abdominal ultrasound in HCC patients for Ki-67 status. We aimed to develop and validate an abdominal ultrasound radiomics model, and to investigate the associations between radiomics and Ki-67 expression in HCC patients.
2 Materials and methods
2.1 Study population
Our study received ethical approval from our institutional ethics committee. We conducted a retrospective analysis of ultrasonic and clinical data from 145 patients diagnosed with HCC by histopathological examination of surgical specimens in our hospital from September 2019 to January 2023. The assignment of the pathological diagnosis for each case was conducted in accordance with the 2019 WHO Classification of Tumors of the Digestive System (23). The inclusion criteria were as follows (1): ultrasound examination performed within 1 week before the operation (2); age of 18 or older (3); pathologically confirmed HCC (4); complete pathological data, including the Ki-67 proliferation index (5); for patients with multiple lesions, the largest lesion with matched pathological and immunohistochemical diagnosis was selected. Exclusion criteria were (1): incomplete clinical or pathological data (n = 17) (2); tumor therapy prior to the operation (n = 8) (3); suboptimal image quality (n = 2). Ultimately, 118 HCC patients were enrolled in the study, and they were randomly assigned to a training group (n = 82) and a testing group (n = 36) in a 7:3 ratio (Table 1). A flowchart illustrating the inclusion and exclusion of patients is presented in Figure 1.
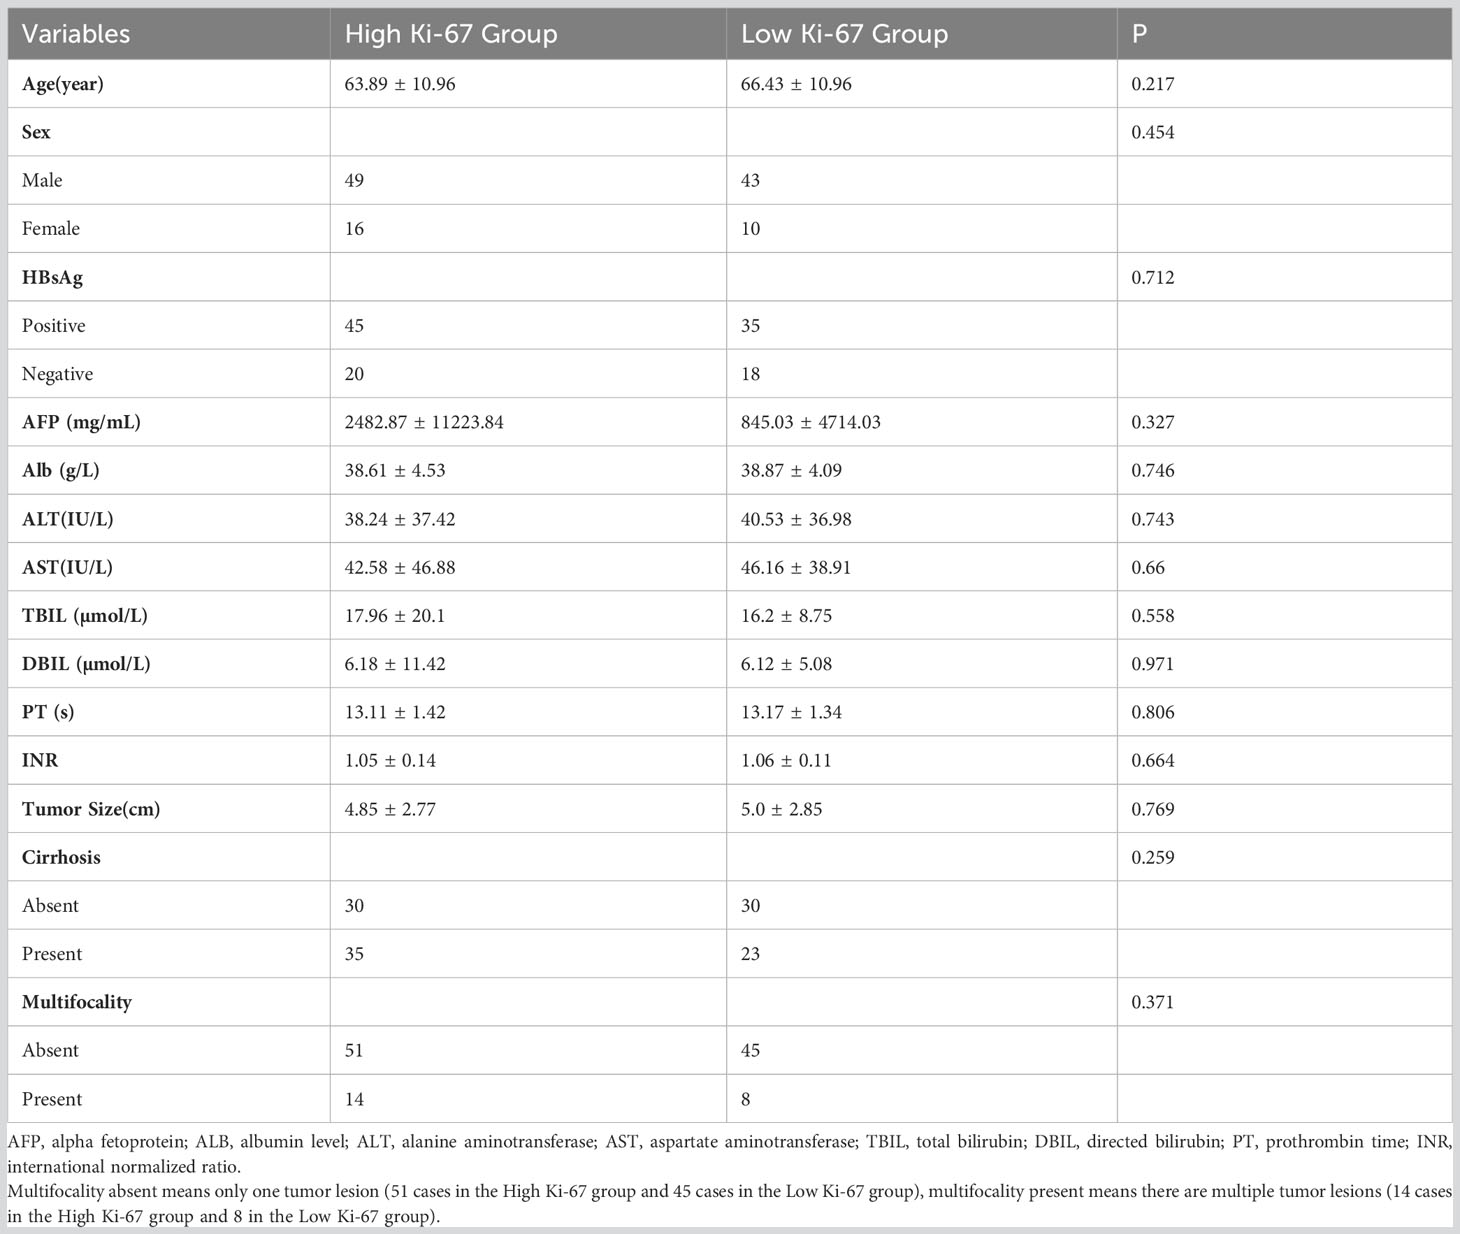
Table 1 Comparison of clinical characteristics between the high Ki-67 expression group and low Ki-67 expression group.
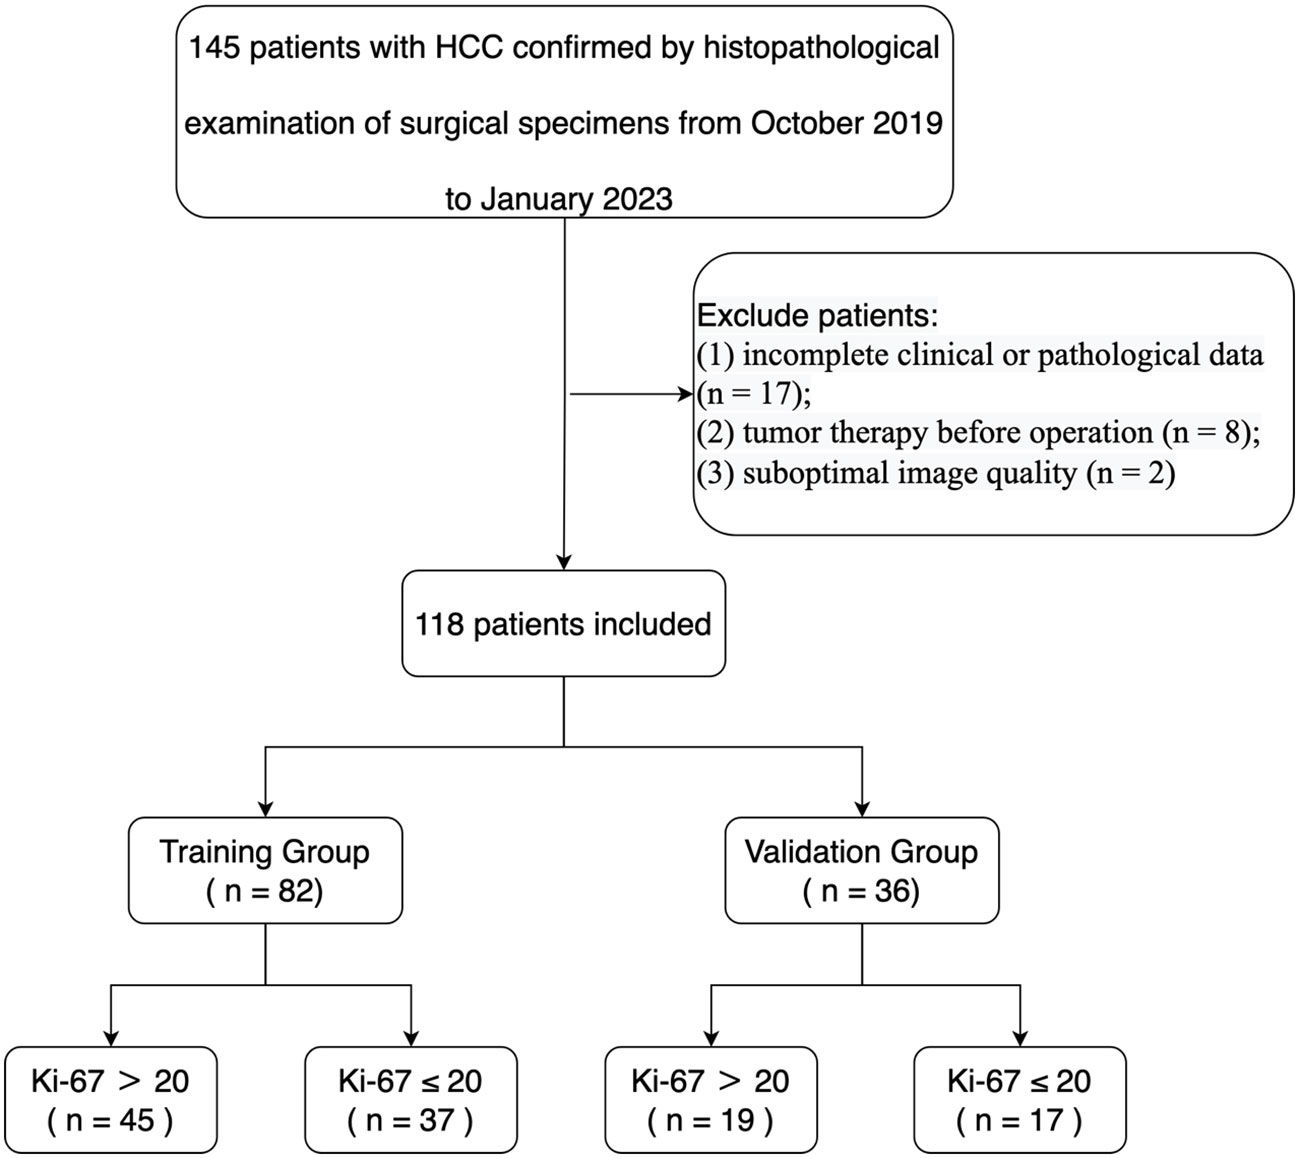
Figure 1 Flowchart of the inclusions and exclusions criteria of participants.
2.2 Image acquisition
The studies were done with patients lying in a supine position with both arms elevated above the head. And the image of the tumor at the largest diameter was saved in digital imaging and communications in medicine (DICOM) format for further investigation.
Ultrasound examination was performed by using one of the following ultrasound machines: LOGIQ E8 (GE Healthcare, United States; C5-1 convex array probes, 1–5 MHz); LOGIQ E9 (GE Healthcare, United States; C5-1 convex array probes, 1–5 MHz); Aplio 500 (Toshiba Medical systems, Japan; 6C1 probe, 1–6 MHz); i800 (Cannon Medical systems Corporation, Japan; i8CX1 probe, 1-8MHz); and Resona 7T (Mindray, China; SC6-1 U probe, 1-6MHz).
2.3 Histological and Immunohistochemistry
The specimens were fixed in 3.7% neutral formaldehyde, paraffin-embedded, and cut into 4 mm thick sections. Ki-67 proliferation was detected using immunohistochemistry with the Ventana Benchmark Ultra automated staining system (Roche Ventana, Inc.). Tumor nuclei with brown-stained nuclei were considered positive for Ki-67 expression. The Ki-67 PI was calculated as the percentage of positive nuclei, and HCC lesions were classified into two groups based on their PI values: a high expression group (PI > 20%) and a low expression group (PI ≤ 20%) (24), as shown in Figure 2.
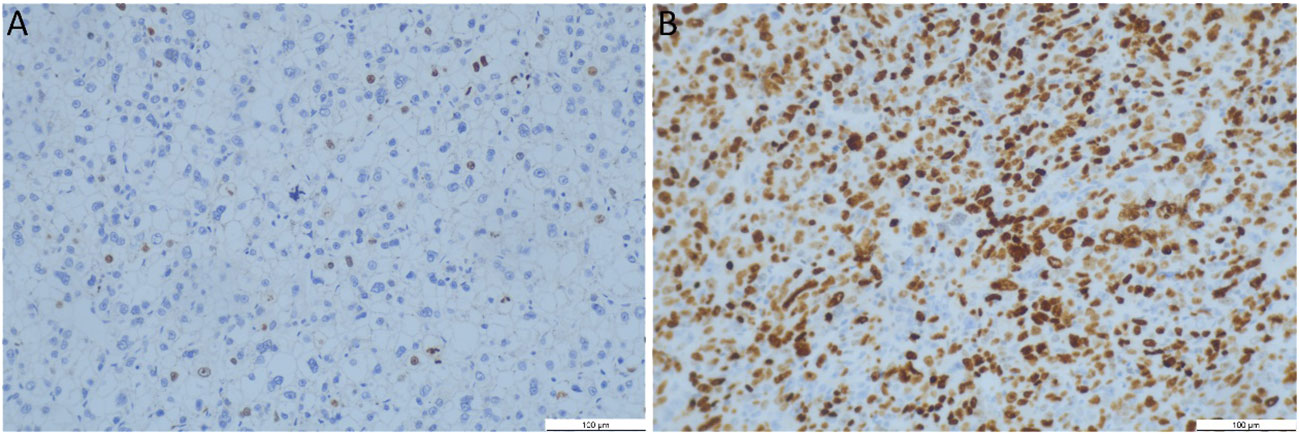
Figure 2 Representative immunohistochemistry Ki-67 staining patterns and dot plots assessing the percentage of Ki-67 staining cells (original magnification, 200x). (A) Low Ki-67 expression (7%); (B) High Ki-67 expression (80%). Brown-stained nuclei were considered positive Ki-67 expression.
2.4 Tumor segmentation and feature extraction
The intratumoral region of interest (ROI) segmentation was manually delineated using ITK-SNAP software (Version 3.8.0, www.itksnap.org) along the tumors’ edge. The peritumoral tissue was defined as the tissue located at a distance of 2 cm from the tumor. If the peritumoral ROI extended beyond the liver tissue, the liver capsule was used as the boundary. This process was carried out independently by two experienced sonographers who were blinded to the patients’ clinical data, as illustrated in Figure 3, and was repeated one week later for consistency.
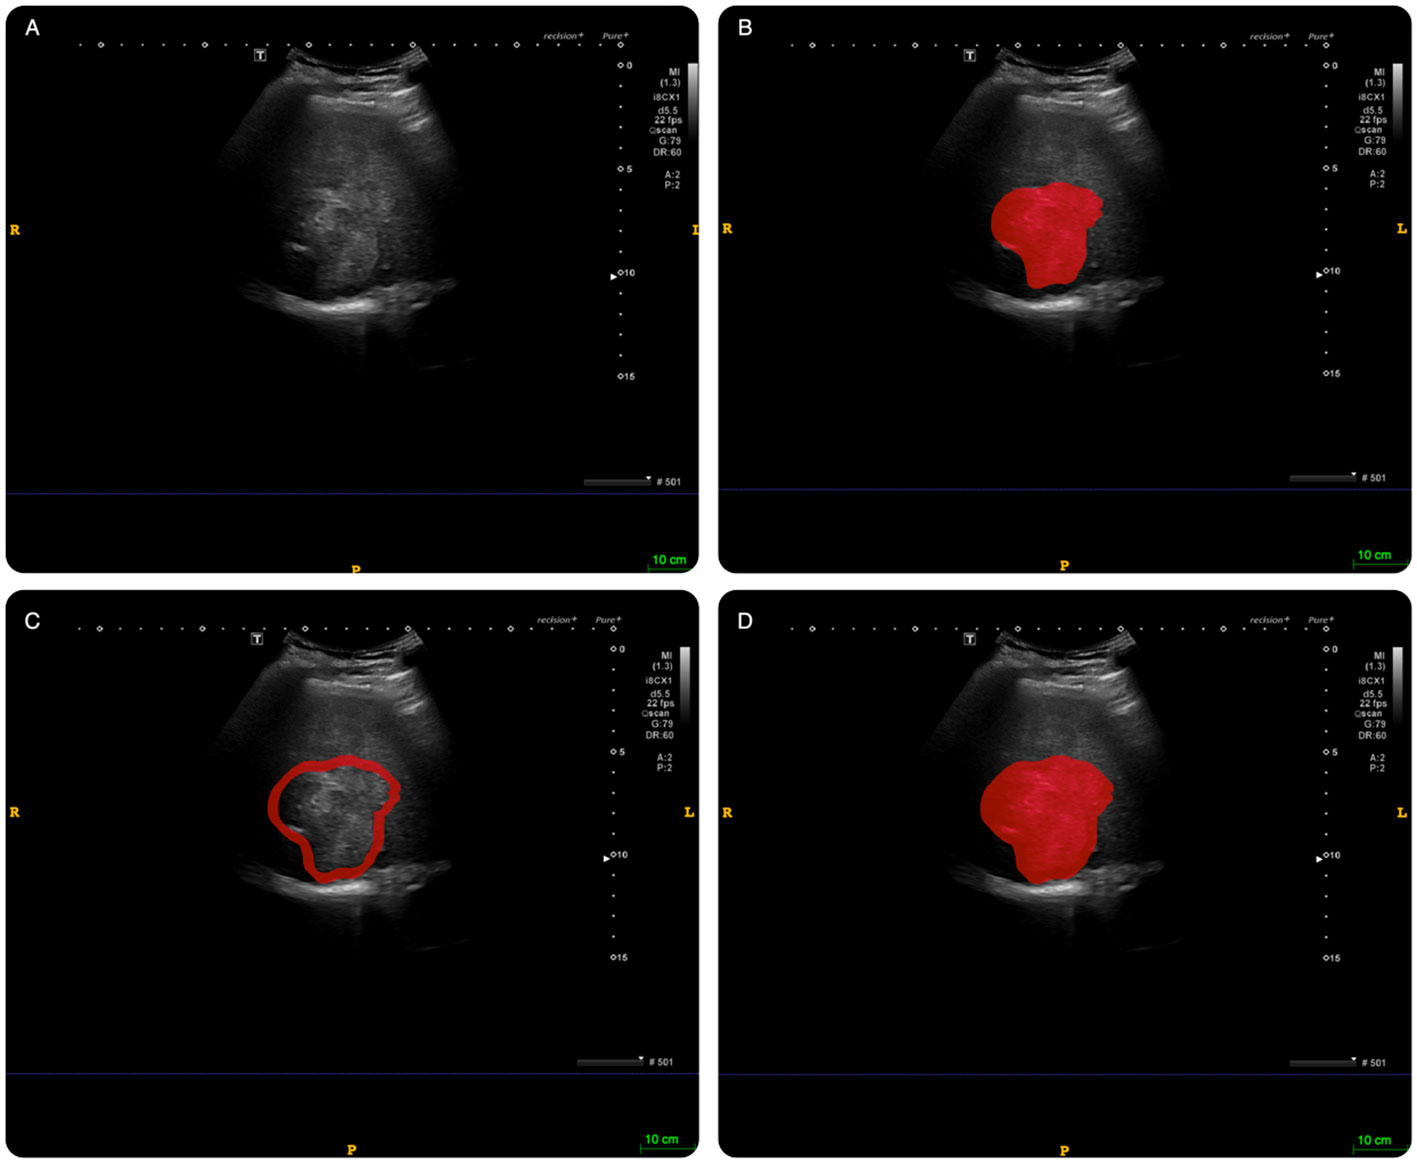
Figure 3 An example of delineating region of interest (ROI) on abdominal ultrasound imaging in ITK-SNAP software. (A): original image; (B): intratumoral ROI. (C): peritumoral ROI; (D): combined ROI (intratumoral tissue + peritumoral tissue).
2.5 Feature extraction and dimension reduction
Before extracting features, we standardized all ultrasound images, which involved resampling the images to a uniform spatial resolution of 3 x 3 x 3 mm3, normalizing the intensity values to 32 grey levels using a normalization scale of 255, and eliminating any machine-specific artifacts or noise.
We utilized the Pyradiomics (open-source Python package) to extract high-order features from the original and filtered images, such as Wavelet, LoG, Square, SquareRoot, Logarithmic, Exponential, and Gradient filters, in addition to first- and second-order features from preoperative abdominal ultrasound images. Due to the wide range of magnitudes among the features, we applied standard Z-score scaling to normalize them.
To assess the reproducibility of the radiomics features, we computed inter- and intra-class coefficients (ICC). The inter-class coefficients were derived by comparing the features extracted by different sonographers, while the intra-class coefficients were obtained by comparing the features extracted at different times, one week apart. We only included features with ICCs above 0.8 in subsequent feature selection, indicating their reproducibility.
We utilized the variance method, t-test, and the least absolute shrinkage and selection operator (LASSO) to determine the optimal features.
2.6 Radiomics Model construction and evaluation
To identify the best-performing model, we constructed multiple models using various approaches. We evaluated each model using a receiver operating characteristic (ROC) curve and computed its area under the curve (AUC) value.
Parameter selection plays a crucial role in optimizing the performance of machine learning models. In this study, we employed a two-stage approach (RandomizedSearchCV—GridSearchCV) to select the best hyperparameters for multiple machine learning models, namely Support Vector Machine (SVM), Random Forest, K-Nearest Neighbors (KNN), Logistic Regression, and Artificial Neural Network (ANN) (Supplement Material I).
The model with the highest AUC in the validation group was selected as the top performer. The intratumoral and peritumoral models with the best performance were merged using Logistic regression. We employed the calibration curve to visually illustrate the agreement between pathologically confirmed Ki-67 status and the prediction of the merged model. Moreover, we used decision curve analysis (DCA) to assess the clinical utility of the models by estimating the benefits at various threshold probabilities.
2.7 Statistical analysis
All radiomics procedures and statistical analyses were conducted with Python software (Version 3.8.5). R language (Version 4.2.2, R Foundation for Statistical Computing, Vienna, Austria) was used for waterfall plots, calibration curves, and DCA. Continuous variables were compared using t-test or Mann-Whitney U test, and categorical variables were compared with chi-square test. P values less than 0.05 were regarded as statistically significant.
3 Results
3.1 Characteristics of the study population
A total of 118 patients were ultimately included in this study, with 64 being confirmed to have high Ki-67 expression and 54 with low Ki-67 expression. These patients were randomly divided into training (n = 82) and validation (n = 36) groups. Table 1 presents the clinical characteristics of all patients, and there were no significant differences between the high and low Ki-67 expression groups in terms of all clinical characteristics (p > 0.05). Moreover, we compared the clinical characteristics of the high and low Ki-67 expression groups in the training and validation sets. We found a significant difference in the mean age of the high Ki-67 expression group in the validation set compared to the low Ki-67 expression group (62.16 ± 6.86 vs 70.35 ± 10.89, p = 0.012). However, there were no significant differences in other clinical characteristics (p > 0.05) (Table 2).
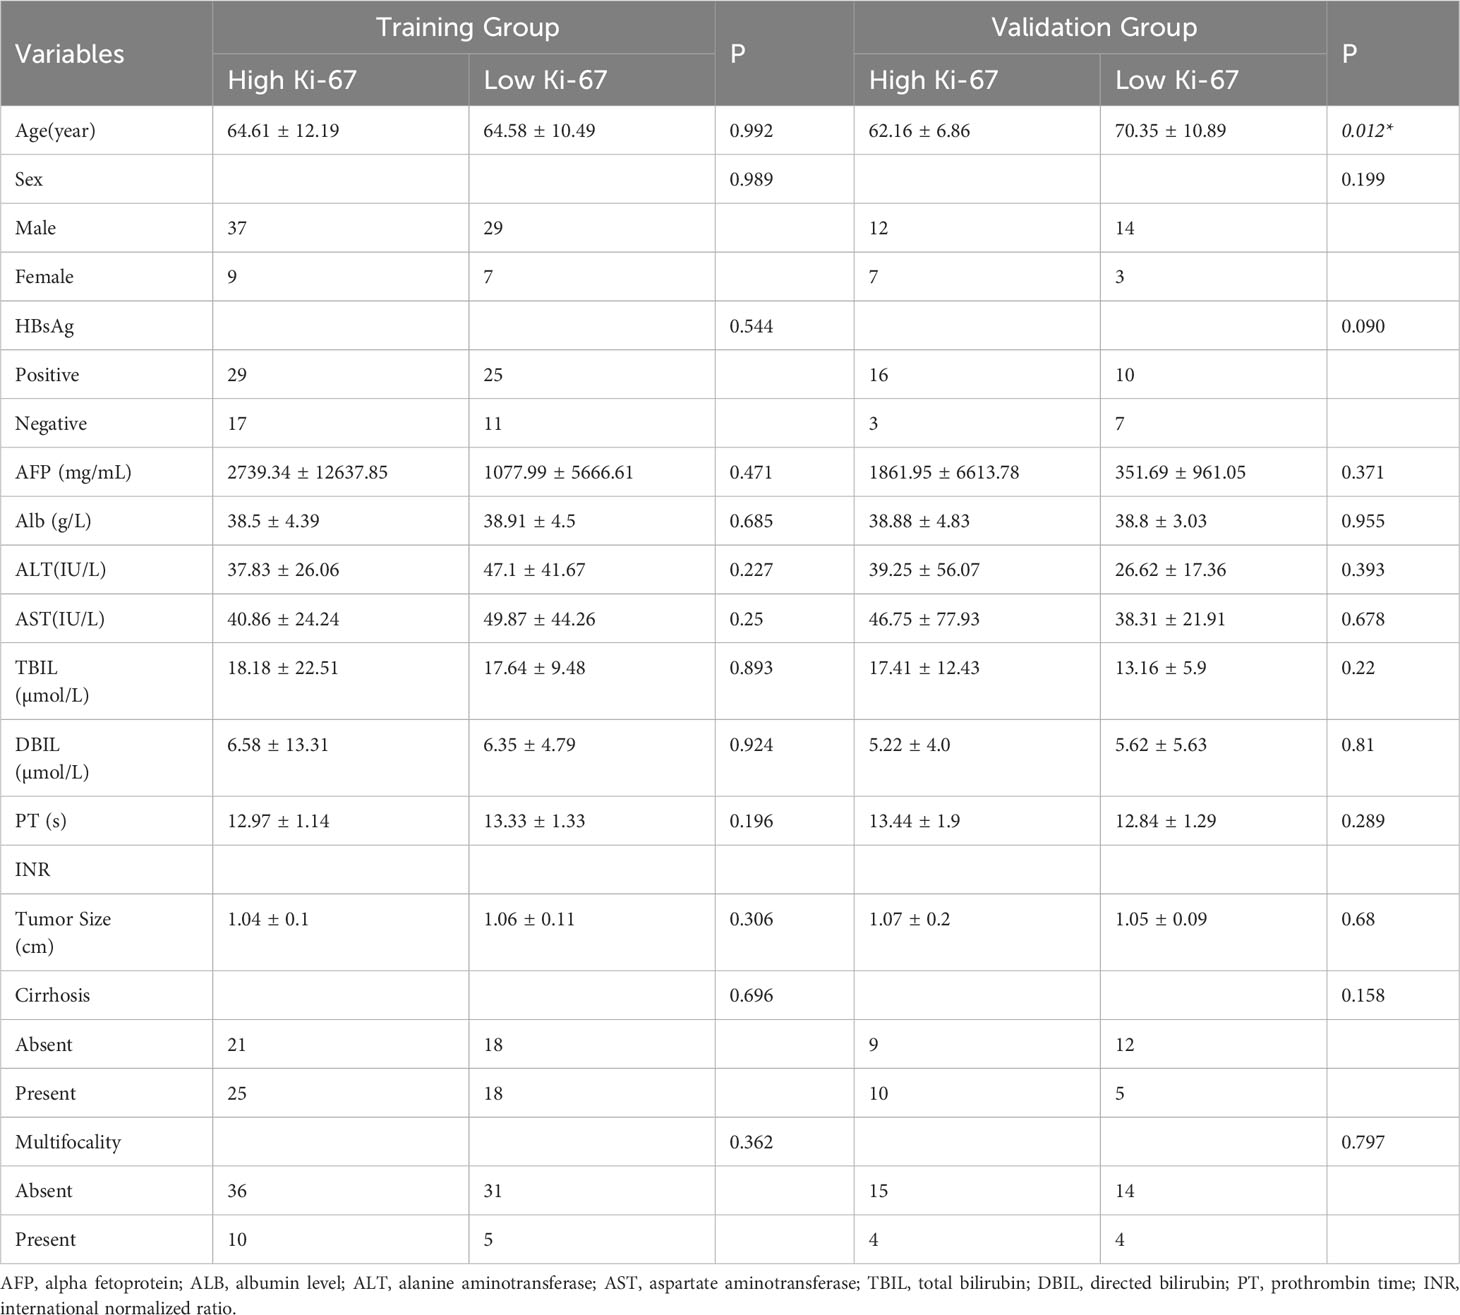
Table 2 Comparison of clinical characteristics between the high Ki-67 expression group and low Ki-67 expression group in training and validation groups.
3.2 Feature selection
We initially extracted 1595 features from both the original and filtered images, which were further refined by excluding 6 features in the intratumoral model, 19 features in the peritumoral model, and 22 features in combined model#2 based on their intra- and inter-class coefficients. To reduce dimensionality, we removed low variance radiomics features and those that were highly correlated (with an absolute Pearson correlation greater than 0.8) with any other feature. Further refinement was performed using T-test and LASSO regression, resulting in 7 radiomics features in the intratumoral model, 8 radiomics features in the peritumoral model, and 5 radiomics features in combined model#2 (Table 3). The detailed LASSO results of the intratumoral model, peritumoral model, and combined model#2 can be found in Supplementary Figure 1-3.
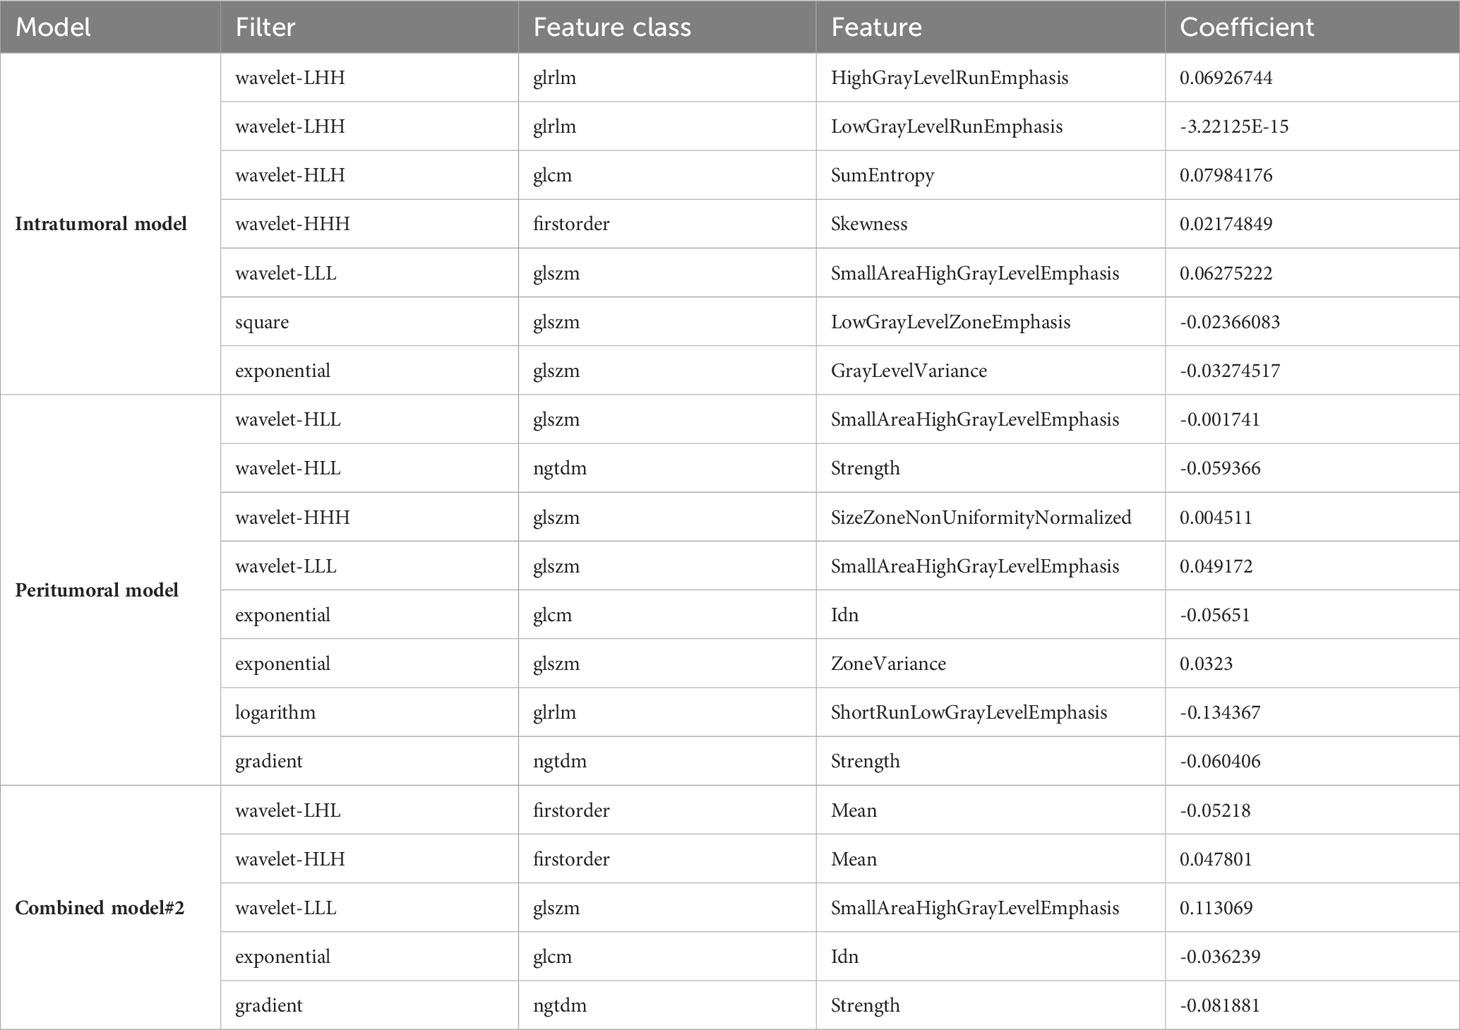
Table 3 The finally selected radiomics features and their coefficient values.
3.3 Intratumoral and peritumoral model
We utilized various modeling techniques, including Support Vector Machine (SVM), Random Forest (RF), K Nearest Neighbor (KNN), Logistic Regression (LR), and Artificial Neural Network (ANN), to identify the best modeling method.
In the intratumoral model, the SVM algorithm had an AUC of 0.796 (0.649-0.942), the RF algorithm had an AUC of 0.786 (0.637-0.936), the KNN algorithm had an AUC of 0.772 (0.619-0.926), the LR algorithm had an AUC of 0.777 (0.625-0.93), and the ANN algorithm had an AUC of 0.765 (0.609-0.921). The SVM classifier exhibited the highest performance in predicting Ki-67 expression in the intratumoral model.
Similarly, the SVM algorithm was the most effective in the peritumoral model with an AUC of 0.772 (0.619-0.926), while the RF algorithm had an AUC of 0.755 (0.597-0.914), the KNN algorithm had an AUC of 0.718 (0.551-0.886), the LR algorithm had an AUC of 0.749 (0.589-0.909), and the ANN algorithm had an AUC of 0.740 (0.578-0.902). The ROC curves for the validation groups in the intratumoral and peritumoral models were displayed in Figure 4.
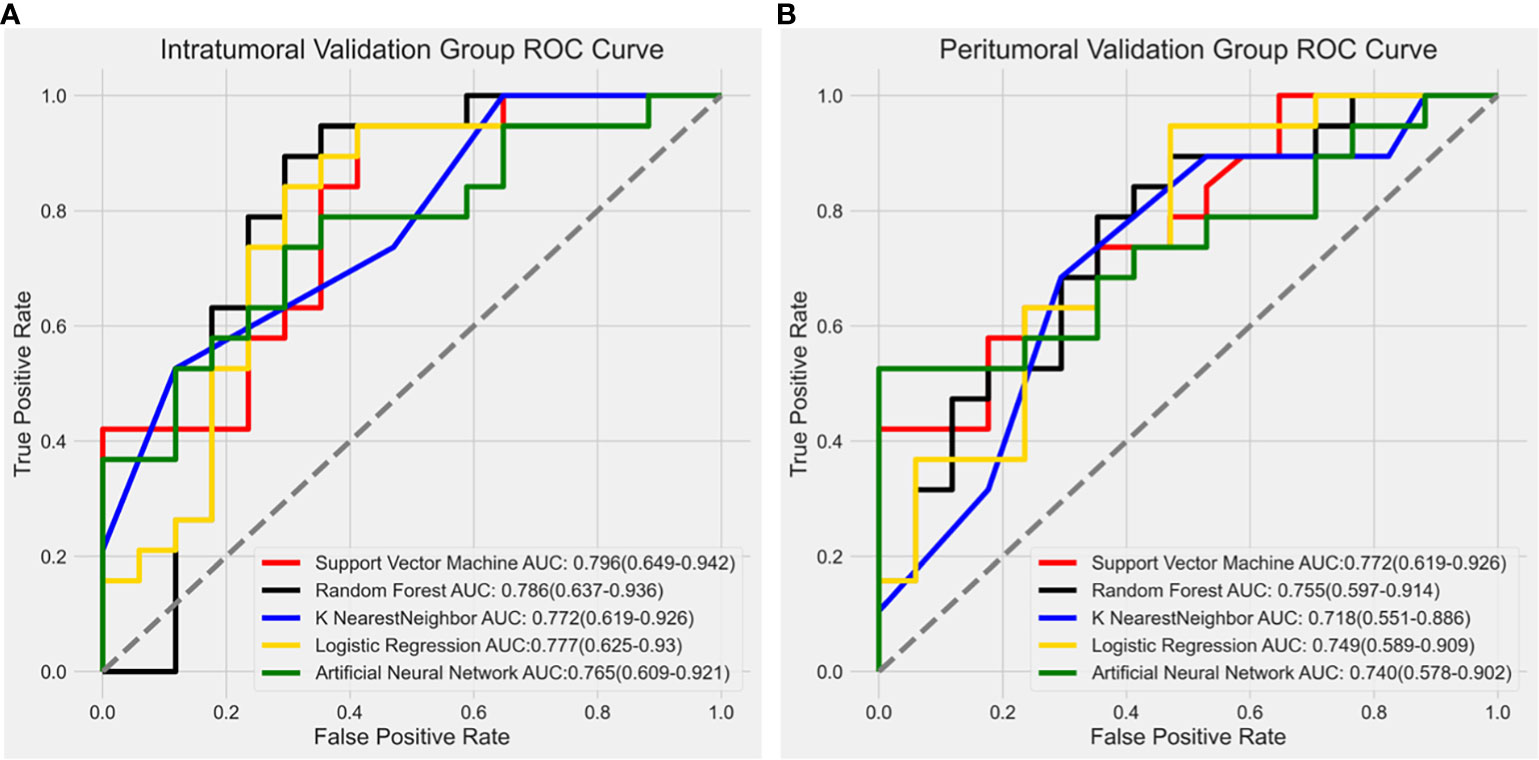
Figure 4 Receiver operating characteristic (ROC) curve results from different modeling methods in the intratumoral model and peritumoral model. The SVM algorithm showed the highest diagnostic performance with an AUC value of 0.796 (0.649-0.942) in the intratumoral model (A) and 0.772 (0.619-0.926) in the peritumoral model (B).
To better illustrate the performance of the model, we plotted a waterfall plot (Figure 5). The height of each bar in the chart represented the model predicted value minus the cut-off. The bars above the y=0 line indicate that the model predicts high Ki-67 expression, while the bars below the y=0 line indicate that the model predicts low Ki-67 expression. The results demonstrated the reliability of the intratumoral model and the peritumoral for evaluating Ki-67 expression levels in patients with HCC.
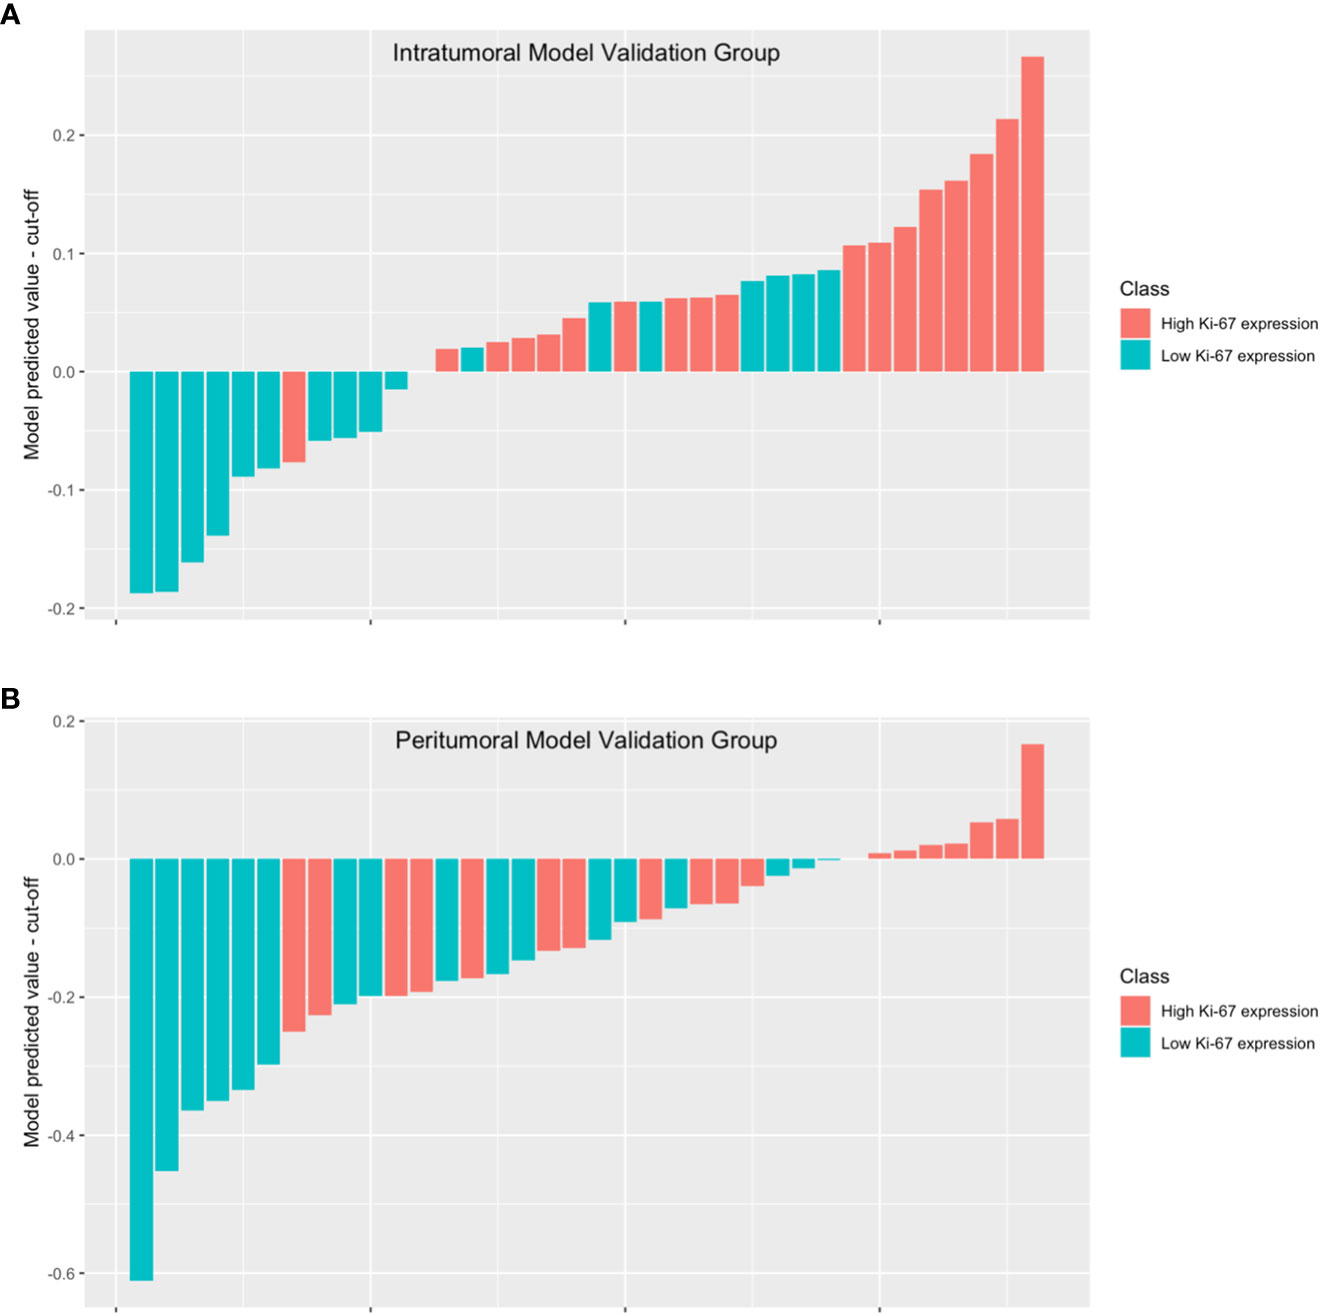
Figure 5 The waterfall plot displays the model’s performance in the intratumoral model validation group (A) and the peritumoral model validation group (B). The height of each bar in the chart represented the model predicted value minus the cut-off. The bars above the y=0 line indicate that the model predicts high Ki-67 expression, while the bars below the y=0 line indicate that the model predicts low Ki-67 expression.
3.4 Combined model
The combined model was built in two different ways: Combined model#1, using logistic analysis to combine the most effective intratumoral and peritumoral models; Combined model#2, by drawing the ROI, in which both the tumor and the tumor margin tissues were included.
In combined model#1, we adopted logistic regression to coalesce the outcome of the intratumoral model and the peritumoral model. The AUC of combined model#1 was 0.870 (0.751-0.989). According to the Delong test, we observed that combined model#1 demonstrated a significantly higher diagnostic efficacy in comparison to the peritumoral model (p < 0.05), yet not surpassing the intratumoral model (p = 0.269). In combined Model#2, akin to the intratumoral and peritumoral models, various modeling approaches were employed in the model building. The maximum AUC of combined Model#2 was 0.762 (0.605-0.918) with the application of a LR classifier (Figure 6). Both combined model#1 and combined model#2 could predict Ki-67 expression accurately (Figure 7).
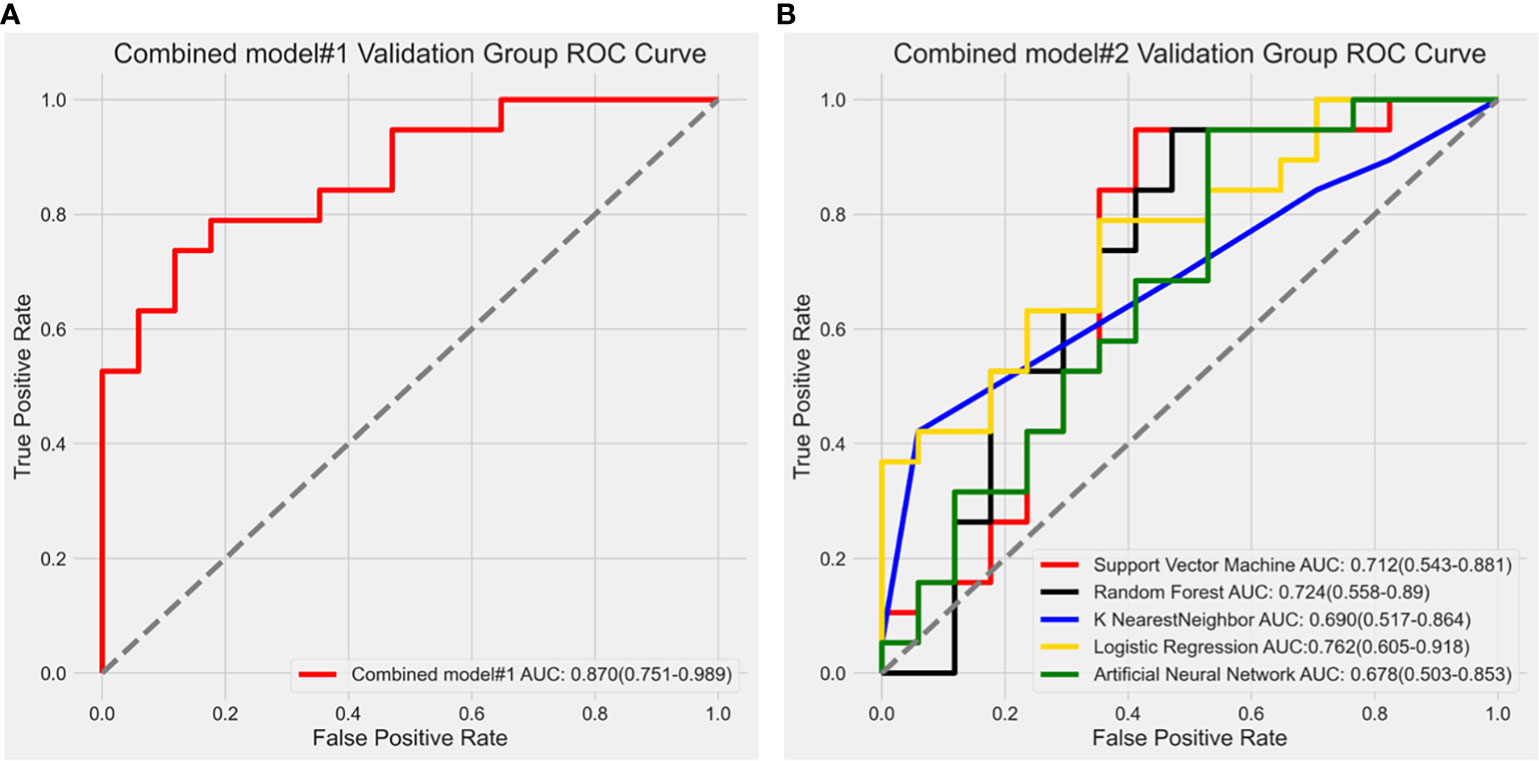
Figure 6 (A) Receiver operating characteristic curve analysis of combined model#1; (B) Receiver operating characteristic (ROC) curve results of different modeling methods in combined model#2. The LR algorithm showed the highest diagnostic performance with an AUC value of 0.762 (0.605-0.918).
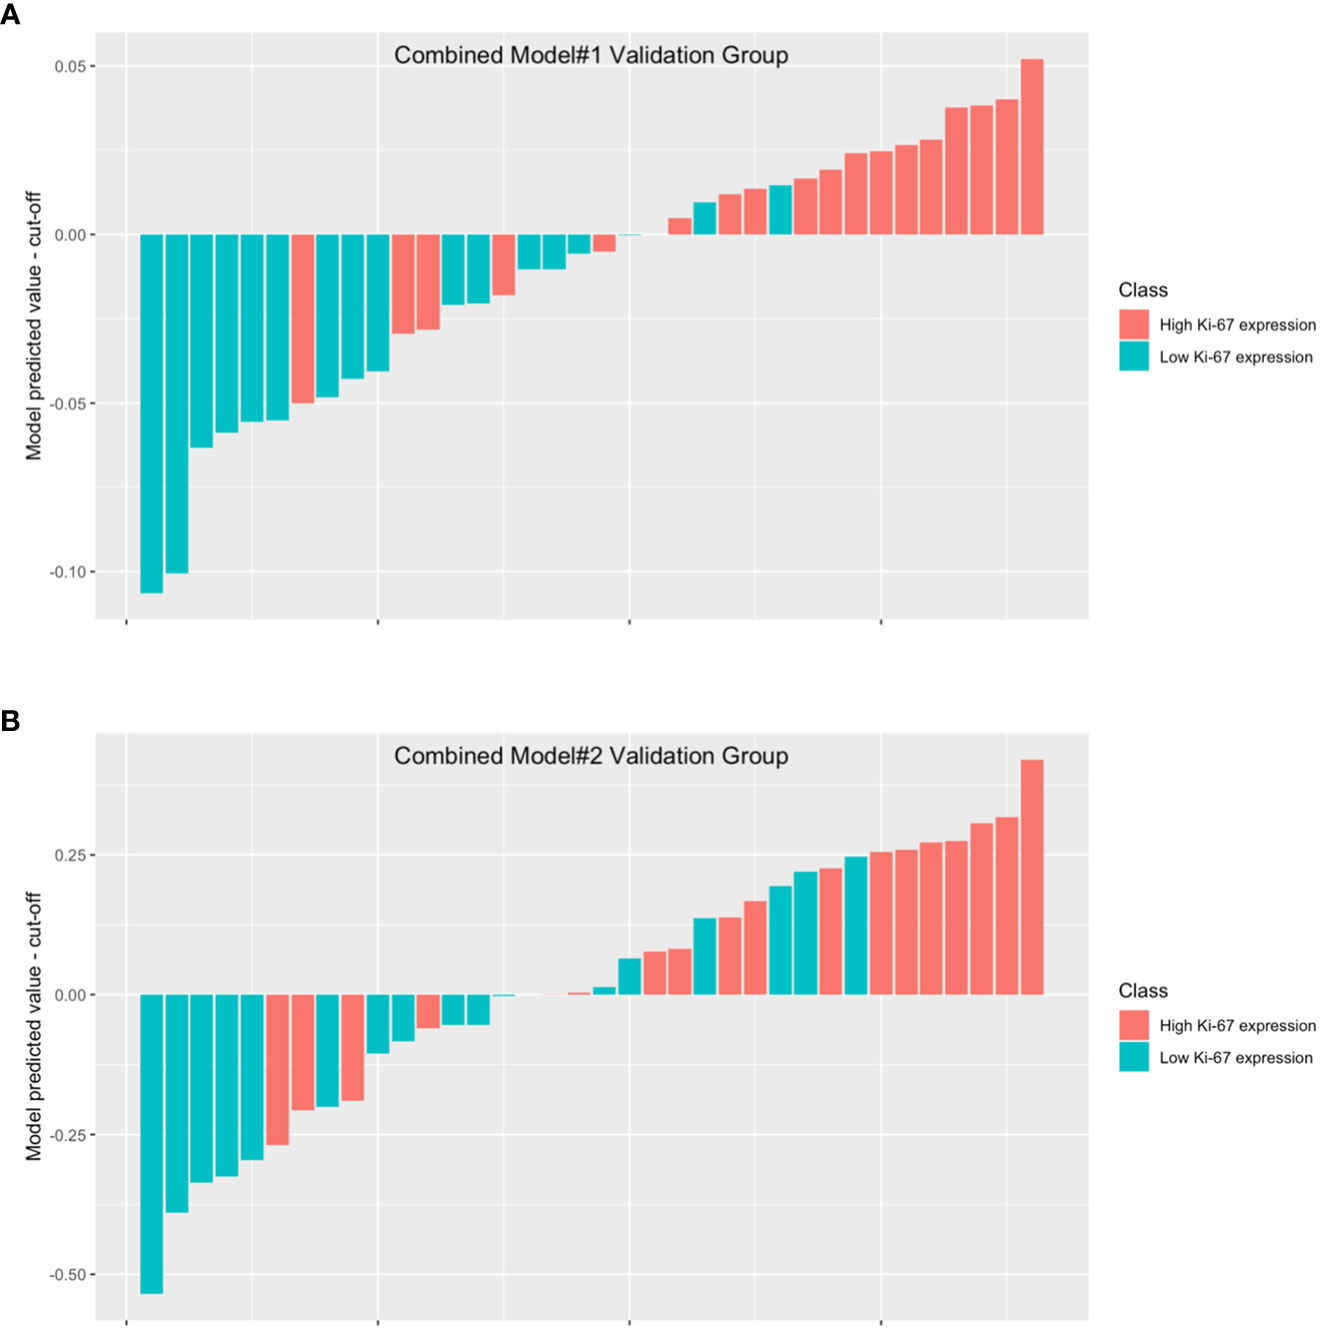
Figure 7 The waterfall plot displays the model’s performance in combined model#1 validation group (A) and combined model#2 validation group (B). The height of each bar in the chart represented the model predicted value minus the cut-off. The bars above the y=0 line indicate that the model predicts high Ki-67 expression, while the bars below the y=0 line indicate that the model predicts low Ki-67 expression.
No noteworthy disparity existed in the diagnostic prowess of combined model#2 in comparison to that of the intratumoral model (p = 0.734) or the peritumoral model (p = 0.596). Nevertheless, the diagnostic capability of combined model#2 was inferior to that of combined model#1 (p < 0.05).
Combined model#1 demonstrated the most noteworthy AUC in the four models. Calibration graphs of combined model#1 and Hosmer-Lemeshow test exposed a satisfactory concurrence between the anticipated and pathologically affirmed Ki-67 status (P = 0.663). Using DCA, the performances of all models were evaluated. Each model showed a higher area under the decision curve than the “treat all” (solid gray line) or “treat none” (dotted gray line) approaches. Out of the four prediction models, combined model#1 had the greatest area under the decision curve and exhibited the most benefit over a wide range of threshold probabilities (Figure 8).
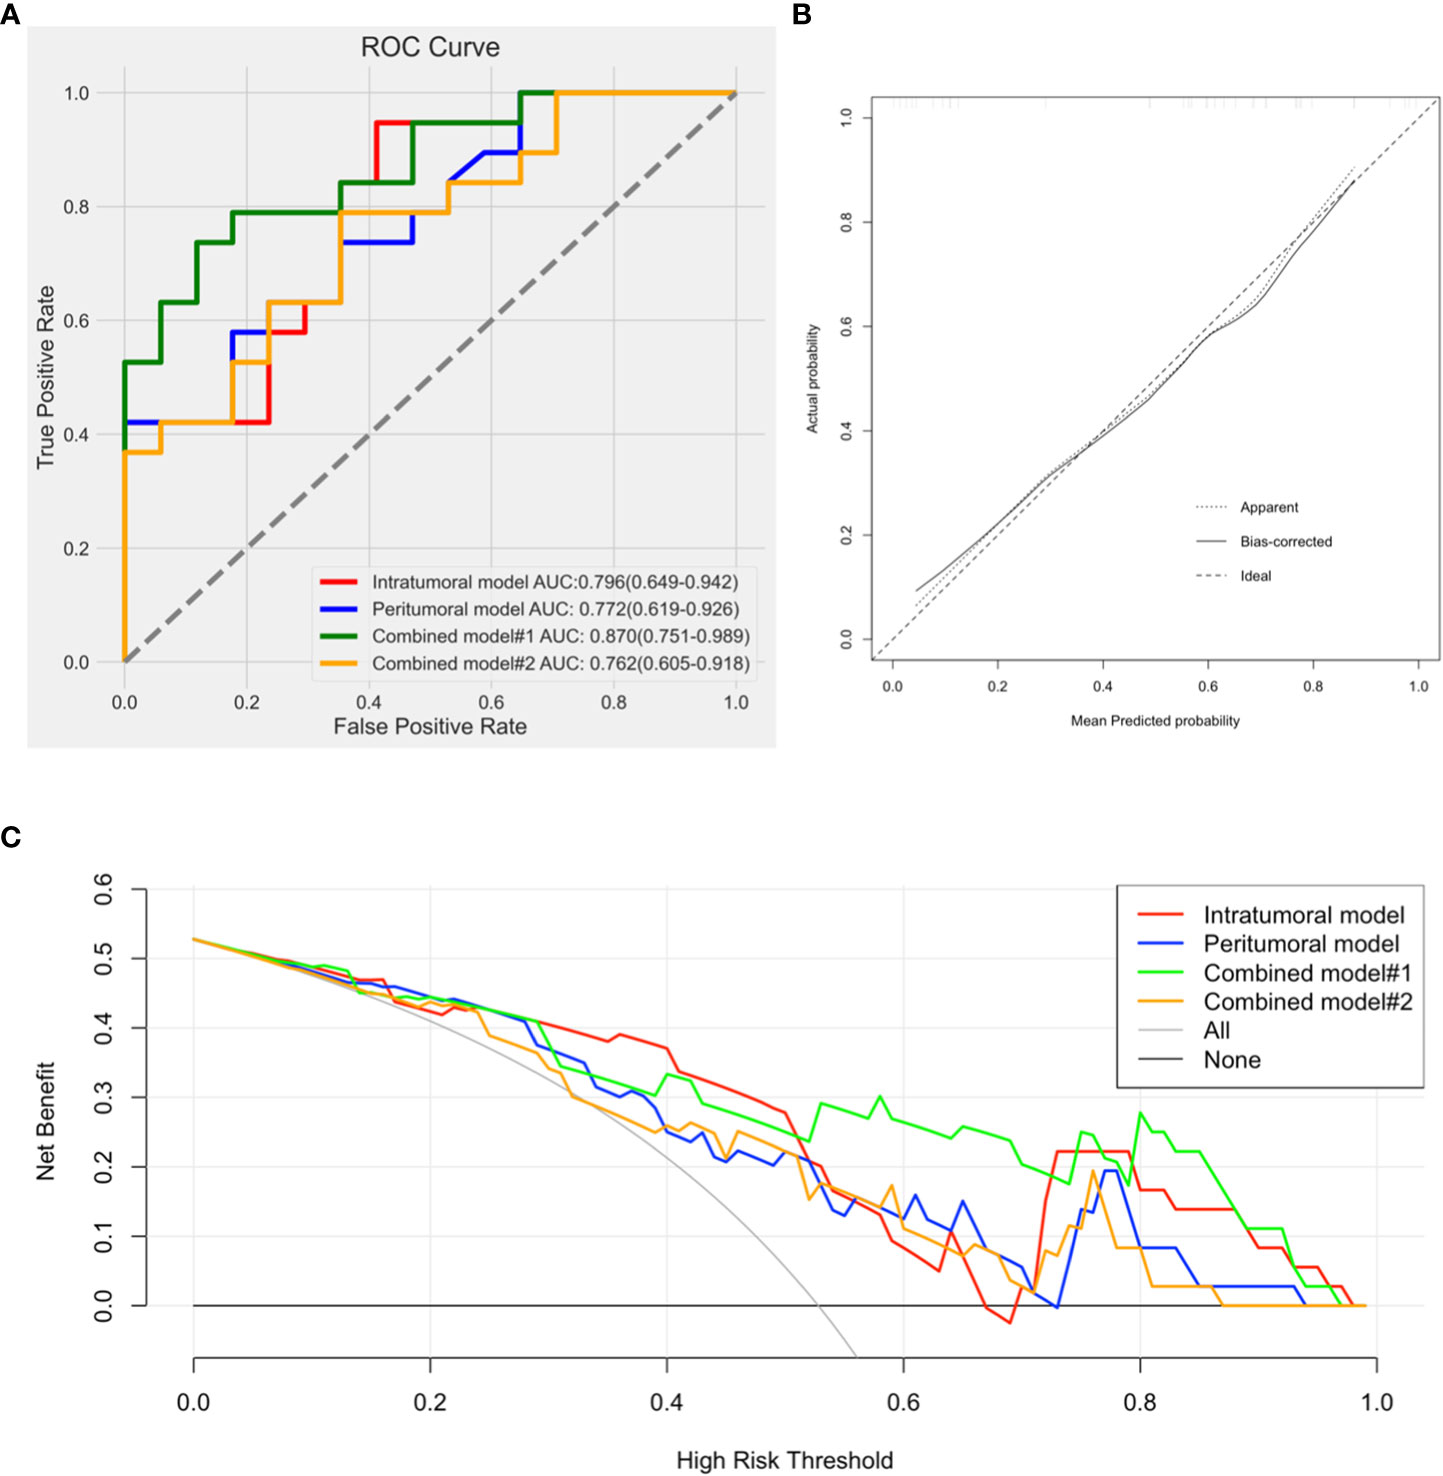
Figure 8 (A). Comparison of receiver operating characteristic curves for differentiation of the four models; (B). Calibration curve of combined model#1 presented a good agreement between the predicted and pathologically confirmed Ki-67 status with dotted line (actual calibration) closed to dashed line (perfect calibration); (C). Decision curves for the intratumoral model, peritumoral model, combined model#1, and combined model#2.
We observed combined model#1 had the largest AUC, accuracy, and F1-score in the four models (Table 4).
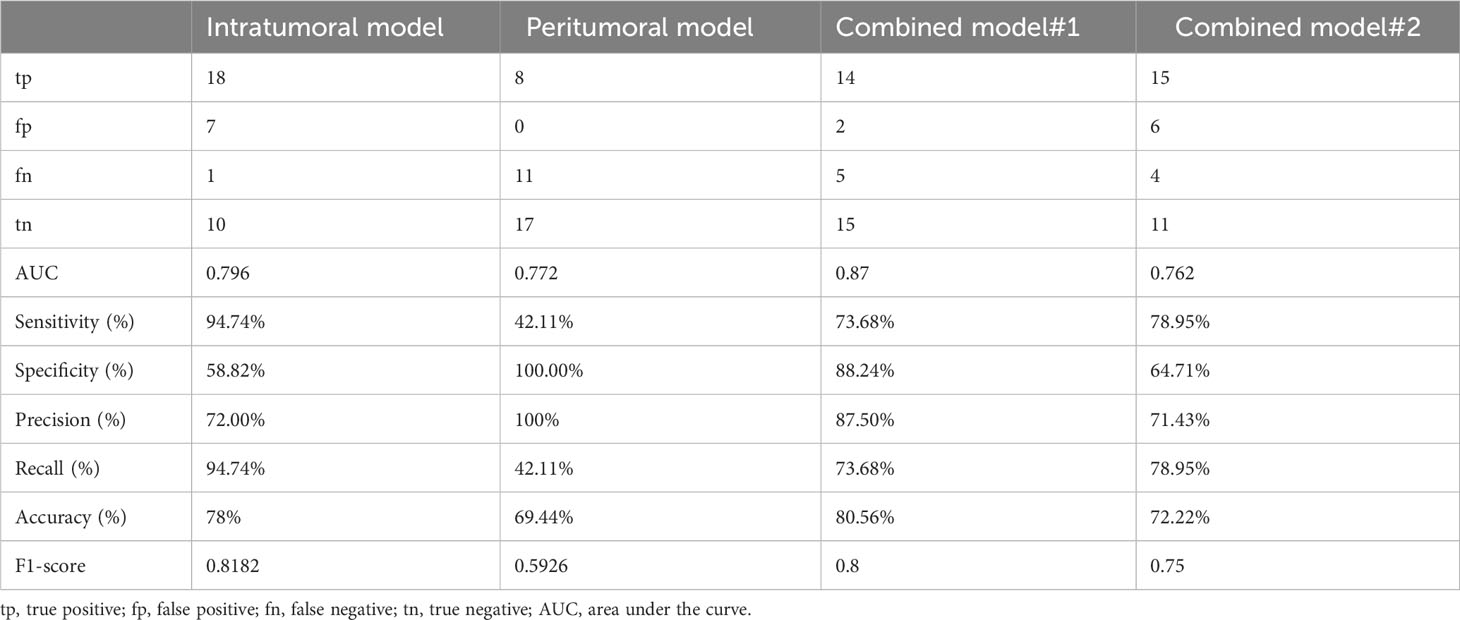
Table 4 The performance of the intratumoral model, peritumoral model, combined model#1, and combined model#2 in predicting Ki-67 expression.
4 Discussion
We evaluated the performance of an ultrasound radiomics model for preoperative prediction of Ki-67 expression in HCC patients. The study showed that the model, based on both intratumoral and peritumoral tissues, exhibited excellent performance and generalization ability in predicting Ki-67 expression. As far as we know, this is the first study to assess the reliability of such an ultrasound radiomics model that combines both intratumoral and peritumoral tissues for predicting Ki-67 expression.
In our study, both the radiomics models based on intratumoral and peritumoral tissues demonstrated accurate prediction of Ki-67 expression. The intratumoral model had an AUC of 0.796(0.649-0.942), while the peritumoral model had an AUC of 0.772(0.619-0.926). Furthermore, the Delong test revealed no significant difference in diagnostic performance between the two models, suggesting that peritumoral tissues also provide valuable information for predicting Ki-67 expression.
Our study combined both intra-tumor and peri-tumor tissues in the analysis, providing a more comprehensive representation of the tissue microenvironment surrounding the tumor. Combined model#1 showed better diagnostic performance than the peritumoral model, but not the intratumoral model. This result demonstrated the capability of the intratumoral model. Although no significant difference was found between the intratumoral and combined model#1, incorporating the peritumoral model contributed to a larger AUC, accuracy, F1-score, and a better DCA result. Compared to other radiomics models that only focus on intratumoral tissue, our study may provide improved accuracy and robustness in predicting Ki-67 expression in HCC. The additional information from the peritumoral tissue can help to better capture the tumor biology and heterogeneity as supplemental data in combined model#1.
We combined intratumoral and peritumoral tissues in two ways: using logistic regression to combine the models, or including both regions in the ROI. The combined model using logistic regression achieved better diagnostic performance, likely because it takes into account the interplay between the intratumoral and peritumoral features in a more sophisticated way. Logistic regression is a statistical model that can be used to predict a binary outcome based on a set of input features (25). In our study, the outcome was the expression of Ki-67 in HCC, and the input features were the radiomics features from both the intratumoral and peritumoral regions. By using logistic regression to combine the radiomics models, we can take into account the interplay between the intratumoral and peritumoral features in a more nuanced way. The logistic regression model can learn the relationship between the features, and weigh each feature according to its contribution to the prediction. This can help to identify the most important features and improve the overall accuracy of the model. In contrast, simply including both the intratumoral and peritumoral regions in the ROI may not fully capture the interplay between the features. This approach may also result in larger ROIs, which can increase the noise and variability in the features, and may not effectively capture the most important features for the prediction (26, 27). We think the use of logistic regression to combine the radiomics models was a more sophisticated approach that can take into account the relationship between the features in a more effective way, and can help to improve the accuracy of the prediction of Ki-67 expression in HCC.
Radiomics features can be grouped into first-order, second-order, and high-order ones. First-order, or histogram features, refer to gray-level values of single voxels, not considering spatial correlations. Second-order, typically called texture analysis, depict spatial relationships between voxels with similar gray levels within lesions (28), usually GLCM and GLRLM being used to indicate tumor heterogeneity and complexity (29, 30). High-order features are derived from filters applied to images, such as Wavelet, LoG, Square, SquareRoot, Exponential, Logarithm, and Gradient (31), gathering more hidden information from images (32). Most radiomics models were based on low-order features (first-order or second-order), with little evidence of whether whole-order radiomics features (first-order, second-order, and high-order) can predict Ki-67 expression in HCC patients. We obtained eight radiomics features, five of them being wavelet features, the result suggesting wavelet is essential for predicting pathological results, as in previous studies (33, 34). Wavelet filter divides images into sub-images of different frequency components, allowing to explore spatial heterogeneity within ROIs at multiple scales (34). Wavelets are mathematical functions that can be used to analyze signals and images in a multi-scale manner, allowing for the extraction of features at different levels of detail. In the context of HCC evaluation, wavelet features may be useful in capturing the complex patterns of Ki-67 expression that are associated with the cellular proliferation and aggressiveness of the tumor. Additionally, wavelets have been successfully used in other imaging-based studies to extract features that are indicative of specific biological processes (35). The fact that wavelet features were found to be the most predictive in our study suggested that they are capturing relevant information about Ki-67 expression in HCC and that they may be particularly well-suited for this type of analysis. In our opinion, the use of wavelet features in predicting Ki-67 expression in HCC highlights the potential of multi-scale analysis for radiomics studies and provides a promising direction for future research in this area.
There is ongoing research to identify clinical parameters that can accurately predict Ki-67 expression preoperatively in patients with HCC. Currently, there is no established clinical parameter or combination of parameters that can reliably predict Ki-67 expression in HCC. However, several factors have been associated with increased Ki-67 expression, including larger tumor size, higher serum alpha-fetoprotein levels, and the presence of vascular invasion (15, 24, 36). Other factors, such as age, underlying liver disease, and liver function, may also play a role in determining Ki-67 expression in HCC (37, 38). In our research, only age was found to be significantly different between the high Ki-67 expression group and the low Ki-67 expression group in the validation set. And there was no significant difference in other clinical parameters between low and high ki-67 expression groups. We think the relationship between clinical parameters and Ki-67 expression in HCC is complex and predicting Ki-67 expression only by clinical parameters is difficult.
Our research has demonstrated that ultrasound based radiomics analysis of intratumoral and peritumoral tissues can provide valuable pathological information about HCC. We hope that our study can offer insights into challenging issues, such as the monitoring strategy for early or very early stages of liver cancer, in which the exact value of ultrasound is subject to certain controversies. Park HJ et al. (39) thought that while ultrasound holds some value in the surveillance of HCC, its sensitivity is relatively low, particularly in the early and very early stages of liver cancer. Therefore, it is recommended to complement ultrasound with other imaging techniques such as CT and MRI. However, both the Japanese guidelines and the American Association for the Study of Liver Diseases guidelines endorse ultrasound surveillance for early detection of HCC in patients with cirrhosis or chronic hepatitis B. Furthermore, the ultrasound contrast agent Sonazoid can provide insights into the blood supply features of HCC, assisting in determining the need for treatment in low-vascularity nodules smaller than 1cm (21). A meta-analysis suggested combining ultrasound with AFP significantly increases early HCC detection, making it a preferred surveillance strategy for cirrhosis patients until better options are available (40). We hope radiomics may provide valuable insights to help ultrasound overcome these limitations (41).
There were some limitations in our study: First, this was a single-center study, which may not represent the population of interest as a whole. Second, the sample of our study was small. The small sample size may limit the ability to control for potential confounding factors, such as age, sex, and comorbidities, which may affect outcomes. Third, this was a retrospective study, which may introduce potential selective bias. Fourth, the influence of different ultrasound devices was not analyzed in our study, which may affect the reproducibility and generalizability of the radiomics model. Fifth, it should be noted that all patients included in our study were surgical cases, which might introduce a certain degree of selection bias as individuals with advanced stages who were not eligible for surgical treatment were not included in the study. This limitation may impact the generalizability of the findings to the broader patient population with the condition under investigation. Finally, we did not select the entire tumor as the ROI but chose the section where the tumor had the maximum diameter. This may lead to the loss of partial information, and the obtained radiomic features may not represent the entire tumor.
5 Conclusion
We provided an ultrasound radiomics model combining intratumoral and peritumoral tissues which could accurately predict Ki-67 expression in patients with HCC patients. By combining both intratumoral and peritumoral information, our model may provide a more comprehensive picture of the disease and may help to improve patient prognosis and treatment planning. According to our view, the use of both intratumoral and peritumoral tissue in the radiomics model was a unique and valuable approach that can provide new insights into the biology of HCC and help to improve patient care.
Data availability statement
The raw data supporting the conclusions of this article will be made available by the authors, without undue reservation.
Ethics statement
The studies involving humans were approved by Ethics Committee of Shaoxing people’s Hospital. The studies were conducted in accordance with the local legislation and institutional requirements. The participants provided their written informed consent to participate in this study.
Author contributions
HQ: Methodology, Software, Validation, Writing - Original Draft, Funding; ZS: Conceptualization, Methodology, Visualization, Supervision; DZ: Investigation, Data Curation; YH: Data Curation, Writing - Review & Editing, Formal analysis. All authors contributed to the article and approved the submitted version
Funding
The work was sponsored by Science and Technology Program Project of Shaoxing (2022A14020) and Health Science and Technology Program Project of Shaoxing (2022KY019). The funder did not influence the analysis or publication.
Conflict of interest
The authors declare that the research was conducted in the absence of any commercial or financial relationships that could be construed as a potential conflict of interest.
Publisher’s note
All claims expressed in this article are solely those of the authors and do not necessarily represent those of their affiliated organizations, or those of the publisher, the editors and the reviewers. Any product that may be evaluated in this article, or claim that may be made by its manufacturer, is not guaranteed or endorsed by the publisher.
Supplementary material
The Supplementary Material for this article can be found online at: https://www.frontiersin.org/articles/10.3389/fonc.2023.1209111/full#supplementary-material
Abbreviations
HCC, Hepatocellular carcinoma; PI, proliferation index; CT, computer tomography; MRI, magnetic resonance imaging; ROI, region of interest; ICC, inter-/intra-class coefficients; LASSO, least absolute shrinkage and selection operator; ROC, receiver operating characteristic; AUC, area under the curve; DCA, decision curve analysis; SVM, support vector machine; RF, random forest; KNN, K nearest neighbor; LR, logistic regression; ANN, artificial neural network.
References
1. Sung H, Ferlay J, Siegel RL, Laversanne M, Soerjomataram I, Jemal A, et al. Global cancer statistics 2020: GLOBOCAN estimates of incidence and mortality worldwide for 36 cancers in 185 countries. CA: Cancer J Clin (2021) 71(3):209–49. doi: 10.3322/caac.21660
2. Fujiwara N, Friedman SL, Goossens N, Hoshida Y. Risk factors and prevention of hepatocellular carcinoma in the era of precision medicine. J Hepatol. (2018) 68(3):526–49. doi: 10.1016/j.jhep.2017.09.016
3. Wei W, Jian P-E, Li S-H, Guo Z-X, Zhang Y-F, Ling Y-H, et al. Adjuvant transcatheter arterial chemoembolization after curative resection for hepatocellular carcinoma patients with solitary tumor and microvascular invasion: a randomized clinical trial of efficacy and safety. Cancer Commun (Lond) (2018) 38(1):61. doi: 10.1186/s40880-018-0331-y
4. Gerdes J, Lemke H, Baisch H, Wacker HH, Schwab U, Stein H. Cell cycle analysis of a cell proliferation-associated human nuclear antigen defined by the monoclonal antibody Ki-67. J Immunol (1984) 133(4):1710–5. doi: 10.4049/jimmunol.133.4.1710
5. Cao Y, Ke R, Wang S, Zhu X, Chen J, Huang C, et al. DNA topoisomerase IIα and Ki67 are prognostic factors in patients with hepatocellular carcinoma. Oncol Lett (2017) 13(6):4109–16. doi: 10.3892/ol.2017.5999
6. Fan M, Cheng H, Zhang P, Gao X, Zhang J, Shao G, et al. DCE-MRI texture analysis with tumor subregion partitioning for predicting Ki-67 status of estrogen receptor-positive breast cancers. J Magnetic Resonance Imaging JMRI (2018) 48(1):237–47. doi: 10.1002/jmri.25921
7. Lei B, Liu S, Qi W, Zhao Y, Li Y, Lin N, et al. PBK/TOPK expression in non-small-cell lung cancer: its correlation and prognostic significance with Ki67 and p53 expression. Histopatholog. (2013) 63(5):696–703. doi: 10.1111/his.12215
8. Lobo J, Rodrigues Â, Antunes L, Graça I, Ramalho-Carvalho J, Vieira FQ, et al. High immunoexpression of Ki67, EZH2, and SMYD3 in diagnostic prostate biopsies independently predicts outcome in patients with prostate cancer. Urol Oncol (2018) 36(4):161.e7–161.e17. doi: 10.1016/j.urolonc.2017.10.028
9. Luo Y, Ren F, Liu Y, Shi Z, Tan Z, Xiong H, et al. Clinicopathological and prognostic significance of high Ki-67 labeling index in hepatocellular carcinoma patients: a meta-analysis. Int J Clin Exp Med (2015) 8(7):10235–47.
10. Lambin P, Rios-Velazquez E, Leijenaar R, Carvalho S, van Stiphout RGPM, Granton P, et al. Radiomics: extracting more information from medical images using advanced feature analysis. Eur J Cancer (2012) 48(4):441–6. doi: 10.1016/j.ejca.2011.11.036
11. Lambin P, Leijenaar RTH, Deist TM, Peerlings J, de Jong EEC, van Timmeren J, et al. Radiomics: the bridge between medical imaging and personalized medicine. Nat Rev Clin Oncol (2017) 14(12):749–62. doi: 10.1038/nrclinonc.2017.141
12. Wang X, Agyekum EA, Ren Y, Zhang J, Zhang Q, Sun H, et al. A radiomic nomogram for the ultrasound-based evaluation of extrathyroidal extension in papillary thyroid carcinoma. Front Oncol (2021) 11:625646. doi: 10.3389/fonc.2021.625646
13. Zhou S-C, Liu T-T, Zhou J, Huang Y-X, Guo Y, Yu J-H, et al. An ultrasound radiomics nomogram for preoperative prediction of central neck lymph node metastasis in papillary thyroid carcinoma. Front Oncol (2020) 10:1591. doi: 10.3389/fonc.2020.01591
14. Wu H, Han X, Wang Z, Mo L, Liu W, Guo Y, et al. Prediction of the Ki-67 marker index in hepatocellular carcinoma based on CT radiomics features. Phys Med Biol (2020) 65(23):235048. doi: 10.1088/1361-6560/abac9c
15. Fan Y, Yu Y, Wang X, Hu M, Hu C. Radiomic analysis of Gd-EOB-DTPA-enhanced MRI predicts Ki-67 expression in hepatocellular carcinoma. BMC Med Imaging (2021) 21(1):100. doi: 10.1186/s12880-021-00633-0
16. Wang Q-S, Chen C, Zhan J, Fang X-F, Chen GG, Yang S-L, et al. Peritumoral overexpression of ZBP-89 is associated with unfavorable disease-free survival rates in patients with hepatocellular carcinoma following hepatectomy. Oncol Lett (2018) 15(5):7828–36. doi: 10.3892/ol.2018.8353
17. Li C, Song L, Yin J. Intratumoral and peritumoral radiomics based on functional parametric maps from breast DCE-MRI for prediction of HER-2 and ki-67 status. J Magn Reson Imaging (2021) 54(3):703–14. doi: 10.1002/jmri.27651
18. Wang X, Sun Y, Zhou X, Shen Z, Zhang H, Xing J, et al. Histogram peritumoral enhanced features on MRI arterial phase with extracellular contrast agent can improve prediction of microvascular invasion of hepatocellular carcinoma. Quant Imaging Med Surg (2022) 12(2):1372–84. doi: 10.21037/qims-21-499
19. Dong Y, Zhou L, Xia W, Zhao X-Y, Zhang Q, Jian J-M, et al. Preoperative prediction of microvascular invasion in hepatocellular carcinoma: initial application of a radiomic algorithm based on grayscale ultrasound images. Front Oncol (2020) 10:353. doi: 10.3389/fonc.2020.00353
20. Zhang Y, Numata K, Du Y, Maeda S. Contrast agents for hepatocellular carcinoma imaging: value and progression. Front Oncol (2022) 12:921667. doi: 10.3389/fonc.2022.921667
21. Renzulli M, Golfieri R. Proposal of a new diagnostic algorithm for hepatocellular carcinoma based on the Japanese guidelines but adapted to the Western world for patients under surveillance for chronic liver disease. J Gastroenterol Hepatol (2016) 31(1):69–80. doi: 10.1111/jgh.13150
22. Hu H-T, Wang Z, Huang X-W, Chen S-L, Zheng X, Ruan S-M, et al. Ultrasound-based radiomics score: a potential biomarker for the prediction of microvascular invasion in hepatocellular carcinoma. Eur Radiol (2019) 29(6):2890–901. doi: 10.1007/s00330-018-5797-0
23. Nagtegaal ID, Odze RD, Klimstra D, Paradis V, Rugge M, Schirmacher P, et al. The 2019 WHO classification of tumours of the digestive system. Histopathology (2020) 76(2):182–8. doi: 10.1111/his.13975
24. Hu X, Zhou J, Li Y, Wang Y, Guo J, Sack I, et al. Added value of viscoelasticity for MRI-based prediction of ki-67 expression of hepatocellular carcinoma using a deep learning combined radiomics (DLCR) model. Cancers (Basel) (2022) 14(11):2575. doi: 10.3390/cancers14112575
25. Hosmer DW, Lemeshow S, Sturdivant RX. Introduction to the logistic regression model. Appl Logistic Regression (2000) 2:1–30. doi: 10.1002/9781118548387
26. Wegrzyn M, Riehle M, Labudda K, Woermann F, Baumgartner F, Pollmann S, et al. Investigating the brain basis of facial expression perception using multi-voxel pattern analysis. Cortex (2015) 69:131–40. doi: 10.1016/j.cortex.2015.05.003
27. Hall ME, Jordan JH, Juncos LA, Hundley WG, Hall JE. BOLD magnetic resonance imaging in nephrology. Int J Nephrol Renovasc Dis (2018) 11:103–12. doi: 10.2147/IJNRD.S112299
28. Incoronato M, Aiello M, Infante T, Cavaliere C, Grimaldi AM, Mirabelli P, et al. Radiogenomic analysis of oncological data: A technical survey. Int J Mol Sci (2017) 18(4):805. doi: 10.3390/ijms18040805
29. Li Z, Mao Y, Huang W, Li H, Zhu J, Li W, et al. Texture-based classification of different single liver lesion based on SPAIR T2W MRI images. BMC Med Imaging (2017) 17(1):42. doi: 10.1186/s12880-017-0212-x
30. Han Y, Wang W, Yang Y, Sun Y-Z, Xiao G, Tian Q, et al. Amide proton transfer imaging in predicting isocitrate dehydrogenase 1 mutation status of grade II/III gliomas based on support vector machine. Front Neurosci (2020) 14:144. doi: 10.3389/fnins.2020.00144
31. Gillies RJ, Kinahan PE, Hricak H. Radiomics: images are more than pictures, they are data. Radiology (2016) 278(2):563–77. doi: 10.1148/radiol.2015151169
32. Zwanenburg A, Vallières M, Abdalah MA, Aerts HJWL, Andrearczyk V, Apte A, et al. The image biomarker standardization initiative: standardized quantitative radiomics for high-throughput image-based phenotyping. Radiology (2020) 295(2):328–38. doi: 10.1148/radiol.2020191145
33. Xu L, Yang P, Liang W, Liu W, Wang W, Luo C, et al. A radiomics approach based on support vector machine using MR images for preoperative lymph node status evaluation in intrahepatic cholangiocarcinoma. Theranostics (2019) 9(18):5374–85. doi: 10.7150/thno.34149
34. Wu S, Zheng J, Li Y, Yu H, Shi S, Xie W, et al. A radiomics nomogram for the preoperative prediction of lymph node metastasis in bladder cancer. Clin Cancer Res (2017) 23(22):6904–11. doi: 10.1158/1078-0432.CCR-17-1510
35. Chaddad A, Daniel P, Niazi T. Radiomics evaluation of histological heterogeneity using multiscale textures derived from 3D wavelet transformation of multispectral images. Front Oncol (2018) 8:96. doi: 10.3389/fonc.2018.00096
36. Huang Z, Zhou P, Li S, Li K. Prediction of the Ki-67 marker index in hepatocellular carcinoma based on Dynamic Contrast-Enhanced Ultrasonography with Sonazoid. Insights Imaging (2022) 13(1):199. doi: 10.1186/s13244-022-01320-6
37. Liu Z, Yang S, Chen X, Luo C, Feng J, Chen H, et al. Nomogram development and validation to predict Ki-67 expression of hepatocellular carcinoma derived from Gd-EOB-DTPA-enhanced MRI combined with T1 mapping. Front Oncol (2022) 12:954445. doi: 10.3389/fonc.2022.954445
38. Hu X-X, Yang Z-X, Liang H-Y, Ding Y, Grimm R, Fu C-X, et al. Whole-tumor MRI histogram analyses of hepatocellular carcinoma: Correlations with Ki-67 labeling index. J Magn Reson Imaging (2017) 46(2):383–92. doi: 10.1002/jmri.25555
39. Park HJ, Jang HY, Kim SY, Lee SJ, Won HJ, Byun JH, et al. Non-enhanced magnetic resonance imaging as a surveillance tool for hepatocellular carcinoma: Comparison with ultrasound. J Hepatol (2020) 72(4):718–24. doi: 10.1016/j.jhep.2019.12.001
40. Tzartzeva K, Obi J, Rich NE, Parikh ND, Marrero JA, Yopp A, et al. Surveillance imaging and alpha fetoprotein for early detection of hepatocellular carcinoma in patients with cirrhosis: A meta-analysis. Gastroenterology (2018) 154(6):1706–1718.e1. doi: 10.1053/j.gastro.2018.01.064
Keywords: hepatocellular cancer, ultrasonography, Ki-67 Antigen, radiomics, machine learning, computer assisted diagnosis
Citation: Qian H, Shen Z, Zhou D and Huang Y (2023) Intratumoral and peritumoral radiomics model based on abdominal ultrasound for predicting Ki-67 expression in patients with hepatocellular cancer. Front. Oncol. 13:1209111. doi: 10.3389/fonc.2023.1209111
Received: 20 April 2023; Accepted: 09 August 2023;
Published: 24 August 2023.
Edited by:
Alessio G. Morganti, University of Bologna, ItalyCopyright © 2023 Qian, Shen, Zhou and Huang. This is an open-access article distributed under the terms of the Creative Commons Attribution License (CC BY). The use, distribution or reproduction in other forums is permitted, provided the original author(s) and the copyright owner(s) are credited and that the original publication in this journal is cited, in accordance with accepted academic practice. No use, distribution or reproduction is permitted which does not comply with these terms.
*Correspondence: Yanhua Huang, YWxpY2U4ODA3MTFAMTYzLmNvbQ==
†The authors have contributed equally to this work