ERRATUM article

Front. Oncol., 24 May 2023

Sec. Cancer Imaging and Image-directed Interventions

Volume 13 - 2023 | https://doi.org/10.3389/fonc.2023.1217461

Erratum: Imaging biomarkers of glioblastoma treatment response: a systematic review and meta-analysis of recent machine learning studies

  • FP

    Frontiers Production Office *

  • Frontiers Media SA, Lausanne, Switzerland

Due to a production error, there was an error in the published Table 1. The 4th row of the table started at the second column instead of the first column, causing the contents of the last column to move to the next row, resulting in a formatting error. The corrected Table 1 appears below.
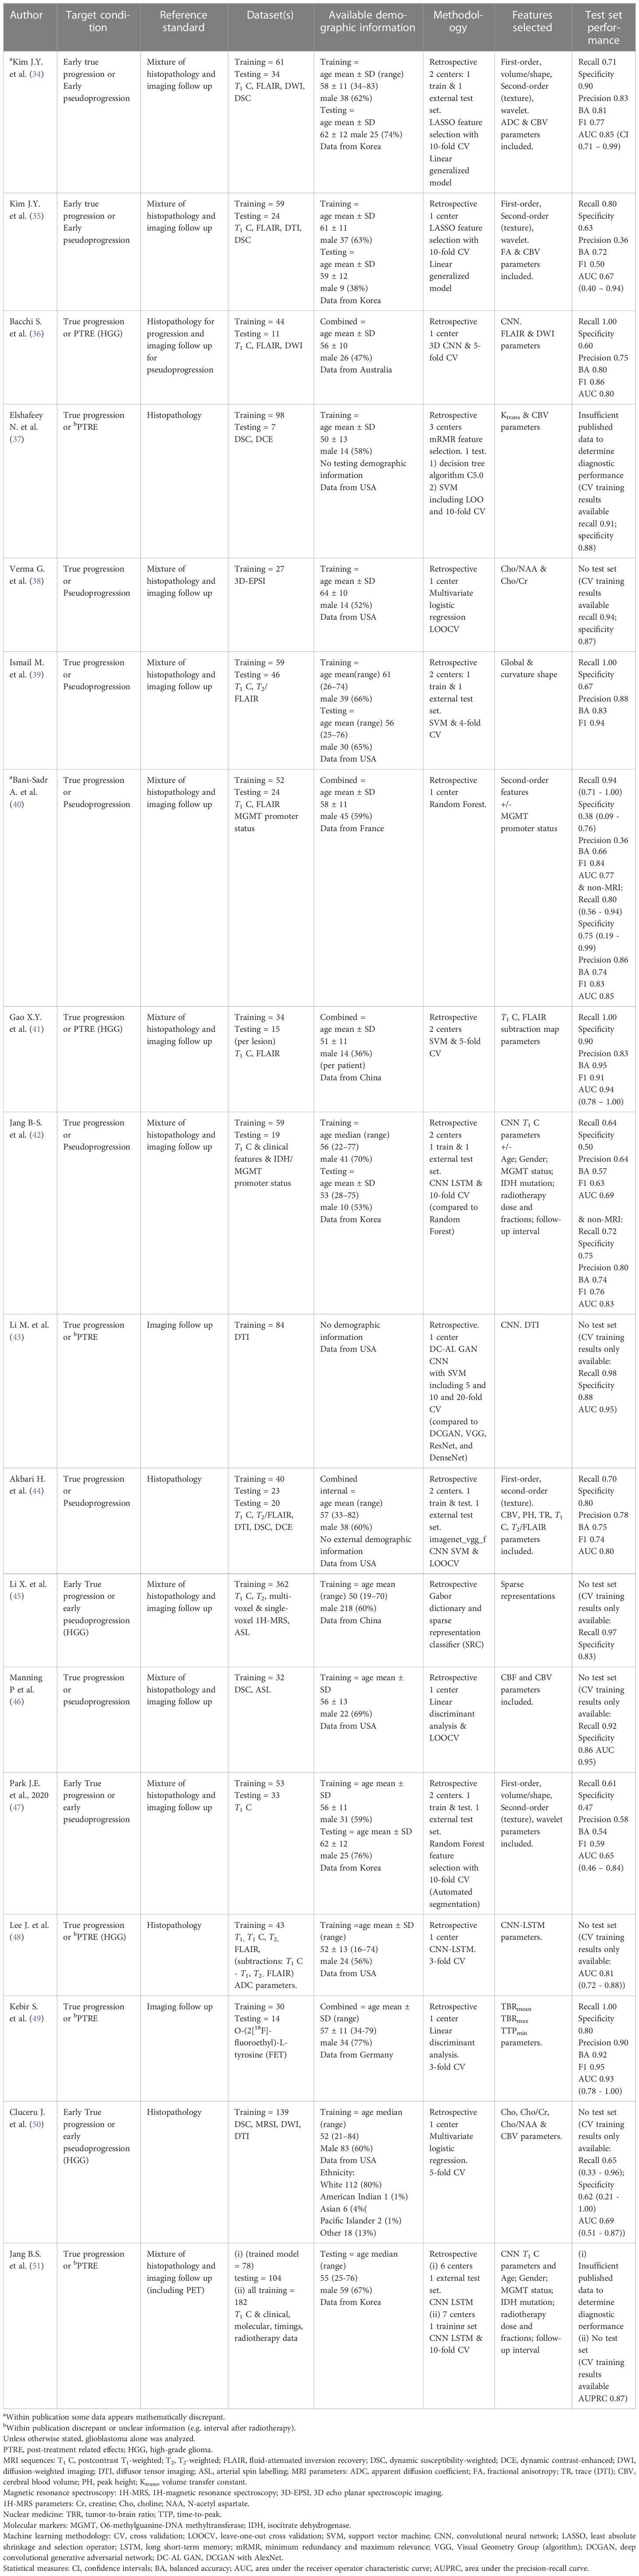
Table 1

AuthorTarget conditionReference standardDataset(s)Available demographic informationMethodologyFeatures selectedTest set performance
aKim J.Y. et al. (34)Early true progression or Early pseudoprogressionMixture of histopathology and imaging follow upTraining = 61
Testing = 34
T1 C, FLAIR, DWI, DSC
Training =
age mean ± SD (range)
58 ± 11 (34–83)
male 38 (62%)
Testing =
age mean ± SD
62 ± 12 male 25 (74%)
Data from Korea
Retrospective
2 centers: 1 train & 1 external test set.
LASSO feature selection with 10-fold CV
Linear generalized model
First-order,
volume/shape, Second-order (texture), wavelet.
ADC & CBV parameters included.
Recall 0.71
Specificity 0.90
Precision 0.83
BA 0.81
F1 0.77
AUC 0.85 (CI 0.71 – 0.99)
Kim J.Y. et al. (35)Early true progression or Early pseudoprogressionMixture of histopathology and imaging follow upTraining = 59
Testing = 24
T1 C, FLAIR, DTI, DSC
Training =
age mean ± SD
61 ± 11
male 37 (63%)
Testing =
age mean ± SD
59 ± 12
male 9 (38%)
Data from Korea
Retrospective
1 center
LASSO feature selection with 10-fold CV
Linear generalized model
First-order,
Second-order
(texture), wavelet.
FA & CBV parameters included.
Recall 0.80
Specificity 0.63
Precision 0.36
BA 0.72
F1 0.50
AUC 0.67 (0.40 – 0.94)
Bacchi S. et al. (36)True progression or PTRE (HGG)Histopathology for progression and imaging follow up for pseudoprogressionTraining = 44
Testing = 11
T1 C, FLAIR, DWI
Combined =
age mean ± SD
56 ± 10
male 26 (47%)
Data from Australia
Retrospective
1 center
3D CNN & 5-fold CV
CNN.
FLAIR & DWI
parameters
Recall 1.00
Specificity 0.60
Precision 0.75
BA 0.80
F1 0.86
AUC 0.80
Elshafeey N. et al. (37)True progression or bPTREHistopathologyTraining = 98
Testing = 7
DSC, DCE
Training =
age mean ± SD
50 ± 13
male 14 (58%)
No testing demographic information
Data from USA
Retrospective
3 centers
mRMR feature selection. 1 test.
1) decision tree algorithm C5.0
2) SVM
including LOO and 10-fold CV
Ktrans & CBV parametersInsufficient published data to determine diagnostic performance
(CV training results available recall 0.91; specificity 0.88)
Verma G. et al. (38)True progression or PseudoprogressionMixture of histopathology and imaging follow upTraining = 27
3D-EPSI
Training =
age mean ± SD
64 ± 10
male 14 (52%)
Data from USA
Retrospective
1 center
Multivariate logistic regression
LOOCV
Cho/NAA & Cho/CrNo test set
(CV training results available recall 0.94; specificity 0.87)
Ismail M. et al. (39)True progression or PseudoprogressionMixture of histopathology and imaging follow upTraining = 59
Testing = 46
T1 C, T2/
FLAIR
Training =
age mean(range) 61 (26–74)
male 39 (66%)
Testing =
age mean (range) 56 (25–76)
male 30 (65%)
Data from USA
Retrospective
2 centers: 1 train & 1 external test set.
SVM & 4-fold CV
Global & curvature shapeRecall 1.00
Specificity 0.67
Precision 0.88
BA 0.83
F1 0.94
aBani-Sadr A. et al. (40)True progression or PseudoprogressionMixture of histopathology and imaging follow upTraining = 52
Testing = 24
T1 C, FLAIR
MGMT promoter status
Combined =
age mean ± SD
58 ± 11
male 45 (59%)
Data from France
Retrospective
1 center
Random Forest.
Second-order features
+/-
MGMT promoter status
Recall 0.94 (0.71 - 1.00)
Specificity 0.38 (0.09 - 0.76)
Precision 0.36
BA 0.66
F1 0.84
AUC 0.77
& non-MRI:
Recall 0.80 (0.56 - 0.94)
Specificity 0.75 (0.19 - 0.99)
Precision 0.86
BA 0.74
F1 0.83
AUC 0.85
Gao X.Y. et al. (41)True progression or PTRE (HGG)Mixture of histopathology and imaging follow upTraining = 34
Testing = 15
(per lesion)
T1 C, FLAIR
Combined =
age mean ± SD
51 ± 11
male 14 (36%)
(per patient)
Data from China
Retrospective
2 centers
SVM & 5-fold CV
T1 C, FLAIR
subtraction map parameters
Recall 1.00
Specificity 0.90
Precision 0.83
BA 0.95
F1 0.91
AUC 0.94 (0.78 – 1.00)
Jang B-S. et al. (42)True progression or PseudoprogressionMixture of histopathology and imaging follow upTraining = 59 Testing = 19
T1 C & clinical features & IDH/MGMT
promoter status
Training =
age median (range)
56 (22–77)
male 41 (70%)
Testing =
age mean ± SD
53 (28–75)
male 10 (53%)
Data from Korea
Retrospective
2 centers
1 train & 1 external test set.
CNN LSTM & 10-fold CV
(compared to Random Forest)
CNN T1 C parameters
+/-
Age; Gender; MGMT status; IDH mutation; radiotherapy dose and fractions; follow-up interval
Recall 0.64
Specificity 0.50
Precision 0.64
BA 0.57
F1 0.63
AUC 0.69

& non-MRI:
Recall 0.72
Specificity 0.75
Precision 0.80
BA 0.74
F1 0.76
AUC 0.83
Li M. et al. (43)True progression or bPTREImaging follow upTraining = 84
DTI
No demographic information
Data from USA
Retrospective.
1 center
DC-AL GAN CNN
with SVM including 5 and 10 and 20-fold CV
(compared to DCGAN, VGG, ResNet, and DenseNet)
CNN. DTINo test set
(CV training results only available: Recall 0.98
Specificity 0.88
AUC 0.95)
Akbari H. et al. (44)True progression or PseudoprogressionHistopathologyTraining = 40
Testing = 23
Testing = 20
T1 C, T2/FLAIR, DTI, DSC, DCE
Combined
internal =
age mean (range)
57 (33–82)
male 38 (60%)
No external demographic information
Data from USA
Retrospective
2 centers. 1 train & test. 1 external test set.
imagenet_vgg_f CNN SVM & LOOCV
First-order, second-order (texture).
CBV, PH, TR, T1 C, T2/FLAIR
parameters included.
Recall 0.70
Specificity 0.80
Precision 0.78
BA 0.75
F1 0.74
AUC 0.80
Li X. et al. (45)Early True progression or early pseudoprogression (HGG)Mixture of histopathology and imaging follow upTraining = 362
T1 C, T2, multi-voxel & single-voxel 1H-MRS, ASL
Training = age mean (range) 50 (19–70)
male 218 (60%)
Data from China
Retrospective
Gabor dictionary and sparse representation classifier (SRC)
Sparse representationsNo test set
(CV training results only available:
Recall 0.97
Specificity 0.83)
Manning P et al. (46)True progression or pseudoprogressionMixture of histopathology and imaging follow upTraining = 32
DSC, ASL
Training = age mean ± SD
56 ± 13
male 22 (69%)
Data from USA
Retrospective
1 center
Linear discriminant analysis & LOOCV
CBF and CBV parameters included.No test set
(CV training results only available:
Recall 0.92
Specificity 0.86 AUC 0.95)
Park J.E. et al., 2020 (47)Early True progression or early pseudoprogressionMixture of histopathology and imaging follow upTraining = 53
Testing = 33
T1 C
Training = age mean ± SD
56 ± 11
male 31 (59%)
Testing = age mean ± SD
62 ± 12
male 25 (76%)
Data from Korea
Retrospective
2 centers. 1 train & test. 1 external test set.
Random Forest feature selection with 10-fold CV (Automated segmentation)
First-order, volume/shape, Second-order (texture), wavelet parameters included.Recall 0.61
Specificity 0.47
Precision 0.58
BA 0.54
F1 0.59
AUC 0.65 (0.46 – 0.84)
Lee J. et al. (48)True progression or bPTRE (HGG)HistopathologyTraining = 43
T1,T1 C, T2, FLAIR, (subtractions: T1 C - T1, T2- FLAIR) ADC parameters.
Training =age mean ± SD (range)
52 ± 13 (16–74)
male 24 (56%)
Data from USA
Retrospective
1 center
CNN-LSTM.
3-fold CV
CNN-LSTM parameters.No test set
(CV training results only available:
AUC 0.81 (0.72 - 0.88))
Kebir S. et al. (49)True progression or bPTREImaging follow upTraining = 30
Testing = 14
O-(2[18F]-fluoroethyl)-L-tyrosine (FET)
Combined = age mean ± SD (range)
57 ± 11 (34-79)
male 34 (77%)
Data from Germany
Retrospective
1 center
Linear discriminant analysis.
3-fold CV
TBRmean
TBRmax
TTPmin
parameters.
Recall 1.00
Specificity 0.80
Precision 0.90
BA 0.92
F1 0.95
AUC 0.93 (0.78 - 1.00)
Cluceru J. et al. (50)Early True progression or early pseudoprogression (HGG)HistopathologyTraining = 139
DSC, MRSI, DWI, DTI
Training = age median (range)
52 (21–84)
Male 83 (60%)
Data from USA
Ethnicity:
White 112 (80%)
American Indian 1 (1%)
Asian 6 (4%(
Pacific Islander 2 (1%)
Other 18 (13%)
Retrospective
1 center
Multivariate logistic regression.
5-fold CV
Cho, Cho/Cr, Cho/NAA & CBV parameters.No test set
(CV training results only available:
Recall 0.65 (0.33 - 0.96);
Specificity 0.62 (0.21 - 1.00)
AUC 0.69 (0.51 - 0.87))
Jang B.S. et al. (51)True progression or bPTREMixture of histopathology and imaging follow up (including PET)(i) (trained model = 78)
testing = 104
(ii) all training = 182
T1 C & clinical, molecular, timings, radiotherapy data
Testing = age median (range)
55 (25-76)
male 59 (67%)
Data from Korea
Retrospective
(i) 6 centers
1 external test set.
CNN LSTM
(ii) 7 centers
1 training set
CNN LSTM & 10-fold CV
CNN T1 C parameters and Age; Gender; MGMT status; IDH mutation; radiotherapy dose and fractions; follow-up interval(i) Insufficient published data to determine diagnostic performance
(ii) No test set
(CV training results available AUPRC 0.87)

Studies using machine learning in the development of glioblastoma monitoring biomarkers.

a

Within publication some data appears mathematically discrepant.

b

Within publication discrepant or unclear information (e.g. interval after radiotherapy).

Unless otherwise stated, glioblastoma alone was analyzed.

PTRE, post-treatment related effects; HGG, high-grade glioma.

MRI sequences: T1 C, postcontrast T1-weighted; T2, T2-weighted; FLAIR, fluid-attenuated inversion recovery; DSC, dynamic susceptibility-weighted; DCE, dynamic contrast-enhanced; DWI, diffusion-weighted imaging; DTI, diffusor tensor imaging; ASL, arterial spin labelling; MRI parameters: ADC, apparent diffusion coefficient; FA, fractional anisotropy; TR, trace (DTI); CBV, cerebral blood volume; PH, peak height; Ktrans, volume transfer constant.

Magnetic resonance spectroscopy: 1H-MRS, 1H-magnetic resonance spectroscopy; 3D-EPSI, 3D echo planar spectroscopic imaging.

1H-MRS parameters: Cr, creatine; Cho, choline; NAA, N-acetyl aspartate.

Nuclear medicine: TBR, tumor-to-brain ratio; TTP, time-to-peak.

Molecular markers: MGMT, O6-methylguanine-DNA methyltransferase; IDH, isocitrate dehydrogenase.

Machine learning methodology: CV, cross validation; LOOCV, leave-one-out cross validation; SVM, support vector machine; CNN, convolutional neural network; LASSO, least absolute shrinkage and selection operator; LSTM, long short-term memory; mRMR, minimum redundancy and maximum relevance; VGG, Visual Geometry Group (algorithm); DCGAN, deep convolutional generative adversarial network; DC-AL GAN, DCGAN with AlexNet.

Statistical measures: CI, confidence intervals; BA, balanced accuracy; AUC, area under the receiver operator characteristic curve; AUPRC, area under the precision-recall curve.

The publisher apologizes for this error. The original version of this article has been updated.

Summary

Keywords

glioblastoma, machine learning, monitoring biomarkers, meta-analysis, artificial intelligence, treatment response, deep learning, glioma

Citation

Frontiers Production Office (2023) Erratum: Imaging biomarkers of glioblastoma treatment response: a systematic review and meta-analysis of recent machine learning studies. Front. Oncol. 13:1217461. doi: 10.3389/fonc.2023.1217461

Received

05 May 2023

Accepted

05 May 2023

Published

24 May 2023

Approved by

Frontiers Editorial Office, Frontiers Media SA, Switzerland

Volume

13 - 2023

Updates

Copyright

*Correspondence: Frontiers Production Office,

Disclaimer

All claims expressed in this article are solely those of the authors and do not necessarily represent those of their affiliated organizations, or those of the publisher, the editors and the reviewers. Any product that may be evaluated in this article or claim that may be made by its manufacturer is not guaranteed or endorsed by the publisher.

Cite article

Copy to clipboard


Export citation file


Share article

Article metrics