 Shijie Jin
 Liyi Wu
- Department of Urology, Peking Union Medical College Hospital, Beijing, China
Introduction: Correlation between zonal origin of clinically localized prostate cancer (PC) and biochemical recurrence (BCR) after treatment is still controversial.
Methods: We performed a meta-analysis of published articles to investigate the prognostic value of zonal origin in clinically localized PC. Literature was searched from Medline, Embase, Scopus, and Web of Science, from inception to Nov 1st, 2022. The risk of BCR was compared between PC originating from transition zone with peripheral zone. Relative risk (RR) was pooled in a random-effects model. Subgroup analysis and meta-regression were conducted to assess the source of heterogeneity.
Results: 16 cohorts and 19,365 patients were included. PC originating from transition zone was associated with a lower risk of BCR (RR, 0.79, 95%CI; 0.69-0.92, I2, 76.8%). The association was consistent in studies with median follow-up time ≥60 months (RR, 0.65; 95%CI, 0.48 to 0.88, I2 56.8%), studies with NOS score ≥8 (RR, 0.70; 95%CI, 0.62 to 0.80, I2 32.4%), and studies using multivariate regression model (RR, 0.57; 95%CI, 0.48 to 0.69, I2 23%).
Discussion: This meta-analysis supported that transition zone origin was an independent prognostic factor of a better biochemical result in clinically localized prostate cancer after treatment.
Systematic review registration: 10.37766/inplasy2023.11.0100, identifier INPLASY2023110100.
1 Introduction
Prostate cancer (PC) is the second most common cancer in men and the sixth most common cause of cancer death worldwide in 2020, causing >350,000 death in men (1). In most men, prostate cancer is diagnosed while the disease is confined within the prostate (2), which is termed localized prostate cancer. Initial treatment of clinically localized PC includes radical prostatectomy (RP), radiotherapy (RT), hormonal therapy, and deferred treatments such as active surveillance and watchful waiting (3–5). However, after RP or RT with curative intent, up to 27–53% of these patients experience biochemical recurrence (BCR) (6). BCR is considered as an early event indicating disease progression and is related to a higher risk of metastasis and disease-specific mortality. To estimate the risks of BCR, D’Amico classification system was developed and verified. Now the derivatives of D’Amico system are widely used in clinical practice (3–5). However, the best stratification and optimal treatment remain controversial (5).
The human prostate was histologically divided into transition zone (TZ), peripheral zone (PZ), central zone (CZ), and anterior fibromuscular stroma (AFMS) by McNeal (7). Approximately 25%, 70%, and 5% of prostate cancer originate respectively from TZ, PZ, and CZ (8). Heterogeneity has been found between prostate cancers with different zonal origins. Compared with PZ tumors, most TZ tumors are usually diagnosed with larger volume and higher prostatic specific antigen (PSA) levels, but with earlier T stage and lower Gleason scores, indicating that TZ tumors might have better biological behavior. Some studies suggested that zonal origin in TZ was associated with a lower risk of BCR (9, 10). Conversely, other studies found no significant differences in 5-year biochemical relapse-free survival between TZ tumors and PZ tumors (11). Information about CZ tumors is limited due to scarcity (12). Therefore, the prognostic role of zonal origin in prostate cancer is still controversial.
Considering that most of the previous studies are retrospective single-institutional, we aim to conduct a meta-analysis of all eligible published studies to quantify the prognostic value of zonal origin in prostate cancer.
2 Methods
2.1 Search strategy
We conducted this meta-analysis according to the Meta-analysis of Observational Studies in Epidemiology (MOOSE) guidelines and Preferred Reporting Items for Systematic Reviews and Meta-analysis (PRISMA) guidelines (13, 14). The Medline, Embase, Scopus, Web of Science, and Cochrane databases were searched from inception to November 1st, 2022 for human studies investigating the association between zonal origin and BCR in prostate cancer. The main search terms included: (zone or zonal) and (prostate or prostatic) and (cancer carcinoma) and (recurrence or failure or relapse). The reference lists of retrieved articles were also checked for relevant articles.
2.2 Eligibility criteria
Inclusion criteria for selecting the studies were as follows: (i) The diagnosis of prostate cancer was pathologically confirmed; (ii) Zonal origin was defined as the zone which contains most part of the index tumor with the highest Gleason score; (iii) Correlation of zonal origin with BCR was reported. Exclusion criteria were the following: (i) Abstracts, letters, case reports, reviews, or nonclinical studies; (ii) Studies were not written in English; (iii) Studies with insufficient data for estimating relative risk (RR), odds ratio (OR), hazard ratio (HR), or 95% confidence interval (CI); (iv) Studies with duplicate data. Initial screening of the title and abstract, full-text assessment, and subsequent data extraction were independently performed by two authors (SJJ and LYW). Disagreements were discussed and resolved by consensus with a third reviewer (ZL).
2.3 Data extraction and quality evaluation
The following items were extracted from each included study: authors, year of publication, country, the proportion of different ethnic groups, study design, number of cases, treatment, follow-up time, the definition of zonal origin, the definition of BCR, and confounding factors which were balanced or adjusted. RR, HR, or OR were directly extracted from literature, or indirectly estimated from Kaplan-Meier curves according to the methods illustrated by Parmer et al, together with the 95% CI (15). If results of both univariate and multivariate Cox regression analysis were reported, we chose the multivariate model for a more accurate estimate. We used RR to represent various effect estimates. A RR <1 indicated a better prognosis for prostate cancer originating in transition zone. To evaluate the methodological quality and grade the evidence of included studies, the Newcastle–Ottawa Scale (NOS) (range 1–9 scores) was used (16). NOS scores of ≥8 were defined as high-quality studies.
2.4 Statistical analysis
We pooled RRs and 95% CIs using random-effects models and fixed-effects models according to the heterogeneity evaluated by Cochran’s Q test and Higgins I-squared statistic (17). An I2 > 50% was considered as significant heterogeneity and a random-effects model (DerSimonian–Laird method) was used. Otherwise, the fixed-effects model (Mantel–Haenszel method) was adopted (18). A subgroup analysis was performed based on variables including major ethnic group, sample size, median follow-up time, regression model type (univariate or multivariate), RR source (direct extraction or indirect estimate), NOS total score, the definition of BCR, the definition of TZ origin (on MRI or pathological sections), pre-treatment PSA level, the ratio of Gleason grade group ≥2, and the ratio of T stage ≥T3. Sensitivity analysis was conducted by omitting one study at a time, generating the pooled estimates, and comparing them with the original estimates. Funnel plots, Begg’s test, and Egger’s test were performed to assess publication bias (19, 20). All analysis was performed using STATA/SE 12.0 (STATA, College Station, TX). Statistical significance was defined as two-tailed alpha <0.05.
3 Results
3.1 Study selection and characteristics
As shown in Figure 1, the literature search initially identified 1684 papers. 36 studies were included in the full-text assessment. Finally, 14 studies, published from 2000 to 2022, were enrolled in the final mete-analysis (9, 21–33). Among these, 13 were cohort studies and 1 was case-control. Studies were conducted in France (n=1), Germany (n=1), Brazil (n=1), USA (n=5), Korea (n=2), Japan (n=3), and Australis (n=1). Since Kim and Teloken’s studies both contained two distinct cohorts, there were 16 cohorts in the meta-analysis. Their detailed characteristics are listed in Table 1; Table S1.
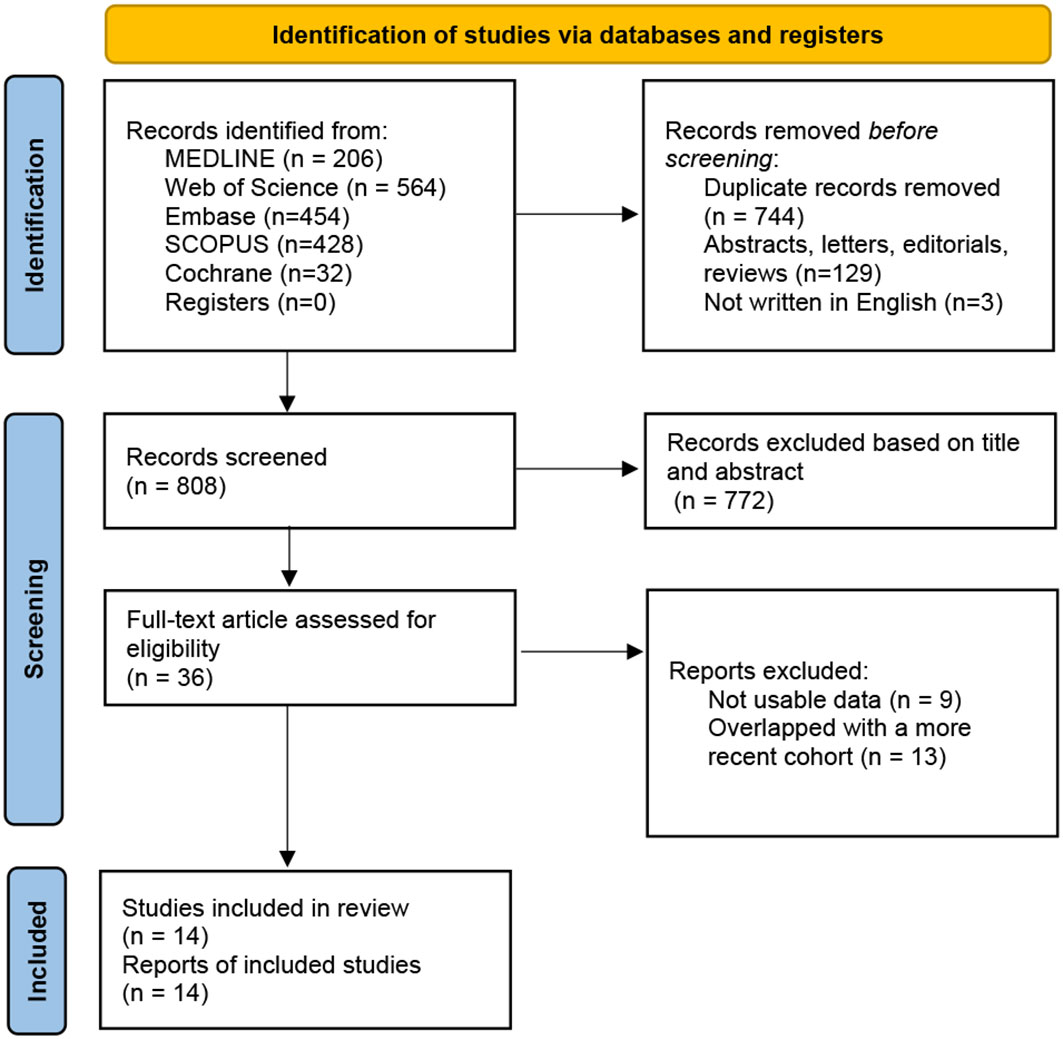
Figure 1 The PRISMA flow chart of the study selection process (13). PRISMA, Preferred Reporting Items for Systematic Reviews and Meta-Analyses.
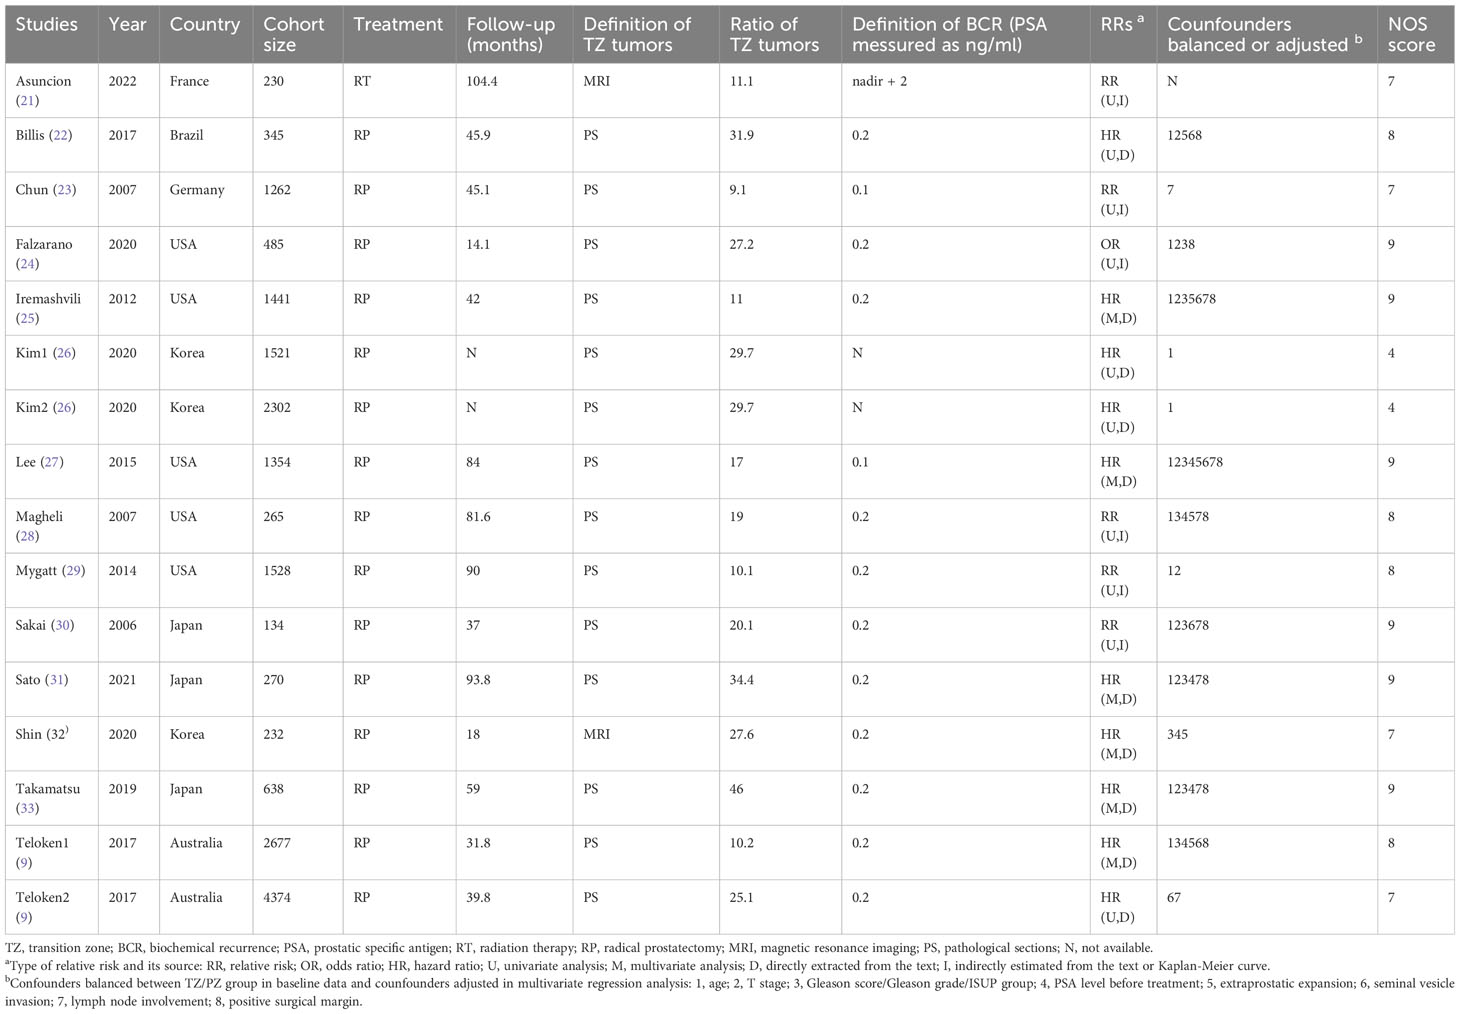
Table 1 Characteristics of included studies.
Among the 16 cohorts, sample sizes ranged from 134 to 4374, with a median of 950. The median/mean age ranged from 58.7 to 68.5. The median follow-up time ranged from 18 months to 104.4 months. The ratio of TZ tumors ranged from 9.1% to 46%, and PZ tumors from 54% to 90.1%. CZ tumors were not separately reported in 14 cohorts. In the other 2 cohorts, CZ tumors were excluded from the prognostic analysis. As a result, we can only compare the prognosis of TZ tumors and PZ tumors. Regarding the reported data on prognostic indicators, the median pre-treatment PSA level ranged from 5.7 to 32.2 ng/ml. The ratio of prostate cancer with Gleason grade ≥2 ranged from 34.8% to 100%. And the ratio of prostate cancer with pathological T stage ≥ T3 ranged from 25.5% to 49.3%. Patients undertook RP in 15 cohorts and RT in 1 cohort. The use of neoadjuvant or adjuvant therapy were summarized in Table S2. Most RP cohorts excluded patients who received neoadjuvant or adjuvant therapy.
3.2 Risk of bias and quality assessment
The methodological quality profile of included studies according to NOS is shown in Table S3. The mean NOS score was 7.625. Only one study showed a high risk of bias because it was conference literature and lacked detailed methodological data (26). The most common problems identified were the lack of adjustment for potential confounders. 6 studies used a multivariate regression model, in which confounders were adjusted, such as age, T stage, Gleason grade group, and positive surgical margin. The definition of BCR and zonal origin were not exactly the same, but most studies used PSA level ≥ 0.2 ng/ml as the cut-off for BCR. And most studies define TZ origin when TZ contains more than 70% of the index tumor.
3.3 Overall analysis
Because the heterogeneity test showed a high level of heterogeneity (I2 = 76.8%, p<0.01) between the studies, a random-effects model was used for the analysis (see Figure 2). A pooled RR of 0.79 (95%CI, 0.69-0.92; p<0.01) showed that clinically localized PC originating from the transition zone were associated with a better outcome in terms of biochemical-free survival.
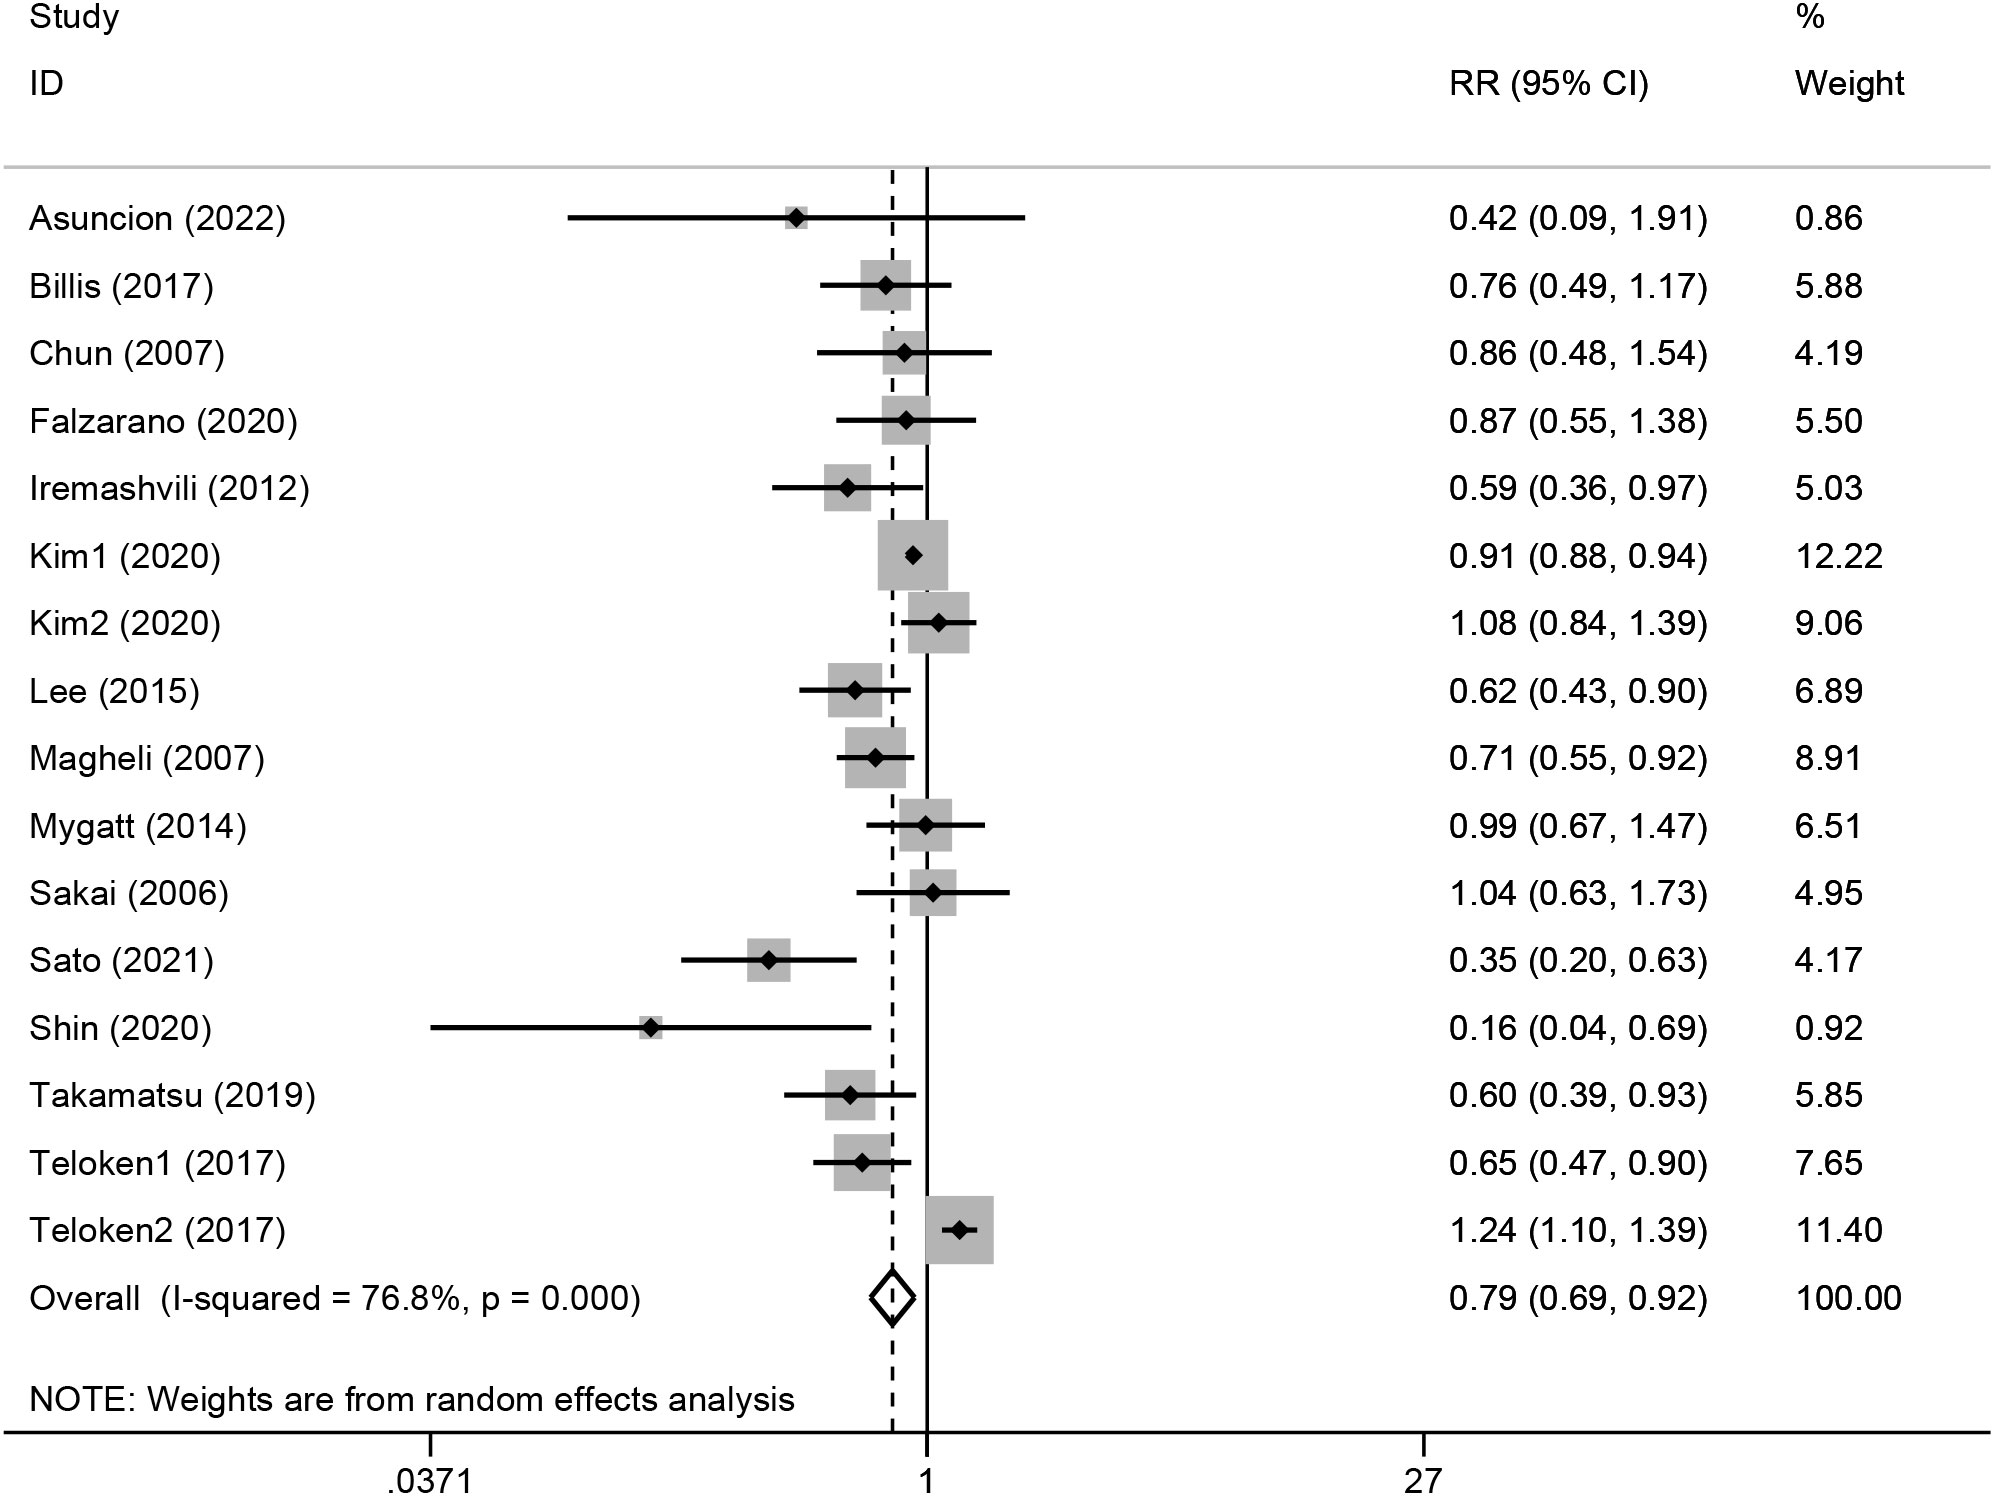
Figure 2 Forest plot of the association between transition zonal origin and biochemical recurrence. Diamonds represent study-specific relative risks or summary relative risks with 95% CIs. Horizontal lines represent 95% CIs. A RR<1 represents better prognosis of TZ tumors.
3.4 Subgroup analysis and meta-regression
Given the high heterogeneity showed through the I2 statistic, a subgroup analysis and a meta-regression were performed based on the following variables: major ethnic group (Caucasian or eastern Asian), sample size (<1000 or≥1000), median follow-up time (<60m or ≥60m), regression model type (univariate or multivariate), RR source (directly extraction or indirectly estimate), NOS total score(<8, ≥8), BCR definition (0.1 ng/ml or 0.2 ng/ml), definition of TZ origin (on MRI or pathological sections), PSA level (<10 ng/ml or ≥10 ng/ml), ratio of Gleason grade group ≥2 (<80% or ≥80%), and ratio of T stage ≥T3 (<40% or ≥40%). In the subgroup analysis shown in Table 2, regardless of the grouping variables used, I2 of the subgroups could not drop below 50% at the same time. In the meta-regression shown in Table 3, regression model type (P=0.002) and NOS score (P=0.025) were found to be possible sources of heterogeneity, but the residual I2 was still high than 50% (64.45% for regression model type and 69.79% for NOS score), indicating that they could only explain part of the heterogeneity.
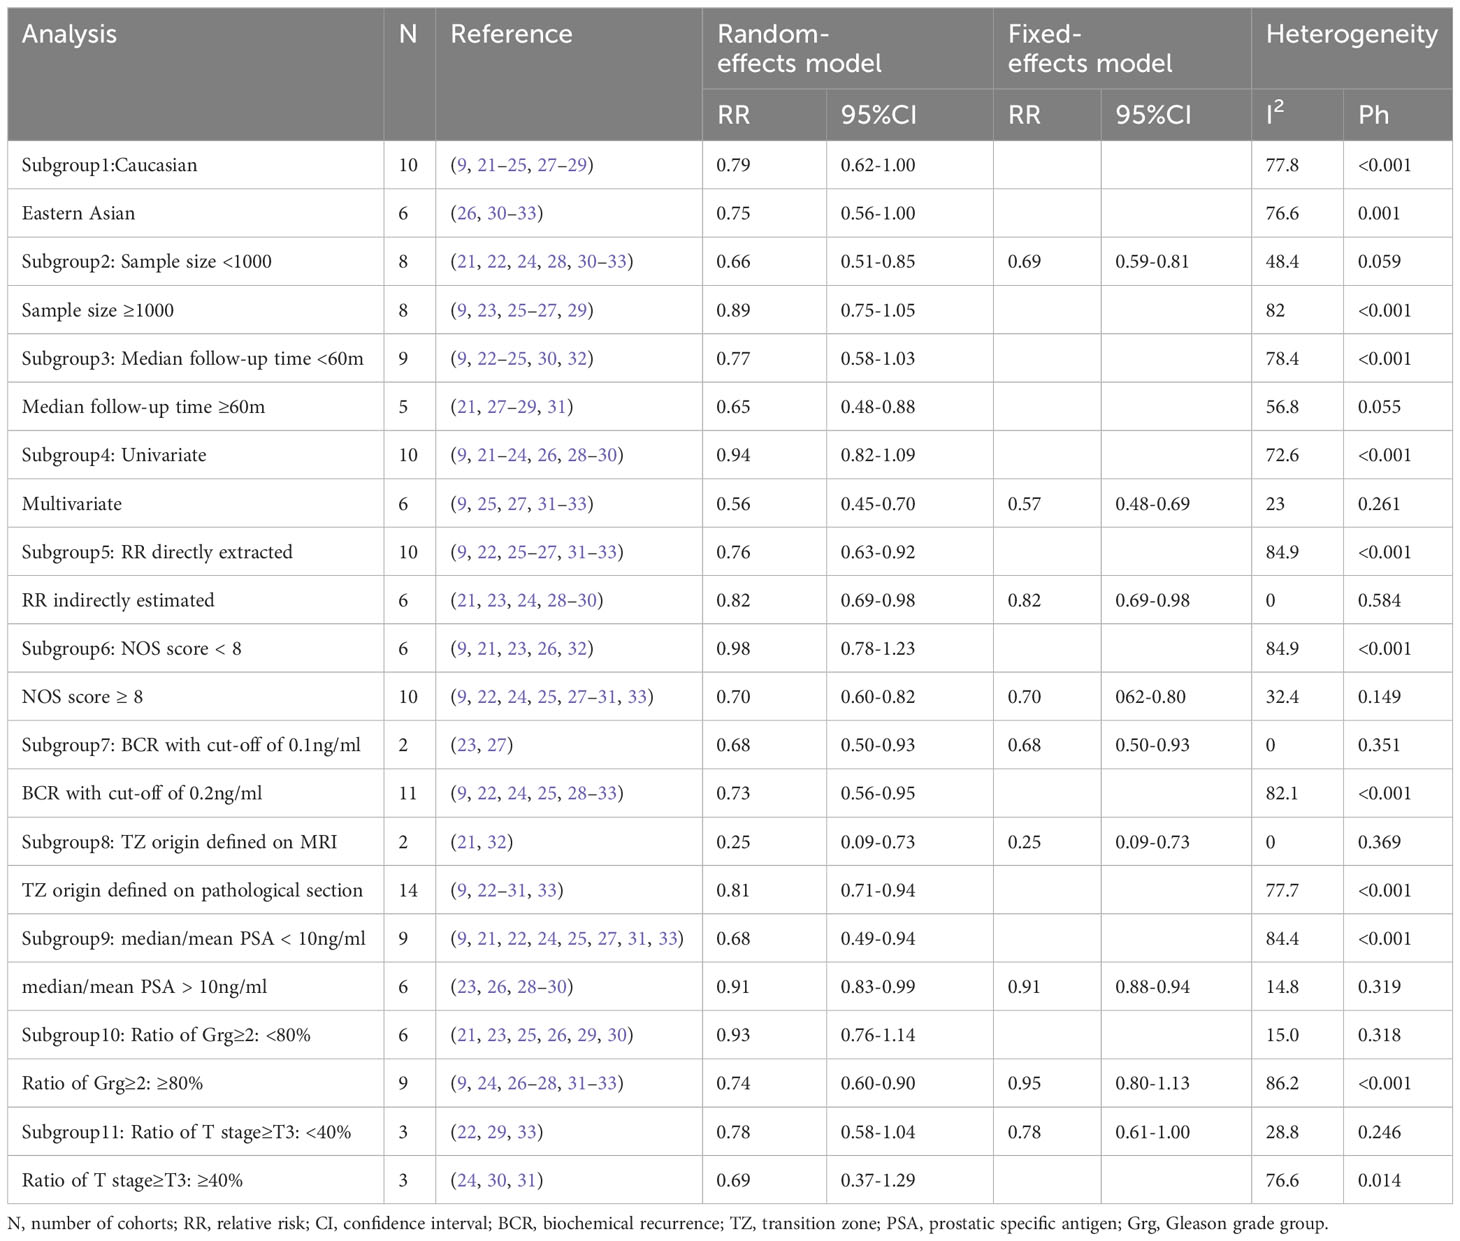
Table 2 Subgroup analysis of the pooled association of transition zonal origin with biochemical recurrence.
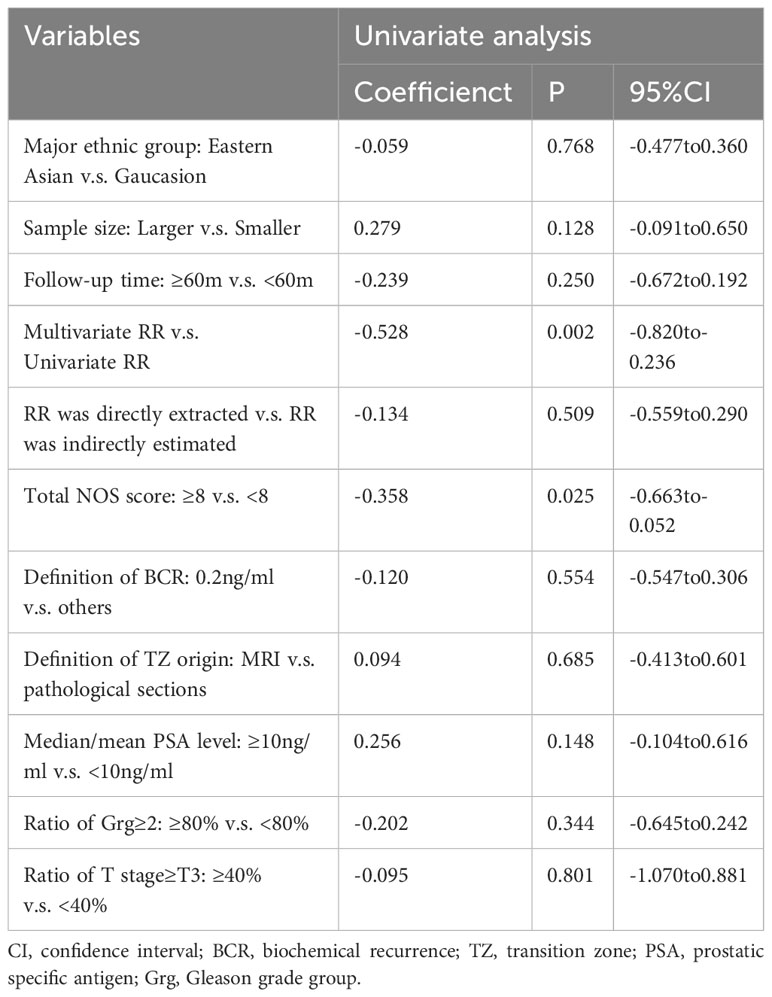
Table 3 Meta-regression analysis for exploring potential sources of heterogeneity.
Results of specific subgroup analysis were consistent with the overall analysis, supporting the prognostic value of TZ origin. The pooled RR was 0.79 (95%CI, 0.69 to 0.92) in studies with long follow-up time (median follow-up time ≥60m), in a random-effects model (I2, 76.8%). The pooled RR was 0.70 (95%CI, 0.62 to 0.80) in high-quality studies (NOS≥8), in a fixed-effects model (I2, 32.4%). When we restricted the meta-analysis to studies using a multivariate regression model only, the pooled RR was 0.57 (95%CI, 0.48 to 0.69) in a fixed-effects model (I2, 23%). Another valuable finding of subgroup analysis was that in the higher Gleason grade subgroup (ratio of Grg≥2 was higher than 80%), the pooled RR was 0.74 (95%CI, 0.60 to 0.90), in contrast with 0.93(95%CI, 0.76 to 1.14) in the lower Gleason grade subgroup (ratio of Grg≥2 was lower than 80%), both in random-effects models (see Figure S1).
3.5 Sensitivity and publication bias analysis
The sensitivity analysis (see Figure S2; Table S4) confirmed the stability of the association between zonal origin and BCR because the pooled RR remained stable if a certain cohort was omitted. For example, if we left out the cohort ‘Kim1’ with the highest weight (12.22%), the pooled RR turned out to be 0.75 (95% CI, 0.61 to 0.93), which was even more significant. The funnel plot (see Figure S3), Begg’s test, and Egger’s test did not indicate the existence of obvious bias. Pr>|z| was 0.392 for Begg’s test and P>|t| was 0.128 for Egger’s test.
4 Discussion
4.1 Principal findings
In this meta-analysis, pooling all available data to estimate the prognostic value of zonal origin in clinically localized prostate cancer, we found that patients with prostate cancer originating from the transition zone have a lower risk of BCR compared with patients with prostate cancer originating from the peripheral zone (RR, 0.79; 95%CI, 0.69-0.92). The result was robust in sensitivity analysis and no publication bias was observed. This association should be considered cautiously as there was high heterogeneity in the overall analysis (I2, 76.8%). Nevertheless, it was supported by subgroup analysis in high-quality literature with NOS ≥8 (RR, 0.70; 95%CI, 0.62-0.80; I2, 32.4%). To our acknowledgment, this was the first meta-analysis about the prognostic value of zonal origin of clinically localized prostate cancer. Our results suggest that the association of zonal origin with BCR merits consideration.
4.2 Possible mechanisms for principal findings
Previous studies had indicated the difference between prostate cancer originating from different zones. In patients receiving prostatectomy (9, 12, 21–33), the ratio of TZ tumors ranged from 10% to 30%, compared with a nearly 70% ratio of PZ tumors. Most studies showed that TZ tumors had higher PSA levels, larger volumes, and a higher positive rate of the surgical margin. On the contrary, the pathological stage and Gleason grade of TZ tumors were similar or even better than PZ tumors. The difference in PSA level and tumor volume might be explained through diagnosis delay of TZ tumors because most of the included cohorts used transrectal systematic biopsy, in which the detection of TZ tumors was more difficult (34). Therefore, TZ tumors tend to grow larger and give rise to higher PSA levels when diagnosed. The difference in pathological T stage could be explained by spatial location and prostate histology. TZ tumors are originally far away from the seminal vesicle and the prostate capsule. What’s more, there is an interstitial band around the transition zone which may limit the spread of TZ tumor (35). As a result, it is more difficult for TZ tumors to invade outside the prostate capsule. However, the difference on Gleason grade has not been not well explained.
Regarding the prognosis after treatment with curative intent, conclusions were not consistent. One explanation for this phenomenon is that most of the previous studies did not control confounding factors such as tumor stage, Gleason grade group, and surgical margin. Augustin (10) and O’Neil (36) found that when confounding factors were controlled, there was no difference in 5-year BFS between TZ and PZ tumors. However, other multivariate regression analyses (25, 27, 31–33) support TZ origin as an independent prognostic factor. In our meta-analysis, when T stage and Gleason grade were balanced, the pooled RR was 0.57 (95%CI 0.48-0.69), indicating that TZ tumors might be a different clinical entity with better prognosis, regardless of T stage and Gleason grade. It is worth noticing that the studies of Augustin (10) and O’Neil (36) were not included in our final analysis because of new literature from the same center (9, 23).
Molecular biology might help to reveal the fundamental differences between TZ and PZ tumors. Adler (37) used genome-wide oligonucleotide microarray on micro-dissected normal prostate tissues from TZ and PZ. They found 351 significant differentially expressed genes. The most significantly highly expressed genes in PZ were mostly targets of ETGs, a transcription factor family which is associated with prostate cancer. Al Kadhi’s metabonomics study (38) indicated that the pathway associated with lipid biosynthesis, with was considered a contributor to prostate cancer, was significantly enhanced in PZ. Guo (39) and Falzarano (40) found that the TMPSSR2-ERG fusion event, which was common in prostate cancer, was more frequent in PZ tumors. The expression of Ki-67, MMP-2, MMP9, p53, and Bcl-2 was also less observed in TZ cancer by Lee (27). Based on those findings, more mechanistic studies are needed to connect the molecular difference with prognosis.
4.3 Secondary findings
One interesting finding in our meta-analysis was the different prognostic role of TZ origin between the high Gleason grade group and the low Gleason grade group. In Kim’s (26) and Teloken’s (9) study, prostate cancer was divided into the low-grade group (Grg 1/2) and the high-grade group (Grg 3/4/5). They both found that the prognostic value of TZ origin was only significant in the high-grade group. Our subgroup analysis had similar results, as shown in Figure S1. In cohorts with more than 80% of patients having Grg ≥ 2, the pooled RR was 0.74 (95%CI, 0.60-0.90), while in cohorts with less than 80% patients having Grg ≥ 2, the pooled RR was 0.93 (95%CI, 0.76-1.14). These findings suggest the prognostic value of TZ origin might be more worthwhile in prostate cancer with a high Gleason grade. Those intermediate or high-risk patients with TZ tumors might should receive less adjuvant treatment to avoid adverse effects. However, this conclusion needs more support because there are only two studies focusing on the high-grade group, and in most of the included cohorts, patients who received adjuvant treatment were excluded. In our literature search, no literature compared the oncological outcome of prostate cancer originating from transition or peripheral zone who received adjuvant treatment.
Another point worth discussing is that two of our included studies (21, 32) used lesion location on MRI to define TZ tumor. The definition of zonal origin through MRI or pathological sections was not a source of heterogeneity and the prognostic value of TZ origin was consistent in the subgroup using MRI or pathological sections. This supports the use of MRI because it is more practical and non-invasive. A few studies have investigated the ability of MRI to diagnose the location of tumors. In Shin’s study (32), tumor location was verified through pathology, and the concordant rate between MRI and pathology was 86.2% (200/232). In Goldman’s study of 64 men, the overall correlation was 89.1% (41). In Wilbulpolprasert’s cohort of 415 patients, using whole-mount histopathology as a reference, the sensitivity was 79.1%(246/311) for PZ tumors and 73.1%(76/104) for TZ tumors (42). Overall, lesion location on MRI might be acceptably sensitive to predict tumor location on pathological examination but more research is needed.
4.4 Limitations
Our study had several limitations. First was the heterogeneity. Though we used subgroup analysis and meta-regression, only the regression model type were identified as possible sources of heterogeneity and they could only explain a limited part of the heterogeneity. Secondly, RRs were indirectly estimated from 6 cohorts, which might introduce errors. However, subgroup analysis showed that the prognostic value was still significant and not changed much when we considered the source of RRs. Thirdly, only one study of radiation therapy and no study of active surveillance were included, because there is a lack of relevant literature. As a result, our result was unsuitable for patients who received radiation therapy or active surveillance. We expect relevant research to fill this gap in the future. Finally, there was a language bias, since our search included only studies written in English. In the future, we plan to focus on the prognostic value of zonal origin specifically in high-grade group prostate cancer, and include high-quality studies to decrease the heterogeneity.
5 Conclusion
In conclusion, our study supports that tumor location is an independent prognostic indicator of BCR after radical prostatectomy and is promising to be included in the postoperative risk stratification system. Prostate tumors originating from the transition zone might be a different clinical entity with a better prognosis. The biological mechanisms behind such correlation remained partially unclear, and thus better designed epidemiological and mechanistic studies were necessary to clarify the underlying mechanism. More radiation therapy cohorts and active surveillance cohorts are also desperately needed to verify the prognostic value of zonal origin in such patients.
Data availability statement
The original contributions presented in the study are included in the article/Supplementary Material. Further inquiries can be directed to the corresponding author.
Author contributions
SJ, LW, and WY were responsible for the conception and design of the review. SJ, LW, and ZL contributed to the data acquisition and interpretation. SJ and ZL were responsible for data analysis. SJ, LW, and ZL contributed to the drafting of the manuscript. WY contributed to data interpretation and revised the paper critically in terms of argument. All authors contributed to the article and approved the submitted version.
Funding
This work was supported by National High Level Hospital Clinical Research Funding of Peking Union Medical College Hospital (grant numbers 2022-PUMCH-A-063, 2022-PUMCH-B-009).
Conflict of interest
The authors declare that the research was conducted in the absence of any commercial or financial relationships that could be construed as a potential conflict of interest.
Publisher’s note
All claims expressed in this article are solely those of the authors and do not necessarily represent those of their affiliated organizations, or those of the publisher, the editors and the reviewers. Any product that may be evaluated in this article, or claim that may be made by its manufacturer, is not guaranteed or endorsed by the publisher.
Supplementary material
The Supplementary Material for this article can be found online at: https://www.frontiersin.org/articles/10.3389/fonc.2023.1248222/full#supplementary-material
References
1. Sung H, Ferlay J, Siegel RL, Laversanne M, Soerjomataram I, Jemal A, et al. Global cancer statistics 2020: GLOBOCAN estimates of incidence and mortality worldwide for 36 cancers in 185 countries. CA Cancer J Clin (2021) 71(3):209–49. doi: 10.3322/caac.21660
2. NIH. Surveillance, epidemiology, and end results (SEER) program (2022). Available at: https://seer.cancer.gov/statfacts/html/prost.html (Accessed Nov 1, 2022).
3. Mohler JL, Antonarakis ES, Armstrong AJ, D'Amico AV, Davis BJ, Dorff T, et al. Prostate cancer, version 2.2019, NCCN clinical practice guidelines in oncology. J Natl Compr Canc Netw (2019) 17(5):479–505. doi: 10.6004/jnccn.2019.0023
4. Eastham JA, Auffenberg GB, Barocas DA, Chou R, Crispino T, Davis JW, et al. Clinically localized prostate cancer: AUA/ASTRO guideline, part I: introduction, risk assessment, staging, and risk-based management. J Urol. (2022) 208(1):10–8. doi: 10.1097/JU.0000000000002757
5. Mottet N, van den Bergh RCN, Briers E, Van den Broeck T, Cumberbatch MG, De Santis M, et al. EAU-EANM-ESTRO-ESUR-SIOG guidelines on prostate cancer-2020 update. Part 1: screening, diagnosis, and local treatment with curative intent. Eur Urol (2021) 79(2):243–62. doi: 10.1016/j.eururo.2020.09.042
6. Cornford P, van den Bergh RCN, Briers E, Van den Broeck T, Cumberbatch MG, De Santis M, et al. EAU-EANM-ESTRO-ESUR-SIOG guidelines on prostate cancer. Part II-2020 update: treatment of relapsing and metastatic prostate cancer. Eur Urol (2021) 79(2):263–82. doi: 10.1016/j.eururo.2020.09.046
7. McNeal JE. The zonal anatomy of the prostate. Prostate. (1981) 2(1):35–49. doi: 10.1002/pros.2990020105
8. McNeal JE, Redwine EA, Freiha FS, Stamey TA. Zonal distribution of prostatic adenocarcinoma. Correlation with histologic pattern and direction of spread. Am J Surg Pathol (1988) 12(12):897–906. doi: 10.1097/00000478-198812000-00001
9. Teloken PE, Li J, Woods CG, Cohen RJ. The impact of prostate cancer zonal origin on pathological parameters at radical prostatectomy and subsequent biochemical failure. J Urol. (2017) 198(6):1316–23. doi: 10.1016/j.juro.2017.05.075
10. Augustin H, Erbersdobler A, Graefen M, Fernandez S, Palisaar J, Huland H, et al. Biochemical recurrence following radical prostatectomy: a comparison between prostate cancers located in different anatomical zones. Prostate. (2003) 55(1):48–54. doi: 10.1002/pros.10216
11. Sakai I, Harada K, Hara I, Eto H, Miyake H. A comparison of the biological features between prostate cancers arising in the transition and peripheral zones. BJU Int (2005) 96(4):528–32. doi: 10.1111/j.1464-410X.2005.05678.x
12. Cohen RJ, Shannon BA, Phillips M, Moorin RE, Wheeler TM, Garrett KL. Central zone carcinoma of the prostate gland: a distinct tumor type with poor prognostic features. J Urol. (2008) 179(5):1762–7. doi: 10.1016/j.juro.2008.01.017
13. Page MJ, McKenzie JE, Bossuyt PM, Boutron I, Hoffmann TC, Mulrow CD, et al. The PRISMA 2020 statement: an updated guideline for reporting systematic reviews. Bmj. (2021) 372:n71. doi: 10.1136/bmj.n71
14. Stroup DF, Berlin JA, Morton SC, Olkin I, Williamson GD, Rennie D, et al. Meta-analysis of observational studies in epidemiology: a proposal for reporting. Meta-analysis Of Observational Studies in Epidemiology (MOOSE) group. Jama. (2000) 283(15):2008–12. doi: 10.1001/jama.283.15.2008
15. Parmar MK, Torri V, Stewart L. Extracting summary statistics to perform meta-analyses of the published literature for survival endpoints. Stat Med (1998) 17(24):2815–34. doi: 10.1002/(sici)1097-0258(19981230)17
16. Wells GA SB, O’Connell D, Peterson J, Welch V, Losos M, et al. The Newcastle-Ottawa Scale (NOS) for assessing the quality of nonrandomised studies in meta-analyses . Available at: https://www.ohri.ca/programs/clinical_epidemiology/oxford.asp (Accessed Nov 1, 2022).
17. Higgins JP, Thompson SG. Quantifying heterogeneity in a meta-analysis. Stat Med (2002) 21(11):1539–58. doi: 10.1002/sim.1186
18. DerSimonian R, Laird N. Meta-analysis in clinical trials. Control Clin Trials. (1986) 7(3):177–88. doi: 10.1016/j.cct.2015.09.002
19. Egger M, Davey Smith G, Schneider M, Minder C. Bias in meta-analysis detected by a simple, graphical test. Bmj. (1997) 315(7109):629–34. doi: 10.1136/bmj.315.7109.629
20. Begg CB, Mazumdar M. Operating characteristics of a rank correlation test for publication bias. Biometrics. (1994) 50(4):1088–101. doi: 10.2307/2533446
21. Asuncion A, Walker PM, Bertaut A, Blanc J, Labarre M, Martin E, et al. Prediction of prostate cancer recurrence after radiation therapy using multiparametric magnetic resonance imaging and spectroscopy: assessment of prognostic factors on pretreatment imaging. Quantitative Imaging Med Surgery. (2022) 12(12):5309–25. doi: 10.21037/qims-22-184
22. Billis A, Freitas LLL, Costa LBE, de Angelis CM, Carvalho KR, Magna LA, et al. Does index tumor predominant location influence prognostic factors in radical prostatectomies? Int Braz J Urol. (2017) 43(4):686–97. doi: 10.1590/S1677-5538.IBJU.2016.0335
23. Chun FK, Briganti A, Jeldres C, Erbersdobler A, Schlomm T, Steuber T, et al. Zonal origin of localized prostate cancer does not affect the rate of biochemical recurrence after radical prostatectomy. Eur Urol. (2007) 51(4):949–55. doi: 10.1016/j.eururo.2006.07.008
24. Falzarano SM, Nyame YA, McKenney JK, Przybycin CG, Li J, Stephenson A, et al. Clinicopathologic features and outcomes of anterior-dominant prostate cancer: implications for diagnosis and treatment. Prostate Cancer Prostatic Diseases. (2020) 23(3):435–40. doi: 10.1038/s41391-019-0199-1
25. Iremashvili V, Pelaez L, Jordá M, Manoharan M, Rosenberg DL, Soloway MS. Prostate cancers of different zonal origin: Clinicopathological characteristics and biochemical outcome after radical prostatectomy. Urology. (2012) 80(5):1063–9. doi: 10.1016/j.urology.2012.08.012
26. Kim JJ, Hong SK, Byun SS. Oncological prognosis and pathological feature after radical prostatectomy according to the zonal origin of high grade prostate cancer. J Urology. (2020) 203:e946–e7. doi: 10.1097/JU.0000000000000937.04
27. Lee JJ, Thomas IC, Nolley R, Ferrari M, Brooks JD, Leppert JT. Biologic differences between peripheral and transition zone prostate cancer. Prostate. (2015) 75(2):183–90. doi: 10.1002/pros.22903
28. Magheli A, Rais-Bahrami S, Peck HJ, Walsh PC, Epstein JI, Trock BJ, et al. Importance of tumor location in patients with high preoperative prostate specific antigen levels (Greater than 20 ng/ml) treated with radical prostatectomy. J Urology. (2007) 178(4):1311–5. doi: 10.1016/j.juro.2007.05.143
29. Mygatt J, Sesterhenn I, Rosner I, Chen Y, Cullen J, Morris-Gore T, et al. Anterior tumors of the prostate: Clinicopathological features and outcomes. Prostate Cancer Prostatic Diseases. (2014) 17(1):75–80. doi: 10.1038/pcan.2013.54
30. Sakai I, Harada KI, Kurahashi T, Yamanaka K, Hara I, Miyake H. Analysis of differences in clinicopathological features between prostate cancers located in the transition and peripheral zones. Int J Urology. (2006) 13(4):368–72. doi: 10.1111/j.1442-2042.2006.01307.x
31. Sato S, Kimura T, Onuma H, Egawa S, Takahashi H. Transition zone prostate cancer is associated with better clinical outcomes than peripheral zone cancer. BJUI Compass. (2021) 2(3):169–77. doi: 10.1002/bco2.47
32. Shin N, Park SY. Postoperative biochemical failure in patients with PI-RADS category 4 or 5 prostate cancers: risk stratification according to zonal location of an index lesion. Am J Roentgenology. (2020) 215(4):913–9. doi: 10.2214/AJR.19.22653
33. Takamatsu K, Matsumoto K, Shojo K, Tanaka N, Takeda T, Morita S, et al. The prognostic value of zonal origin and extraprostatic extension of prostate cancer for biochemical recurrence after radical prostatectomy. Urologic Oncology: Semin Original Investigations. (2019) 37(9):575. doi: 10.1016/j.urolonc.2019.03.012
34. Cowan T, Baker E, McCray G, Reeves F, Houlihan K, Johns-Putra L. Detection of clinically significant cancer in the anterior prostate by transperineal biopsy. BJU Int (2020) 126 Suppl 1:33–7. doi: 10.1111/bju.15124
35. McNeal JE, Haillot O. Patterns of spread of adenocarcinoma in the prostate as related to cancer volume. Prostate. (2001) 49(1):48–57. doi: 10.1002/pros.1117
36. O'Neil LM, Walsh S, Cohen RJ, Lee S. Prostate carcinoma with positive margins at radical prostatectomy: Role of tumour zonal origin in biochemical recurrence. BJU Int (2015) 116:42–8. doi: 10.1111/bju.13173
37. Adler D, Lindstrot A, Ellinger J, Rogenhofer S, Buettner R, Wernert N. Genes differentially expressed in the peripheral zone compared to the transitional zone of the normal human prostate and their potential regulation by ETS factors. Mol Med Rep (2012) 5(1):32–6. doi: 10.3892/mmr.2011.628
38. Al Kadhi O, Traka MH, Melchini A, Troncoso-Rey P, Jurkowski W, Defernez M, et al. Increased transcriptional and metabolic capacity for lipid metabolism in the peripheral zone of the prostate may underpin its increased susceptibility to cancer. Oncotarget. (2017) 8(49):84902–16. doi: 10.18632/oncotarget.17926
39. Guo CC, Zuo G, Cao D, Troncoso P, Czerniak BA. Prostate cancer of transition zone origin lacks TMPRSS2-ERG gene fusion. Mod Pathol (2009) 22(7):866–71. doi: 10.1038/modpathol.2009.57
40. Falzarano SM, Navas M, Simmerman K, Klein EA, Rubin MA, Zhou M, et al. ERG rearrangement is present in a subset of transition zone prostatic tumors. Mod Pathol (2010) 23(11):1499–506. doi: 10.1038/modpathol.2010.150
41. Goldman H, Singh N, Harding C, McGirr J, Seal A, Duncan I, et al. Accuracy of multiparametric magnetic resonance imaging to detect significant prostate cancer and index lesion location. ANZ J Surg (2019) 89(1-2):106–10. doi: 10.1111/ans.14754
42. Wibulpolprasert P, Raman SS, Hsu W, Margolis DJA, Asvadi NH, Khoshnoodi P, et al. Influence of the location and zone of tumor in prostate cancer detection and localization on 3-T multiparametric MRI based on PI-RADS version 2. AJR Am J Roentgenol. (2020) 214(5):1101–11. doi: 10.2214/AJR.19.21608
Keywords: prostatic neoplasms, transition zone, peripheral zone, prognosis, biochemical recurrence
Citation: Jin S, Wu L, Liang Z and Yan W (2023) The prognostic value of zonal origin in clinically localized prostate cancer: a systematic review and meta-analysis. Front. Oncol. 13:1248222. doi: 10.3389/fonc.2023.1248222
Received: 03 July 2023; Accepted: 21 November 2023;
Published: 08 December 2023.
Edited by:
Sharon R. Pine, University of Colorado, United StatesReviewed by:
Yuxuan Song, Peking University People’s Hospital, ChinaFahad Quhal, King Fahad Specialist Hospital Dammam, Saudi Arabia
Copyright © 2023 Jin, Wu, Liang and Yan. This is an open-access article distributed under the terms of the Creative Commons Attribution License (CC BY). The use, distribution or reproduction in other forums is permitted, provided the original author(s) and the copyright owner(s) are credited and that the original publication in this journal is cited, in accordance with accepted academic practice. No use, distribution or reproduction is permitted which does not comply with these terms.
*Correspondence: Weigang Yan, eWFud2VpZ2FuZ0BwdW1jaC5jbg==