 Nora Sahnane1,2*†
 Laura Libera2,3†
 Sofia Facchi2,3
 Ileana Carnevali1,2Susanna Ronchi1,2Chiara Albeni1Antonella Cromi3,4
 Jvan Casarin2,3,4
 Fausto Sessa1,2,3Maria Grazia Tibiletti2
- 1Unit of Pathology, Azienda Socio Sanitaria Territoriale (ASST) Sette Laghi, Varese, Italy
- 2Research Centre for the Study of Hereditary and Familial Tumors, University of Insubria, Varese, Italy
- 3Department of Medicine and Technological Innovation, University of Insubria, Varese, Italy
- 4Obstetrics and Gynaecology Department, Del Ponte Women’s and Children’s Hospital, Varese, Italy
Introduction: BRCA1 methylated (BRCA1met) epithelial ovarian cancer (EOC) is a recently defined and not well-investigated subset of neoplasms. To date, no studies have focused on the transcriptional profiles of BRCA1met cases, and, as a matter of fact, we still do not know if this subset of EOCs is similar, and to what extent, to BRCA1 mutated (BRCA1mut) cases.
Methods: We compared a group of 17 BRCA1met cases against 10 BRCA1mut cases using a subset of carefully selected 17 BRCAwt EOCs as a control group.
Results: First, BRCA1met cases showed a downregulation of the relative transcript, while this association was not observed for BRCA1mut EOCs. The BRCA1met group exhibited a general upregulation of homologous recombination (HR)-related genes, as well as BRCA1mut. Overall, BRCA1met had a different gene expression profile, characterized by diffuse downregulation, whereas BRCA1mut showed a general upregulation (p < 0.0001). Both BRCA1-defective groups showed a slightly activated immune response mediated by interferon (IFN) gamma pathways.
Discussion: In conclusion, even if the expression profile of many genes related to DNA damage and repair system is shared between BRCA1mut and BRCA1met EOCs supporting that BRCA1met EOCs may benefit from PARPi therapies, our data demonstrate that BRCA1mut and BRCA1met EOCs show different expression profiles, suggesting a different mechanism of carcinogenesis that can be reflected in different responses to therapies and disease recovery.
1 Introduction
Epithelial ovarian cancer (EOC) is the most common lethal malignancy among gynecological cancers with a poor outcome due to late diagnosis caused by a lack of early signs and symptoms of this disease (1). The standard treatment for EOCs is cytoreductive surgery and platinum-based chemotherapy. Recently, therapy with PARP inhibitors (PARPi) has been proven to be effective for patients with EOC showing homologous recombination deficiency (HRD), which is mainly observed in EOCs harboring germinal/somatic pathogenetic variants or promoter methylation of the genes involved in homologous recombination (HR) pathway, mainly BRCA1 and BRCA2 genes (2, 3). In Italy, PARPi therapy has been approved as a maintenance treatment for patients with HRD EOCs in the front-line setting after chemotherapy as well as in the second-line treatment of recurrent platinum-sensitive disease regardless of HRD status. However, the most important predictive biomarkers for PARPi sensitivity are BRCA1 and BRCA2 pathogenetic variants and more recently HRD status (4–7).
In recent times, a growing body of research has identified a subgroup of EOCs that exhibit a phenomenon called promoter hypermethylation of BRCA genes. Interestingly, this subgroup is even more prevalent than the subgroup of EOCs with somatic BRCA mutations. Moreover, patients with BRCA-methylated EOCs tend to have a more favorable prognosis compared to those with unmethylated EOCs (8–11). Despite these findings, the nature of BRCA-methylated EOCs remains poorly understood, particularly in the context of personalized cancer therapy. No studies have yet investigated the expression patterns of these cases in relation to EOCs with BRCA mutations. It is still uncertain whether BRCA-methylated cases share a similar transcriptional profile with mutated cases. Furthermore, from a clinical perspective, it is unclear whether this subset of cases exhibits the same sensitivity to platinum-based and PARPi therapies as cases with BRCA mutations do.
To this aim, the expression profiles of 750 genes were analyzed in a series of 47 EOCs composed of methylated BRCA (BRCAmet), BRCA1-mutated (BRCAmut), and BRCA wild-type/unmethylated (BRCAwt) EOCs in order to find out the differences and similarities between epigenetically and genetically BRCA-defective groups and to explore a biomarker signature, if any, that could better predict response and sensitivity to platinum and PARPi therapies in these subsets of EOCs.
2 Materials and methods
2.1 EOC series
In this retrospective study, we analyzed a total of 47 samples of formalin-fixed and paraffin-embedded (FFPE) EOCs collected in the Department of Pathology ASST Sette Laghi in Varese (Italy) from 2008 to 2019. All EOCs were tested for somatic and germline BRCA1/2 variants and BRCA1/2 promoter methylation.
Three subsets of EOCs were selected: group A (called BRCAwt), which includes 17 samples from women who tested negative for germline and somatic BRCA1 and BRCA2 variants and negative for other genes including HR-related genes (namely, ATM, BRCA1, BRCA2, BARD1, BLM, BRIP1, CDH1, CHEK2, EPCAM, FAM175A, MEN1, MLH1, MRE11A, MSH2, MSH6, MUTYH, NBN, PALB2, PARP1, PARP2, PMS2, PTEN, RAD50, RAD51, RAD51C, RAD51D, RBBP8, STK11, TERF2, TOPBP1, TP53, XRCC1, XRCC2, and ZNF423), as reported by Salvati and colleagues (12). In this subset of cases, large rearrangements were not investigated in a somatic setting. Group B (called BRCA1mut) includes 10 EOCs from women with germline Class 4 or Class 5 variants in BRCA1 gene. Group C (called BRCAmet), the group of interest, was composed of 20 EOCs that showed somatic methylation of BRCA1 (n = 16), BRCA2 (n = 3), or both (n = 1) gene promoters. It is worth mentioning that the BRCA1 methylation test was conducted using a customized procedure that targeted the promoter regions associated with gene silencing, as previously outlined in the study conducted by Sahnane et al. (9). For the BRCA1 test, we performed a cross-validation study with another Italian laboratory to technically validate the assay (8). The BRCA2 test was designed as described by Vos et al. and Sahnane et al. (9, 13).
All primary EOCs were reviewed and classified by two independent pathology experts in gynecopathology according to the new 2020 World Health Organization (WHO) classification system (14). Ninety-two percent of EOCs were high-grade, and the most frequent histotype was serous (73%). The mean age of onset in the BRCAmut group was significantly lower than in the BRCAmet group (49.2 versus 58 years, respectively; p = 0.0083; Supplementary Table 1).
All analyses were performed in agreement with the Declaration of Helsinki, and the study was approved by the Research Ethics Committee of ATS Insubria (ID 238/2018).
2.2 RNA isolation and NanoString nCounter® PanCancer IO360
Total RNA was obtained after manual microdissection from three representative FFPE sections (8 µm) of 47 ovarian tumor samples using the Maxwell® RNA FFPE Kit and Maxwell 16 system (Promega, Madison, WI, USA) according to the recommendations of the manufacturer. RNA was quantified using Qubit™ RNA XR Assay Kit (Invitrogen–Thermo Fisher Scientific, Waltham, MA, USA) and conserved at −80°C until use.
Gene expression analysis was conducted on the NanoString nCounter® gene expression platform (NanoString Technologies, Seattle, WA, USA) using the NanoString PanCancer IO 360™ code set, as we previously described in Bolzacchini et al. (15). NanoString nCounter® PanCancer IO360 code set included 20 reference genes and 750 target genes that were grouped in 13 categories as listed in Supplementary Table 2, such as Release of Cancer Cell Antigens (74 genes involved in DNA damage response and repair), Tumor-Intrinsic Factors (155 genes), and Common Signalling Pathways (162 genes included in Wnt, Hedgehog, TGF-beta, NF-kB, Notch, PI3K-Akt, and RAS-MAPK pathways). In detail, a total of 250–300 ng of RNA per sample was mixed with a 3′ biotinylated capture probe and a 5′ reporter probe tagged with a fluorescent barcode. The probes and target transcripts were hybridized overnight at 65°C for 12–16 h, according to the manufacturer’s recommendations. The hybridized samples were run on the NanoString nCounter® preparation station using the high-sensitivity protocol and scanned at high resolution (280 fields of view (FOVs)) on the nCounter Digital Analyzer. The resulting data file in RCC format was used for data analysis.
2.3 NanoString nCounter® PanCancer IO360 analysis and statistics
The RCC data for each sample were normalized to internal controls by using nSolver 4.0 software. The obtained counts were then normalized to the geometric mean of 20 endogenous housekeeping genes followed by log2 transformation. Gene expression signatures were calculated as a weighted linear average of the constituent genes (15). The weighted scores used for the calculation of the signatures are NanoString® intellectual property. Normalized gene counts and signature scores were compared to molecular and clinical features. The log2 fold-change, Wald-type confidence interval, and p-value were calculated for each gene and signature.
STRING database of known and predicted interaction was used to identify any possible protein–protein interactions between differentially expressed genes obtained by NanoString® analysis (16). The interactions included direct (physical) and indirect (functional) associations (from computational prediction, knowledge transfer between organisms, and interactions aggregated from primary databases).
Gene list enrichment analysis was performed on April 2023 using ToppGene Suite (17) (updated 8-ago-2022), a one-stop portal for gene list enrichment analysis and candidate gene prioritization, by using the ToppFun tool. The analysis uses 14 annotation categories including gene ontology (GO) terms, pathways, protein–protein interactions, protein functional domains, transcription factor-binding sites, microRNAs, tissue-specific gene expression, and literature. The enrichment significance cutoff level was set to 0.05.
GraphPad v.5.0 (GraphPad Software Inc., San Diego, CA, USA) software was used for the statistical analysis. In detail, Student’s t-test and ANOVA followed by the Bonferroni test, Pearson’s chi-square test, and linear regression analyses were performed, and a p-value of <0.05 was considered significant.
3 Results
3.1 BRCA1-methylated EOC showed downregulation of BRCA1 transcript
First, to determine if BRCA1 methylated cases (BRCA1met) actually showed downregulation of BRCA1 gene transcript, their BRCA1 mRNA levels were compared to those observed in BRCAwt EOCs (Figure 1A, Supplementary Table 1). A significant downregulation of BRCA1 transcript was observed for the 17 BRCA1 methylated cases (one of those showed both BRCA1 and BRCA2 methylation) compared to BRCAwt, with a mean value of log2 counts of 4.94 and 5.9, respectively (p < 0.0001, Figure 1A). Highly BRCA1 methylated (methylation level ≥50%, n = 8) and low BRCA1 methylated (methylation level at 15%–49%, n = 9) EOCs showed a similar degree of BRCA1 downregulation (mean log2 counts 5.2 vs. 4.7, p-value = 0.1709). Even with a BRCA1 methylation cutoff of 70%, no differences in BRCA1 transcript levels between high and low methylation cases were observed (respectively, 4.9 vs. 5.2, p-value = 0.4925). In the three BRCA2 methylated cases, no differences in BRCA1 expression (5.92 log2 counts) were observed in comparison to BRCAwt EOCs.
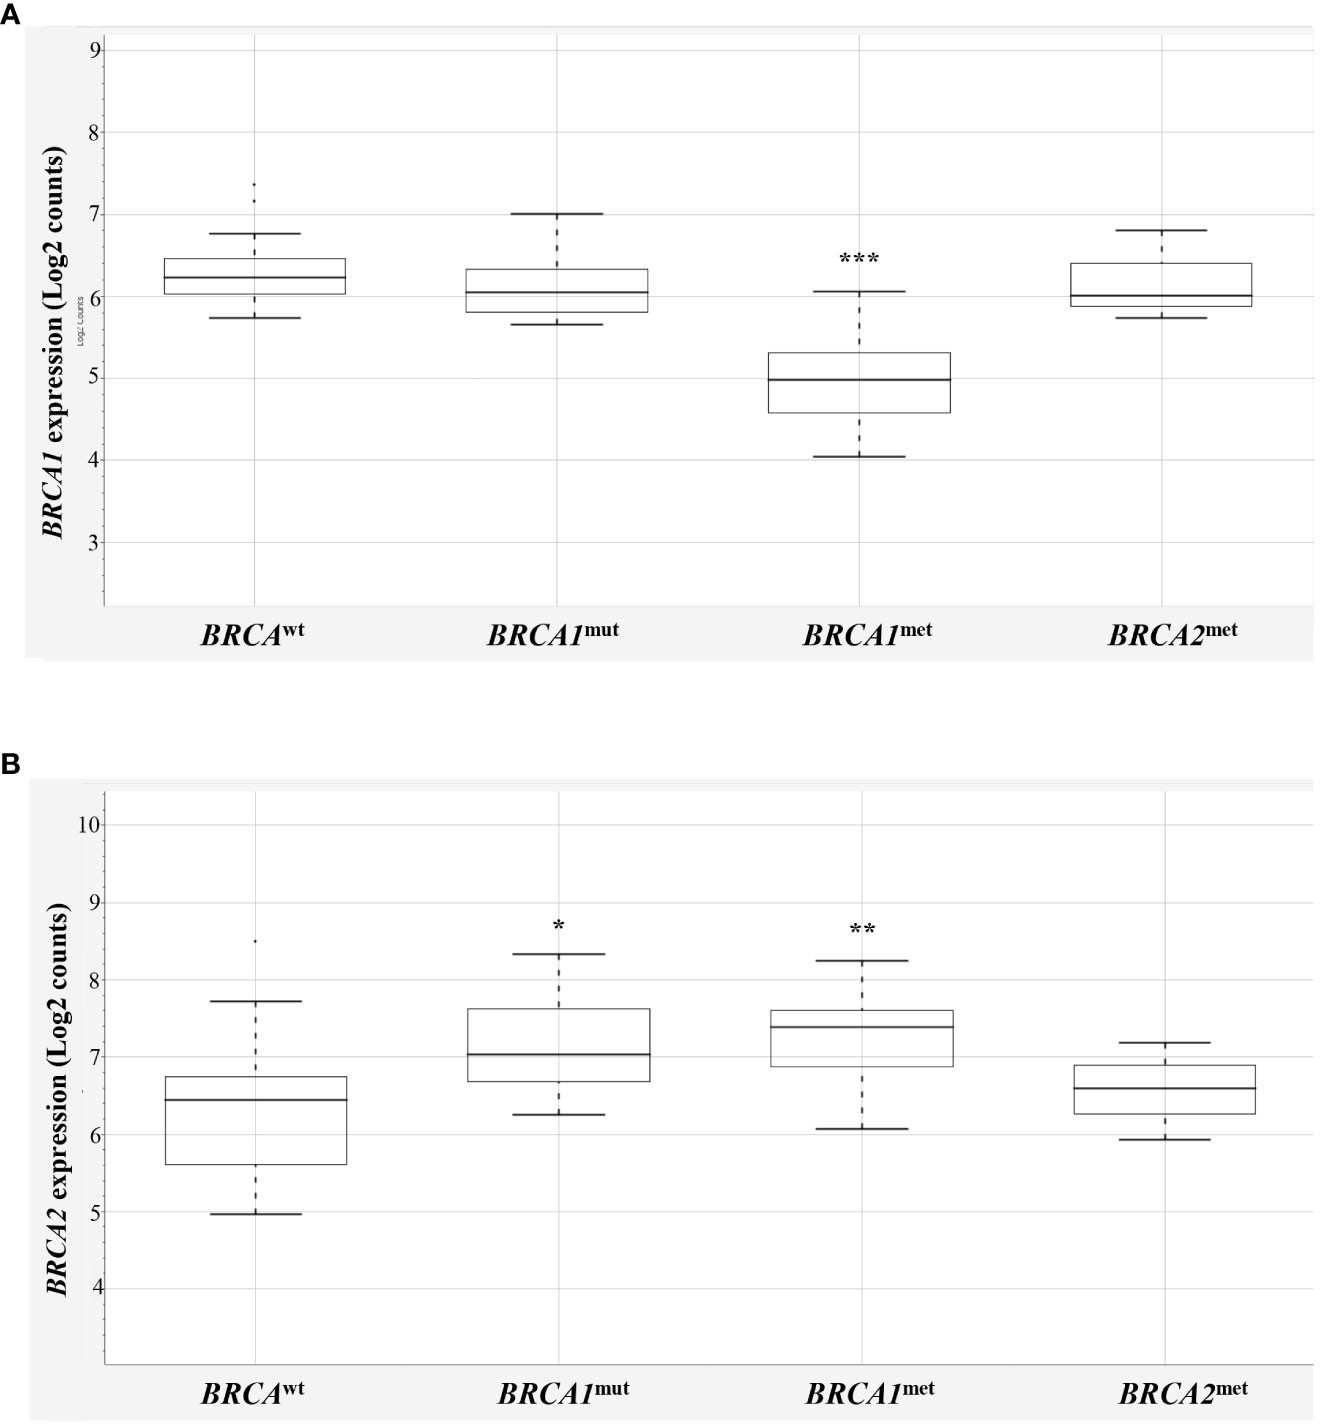
Figure 1 BRCA1 and BRCA2 expression in EOCs. Box-plot distribution of BRCA1 (A) and BRCA2 (B) mRNA expression in BRCAwt, BRCA1mut, BRCA1met, and BRCA2met EOCs. The expression data are reported as log2 absolute counts of each gene for each sample. Significant downregulation/upregulation of BRCA1 or BRCA2 genes is marked by asterisks. Legend: * p = 0.02–0.05; ** p = 0.0001–0.01; *** p < 0.0001. EOC, epithelial ovarian cancer.
Interestingly, BRCA1 expression evaluation considering the BRCA1mut group did not highlight differences versus BRCAwt EOCs, indicating that BRCA1 mutated cases did not display a downregulation of BRCA1 expression levels. No differences were recorded considering truncating or stop variants (n = 8) versus missense variants (n = 2, Supplementary Table 1), although very few cases were available for this analysis. As reported in the literature (18), the majority of EOCs have a complex chromosome constitution showing several polysomies and of consequence several BRCA1 alleles. On this ground, it is expected that BRCA1mut transcripts are comparable with BRCAwt transcripts. In addition, NanoString® probes detecting BRCA1 and BRCA2 mRNAs map on exon 13–14 junction of BRCA1 and on exon 10 of BRCA2 transcripts.
Then, BRCA2 expression was compared in the four BRCA2-methylated cases (one of those showed both BRCA1 and BRCA2 methylation) with respect to the BRCAwt group, but, unexpectedly, no significant differences between the two groups were observed (6.27 vs. 6.03 mean log2 counts, respectively; Figure 1B). This finding may suggest that the BRCA2 methylation test did not address informative BRCA2 promoter regions—if any—that are associated with gene silencing, casting doubts about the performance of the BRCA2 methylation test used. Thus, to keep data consistency and exclude any possible bias, the three BRCA2 methylated cases were eliminated from further analyses (Supplementary Table 1, ID# 28, 29, 39).
Surprisingly, BRCA1-defective classes (10 BRCA1mut and 17 BRCA1met) showed a significant upregulation of BRCA2 mRNA versus BRCAwt class (7.24 and 7.21, respectively versus 6.03 mean log2 counts, p = 0.0122 and p = 0.0039, Figure 1B).
3.2 DNA damage and repair system genes are upregulated in BRCA1-defective EOCs
Based on what was observed for BRCA2 gene expression and in order to understand if other genes with overlapping functions may compensate for the putative impairment of BRCA1, we compared the expression of 61 genes involved in DNA damage and repair in BRCA-defective cases with BRCAwt EOCs (Supplementary Table 3, all genes). We observed that, beyond BRCA1 and BRCA2 genes, the other 17 genes involved in DNA damage and repair were differently expressed (DE) in BRCA1-defective cases with respect to BRCAwt (Table 1, Supplementary Table 1 and Supplementary Figure 1). In detail, in both BRCA1-defective groups, HELLS, MRE11, UBE2C, and UBE2T were upregulated with respect to BRCAwt EOC. Nine genes (BRIP1, DTX3L, H2AFX, MSH2, PARP12, PARP9, RAD51, TYMS, and WDR76) were upregulated in BRCA1mut only, whereas EXO1, FANCA, and MGMT were upregulated exclusively in BRCA1met cases versus BRCAwt EOCs. Curiously, in BRCA1met, we found solely one gene downregulated with respect to BRCAwt EOCs, namely, the DDB2 gene. Interestingly, the DDB2 promoter region contains a response element for p53-BRCA1-E2F downstream of the transcription initiation site, and it has been demonstrated that BRCA1 downregulation leads to the downregulation of DDB2 expression (19, 20).
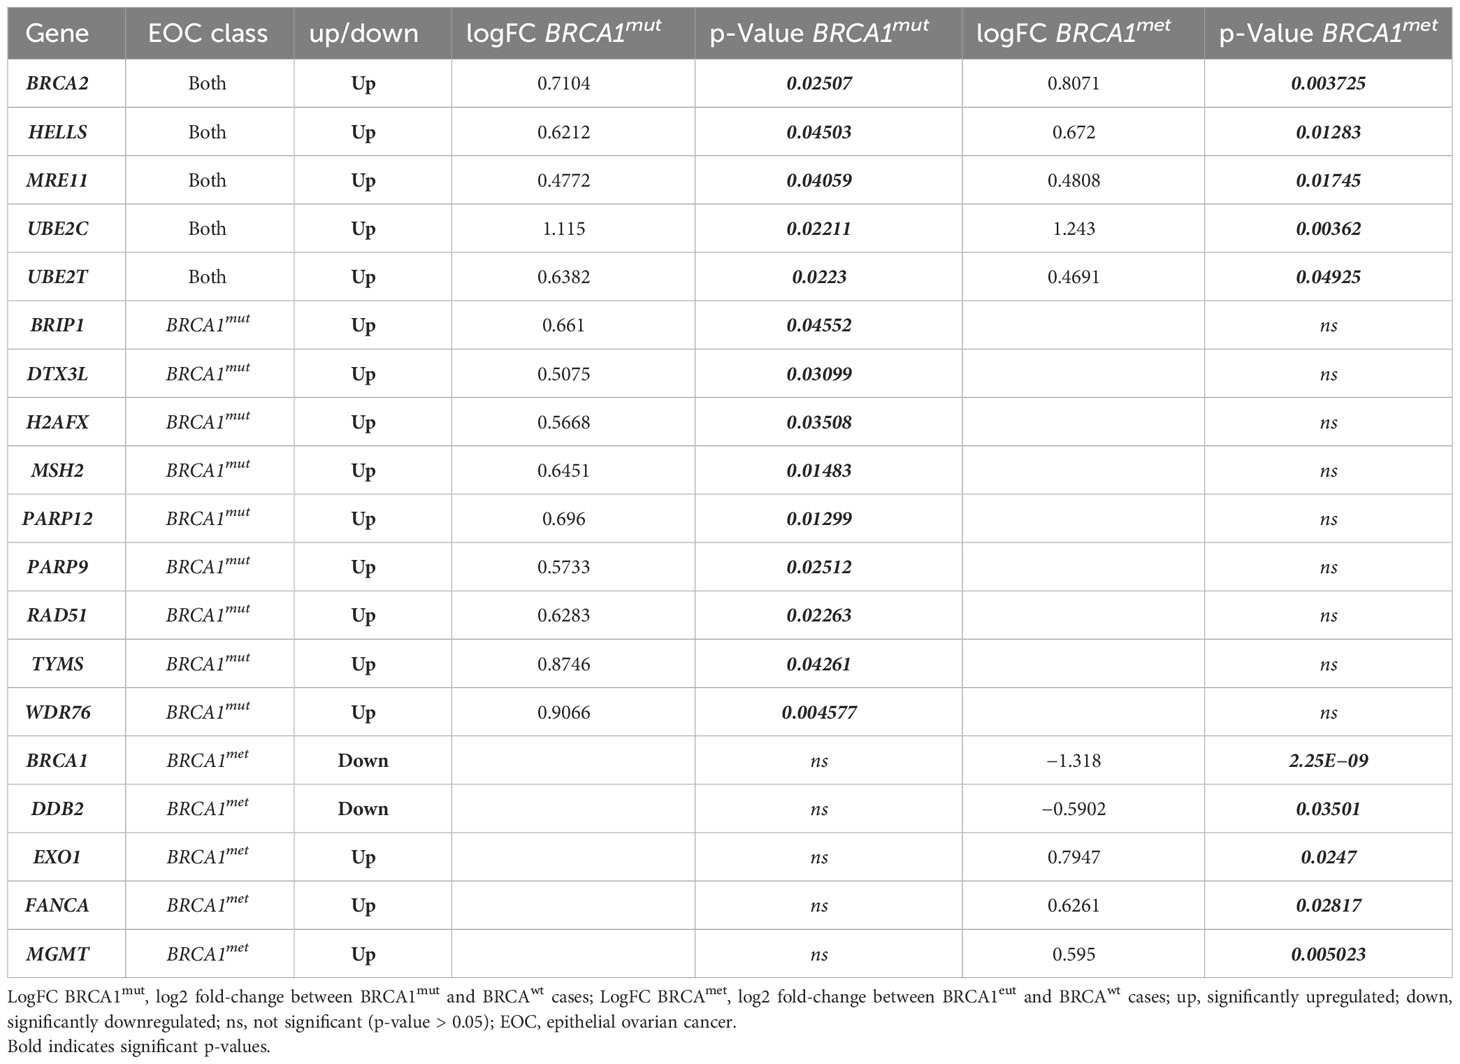
Table 1 Significantly upregulated/downregulated DNA damage and/or repair genes in BRCA-defective cases (BRCA1mut and BRCA1met) compared to BRCAwt EOCs.
Although all these DE genes are known to be involved in DNA damage and repair systems, such as HR, base excision repair (BER), nucleotide excision repair (NER), mismatch repair (MMR), non-homologous end joining (NHEJ), and chromatin remodeling (CR) (Table 1), we wondered if crosstalk between these systems would exist. Supplementary Figure 1 shows that these DE genes are connected by shared function or are part of a physical complex. In addition, when considering the direct interactions only (Supplementary Figure 1B), STRING analysis identified a main group including 12 interacting proteins, whereas HELLS-WDR76, MGMT, DDB2, and DTX3L-PARP9-PARP12 do not directly bind a BRCA1-associated complex.
3.3 BRCA1met EOCs show a distinctive gene expression profile
The comparative analysis between EOC groups was extended to all 750 genes. Remarkably, a total of 196 genes were differentially expressed in BRCA1-defective cases with respect to BRCAwt EOC (Supplementary Table 3). Interestingly, among all the pathways activated or repressed in BRCA1-defective EOCs compared to BRCAwt cases, both the BRCA1met and BRCA1mut groups shared significant upregulation of proliferation signature (p = 0.02232 and p = 0.01051, respectively), suggesting a more aggressive behavior of these EOCs in comparison to HR proficient ovarian cancers (Table 2). Regarding anti-tumor immune activity, no difference in Tumor Inflammation Signature (TIS) was observed among all classes of EOCs, suggesting a general “cold” immunological profile. Of note, 53 out of 196 genes resulted in DE in both BRCA1met and BRCA1mut EOCs in comparison to BRCAwt cases, possibly indicating a common pathogenetic profile driven by BRCA1 deficiency. Twenty-seven genes were downregulated, while 26 genes were upregulated in both BRCA1-defective groups. The 27 downregulated transcripts were significantly enriched by genes involved in cell attachment to extracellular matrix (ECM), cell death, and apoptosis by regulating p53, WNT, RAS, or PI3K/AKT pathways, whereas the 26 upregulated transcripts were enriched by genes involved in cell cycle regulation, DNA damage and repair, chromosome organization, and immune response (Supplementary Table 3).
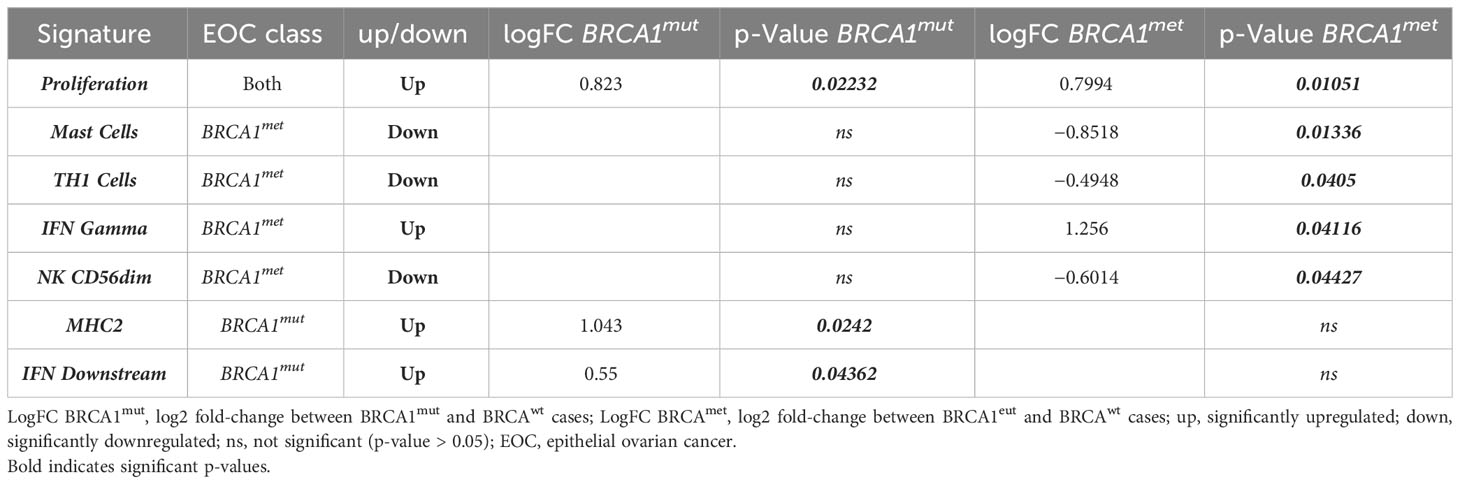
Table 2 Significantly upregulated/downregulated gene signature in BRCA-defective cases (BRCA1mut and BRCA1met) compared to BRCAwt EOCs.
Interestingly, a total of 58 out of 196 genes were DE exclusively in BRCA1mut EOCs (Supplementary Table 3, Figure 2A): only 13 genes were downregulated, while 45 genes (78%) were significantly upregulated. In detail, the 13 downregulated transcripts were significantly enriched by genes involved in cell–cell adhesion and regulation of apoptotic process (such as ARG2, SERPINB5, PVR, CASP9, and WNT5B genes); instead, the 45 upregulated genes were significantly enriched by functions as innate immune response and cell cycle regulation (Supplementary Table 3, Figure 2C). In fact, both MHC2 and interferon (IFN) DOWNSTREAM signatures were significantly upregulated in this subset of EOCs (Table 2).

Figure 2 Top genes that are differentially expressed in BRCA1mut and BRCA1met EOCs. Volcano plots display each gene’s fold change (x-axis) and significance (p-value, y-axis) between (A, C) BRCA1mut (B group) and BRCAwt (A group) samples and (B, D) between BRCA1met (C group) and BRCAwt (A group) samples. Genes that have greater statistical significance will produce points that are both larger and darker in hue, in addition to appearing higher on the plot. Genes that have greater differential expression versus the baseline group (BRCAwt, A group) appear further from the center of the plot. Genes further to the right indicate an increase in expression, and genes further to the left indicate a decrease in expression relative to the baseline group. Horizontal lines indicate 0.01 and 0.05 p-values. Blue dots indicate adjusted p-values lower than 0.05. Green dots indicate adjusted p-values higher than 0.05. The lower panels focus only on the 196 significantly DE genes in BRCA1mut and BRCA1met EOCs: red-dotted square indicates upregulated genes in BRCA1mut; blue-dotted square indicates downregulated genes in BRCA1met. EOC, epithelial ovarian cancer; DE, differentially expressed.
Finally, 85 out of 196 genes were DE exclusively in the BRCA1met group (Supplementary Table 3, Figure 2B): 73 of these genes (86%) were significantly downregulated, whereas only 12 genes were upregulated in comparison to BRCAwt EOCs. The 73 downregulated transcripts were enriched by genes involved in the regulation of cell death, cytokine–cytokine interaction, and development, while the 12 upregulated transcripts were enriched by genes of regulation of the immune system such as ICOSLG, BID, CXCL16, and VTCN1 and DNA repair genes (Supplementary Table 3, Figure 2D). In detail, in BRCA1met EOCs, a significant downregulation of MAST CELLS, TH1 CELLS, and NK CD56DIM signatures were identified, whereas a significant upregulation of IFN GAMMA signature was observed (Table 2).
In spite of a cold immune signature background, both BRCA1-defective groups show a slightly activated immune response mediated by IFN gamma pathways.
Overall, comparing the expression profiles of the BRCA1mut and BRCA1met groups, BRCA1met EOCs show a significant strong gene downregulation with respect to BRCA1mut cases (chi-square p-value < 0.0001, Figures 2C, D), suggesting that, irrespective of the DE gene functions, remarkably different oncogenic mechanisms underlying the tumor initiation phase of BRCA1mut or BRCA1met EOC exist.
4 Discussion
Much clinical evidence demonstrated that BRCA pathogenetic variants are positive predictors of response to platinum-based and PARPi therapies (3, 11, 21–23). HRD status resulting from the disruption of genes involved in the HR pathway is currently considered a useful clinical tool to detect PARPi-eligible cases (5). However, HRD status embraces a class of heterogeneous tumors showing a wide spectrum of pathogenetic mechanisms, including somatic, germline, or epigenetic alteration of several HR genes. Thus, HRD status might not be a suitable marker to predict specific therapy responses and patient outcomes. Despite this, the HRD test is spreading through many laboratories, without a consolidated knowledge about the overlap between the HRD test and, in particular, BRCA methylation that characterized approximately 20% of BRCA wild-type EOCs (9). To date, no studies have focused on the transcriptional profiles of BRCA methylated cases, and, as a matter of fact, we still do not know if this subset of EOC is similar, and to what extent, to BRCA mutated cases.
In this study, we compared the expression profile of BRCA1met and BRCA1mut EOCs with respect to carefully selected EOC groups without germline or somatic defects in HR genes (namely, BRCAwt EOCs) using a highly sensitive and precise transcript quantification method (24).
As a preliminary step, we verified that BRCA1met cases had a downregulation of BRCA1 transcript, irrespective of the degree of promoter methylation. This is in line with what was reported in our previous work by using a real-time approach on a small subset of BRCA1met EOCs (8). Of note, the setting of a cutoff of methylation with a clinical meaning is a tricky issue, even in the light of the chromosome instability with chromosome 17 aneuploidies that characterize virtually all EOCs (3, 25, 26), the tumor purity of each analyzed sample, the type of method used for methylation quantification, and the size of validation cohorts (27, 28). On the contrary, in BRCA1mut cases, the gene dosage was not altered, neither in cases showing a truncating mutation, as it is expected that the loss of function is due to a pathogenetic non-functional protein variant. Indeed, epigenetic and genetic BRCA1 alterations are mutually exclusive as extensively demonstrated in the literature (3, 9, 28, 29).
Compared to BRCAwt EOC, both BRCA1mut and BRCA1met cases display an upregulation of many genes related to DNA damage and repair system, among them BRCA2 transcript, supporting the concept, better explained elsewhere (30), that the perturbation of a particular gene’s function may alter the expression of other genes within the same network as a mechanism to try to maintain cellular wellness (31, 32). Moreover, both subsets show the upregulation of pathways related to cell proliferation and interferon gamma. These findings were extensively demonstrated for BRCA1mut cases; in fact, several authors proved that BRCA1 loss leads to transcriptional reprogramming in tumor cells involving type I IFN signaling (33–35).
Considering all the 196 DE transcripts, the analysis of single genes highlighted a prevalent “upregulation profile” in BRCA1mut and a prevalent “downregulation profile” in BRCA1met (Figure 2). This finding suggests that the pathogenetic mechanisms of BRCA1mut and BRCA1met may be very different and that widespread methylation may characterize the initial tumorigenesis of the latter group. Interestingly, many authors have reported that a subset of ovarian cancers can be characterized by extensive gene hypermethylation, suggesting the existence of a CpG Island Methylator Phenotype (CIMP) in the ovarian site (36–39). This phenotype has been deeply characterized and illustrated in colorectal cancer (CRC), where CIMP-CRC has been classified as a distinctive entity, with MLH1 methylation as the flag of a diffuse methylator pattern (40). Transposing this concept to the ovarian site, BRCA1 methylation could be the hint to identify such cases. Moreover, the presence of widespread methylation might prompt further investigation to identify epigenetic drugs, as well as to address potential different clinical outcomes as reported for other tumor sites (41).
Curiously, despite that the genes deregulated in the BRCA1mut and BRCA1met EOCs are remarkably different, the enrichment analysis suggests that, overall, the two groups share the same perturbed pathways. This finding, derived from the study of a limited proportion of the transcriptome, i.e., 750 genes grouped in 48 pathways, deserves to be further investigated by global expression analysis. In fact, BRCA1mut and BRCA1met EOCs may result as different entities, presenting even more remarkable differences than those highlighted by this study.
Furthermore, these findings indicate the potential expansion of this approach to other tumor sites where BRCA is implicated, aiming to explore whether methylation is a prevalent characteristic across different types of tumors.
In summary, this study represents the first instance where a correlation has been established between promoter methylation, as identified through a BRCA1 methylation test developed in-house, and transcript downregulation. Moreover, BRCA1met EOCs are characterized by diffuse gene downregulation, suggesting that this subset shows a pathogenetic mechanism remarkably different with respect to BRCA1mut cases. Even if the expression profile of many genes related to DNA damage and repair system is shared between BRCA1mut and BRCA1met EOCs, supporting that BRCA1met EOCs may benefit from PARPi therapies, our data demonstrate that BRCA1mut and BRCA1met EOCs have different expression profiles underlying different mechanisms of carcinogenesis that can influence the type of responses to therapies and disease recovery.
Data availability statement
The data presented in this study are available in the article or in supplementary material.
Ethics statement
The studies involving humans were approved by Research Ethics Committee of ATS Insubria (ID 238/2018). The studies were conducted in accordance with the local legislation and institutional requirements. The participants provided their written informed consent to participate in this study.
Author contributions
NS: Data curation, Writing – original draft. LL: Data curation, Formal Analysis, Writing – original draft. SF: Data curation, Formal Analysis, Writing – original draft. IC: Data curation, Writing – review & editing. SR: Data curation, Writing – review & editing. CA: Data curation, Writing – original draft. AC: Data curation, Writing – review & editing. JC: Data curation, Writing – review & editing. FS: Conceptualization, Funding acquisition, Writing – review & editing. MT: Conceptualization, Funding acquisition, Supervision, Writing – review & editing.
Funding
The authors declare financial support was received for the research, authorship, and/or publication of this article. This work was supported by the University of Insubria (Grant “Alessandra Tozzi” and fellowships to SF and LL). The funding sources had no role in the design and execution of the study.
Acknowledgments
We thank Sarah E. Church for NanoString bioinformatics support.
Conflict of interest
The authors declare that the research was conducted in the absence of any commercial or financial relationships that could be construed as a potential conflict of interest.
Publisher’s note
All claims expressed in this article are solely those of the authors and do not necessarily represent those of their affiliated organizations, or those of the publisher, the editors and the reviewers. Any product that may be evaluated in this article, or claim that may be made by its manufacturer, is not guaranteed or endorsed by the publisher.
Supplementary material
The Supplementary Material for this article can be found online at: https://www.frontiersin.org/articles/10.3389/fonc.2023.1268127/full#supplementary-material
Supplementary Figure 1 | Protein–protein networks of significantly down/up-regulated genes in BRCA-defective EOCs by using STRING database. Network nodes represent proteins: splice isoforms or post-translational modifications are collapsed, i.e. each node represents all the proteins produced by a single, protein-coding gene locus. (A) Edges represent protein-protein associations: associations are meant to be specific and meaningful, i.e. proteins jointly contribute to a shared function; this does not necessarily mean they are physically binding to each other. (B) Edges represent shared physical complex: the edges indicate that the directly linked proteins are part of the same physical complex; commonly in large complexes this may not signify they are directly binding to each other. Legend: black asterisks indicate differential expressed (DE) genes for both BRCA1mut and BRCA1met EOCs; orange asterisks indicate DE genes in only BRCA1mut EOCs; green asterisks indicate DE genes in only BRCAmet EOCs. Edges thickness indicates the level of confidence of the interaction: lighter line indicates high confidence rate (STRING score 0.700); darker line indicates highest confidence rate (STRING score 0.900).
Abbreviations
BRCAmet, BRCA1 and/or BRCA2 methylated cases; BRCAwt, BRCA or HR genes wild-type cases; BRCA1mut, BRCA1 class 4–5 mutated cases; BRCA1met, BRCA1 methylated cases; BRCA2met, BRCA2 methylated cases; DE, differentially expressed; ECM, extracellular matrix; FFPE, formalin-fixed and paraffin-embedded; EOC, epithelial ovarian cancer; HR, homologous recombination; HRD, homologous recombination deficiency; PARPi, PARP inhibitors.
References
1. Momenimovahed Z, Tiznobaik A, Taheri S, Salehiniya H. Ovarian cancer in the world: epidemiology and risk factors. Int J Womens Health (2019) 11:287–99. doi: 10.2147/IJWH.S197604
2. Ledermann JA, Harter P, Gourley C, Friedlander M, Vergote I, Rustin G, et al. Overall survival in patients with platinum-sensitive recurrent serous ovarian cancer receiving olaparib maintenance monotherapy: an updated analysis from a randomised, placebo-controlled, double-blind, phase 2 trial. Lancet Oncol (2016) 17(11):1579–89. doi: 10.1016/S1470-2045(16)30376-X
3. Network CGAR. Integrated genomic analyses of ovarian carcinoma. Nature (2011) 474(7353):609–15. doi: 10.1038/nature10166
4. Moore K, Colombo N, Scambia G, Kim BG, Oaknin A, Friedlander M, et al. Maintenance olaparib in patients with newly diagnosed advanced ovarian cancer. N Engl J Med (2018) 379(26):2495–505. doi: 10.1056/NEJMoa1810858
5. Ray-Coquard I, Pautier P, Pignata S, Pérol D, González-Martín A, Berger R, et al. Olaparib plus bevacizumab as first-line maintenance in ovarian cancer. N Engl J Med (2019) 381(25):2416–28. doi: 10.1056/NEJMoa1911361
6. Konstantinopoulos PA, Lheureux S, Moore KN. PARP inhibitors for ovarian cancer: current indications, future combinations, and novel assets in development to target DNA damage repair. Am Soc Clin Oncol Educ Book (2020) 40:1–16. doi: 10.1200/EDBK_288015
7. Pujade-Lauraine E, Brown J, Barnicle A, Wessen J, Lao-Sirieix P, Criscione SW, et al. Homologous recombination repair gene mutations to predict olaparib plus bevacizumab efficacy in the first-line ovarian cancer PAOLA-1/ENGOT-ov25 trial. JCO Precis Oncol (2023) 7:e2200258. doi: 10.1200/PO.22.00258
8. Sahnane N, Rivera D, Libera L, Carnevali I, Banelli B, Facchi S, et al. Pyrosequencing assay for BRCA1 methylation analysis: results from a cross-validation study. J Mol Diagn (2023) 25(4):217–26. doi: 10.1016/j.jmoldx.2023.01.003
9. Sahnane N, Carnevali I, Formenti G, Casarin J, Facchi S, Bombelli R, et al. BRCA methylation testing identifies a subset of ovarian carcinomas without germline variants that can benefit from PARP inhibitor. Int J Mol Sci (2020) 21(24). doi: 10.3390/ijms21249708
10. Blanc-Durand F, Tang R, Pommier M, Nashvi M, Cotteret S, Genestie C, et al. Clinical relevance of BRCA1 promoter methylation testing in ovarian cancer patients. Clin Cancer Res (2023). doi: 10.1158/1078-0432.CCR-22-3328
11. Franzese E, Centonze S, Diana A, Lombardi A, Carlino F, Guerrera LP, et al. Genomic profile and BRCA-1 promoter methylation status in BRCA mutated ovarian cancer: new insights in predictive biomarkers of olaparib response. Front Oncol (2019) 9:1289. doi: 10.3389/fonc.2019.01289
12. Salvati A, Carnevali I, Alexandrova E, Facchi S, Ronchi S, Libera L, et al. Targeted molecular profiling of epithelial ovarian cancer from Italian BRCA wild-type patients with a BRCA and PARP pathways gene panel. Exp Mol Pathol (2022) 128:104833. doi: 10.1016/j.yexmp.2022.104833
13. Vos S, Moelans CB, van Diest PJ. BRCA promoter methylation in sporadic versus BRCA germline mutation-related breast cancers. Breast Cancer Res (2017) 19(1):64. doi: 10.1186/s13058-017-0856-z
14. Cheung AN, Ellenson LH, Gilks CG, Kim K-r, Kong CS, Lax SF, et al. WHO calssification of Tumours - 5th edition. Female Genital Tumours. Lyon: International Agency for Research on Cancer (2020).
15. Bolzacchini E, Libera L, Church SE, Sahnane N, Bombelli R, Digiacomo N, et al. Tumor antigenicity and a pre-existing adaptive immune response in advanced BRAF mutant colorectal cancers. Cancers (Basel) (2022) 14(16). doi: 10.3390/cancers14163951
16. Szklarczyk D, Kirsch R, Koutrouli M, Nastou K, Mehryary F, Hachilif R, et al. The STRING database in 2023: protein-protein association networks and functional enrichment analyses for any sequenced genome of interest. Nucleic Acids Res (2023) 51(D1):D638–D46. doi: 10.1093/nar/gkac1000
17. Chen J, Bardes EE, Aronow BJ, Jegga AG. ToppGene Suite for gene list enrichment analysis and candidate gene prioritization. Nucleic Acids Res (2009) 37(Web Server issue):W305–11. doi: 10.1093/nar/gkp427
18. Tibiletti MG, Sessa F, Bernasconi B, Cerutti R, Broggi B, Furlan D, et al. A large 6q deletion is a common cytogenetic alteration in fibroadenomas, pre-malignant lesions, and carcinomas of the breast. Clin Cancer Res (2000) 6(4):1422–31.
19. Hartman AR, Ford JM. BRCA1 induces DNA damage recognition factors and enhances nucleotide excision repair. Nat Genet (2002) 32(1):180–4. doi: 10.1038/ng953
20. Gilson P, Drouot G, Witz A, Merlin JL, Becuwe P, Harlé A. Emerging roles of DDB2 in cancer. Int J Mol Sci (2019) 20(20). doi: 10.3390/ijms20205168
21. Farmer H, McCabe N, Lord CJ, Tutt AN, Johnson DA, Richardson TB, et al. Targeting the DNA repair defect in BRCA mutant cells as a therapeutic strategy. Nature (2005) 434(7035):917–21. doi: 10.1038/nature03445
22. Fong PC, Boss DS, Yap TA, Tutt A, Wu P, Mergui-Roelvink M, et al. Inhibition of poly(ADP-ribose) polymerase in tumors from BRCA mutation carriers. N Engl J Med (2009) 361(2):123–34. doi: 10.1056/NEJMoa0900212
23. Veeck J, Ropero S, Setien F, Gonzalez-Suarez E, Osorio A, Benitez J, et al. BRCA1 CpG island hypermethylation predicts sensitivity to poly(adenosine diphosphate)-ribose polymerase inhibitors. J Clin Oncol (2010) 28(29):e563–4. doi: 10.1200/JCO.2010.30.1010
24. Danaher P, Warren S, Lu R, Samayoa J, Sullivan A, Pekker I, et al. Pan-cancer adaptive immune resistance as defined by the Tumor Inflammation Signature (TIS): results from The Cancer Genome Atlas (TCGA). J Immunother Cancer (2018) 6(1):63. doi: 10.1186/s40425-018-0367-1
25. Drews RM, Hernando B, Tarabichi M, Haase K, Lesluyes T, Smith PS, et al. A pan-cancer compendium of chromosomal instability. Nature (2022) 606(7916):976–83. doi: 10.1038/s41586-022-04789-9
26. Lin CK, Lin WL, Chen FL, Lee MY, Kuo JF, Ruan A, et al. Assessing the impact of polysomy-17 on HER2 status and the correlations of HER2 status with prognostic variables (ER, PR, p53, Ki-67) in epithelial ovarian cancer: a tissue microarray study using immunohistochemistry and fluorescent in situ hybridization. Int J Gynecol Pathol (2011) 30(4):372–9. doi: 10.1097/PGP.0b013e31820c9ff3
27. Kondrashova O, Topp M, Nesic K, Lieschke E, Ho GY, Harrell MI, et al. Methylation of all BRCA1 copies predicts response to the PARP inhibitor rucaparib in ovarian carcinoma. Nat Commun (2018) 9(1):3970. doi: 10.1038/s41467-018-05564-z
28. Swisher EM, Kwan TT, Oza AM, Tinker AV, Ray-Coquard I, Oaknin A, et al. Molecular and clinical determinants of response and resistance to rucaparib for recurrent ovarian cancer treatment in ARIEL2 (Parts 1 and 2). Nat Commun (2021) 12(1):2487. doi: 10.1038/s41467-021-22582-6
29. Tabano S, Azzollini J, Pesenti C, Lovati S, Costanza J, Fontana L, et al. Analysis of. Cancers (Basel) (2020) 12(4). doi: 10.3390/cancers12040910
30. El-Brolosy MA, Stainier DYR. Genetic compensation: A phenomenon in search of mechanisms. PloS Genet (2017) 13(7):e1006780. doi: 10.1371/journal.pgen.1006780
31. Barabási AL, Oltvai ZN. Network biology: understanding the cell's functional organization. Nat Rev Genet (2004) 5(2):101–13. doi: 10.1038/nrg1272
32. Davidson E, Levin M. Gene regulatory networks. Proc Natl Acad Sci U S A (2005) 102(14):4935. doi: 10.1073/pnas.0502024102
33. Cardenas H, Jiang G, Thomes Pepin J, Parker JB, Condello S, Nephew KP, et al. Interferon-γ signaling is associated with. NPJ Precis Oncol (2019) 3:32. doi: 10.1038/s41698-019-0103-4
34. Bruand M, Barras D, Mina M, Ghisoni E, Morotti M, Lanitis E, et al. Cell-autonomous inflammation of BRCA1-deficient ovarian cancers drives both tumor-intrinsic immunoreactivity and immune resistance via STING. Cell Rep (2021) 36(3):109412. doi: 10.1016/j.celrep.2021.109412
35. Liu T, Li Y, Wang X, Yang X, Fu Y, Zheng Y, et al. The role of interferons in ovarian cancer progression: Hinderer or promoter? Front Immunol (2022) 13:1087620. doi: 10.3389/fimmu.2022.1087620
36. Strathdee G, Appleton K, Illand M, Millan DW, Sargent J, Paul J, et al. Primary ovarian carcinomas display multiple methylator phenotypes involving known tumor suppressor genes. Am J Pathol (2001) 158(3):1121–7. doi: 10.1016/S0002-9440(10)64059-X
37. Hua T, Kang S, Li XF, Tian YJ, Li Y. DNA methylome profiling identifies novel methylated genes in epithelial ovarian cancer patients with platinum resistance. J Obstet Gynaecol Res (2021) 47(3):1031–9. doi: 10.1111/jog.14634
38. Xu C, Cao W. Integration of transcriptome and epigenome to identify and develop prognostic markers for ovarian cancer. J Oncol (2022) 2022:3744466. doi: 10.1155/2022/3744466
39. Gong G, Lin T, Yuan Y. Integrated analysis of gene expression and DNA methylation profiles in ovarian cancer. J Ovarian Res (2020) 13(1):30. doi: 10.1186/s13048-020-00632-9
40. Nazemalhosseini Mojarad E, Kuppen PJ, Aghdaei HA, Zali MR. The CpG island methylator phenotype (CIMP) in colorectal cancer. Gastroenterol Hepatol Bed Bench (2013) 6(3):120–8.
Keywords: BRCA1 methylation, NanoString®, gene expression profiles, PARPi therapy, EOC
Citation: Sahnane N, Libera L, Facchi S, Carnevali I, Ronchi S, Albeni C, Cromi A, Casarin J, Sessa F and Tibiletti MG (2023) Similarities and differences in gene expression profiles of BRCA1 methylated and mutated epithelial ovarian cancers. Front. Oncol. 13:1268127. doi: 10.3389/fonc.2023.1268127
Received: 27 July 2023; Accepted: 12 September 2023;
Published: 03 October 2023.
Edited by:
Umberto Malapelle, University of Naples Federico II, ItalyCopyright © 2023 Sahnane, Libera, Facchi, Carnevali, Ronchi, Albeni, Cromi, Casarin, Sessa and Tibiletti. This is an open-access article distributed under the terms of the Creative Commons Attribution License (CC BY). The use, distribution or reproduction in other forums is permitted, provided the original author(s) and the copyright owner(s) are credited and that the original publication in this journal is cited, in accordance with accepted academic practice. No use, distribution or reproduction is permitted which does not comply with these terms.
*Correspondence: Nora Sahnane, bm9yYS5zYWhuYW5lQGFzc3Qtc2V0dGVsYWdoaS5pdA==
†These authors have contributed equally to this work and share first authorship