 William Lautert-Dutra1
 Camila M. Melo1Luiz P. Chaves1Francisco C. Souza2Cheryl Crozier3Adam E. Sundby3Elizabeth Woroszchuk3Fabiano P. Saggioro4
 Filipe S. Avante2
 Rodolfo B. dos Reis2
 Jeremy A. Squire1,5
 Jane Bayani3,6*
- 1Department of Genetics, Medical School of Ribeirao Preto, University of Sao Paulo, Ribeirao Preto, Brazil
- 2Division of Urology, Department of Surgery and Anatomy, Medical School of Ribeirao Preto, University of Sao Paulo, Ribeirao Preto, Brazil
- 3Diagnostic Development, Ontario Institute for Cancer Research, Toronto, ON, Canada
- 4Department of Pathology, Ribeirao Preto Medical School, University of Sao Paulo, Ribeirao Preto, Brazil
- 5Department of Pathology and Molecular Medicine, Queen’s University, Kingston, ON, Canada
- 6Laboratory Medicine and Pathology, University of Toronto, Toronto, ON, Canada
The diverse clinical outcomes of prostate cancer have led to the development of gene signature assays predicting disease progression. Improved prostate cancer progression biomarkers are needed as current RNA biomarker tests have varying success for intermediate prostate cancer. Interest grows in universal gene signatures for invasive carcinoma progression. Early breast and prostate cancers share characteristics, including hormone dependence and BRCA1/2 mutations. Given the similarities in the pathobiology of breast and prostate cancer, we utilized the NanoString BC360 panel, comprising the validated PAM50 classifier and pathway-specific signatures associated with general tumor progression as well as breast cancer-specific classifiers. This retrospective cohort of primary prostate cancers (n=53) was stratified according to biochemical recurrence (BCR) status and the CAPRA-S to identify genes related to high-risk disease. Two public cohort (TCGA-PRAD and GSE54460) were used to validate the results. Expression profiling of our cohort uncovered associations between PIP and INHBA with BCR and high CAPRA-S score, as well as associations between VCAN, SFRP2, and THBS4 and BCR. Despite low levels of the ESR1 gene compared to AR, we found strong expression of the ER signaling signature, suggesting that BCR may be driven by ER-mediated pathways. Kaplan-Meier and univariate Cox proportional hazards regression analysis indicated the expression of ESR1, PGR, VCAN, and SFRP2 could predict the occurrence of relapse events. This is in keeping with the pathways represented by these genes which contribute to angiogenesis and the epithelial-mesenchymal transition. It is likely that VCAN works by activating the stroma and remodeling the tumor microenvironment. Additionally, SFRP2 overexpression has been associated with increased tumor size and reduced survival rates in breast cancer and among prostate cancer patients who experienced BCR. ESR1 influences disease progression by activating stroma, stimulating stem/progenitor prostate cancer, and inducing TGF-β. Estrogen signaling may therefore serve as a surrogate to AR signaling during progression and in hormone-refractory disease, particularly in prostate cancer patients with stromal-rich tumors. Collectively, the use of agnostic biomarkers developed for breast cancer stratification has facilitated a precise clinical classification of patients undergoing radical prostatectomy and highlighted the therapeutic potential of targeting estrogen signaling in prostate cancer.
Introduction
Prostate cancer (PCa) is the second most common and the fourth most frequent cause of male deaths (1). Most cases are diagnosed with a localized, slowly progressive, and indolent disease. Unfortunately, 20-30% of patients with the localized disease will eventually progress and develop metastasis, with a reduced 5-year survival rate (2).
The histologic and molecular characteristics of PCa are used to manage patient care and guide therapeutic decision-making in this clinically heterogeneous disease (2–5). Gleason-score and tumor grade are used to classify patient tissue biopsies from different areas of the prostate to predict tumor behavior. At the molecular level, androgen receptor-positive PCa and advanced diseases with mutations in DNA damage response genes (e.g., BRCA1/2) are eligible for systemic anti-androgen therapy to block the activation of androgen receptors and for treatment with poly (ADP-ribose) polymerase inhibitors (PARPi), respectively (6). However, there are currently insufficient biomarkers to reliably distinguish between an indolent and aggressive disease course at the time of radical prostatectomy (7) or biopsy. As a result, many PCa patients undergo surgery or other treatments resulting in side effects that can considerably impact their quality of life (8).
The development of precision medicine in PCa has involved evaluating various combinations of expression-based prognostic biomarkers (9). Prognostic signatures are often derived by comparing gene expression differences between aggressive and indolent diseases (10–12). Some of the commercial PCa biomarker signatures have focused on specific biological features of progression. For example, the Prolaris test analyzes expression differences of genes known to be involved in cell cycle control (13). The Decipher test has been similarly validated and is comprised of genes related to proliferation, immune function, and cell adhesion (14). Other PCa gene panels have addressed androgen signaling (15) and stem cell functions (16).
Tumor-agnostic biomarkers are molecular signatures or biomarkers used to select therapies regardless of the tumor site of origin. The development of inter-tumor tissue-agnostic biomarkers has revolutionized cancer care (17, 18). For example, the discovery of similar molecular features, such as tumor-mutation burden (TMB), and mismatch repair (MMR) defective tumors, led to the approval of immune checkpoint blockers for carcinomas regardless of their anatomic location (19–22). Breast (BCa) and PCa are the two most common invasive carcinomas in women and men (23). For both organs, steroid hormones, such as estrogen, progesterone, and androgen, are essential for normal development (24, 25). These endocrine-driven tumors have similar lifetime sporadic risks and are subject to germline and somatic mutations (e.g., BRCA1/2) (2, 25). Both share common biological features of hormone-dependent development, and hormonal therapies are the main approach to disease control (23, 26), with resistance to primary hormonal treatment as the leading mechanism for disease progression.
Pivotal to the continued understanding of breast pathogenesis and the recognition of the impact of molecular heterogeneity, the seminal work by Perou et al. (27) resulted in the PAM50 classifier. The molecular subtypes luminal A, luminal B, HER2 enriched, and basal-like subtypes have been shown to be prognostic with general concordance to the immunohistochemistry (IHC)-based diagnostic stratification of BCas by ER, PR, and HER2 (28). The classifier, with its resulting risk of recurrence score (ROR), has been commercially available as the Prosigna Breast Cancer Assay (Veracyte Inc.), for prognosis in hormone receptor-positive, HER2-negative early BCa using the NanoString nCounter System (NanoString Technologies) (28). Using PAM50, comparative studies in PCa have shown that they could be similarly classified as luminal or non-luminal (i.e., basal) (29), further demonstrating the similarities in pathobiology. Since RNA gene signature biomarker panels are well-developed in BCa (30), we investigated whether genes or pathway-derived signatures might be common to progression in both tumor types. Improved clinical stratification of PCa patients at the time of first surgery can help to avoid unnecessary follow-up treatments for patients with a more favorable predicted disease course and benefit high-risk patients for rapid precision medicine treatment when eligible. In this way, we explored the use of a curated gene panel related to key molecular pathways included in NanoString’s Breast Cancer 360 (BC360) assay of 776 genes to identify inter-tumor agnostic markers common to breast and prostate cancer; that may be promising for identifying actionable biological targets and pathways that can be putatively repurposed in PCa. These findings will help identify cancers that are more likely to progress to other tissues and provide more novel biomarkers for more precise patient classification at the time of surgery.
Material and methods
Tumor cohort
All 53 samples included in the Faculty of Medicine of Ribeirao Preto (FMRP) cohort were primary PCa collected by radical prostatectomy following National Comprehensive Cancer Network (NCCN) clinical practice guidelines (31) in the Department of Surgery and Anatomy, Urology Division at Ribeirao Preto Medical School, Brazil, between 2007 and 2015 (Table S1). According to the American College of Pathology guidelines, the smaller prostates were submitted in their entirety. For partial sampling in the setting of larger glands, we followed the protocol of consistently submitting the whole grossly visible tumor (when identified), the tumor and associated periprostatic tissue and margins, along with the entire apical and bladder neck margins and the junction of each seminal vesicle with prostate proper. If there was no grossly visible tumor, a systematic sampling strategy was used that included submitting the posterior aspect of each transverse slice along with a mid-anterior block from each side, and the entire apical and bladder neck margins and the junction of each seminal vesicle with the prostate. The patients were classified according to the presence of biochemical recurrence (BCR), defined as PSA>0.2 ng/ml within six months after radical prostatectomy. We also estimated the risk of prognostic PCa recurrence after fist-line surgery using the Cancer of The Prostate Risk Assessment Score (CAPRA-S) (32). This score estimator is based on clinical and pathological information available before and after radical prostatectomy, and predicts the relative risk of biochemical progression. Patients were evaluated based on variables including pre-treatment PSA level, pathological Gleason Score, surgical margin, extracapsular extension, seminal vesicle invasion, and lymph node invasion, contributing to their CAPRA-S score, ranging from 1 to 12 (32). Patients with low CAPRA-S scores were those with values between 0-2, those with intermediate scores had CAPRA-S scores ranging from 3-5, and those with high scores had CAPRA-S scores between 6-12. Patient outcome data were collected to the last follow-up date. This retrospective study was approved by the Ethics Committee in Research of Hospital of Ribeirão Preto, São Paulo, Brazil (HCRP) number CAAE 60032122.8.0000.5440 and the Ethics Board of the University of Toronto (Protocol: 00043323).
RNA isolation
RNA was isolated from tissues with tumor-rich areas previously marked by a pathologist (FPS) which represent the highest Gleason pattern. Sections were processed at the Ontario Institute for Cancer Research, Toronto, Canada (OICR) using a dual DNA and RNA extraction as previously described (33, 34). Briefly, hematoxylin and eosin slides were prepared for all the formalin-fixed paraffin-embedded (FFPE) tissues. Histologic analysis of all the slides was performed in the pathology department, and all tumor areas were carefully marked by an experienced pathologist (FPS). Within each marked tumor-rich area, the percentage of tumor cells (range 70-95% tumor-rich) was estimated and recorded (Table S2). Adjacent slides for each tumor were prepared, and the same areas of interest were macrodissected for RNA extraction.
Transcription analysis
The Human nCounter Breast Cancer 360 (NanoString Technologies Inc., Seattle, WA, USA) is a 776 gene panel designed to characterize breast cancer-specific gene expression patterns associated with breast cancer tumor progression. The panel contains several proprietary signatures generated by NanoString, describing key aspects of breast cancer biology and immune oncology to aid tumor classification. Among these signatures is the PAM50 Signature (28), which classifies tumors into one of four molecular subtypes (Luminal A, Luminal B, HER2-Enriched, and Basal-like) associated with tumor biology and patient prognosis as well as a Genomic Risk Score. The panel also includes the Tumor Inflammation Signature (35), which measures the tumor’s pre-existing, peripherally suppressed adaptive immune responses. A description of the NanoString proprietary signatures and the genes comprising these signatures is found in Supplementary Table S3. The generation of scores for these proprietary signatures was performed by NanoString.
For prognostic biomarker discovery, raw expression data from the BC360 was loaded onto the nSolver software v4.0 (NanoString Technologies) to perform the quality control (QC analysis) and to build the transcript matrix for downstream analysis (Figures S1A, B). For differential expression, we used DESeq2 v1.34.0 with BCR and risk classification as the design factors (36). We performed over-representation enrichment analysis (ORA) in the differential expressed genes using the clusterProfiler v4.0 (37). Because PCa is a hormonally driven cancer, we dichotomized expression levels of AR, PGR, and ESR1 based on mean gene expression for each gene; we then used this categorical data to generate the final classification regarding the patient’s gene expression for AR, PGR, and ESR1.
Statistical analysis
The data processing and downstream analysis were completed in RStudio software (R Foundation for Statistical Computing, R v4.1.2 “Bird Hippie”). All results were plotted using ggplot2, pheatmap, or Broad Institute’s Morpheus software (38). For the validation cohort, we used RNA-seq data from the prostate adenocarcinoma cohort from The Cancer Genome Atlas (PRAD-TCGA, n = 420) (39) and from GSE54460 (n = 106) (40). Only patients with matched BCR data were used in the study. To replicate the potential features of the BC360 panel, we further subset the expression matrix of the validation cohorts to contain just the intersection of genes in the BC360 panel, yielding a matrix totaling 758 common genes (41). Genes were considered differentially expressed when log2 foldchange > 0.5 for the BC360 panel, and a more rigorous threshold of > 0.58 was used for the TCGA-PRAD and GSE54460. Adjusted p-value controlling for multiple testing was performed and false-discovery rate (FDR) < 0.05 was reported. For the enrichment analysis, we used a cut-off value of 0.05 to consider the ORA of Hallmarks’ terms. Further, the dichotomized expression based on mean gene expression levels of AR, PGR, ESR1, and the DEGs associated with BCR and CAPRA-S for each gene was used to estimate the time-to-detection of BCR. The log-rank test was used to estimate the time-to-detection of BCR in Kaplan Meier curves (BCR free-survival, BCRFS), and the Cox proportional hazard (PH) regression model was computed using the survival R package v3.4.0 (Figure S2).
Results
Molecular subtyping and propriety signature findings using the BC360 assay
BC360 analysis was performed using NanoString’s proprietary workflow (NanoString Technologies) (Figure S2) to generate pathway-specific or prognostic signatures (Figure 1; Table S3). Using the signature results and individual prognostic genes which were normalized and scaled, the cohort generally showed similar features including relatively low expression of a homologous recombination deficiency (HRD) signature and markers typically associated with immune “cold” tumors, including PD-L-1, PD1, and PD-L2 (Figure 1A). Conversely, higher expression was seen consistently across the cohort for the ER Signaling Signature, despite a relatively overall lower expression of ESR1 and PGR as individual genes. In contrast, comparatively higher and variable expression of AR was seen, as expected. Variable expression of the Tumor Inflammation Signature (TIS) was observed suggesting differences between the cases in the abundance of peripherally suppressed adaptive immune response genes. When clustered according to CAPRA-S and BCR status, the signature expressions organized patients into two main groups that were differentiated by the variable expression of genes or gene signatures associated with immune response genes including: the IDO1 and genes associated with inflammatory cytokines and the microenvironment; IFNγ signaling; and the TIS signature. Differential expression of ERBB2, CDK4, PTEN, and genes comprising the signatures of MHC2 and cellular differentiation and the epithelial to mesenchymal transition (EMT) were also noted. Of the two main groupings, one was comprised of CAPRA-S high and intermediate cases, which included many patients who experience BCR. This contrasted with the large group of patients of CAPRA-S low and intermediate cases, for which many did not experience BCR.
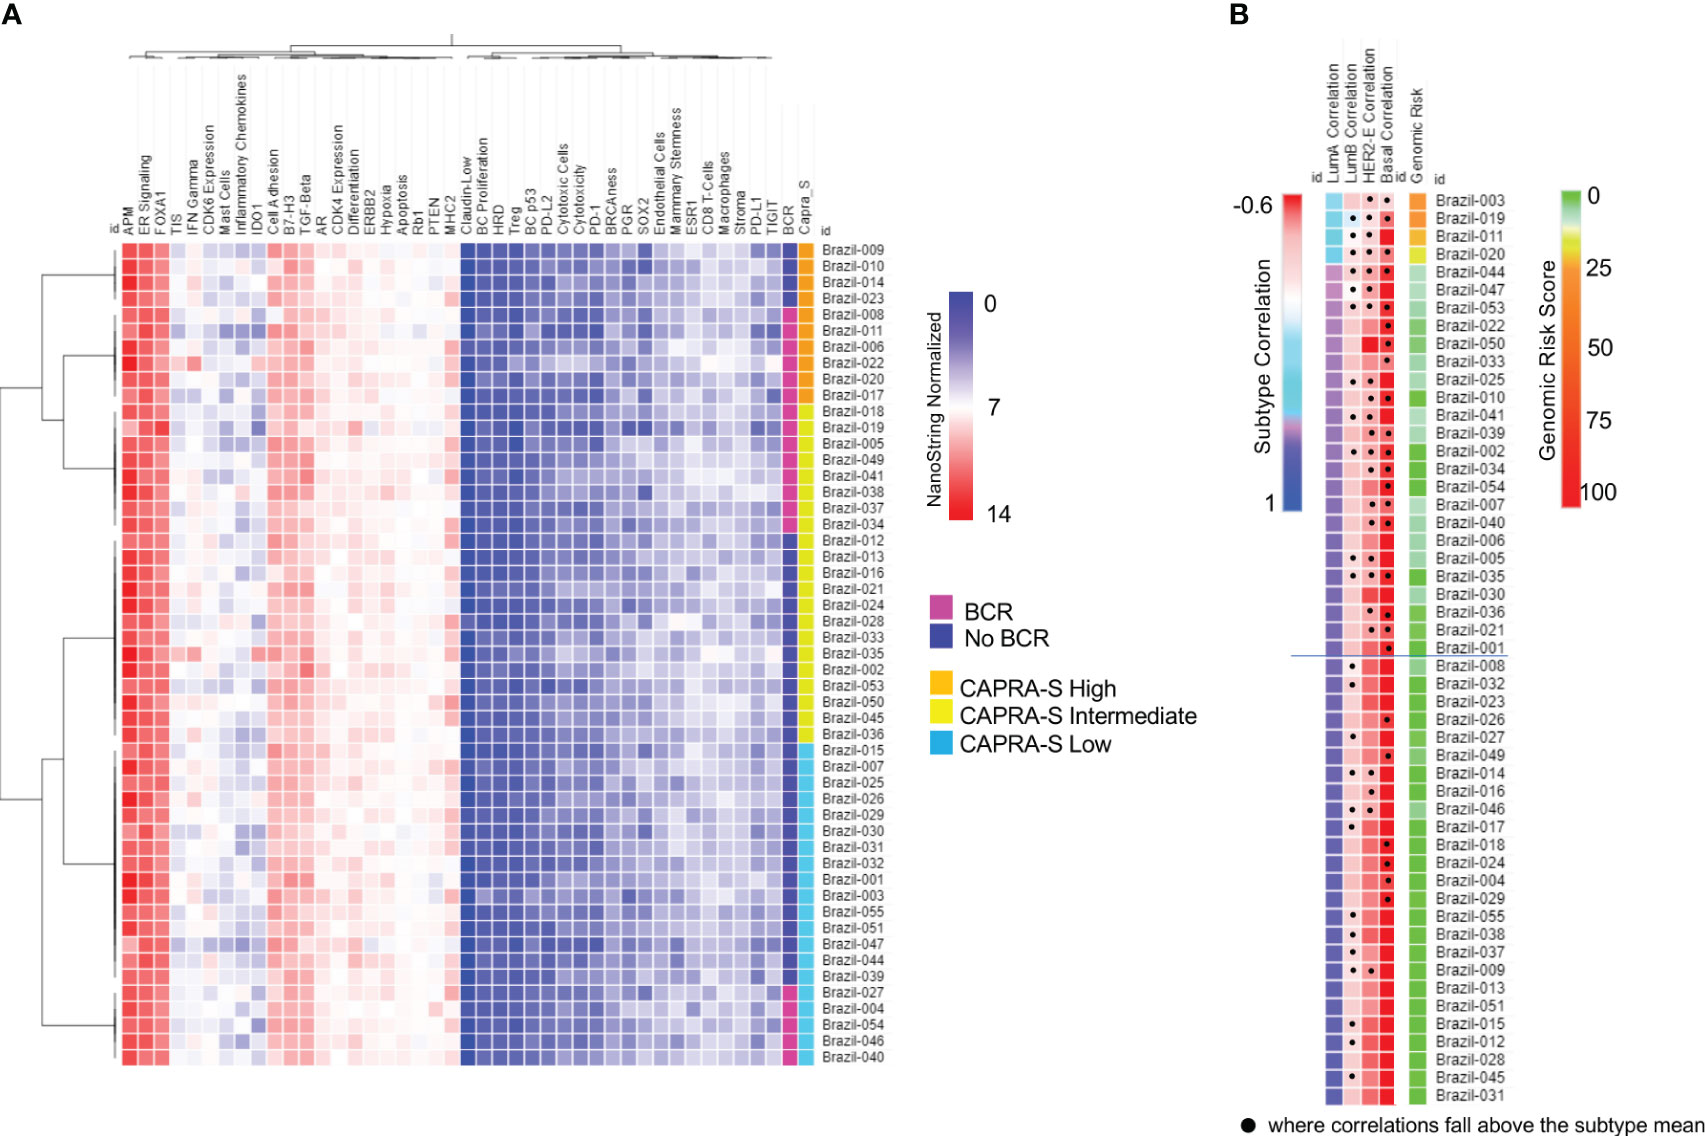
Figure 1 NanoString BC360 Signatures. (A) Unsupervised heatmap of BC360 signatures pathway-specific or prognostic signatures stratified by CAPRA-S score and BCR status. In this panel, there is a strong expression of the ER Signaling Signature, with comparably intermediated and low expression of AR and PGR, respectively. (B) PAM50 classifier with all 53 cases was identified as Luminal (A) Heatmaps were generated using Broad Institute’s Morpheus software https://software.broadinstitute.org/morpheus/andpheatmap.
All 53 cases from the FMRP cohort were identified as Luminal A using the validated PAM50 classifier (Figure 1B), although we observed shifts towards correlations to the Luminal B, HER2E, and Basal-like subtypes when the raw correlation coefficients, were analyzed (Figures 1B, 2). Furthermore, the Nanostring assay was able to correctly classify a control (basal subtype) among all cases (Table S4). Utilizing the mean Luminal A correlation coefficient as a cut-off (0.67), we demonstrated that some cases possessed gene expression features associated with the other subtypes. Indeed, in those patients: Brazil-003, -011, -019, and -020, there was an observed positive shift from the mean correlation towards more Luminal B (mean correlation=-0.20), HER2E (mean correlation=-0.36), and Basal-like (mean correlation=-0.49) subtypes, with the concomitant negative shift away from the Luminal A correlation mean, though not sufficiently significant to be classified as such. The Genomic Risk Score, used to evaluate the relative risk of recurrence in BCa, was shown to increase amongst these PCas, reflecting a more aggressive cancer phenotype as it becomes less Luminal A-like (Figure 1B). In the cases of Brazil-003, 011, -019, and -020, the Genomic Risk Scores were 25, 28, 22, and 18 respectively, significantly higher than the average Genomic Risk Score of 4.2 across the FMRP cohort. Unsupervised clustering of the 50 genes of the PAM50 signature (Figure 2) clearly demonstrated these four cases as possessing similar features with comparatively higher expression of proliferation and cell cycle genes (e.g., MYC, EGFR, FOXA1, ORC6, and MELK) and receptor tyrosine kinases (EGFR); and observed comparatively lower expression of FOXC1, CDH3, and KRT17, among others. Correlations to clinical BCR and CAPRA-S show altered genes related to the EMT.
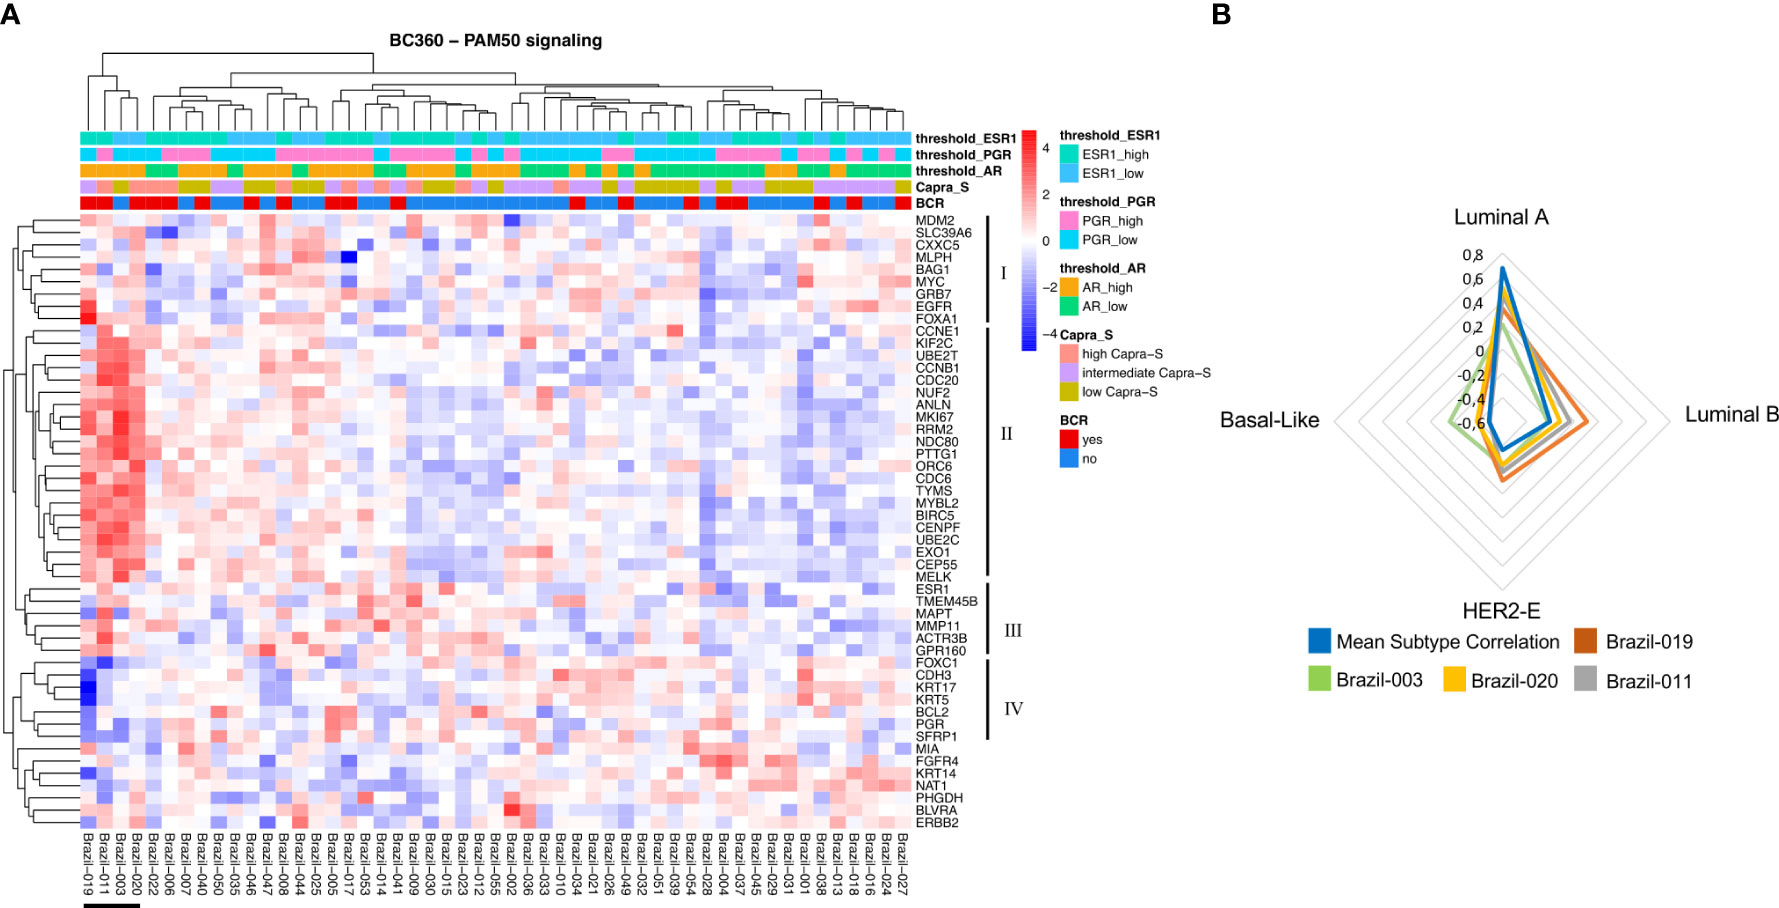
Figure 2 NanoString PAM50 and breast cancer subtypes. (A) Unsupervised heatmap of 50 genes encompassing the PAM50 signature in the Nanostring BC360 panel. A clear clustering for patients associated with the other subtypes (Brazil-019, -011, -003, and -020) can be observed on the left side of the panel. This group of patients also shows two major clusters with opposite expression profiles (II and III). For each patient, the level of expression [divided by quartiles (see Methods)] is displayed for the androgen receptor (AR), PGR, and estrogen receptor 1 (ESR1). (B) Gene expression features for patients associated with the other subtypes. For this group of patients, the mean subtype correlation was higher and shifted towards the Luminal B, HER2-E, and Basal-like subtypes when compared with other samples. Mean correlation Luminal A: 0.677; Luminal B: -0.201; HER2-E: -0.364; Basal-like: -0.49. The signature scores were used to perform hierarchical clustering for both patients and gene signatures in the context of CAPRA-S and BCR. Heatmaps were generated using Broad Institute’s Morpheus software https://software.broadinstitute.org/morpheus/andpheatmap.
To leverage the full potential of this 776-gene panel, we examined the differentially expressed genes (DEGs) (log2 foldchange > 0.5, padj (FDR) < 0.05), comparing tumors from patients with BCR to those who remained disease-free in addition to CAPRA-S. Through this comparison, we identified significant up-regulation of VCAN, BBC3, CDKN2B, LPL, SFRP2, THBS4, INHBA, PIP, LEFTY2, and ORC6 genes in BCR patients (Table 1). Unsupervised analysis of these 10 upregulated genes showed apparent clustering of the patient group enriched for those who experienced a BCR (Figure 3). We then analyzed the transcriptome of patients based on the CAPRA-S intermediate and high relative risk of biochemical progression (Table 2). In the unsupervised analysis, the “High” risk patients predominantly clustered together (Figure 4A) when compared to the “Low” risk group. Amongst “Intermediate” risk samples, there was and observed upregulation of one gene, GHR. Using the results obtained from the BCR and CAPRA-S comparison, a list of DEGs related exclusively to each clinical phenotype and a set of DEGs common to all conditions was generated (Figure 4B). We found 8 DEGs exclusively associated with BCR (VCAN, BBC3, CDKN2B, LPL, SFRP2, LEFTY2, ORC6, and THBS4); 20 DEGs were exclusively found through CAPRA-S. Additionally, when comparing both BCR and CAPRA-S, we identified two DEGs - PIP, INHBA) (as shown in Figure 4B).
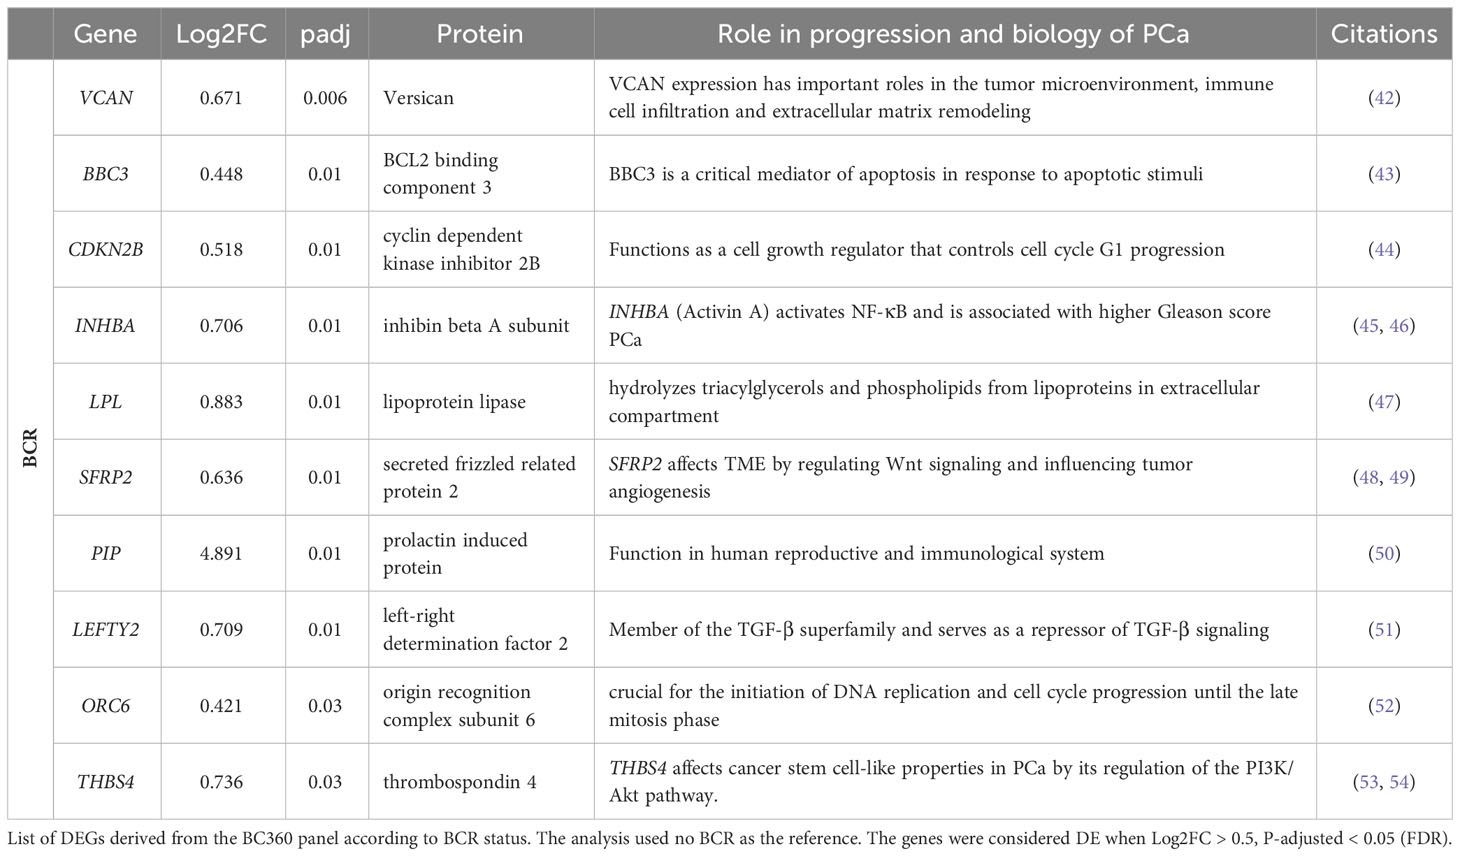
Table 1 Transcriptome change associated with BCR in the FMRP cohort.
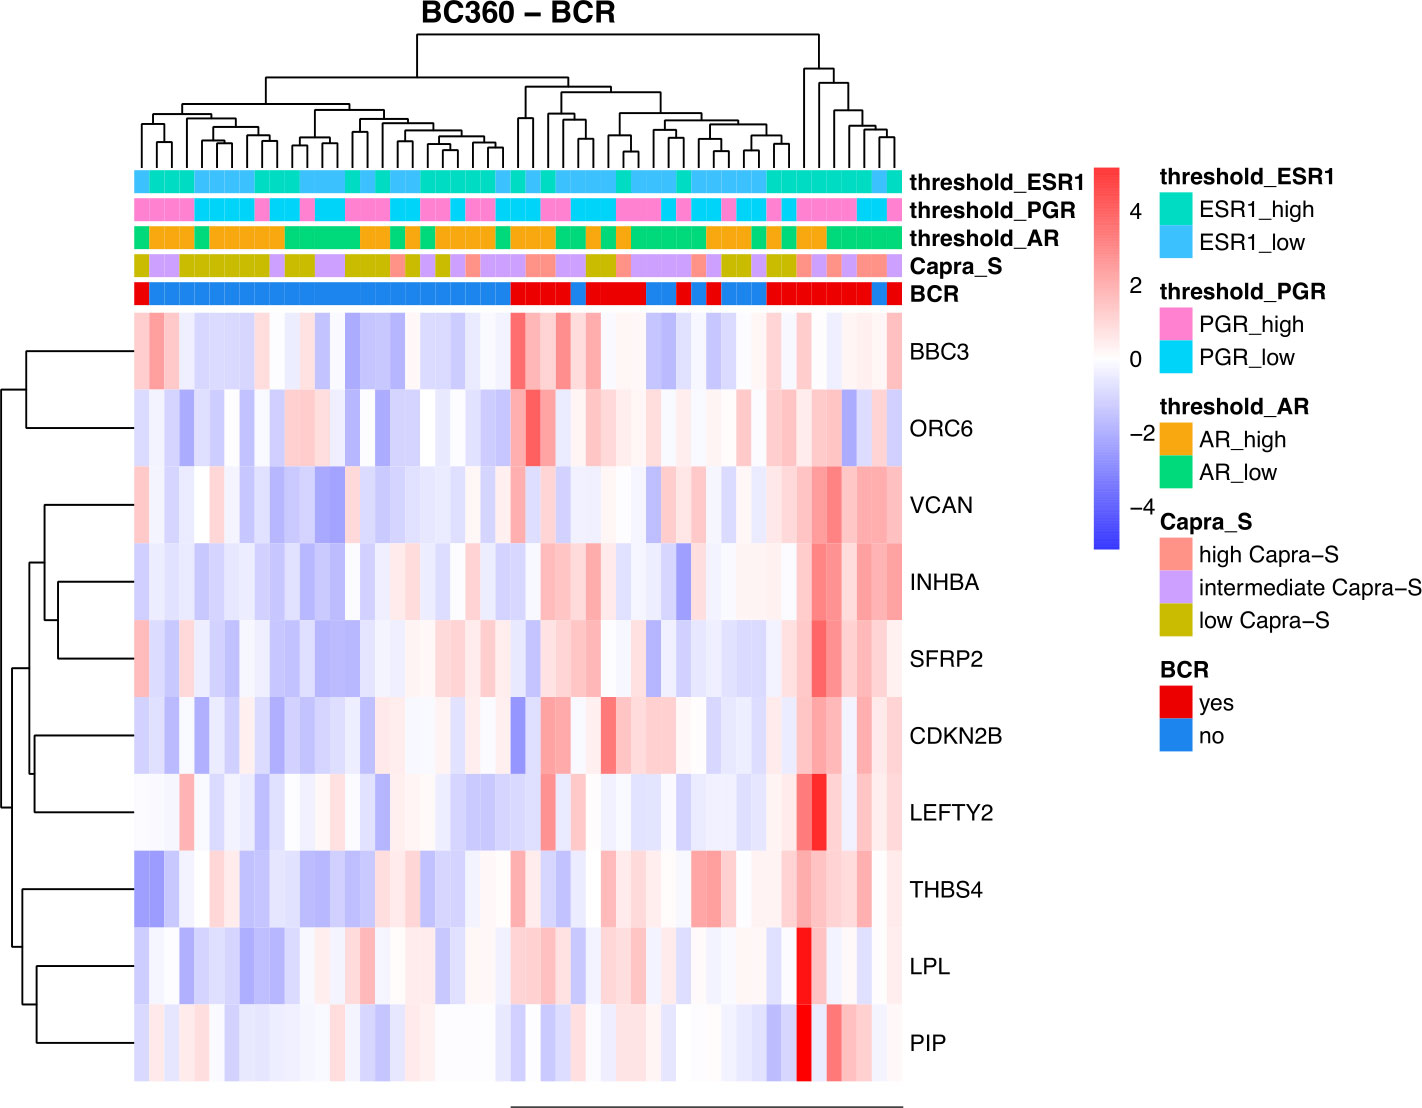
Figure 3 Summary of the retrospective FMRP cohort using the NanoString BC360 Unsupervised heatmap of the DEGs based on biochemical recurrence (BCR). There is an observed clustering of BCR patients and association with higher expression of ER1 and PGR (horizontal bar). For each patient, the level of expression (divided by quartiles (see Methods)) is displayed for the androgen receptor (AR), progesterone receptor (PGR), and estrogen receptor 1 (ESR1). Patients that remained disease-free after radical prostatectomy were used as the reference. (Log2FC > 0.5, P-adjusted < 0.05 (FDR)).
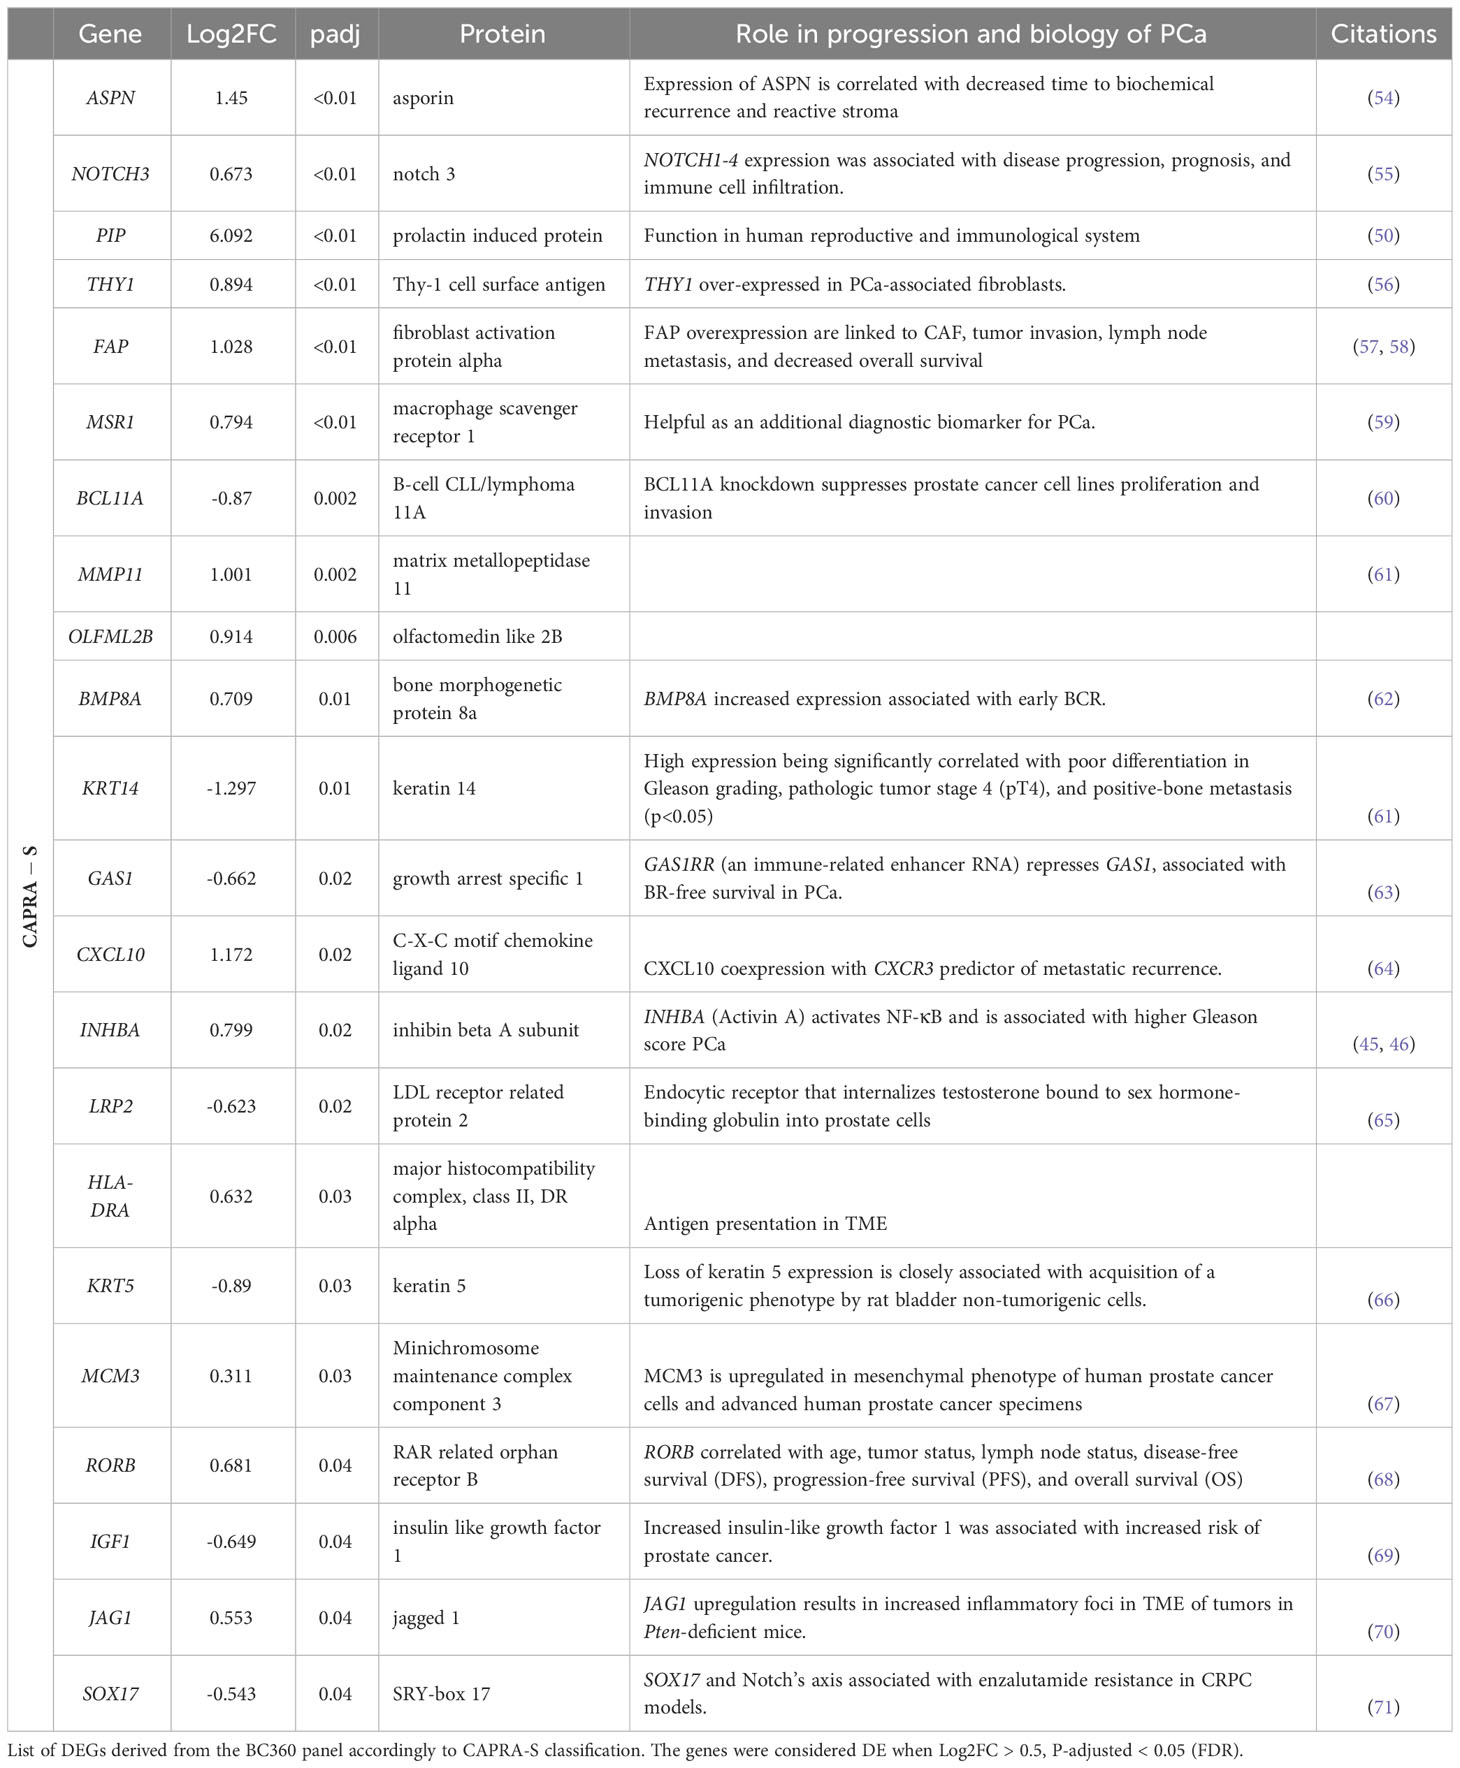
Table 2 Transcriptome change associated with CAPRA-S in the FMRP cohort.
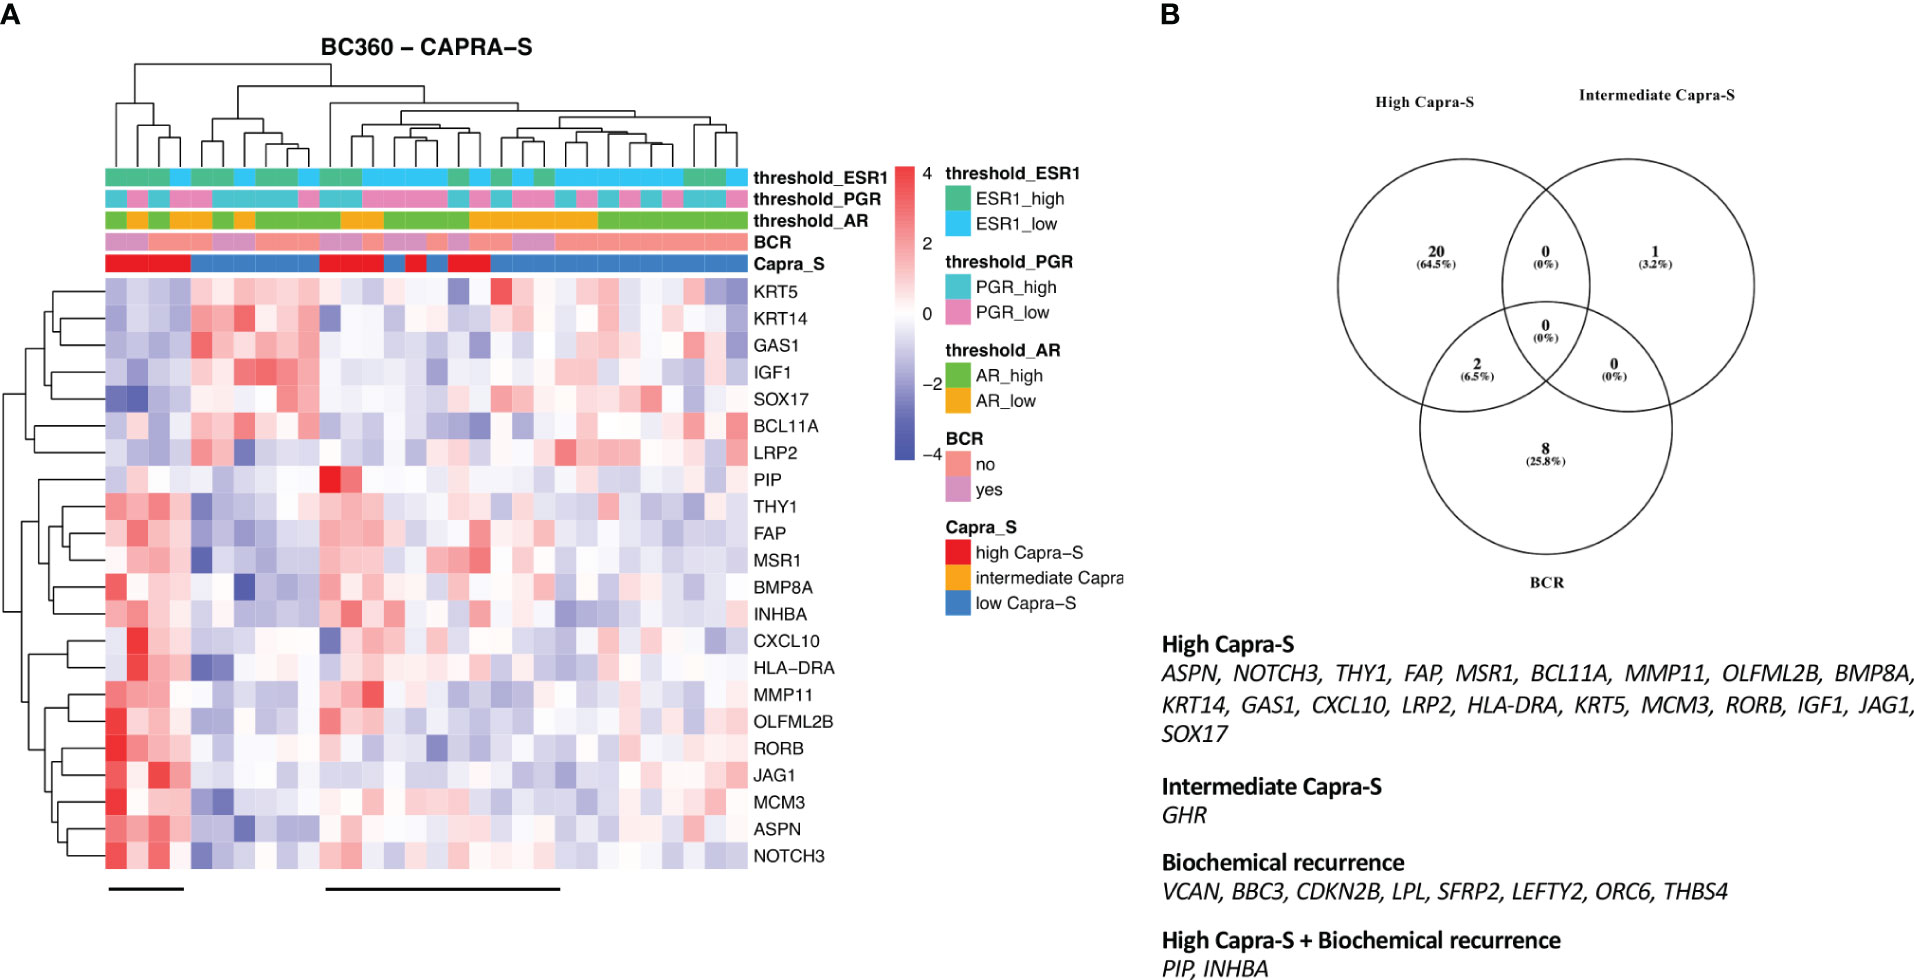
Figure 4 Summary results of FMRP cohort based on the CAPRA-S using the NanoString BC360 panel - Unsupervised heatmap of the DEGs comparing (A) “High” risk patients classified by CAPRA-S. “High” risk patients showed clustering (horizontal bar). (B) Venn diagram shows the intersection of the DEGs from the NanoString BC360 panel analysis according to BCR and CAPRA-S status. For each patient, the level of expression (divided by quartiles (see Methods)) is displayed for the androgen receptor (AR), progesterone receptor (PGR), and estrogen receptor 1 (ESR1). Log2FC > 0.5, P-adjusted < 0.05 (FDR).
When analysing patients according to BCR status in the validation cohort (TCGA-PRAD), we confirmed 4 DEGs also identified in our discovery cohort (ORC6, PIP, LEFTY2, and INHBA) (Figure S5). Furthermore, using the CAPRA-S “Intermediate” and “High” classifications, we confirmed differential expression of 5 and 14 DEGs also identified in the BC360 cohort (Figure S3). Notably, we also detected the differential expression of INHBA common in both BCR and CAPRA-S classification systems (Figure S3). The GSE54460 cohort showed no DEGs in common with our FMRP discovery cohort when we compared BCR or CAPRA-S groups.
The relative expression of the AR, ESR1, ESR2, and PGR in the BCR-positive group to patients without BCR was compared to investigate any possible relationships between the steroid receptors driving the transcriptomic alterations. In our retrospective FMRP cohort, none of the studied receptors showed significant alteration in expression (Figure S4A). In contrast, the TCGA-PRAD-BC360 showed a high expression of AR (p < 0.05) and a lower expression of PGR (p < 0.05) among the BCR patients (Figure S4B).
BCR and CAPRA-S risk score show different expressions of genes in pathways involved in tumor progression and tumor microenvironment activation
To further understand the transcriptional alterations driving BCR in our cohort, we use enrichment analysis to investigate the functional activity of DEGs. The DEGs in the BCR group were associated with the TGF-β signaling pathway, with the involvement of CDKN2B, INHBA, and LEFTY2 (Table 3). Interestingly, the relative expression of the normalized gene count of TGFβ1 shows an increased expression pattern for the BCR patients (Figure S5). The DEGs derived from the transcriptome comparison using the CAPRA-S classification also showed significant involvement in several hallmark cancer pathways. These genes were involved in EMT, Notch signaling, TNF-alpha signaling, Allograft Rejection, KRAS signaling, and Inflammatory response. Further enrichment of the DEGs from our validation cohorts also confirmed the involvement of some pathways uncovered in our retrospective FMRP cohort (Tables S5–S7).
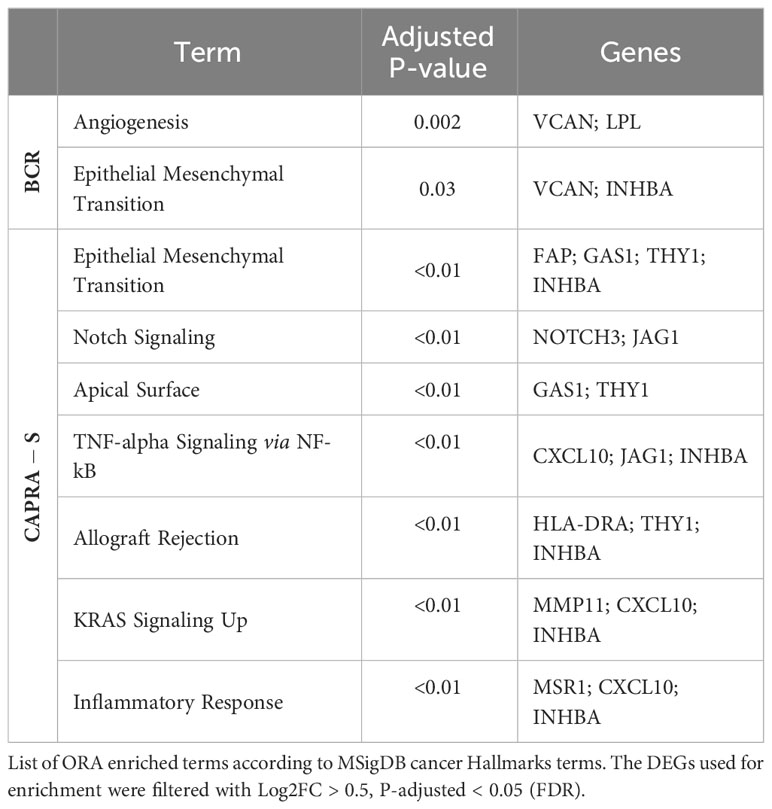
Table 3 Enrichment analysis for DEGs associated with BRC and CAPRA-S.
ESR1, PGR, VCAN, and SFRP2 high expression are associated with early relapse
To investigate the link between gene expression and BCR, progression-free survival analysis (BCRFS) stratified by the gene expression level in DEGs based on BCR and CAPRA-S status was performed. We used the mean dichotomized normalized expression values for each gene to classify the expression into “Low” (below mean expression value) and “High” (above mean expression value) groups. Kaplan Meier analysis revealed a significant association between ESR1 (Log-Rank test P=0.067) and PGR (Log-Rank test P=0.08), with reduced BCRFS (Figures 5A, B). Similarly, high expression of VCAN (Log-Rank test P=0.04) and SFRP2 (Log-Rank test P=0.0006) showed a significantly shorter BCRFS (Figures 5C, D). Similar patterns in KM curves were identified for INHBA, BBC3, CDKN2B, ORC6, THBS4, and LEFTY2, while opposite effects were for AR, LPL, and PIP (Figures S6A–I). Similarly, progression-free survival in the validation cohorts showed comparable KM curves for INHBA, BBC3, CDKN2B, ORC6, THBS4, and LEFTY2 genes (Figures S7, S8).
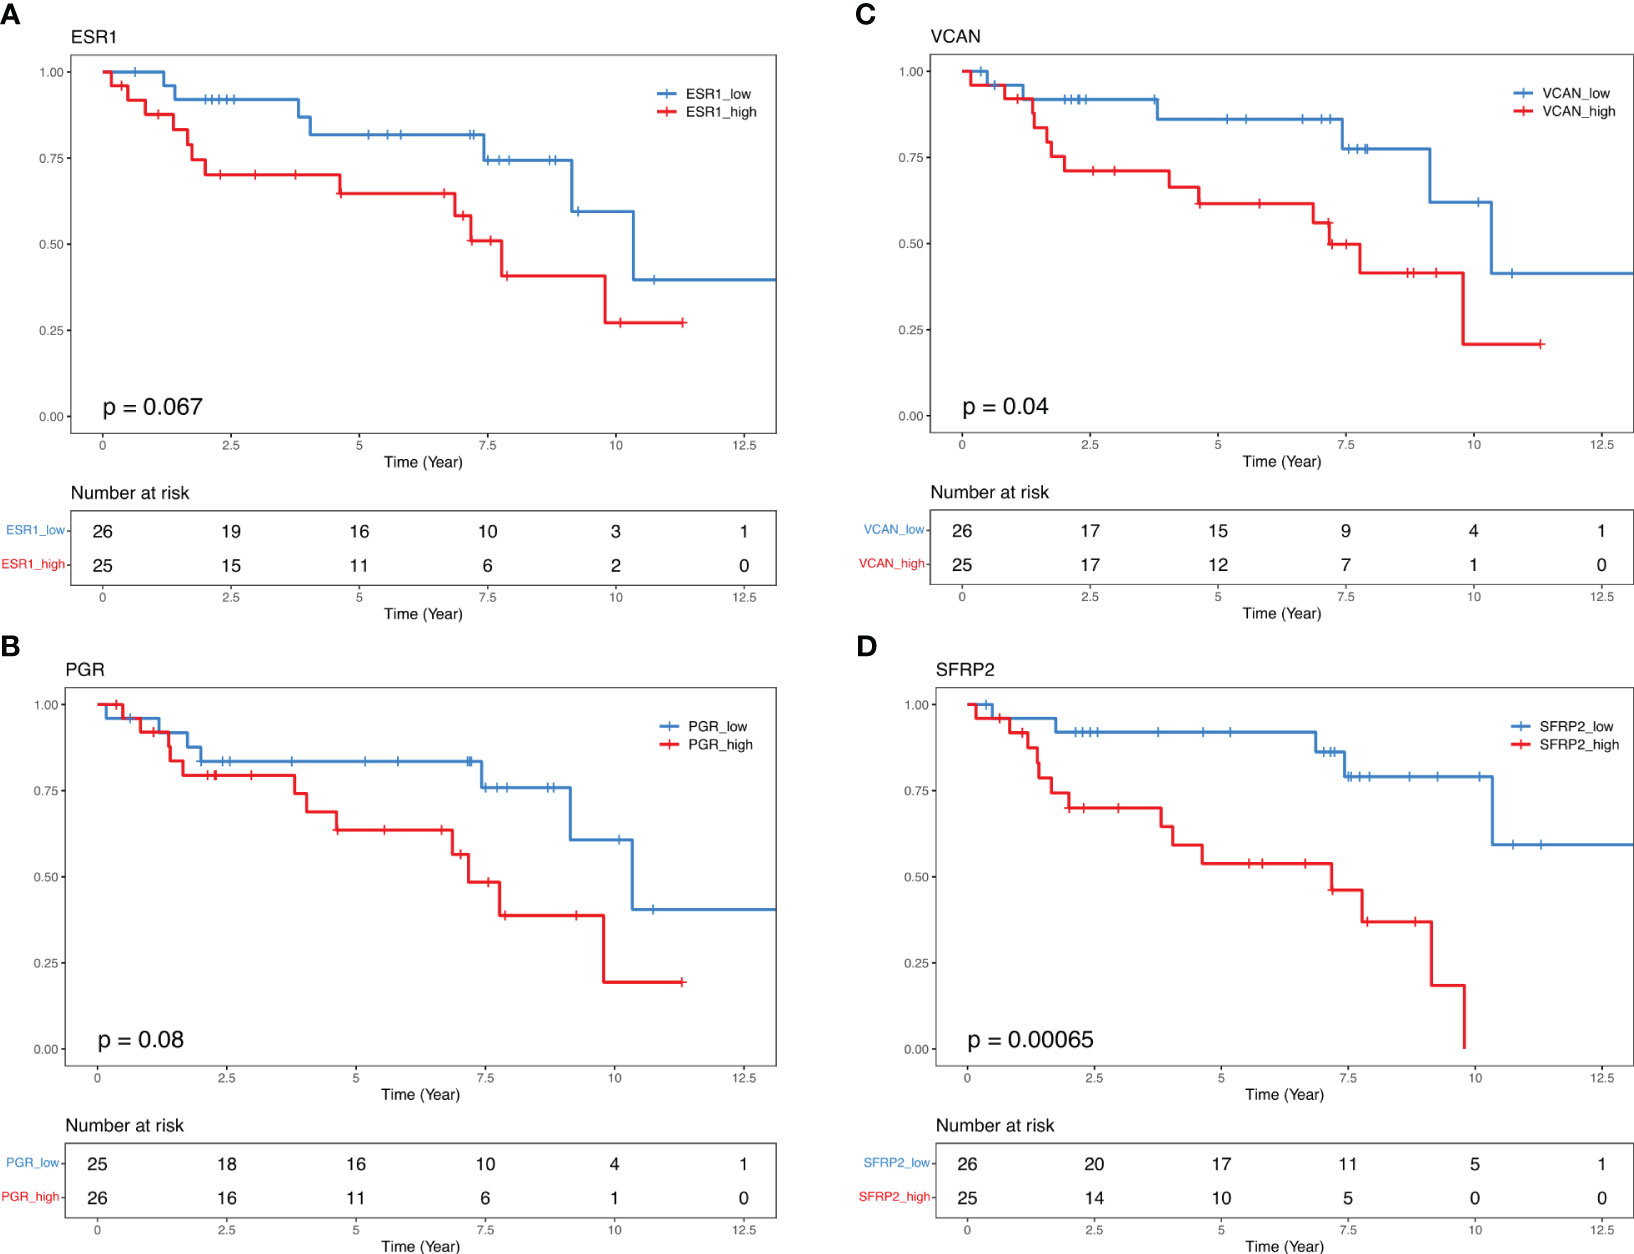
Figure 5 Kaplan-Maier curves illustrate biochemical recurrence free-survival for ESR1, PGR, VCAN, and SFRP2. Median 50% progression probability (A) ESR1 High 7.77 vs. ESR1 Low 10.34; (B) PGR High 7.17 vs. PGR Low 10.34; (C) VCAN High 7.17 vs. VCAN Low 10.34, and (D) SFRP2 High 7.17 vs. SFRP2 Low NA. Log-Rank test.
In the univariate Cox PH analysis, VCAN (HR, 2.6; 95% IC, 1.01-7.11; P=0.04), SFRP2 (HR, 5.8; 95% IC, 1.87-17.97; P=0.002) showed a significant positive association with reduced BCRFS (Table 4). Both PGR (HR, 2.2; 95% IC, 0.88-5.84; P=0.08) and ESR1 (HR, 2.3; 95% IC, 0.92-5.9; P=0.07) exhibited a positive correlation with reduced BCRFS that approached significance (Table 4). In the multivariate Cox PH analysis, THBS4 (HR, 11.4; 95% IC, 1.1-116; P=0.04), SFRP2 (HR, 27.4; 95% IC, 2.1-236.4; P=0.01), but not VCAN (HR, 1.3; 95% IC, 0.13-14.3; P=0.7) showed a prognostic value with reduced BCRFS when modeling the effect of each gene and clinical variables (Table 5).
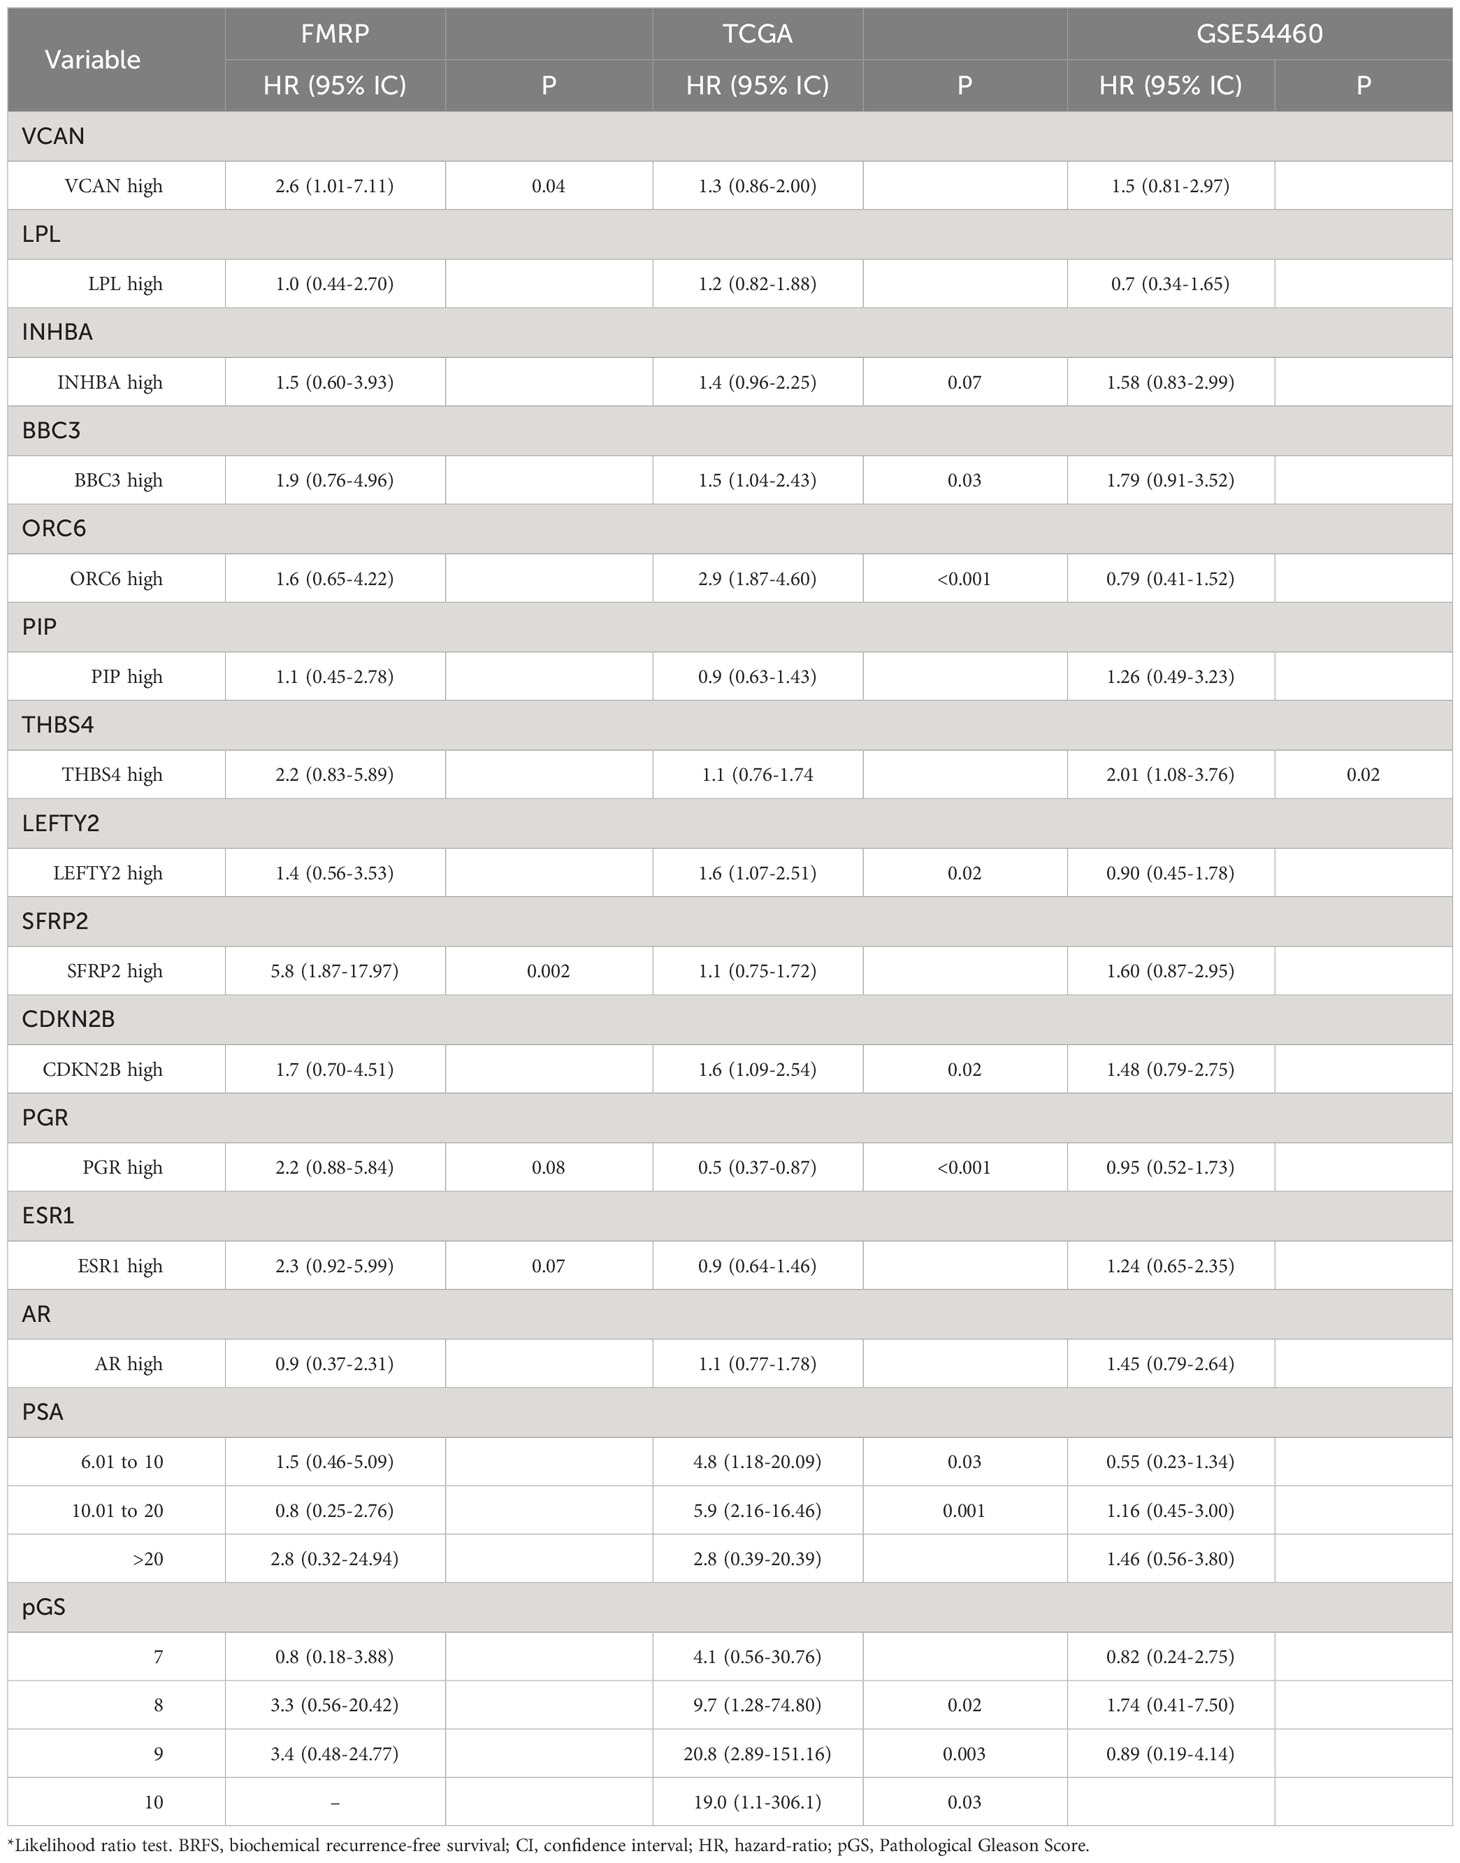
Table 4 Univariate Cox PH model for BCRFS.
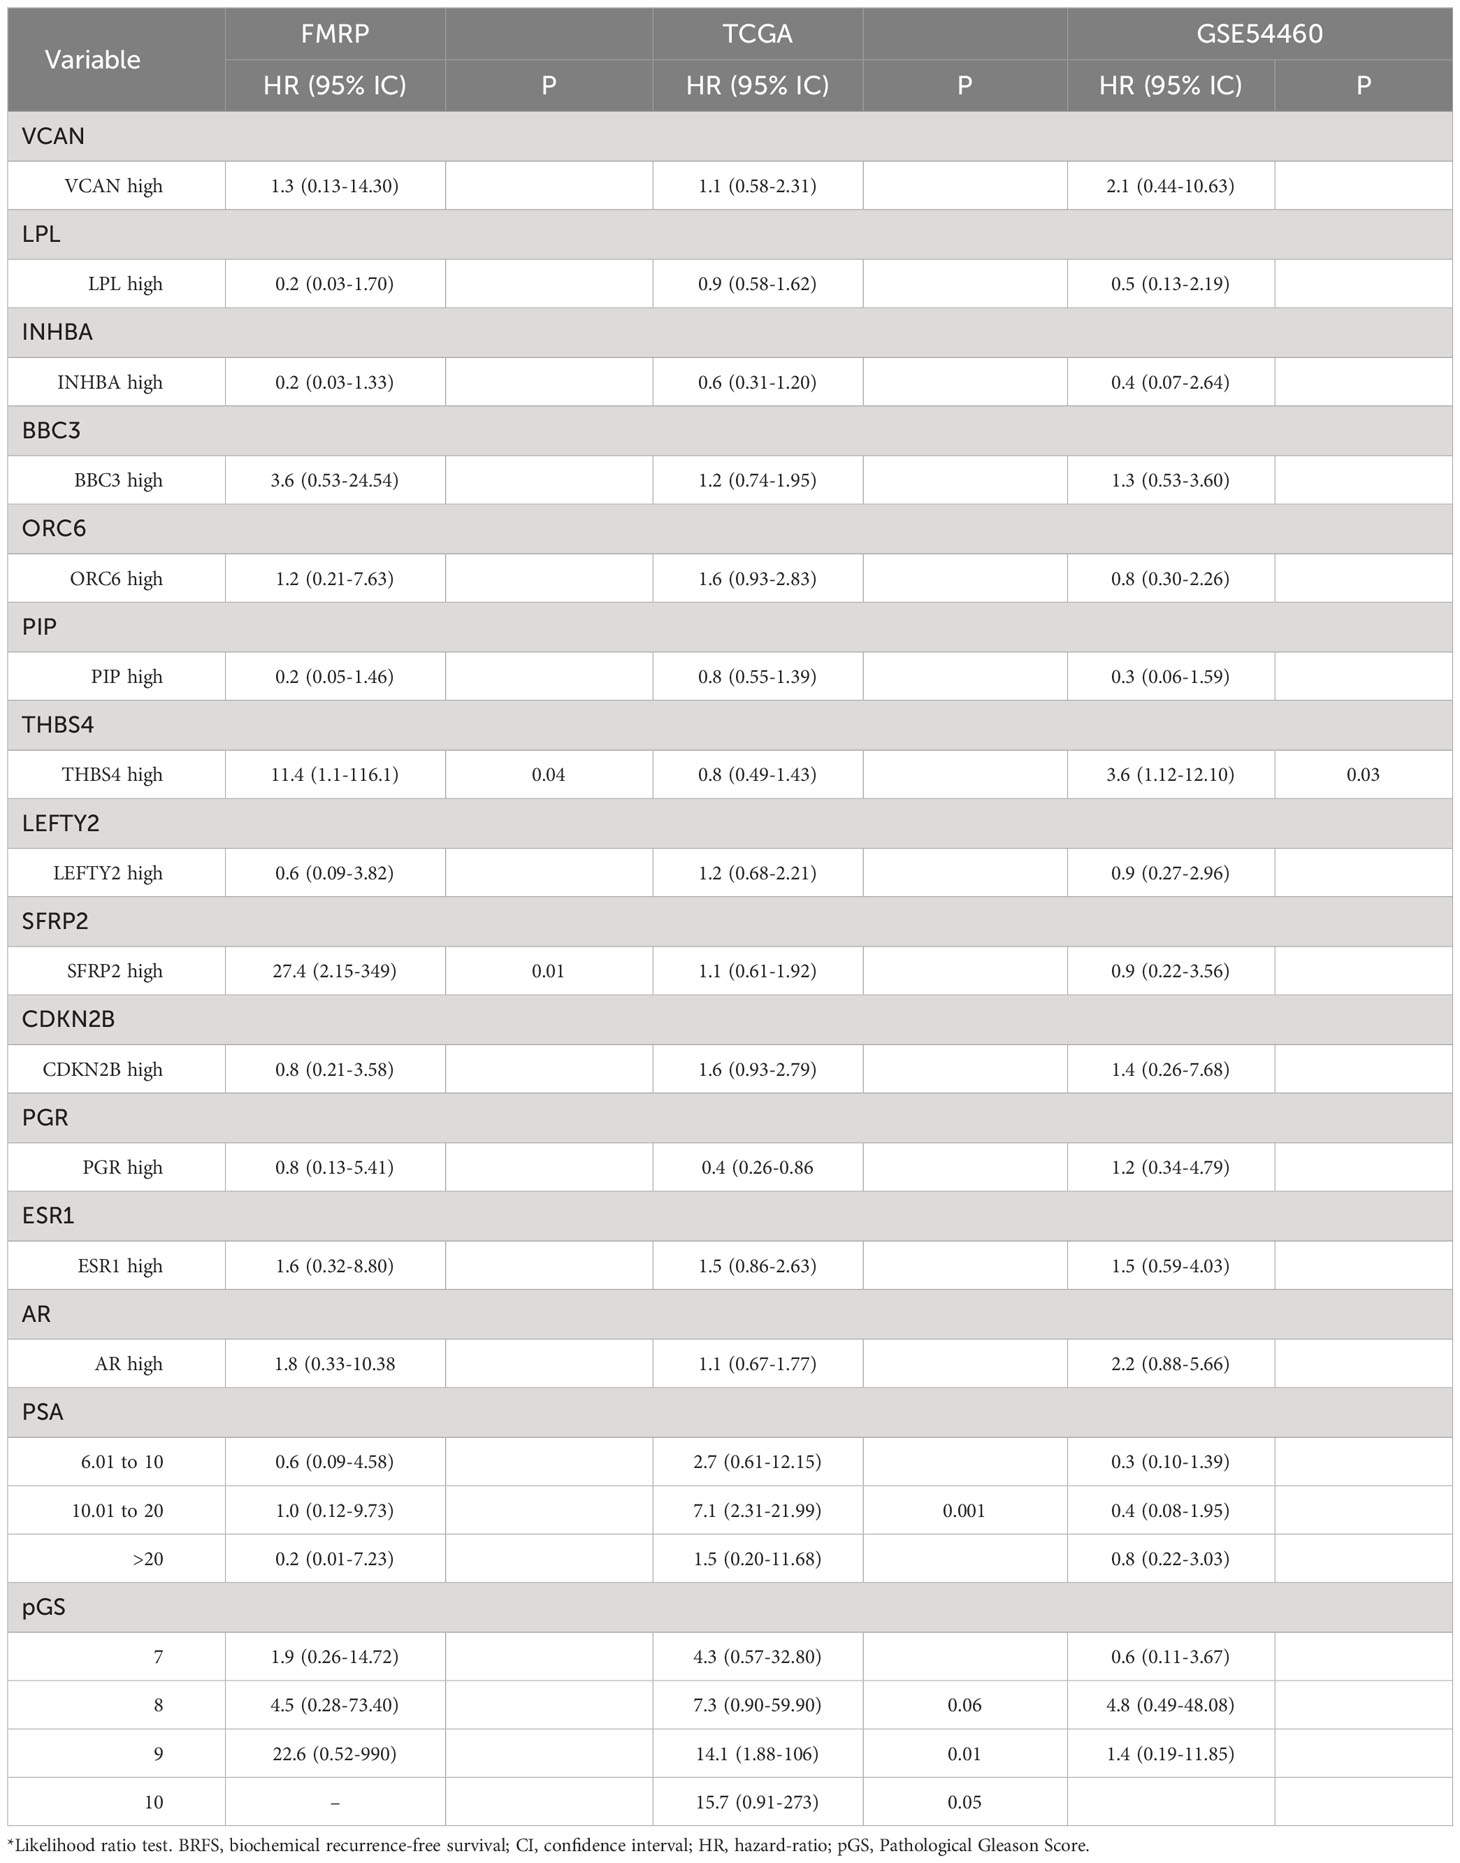
Table 5 Multivariate Cox regression model for BCRFS.
Discussion
RNA gene signature biomarker panels are well-developed in BCa (30), and this study investigated whether genes and/or pathway signatures might be common to progression in both tumor types. In this work, we utilized the NanoString BC360 curated panel to identify tumor-agnostic biological characteristics in PCa and provide prognostic information on pathways mediating progression and treatment response. When we compared patients with BCR or classified based on CAPRA-S, we identified a subset of genes related to tumor progression and TME activation.
Breast cancer treatments are more diverse than PCa, with a range of target therapies and hormone-based treatments, reflecting the heterogeneity of the various breast cancer subtypes. In contrast, radiation and surgery remain the primary options for PCa with localized disease. While there are mutations like BRCA2 in BCa that direct therapies, genetic factors play a smaller role in PCa compared to breast cancer. Since some of the various signatures derived the BC360 panel have been trained for use in BCa, it was not unexpected that there were no clear correlations between these PCas (Figure 1A). Across the FMRP cohort, there was a strong expression of FOXA1, an AR and ER transcription factor required to facilitate chromatin binding (72, 73). Interestingly there was strong activation of ER signaling pathways as shown by the high ER Signaling scores which capture the impact of ER pathways on downstream signaling (Table S3). Indeed, despite the comparatively lower expression of ESR1 to AR, the enrichment of its partner pathways and genes is coincident with higher TGFB1 expression, relevant in PCa pathobiology (74). Additionally, the bespoke signatures in the panel revealed the variability of genes related to the immune microenvironment, cell adhesion, and differentiation. The Tumor Inflammation Score (TIS) (35), an 18-gene signature that measures pre-existing but suppressed adaptive immune response in cancers for putative sensitivity to PD-1/PDL-1 blockade, showed a range of scores consistent with those across the TCGA-PRAD cohort (75). Linked to observed low expression of PD-1 and PD-L1 and other immune genes, this dataset showed these samples to be largely immune-cold and consistent with the 8% of primary PCas identified as PD-L1 positive and 32% of metastatic castrate-resistant PCa (76). The relatively immune cold phenotype of this cohort as demonstrated by the various immune-based signatures is consistent with the resulting PAM50 Luminal A classification and the notion that Luminal A BCas are generally less-immune rich than their triple negative or HER2 positive counterparts (77).
Our study classified all cases as Luminal A using the validated PAM50 gene set and algorithm (NanoString Technologies), which is inconsistent with the previous application of the molecular classifier using expression microarrays (29). In this large retrospective study (29) which included 3782 PCa cases, the distribution across the subtypes were: Luminal A (34.3%), Luminal B (28.5%), and Basal-like (32.6%). Chance and a comparatively smaller cohort, in addition to platform differences, could account for the discordance in subtype distribution shown in our study. Additionally, the study by Zhao et al. excluded the HER2 subtypes from the classification algorithm, forcing the assignment of all samples into Luminal A, Luminal B, or Basal-like categories. Collectively, these data provide caution about drawing conclusions based on one technology. Nevertheless, in a subset of cases, correlations could be found between increasing Genomic Risk Scores and less-Luminal A-like correlations. Indeed, unsupervised clustering using the PAM50 genes showed comparatively higher expression of proliferation, cell cycle, and receptor tyrosine kinase genes suggesting a more aggressive molecular phenotype associated with Luminal B, HER2-enriched and Basal-like cancers. This contrasted with the more strongly correlated Luminal A cases in this study (i.e., correlations greater than the Luminal A mean) (Figures 1B, 2). To our knowledge, this is the first reported use of the PAM50 subtype raw value correlations to reveal the molecular heterogeneity within Luminal A-defined PCas. The implications of the findings revealed by the molecular subtyping as well as the Genomic Risk Scores driven by the PAM50 genes could identify those who would benefit from accelerating ADT and RT in addition to novel therapies for PCa currently being used in BCa. There are now clinical trials underway evaluating the use of CDK4/6 inhibitors in the metastatic and castration-resistant setting (reviewed by Kase et al. (78)) and the extension of the vast findings in the BCa could allow the repurposing of existing signatures for adoption in PCa. The retrospective finding of relatively higher benefit of Luminal B BCs patients to ribocilib in the MONALESSA trials (78), offers the possibility of stratifying genomically high-risk, cell-cycle driven PCa patients to CDK4/6 inhibitors. The strong role of hormone receptors in driving cellular proliferation and aberrant signaling could support the use of CDK4/6 inhibitors against a backbone of ADT, similar to current advanced BCa treatment protocols.
Indeed, as discussed above an important consideration of this study was the role of progression in the context of the expression of steroid hormone receptors (22, 25). Our analysis revealed an association between BCR status and high levels of AR expression (Figure 1), which was comparable to the high expression levels of ESR1 and PGR, although expressed at lower levels than AR (Figure S6). Of particular interest was the observation that despite the overall low expression of ESR1, there was a strong activation of ER based on BC360 analysis (Figure 1A). We found that BCR patients with higher ER and PGR expression had a positive association with reduced BCRFS (Figure 5). Through Kaplan Meier analysis, we confirmed a positive association between ESR1 and PGR with reduced BCRFS, and a positive hazard ratio was evident in Cox PH univariate analysis for ESR1 (Figures 5A, B; Table 4). Previous studies have also speculated on the role of steroid hormone receptors (ER and PGR) in the development of PCa (77–85). In a mouse model, functional ESR1 was shown to be necessary for PCa development (86), and during the progression of PCa, ESR1 was found at low levels in the prostatic epithelium (79) but was overexpressed in the stroma, promoting tumor progression in a paracrine manner. PGR emerged as an essential marker for estrogen-regulated growth, with some studies suggesting a positive regulatory effect of ER on PGR expression (85, 87). However, there are conflicting data on the role of PGR in PCa progression, necessitating further studies (77, 79–82). Overall, our analysis of the BC360 panel identified enrichment of the ER Signaling Signature across the samples (Figure 1A), suggesting activated pathways downstream of ER, even at low ER levels (Table S3). These findings support the idea that as PCas become androgen-insensitive, progression may be partly driven by ER-mediated pathways either in the cancer itself or through ER-mediated signaling in the stroma creating a permissive microenvironment favoring tumor progression Interrogation of the gene panel showed a prominent role of the EMT in relation to BCR. Kaplan Meier analysis indicated that high expression of VCAN (Log-Rank test P=0.04) was associated with a significantly lower BCRFS, consistent with the recognition of VCAN-mediated progression (80). VCAN expression is regulated by SNAIL, which is proposed to bind to the gene’s promoter region (88). VCAN protein expression has important roles in the tumor microenvironment and contributes to immune cell infiltration and extracellular matrix remodeling. Versican is a large proteoglycan composed of an N-terminal G1 domain, a CS attachment region, and a C terminus (or G3) selectin-like domain (82). The different components of the extracellular matrix, including the EGF receptor (EGFR), interact with the VCAN-G3 domain, which enhances cell proliferation and migration by upregulating EGFR/ERK pathway signaling. Furthermore, proteoglycans, such as VCAN, are regulated by the gene family known as ADAMTS (A Disintegrin-like And Metalloproteinase domain with Thrombospondin-1 motif), which promotes VCAN extracellular cleavage and protein activation (83). Interestingly, studies found that VCAN expression in PCa may be the source of cancer stem cell extracellular signaling cascade to initiate tumor formation (84). Also, a study of ADAMTS in PCa cells showed that increased TGFB1 negatively regulates ADAMTS transcripts and aids the increase of VCAN in the PCa stromal compartment (85). In our cohort, patients who experienced BCR also had significantly elevated TGFB1 expression compared to those who did not have BCR (Figure S5, p = 0.018). Recently, seven genes, including VCAN, were found to be enriched in PCa extracellular matrix and were associated with BCR and bone metastasis (87). These findings draw attention to the role of the tumor microenvironment in the outcome of breast and prostate cancer. For example, earlier microarray analysis of stromal gene expression signatures in both tumor types identified a small deregulated microenvironmental gene set common to both cancers that were predictive of poor prognosis (86).
High expression of SFRP2 (Log-Rank test P=0.0006) also showed an association with a significantly lower BCRFS in our retrospective cohort. SFRP2 is part of a gene family of five glycoproteins that act as extracellular ligands of soluble Wnt ligands (89). SFRPs sequesters and inhibit frizzled (FZ) receptors and decrease WNT/β-catenin pathways activation. Several studies highlighted the role of SFRPs in stomal-to-epithelial paracrine signals and have shown that hypermethylation of this gene is associated with the inactivation of Wnt agonistic function and is frequently altered in cancer, including breast and prostate (88, 90–93). Immunohistochemical analysis of SFRP2 showed reduced expression of SFRP2 in low Gleason PCa, but diverse expression in Gleason 5 tumors (94). This study identified, among patients who experienced BCR, a group of Gleason 5 samples with strong/moderate SFRP2 expression and with a morphologic solid growth pattern. In a follow-up study (95) the authors showed a high frequency of hypermethylation of SFRP2 and concomitant low expression of the gene in PCa (92). Earlier studies showed that SFRP2 expression was elevated in breast tumor endothelium tissues compared to normal tissues (96). Furthermore, SFRP2 overexpression was also associated with increased tumor size and reduced survival rates in BCa (97). Therefore, while there are discrepancies in SFRP expression likely arising because of the heterogeneity of DNA methylation in PCa, our results demonstrate a link between elevated SFRP2 expression and cancer progression, particularly in PCa, emphasizing the role of SFRP2 in disease progression.
Finally, we identified and subsequently validated in the TGCA, the prognostic potential of ORC6, the sixth subunit of a DNA-binding complex, shown to be dysregulated in a number of neoplasms. Lin et al. (52), recently demonstrated ORC6 as prognostic for overall survival, disease-specific survival, disease-free interval, and progress-free interval in several cancers including the prostate, and that ORC6 may promote immunosuppression in a wide array of cancer.
Although this study used a well-defined workflow to underscore the potential of the NanoString BC360 panel for detecting DEGs and pathways linked to progression, our study also has specific limitations that need to be addressed in future studies. Our analysis focused on a transcriptome-derived panel tailored to specific biological processes relevant to BCa, thus not fully capturing all the pathological and molecular variables that could be unique to prostate tissue. Also, our study does not consider the influence of mutations and copy-number alterations that may modify transcriptomic signatures. Furthermore, while tissues were macrodissected to enrich for cancer cells, it is important to recognize the contributions of the surrounding tissue stroma and infiltrating immune cells to the gene expression analyses and to PCa pathogenesis. To mitigate potential statistical biases, future research will require a comprehensive analysis of a larger and more diverse PCa cohort. Our findings highlight the promise of the NanoString BC360 panel in identifying tumor-agnostic markers linked to prostate carcinogenesis and progression. They underscore the potential utility of employing tumor-agnostic biomarkers to classify patients within the realm of hormone-driven tumors such as prostate and breast cancers, thereby contributing to optimized clinical decision-making and favorable treatment results.
Conclusion
In this study, we reasoned that PCa might involve some of the same genes and pathways of tumor progression utilized by aggressive BCas. The refinement of BCa prognostic and predictive gene expression signatures has provided crucial information for effectively using precision therapeutics in this endocrine-driven cancer (30). Tumor-agnostic biomarkers have gained interest in prognosis and treatment response studies (18). Several characteristics, such as expression signatures, DNA mismatch repair deficiency (MMR-D), and BRCA1 status, are currently used agnostically regardless of cancer origin (22, 98, 99). Breast cancer and PCa are both proposed to be biologically related (100, 101), and both tumors share common biological features during hormone-dependent development (23, 29). Multi-omics studies in breast and prostate cancer identified common epigenome alterations in CpG islands in predicted therapeutic targets. Transcriptome-wide analyses also uncovered risk-associated miRNAs associated with hormone-dependent cancers. Thus, studying DEGs common to breast and prostate cancer may identify shared biological pathways and more robust tumor-agnostic biomarkers.
In this work, we investigated the power of the NanoString BC360 panel in identifying tumor-agnostic biological characteristics between breast and prostate cancer. We identified DEGs such as VCAN, SFRP2 involved in angiogenesis and epithelial-mesenchymal transition, which can be developed as novel tumor-agnostic biomarkers for tumor progression. In further analysis, PGR, ESR1, and VCAN gene expression predicted relapse events. Taken together our results may support means for effectively detecting cancers that progress contribute to improved patient prognostic stratification.
Data availability statement
The datasets presented in this study can be found in online repositories. The names of the repository/repositories and accession number(s) can be found in the article/Supplementary Material.
Ethics statement
The studies involving humans were approved by Ethics Committee in Research of Hospital of Ribeirão Preto, São Paulo, Brazil (HCRP) number CAAE 60032122.8.0000.5440 and the Ethics Board of the University of Toronto (Protocol: 00043323). The studies were conducted in accordance with the local legislation and institutional requirements. The participants provided their written informed consent to participate in this study.
Author contributions
WL: Conceptualization, Data curation, Formal Analysis, Investigation, Methodology, Project administration, Validation, Visualization, Writing – original draft, Writing – review & editing. CM: Data curation, Investigation, Methodology, Validation, Writing – review & editing. LC: Data curation, Investigation, Methodology, Writing – review & editing. FS: Data curation, Writing – review & editing. CC: Data curation, Investigation, Methodology, Validation, Writing – review & editing. AS: Data curation, Investigation, Methodology, Validation, Writing – review & editing. EW: Data curation, Investigation, Methodology, Validation, Writing – original draft. FS: Data curation, Investigation, Methodology, Validation, Writing – review & editing. FA: Data curation, Methodology, Writing – review & editing. Rd: Data curation, Investigation, Methodology, Project administration, Writing – review & editing. JS: Conceptualization, Data curation, Formal Analysis, Funding acquisition, Investigation, Methodology, Project administration, Resources, Supervision, Validation, Visualization, Writing – original draft, Writing – review & editing. JB: Conceptualization, Data curation, Formal Analysis, Funding acquisition, Investigation, Methodology, Project administration, Resources, Supervision, Validation, Visualization, Writing – original draft, Writing – review & editing.
Funding
The author(s) declare financial support was received for the research, authorship, and/or publication of this article. This work was supported by the Fundação de Amparo à Pesquisa do Estado de São Paulo (FAPESP) [grant number 2019/22912-8] and by CNPq [grant PQ-1D] to JS and funds from the Government of Ontario to JB.
Acknowledgments
The authors acknowledge the contributions of the Department of Surgery and Anatomy, the Department of Pathology, the Medicine School of Ribeirao Preto, and members of Diagnostic Development at the Ontario Institute for Cancer Research. We thank the patients for their contributions to the study.
Conflict of interest
JB has the patent application “A Molecular Classifier for Personalized Risk Stratification for Patients with Prostate Cancer” under consideration. Status: PCT, Filing date: June 18, 2021, International Application No.: PCT/CA2021/050837, PCT Application Title: Molecular Classifiers for Prostate Cancer. Previous US Provisional Status: Filing Date: June 18, 2020, US Provisional Patent No. 63/040.692, US Provisional Application Title: Use of Molecular Classifiers to Diagnose, Treat, and Prognose Prostate Cancer.
The remaining authors declare that the research was conducted in the absence of any commercial or financial relationships that could be constructed as a potential conflict of interest.
Publisher’s note
All claims expressed in this article are solely those of the authors and do not necessarily represent those of their affiliated organizations, or those of the publisher, the editors and the reviewers. Any product that may be evaluated in this article, or claim that may be made by its manufacturer, is not guaranteed or endorsed by the publisher.
Supplementary material
The Supplementary Material for this article can be found online at: https://www.frontiersin.org/articles/10.3389/fonc.2023.1280943/full#supplementary-material
References
1. Sung H, Ferlay J, Siegel RL, Laversanne M, Soerjomataram I, Jemal A, et al. Global cancer statistics 2020: GLOBOCAN estimates of incidence and mortality worldwide for 36 cancers in 185 countries. CA Cancer J Clin (2021) 71(3):209–49. doi: 10.3322/caac.21660
2. Rebello RJ, Oing C, Knudsen KE, Loeb S, Johnson DC, Reiter RE, et al. Prostate cancer. Nat Rev Dis Primers (2021) 7(1):9. doi: 10.1038/s41572-020-00243-0
3. Fraser M, Sabelnykova VY, Yamaguchi TN, Heisler LE, Livingstone J, Huang V, et al. Genomic hallmarks of localized, non-indolent prostate cancer. Nature (2017) 541(7637):359–64. doi: 10.1038/nature20788
4. Gerhauser C, Favero F, Risch T, Simon R, Feuerbach L, Assenov Y, et al. Molecular evolution of early-onset prostate cancer identifies molecular risk markers and clinical trajectories. Cancer Cell (2018) 34(6):996–1011.e8. doi: 10.1016/j.ccell.2018.10.016
5. Boyd LK, Mao X, Lu YJ. The complexity of prostate cancer: Genomic alterations and heterogeneity. Nat Rev Urol (2012) 9(11):652–64. doi: 10.1038/nrurol.2012.185
6. Cucchiara V, Cooperberg MR, Dall’Era M, Lin DW, Montorsi F, Schalken JA, et al. Genomic markers in prostate cancer decision making. Eur Urol (2018) 73:572–82. doi: 10.1016/j.eururo.2017.10.036
7. Doultsinos D, Mills IG. Derivation and application of molecular signatures to prostate cancer: opportunities and challenges. Cancers (Basel) (2021) 13(3):495. doi: 10.3390/cancers13030495
8. Smith-Palmer J, Takizawa C, Valentine W. Literature review of the burden of prostate cancer in Germany, France, the United Kingdom and Canada. BMC Urol (2019) 19(1):19. doi: 10.1186/s12894-019-0448-6
9. Ku SY, Gleave ME, Beltran H. Towards precision oncology in advanced prostate cancer. Nat Rev Urol (2019) 16(11):645–54. doi: 10.1038/s41585-019-0237-8
10. Irshad S, Bansal M, Castillo-Martin M, Zheng T, Aytes A, Wenske S, et al. A molecular signature predictive of indolent prostate cancer. Sci Transl Med (2013) 5(202):202ra122. doi: 10.1126/scitranslmed.3006408
11. Klein EA, Cooperberg MR, Magi-Galluzzi C, Simko JP, Falzarano SM, Maddala T, et al. A 17-gene assay to predict prostate cancer aggressiveness in the context of gleason grade heterogeneity, tumor multifocality, and biopsy undersampling. Eur Urol (2014) 66(3):550–60. doi: 10.1016/j.eururo.2014.05.004
12. Agell L, Hernández S, Nonell L, Lorenzo M, Puigdecanet E, de Muga S, et al. A 12-gene expression signature is associated with aggressive histological in prostate cancer: SEC14L1 and TCEB1 genes are potential markers of progression. Am J Pathol (2012) 181(5):1585–94. doi: 10.1016/j.ajpath.2012.08.005
13. Cuzick J, Fisher G, Mstat R, Ba W, Park J, Bs Y, et al. Prognostic value of an RNA expression signature derived from cell cycle proliferation genes in patients with prostate cancer: a retrospective study. Lancet Oncol (2011) 12:245–55. doi: 10.1016/S1470-2045(10)70295-3
14. Erho N, Crisan A, Vergara IA, Mitra AP, Ghadessi M, Buerki C, et al. Discovery and validation of a prostate cancer genomic classifier that predicts early metastasis following radical prostatectomy. PloS One (2013) 8(6):e66855. doi: 10.1371/journal.pone.0066855
15. Sharma NL, Massie CE, Ramos-Montoya A, Zecchini V, Scott HE, Lamb AD, et al. The androgen receptor induces a distinct transcriptional program in castration-resistant prostate cancer in man. Cancer Cell (2013) 23(1):35–47. doi: 10.1016/j.ccr.2012.11.010
16. Singh Nanda J, Koganti P, Perri G, Ellis L. Phenotypic plasticity-alternate transcriptional programs driving treatment resistant prostate cancer. Crit Rev Oncog (2022) 27(1):45–60. doi: 10.1615/CritRevOncog.2022043096
17. Offin M, Liu D, Drilon A. Tumor-agnostic drug development. In: American Society of Clinical Oncology Educational Book, vol. 38. (2018). p. 184–7. doi: 10.1200/EDBK_200831
18. Schlauch D, Fu X, Jones SF, Burris Iii HA, Spigel DR, Reeves J, et al. Tumor-specific and tumor-agnostic molecular signatures associated with response to immune checkpoint inhibitors. JCO Precis Oncol (2021) 5:1625–38. doi: 10.1200/PO.21.00008
19. Minati R, Perreault C, Thibault P. A roadmap toward the definition of actionable tumor-specific antigens. Front Immunol (2020) 11. doi: 10.3389/fimmu.2020.583287
20. Le DT, Uram JN, Wang H, Bartlett BR, Kemberling H, Eyring AD, et al. PD-1 blockade in tumors with mismatch-repair deficiency. N Engl J Med (2015) 372(26):2509–20. doi: 10.1056/NEJMoa1500596
21. Wang S, He Z, Wang X, Li H, Liu XS. Antigen presentation and tumor immunogenicity in cancer immunotherapy response prediction. (2019). doi: 10.7554/eLife.49020.001
22. Yarchoan M, Hopkins A, Jaffee EM. Tumor mutational burden and response rate to PD-1 inhibition. N Engl J Med (2017) 377(25):2500–1. doi: 10.1056/NEJMc1713444
23. Risbridger GP, Davis ID, Birrell SN, Tilley WD. Breast and prostate cancer: more similar than different. Nat Rev Cancer (2010) 10(3):205–12. doi: 10.1038/nrc2795
24. Toivanen R, Shen MM. Prostate organogenesis: Tissue induction, hormonal regulation and cell type specification. Development (2017) 144(8):1382–98. doi: 10.1242/dev.148270
25. Harbeck N, Penault-Llorca F, Cortes J, Gnant M, Houssami N, Poortmans P, et al. Breast cancer. Nat Rev Dis Primers (2019) 5(1):66. doi: 10.1038/s41572-019-0111-2
26. Welch HG, Gorski DH, Albertsen PC. Trends in metastatic breast and prostate cancer — Lessons in cancer dynamics. N Engl J Med (2015) 373(18):1685–7. doi: 10.1056/NEJMp1510443
27. Perou CM, Sørlie T, Eisen MB, van de Rijn M, Jeffrey SS, Rees CA, et al. Molecular portraits of human breast tumours. Nature (2000) 406(6797):747–52. doi: 10.1038/35021093
28. Wallden B, Storhoff J, Nielsen T, Dowidar N, Schaper C, Ferree S, et al. Development and verification of the PAM50-based Prosigna breast cancer gene signature assay. BMC Med Genomics (2015) 8(1):54. doi: 10.1186/s12920-015-0129-6
29. Zhao SG, Chang SL, Erho N, Yu M, Lehrer J, Alshalalfa M, et al. Associations of luminal and basal subtyping of prostate cancer with prognosis and response to androgen deprivation therapy. JAMA Oncol (2017) 3(12):1663–72. doi: 10.1001/jamaoncol.2017.0751
30. Kwa M, Makris A, Esteva FJ. Clinical utility of gene-expression signatures in early stage breast cancer. Nat Rev Clin Oncol (2017) 14(10):595–610. doi: 10.1038/nrclinonc.2017.74
31. Mohler JL, Antonarakis ES, Armstrong AJ, D’Amico AV, Davis BJ, Dorff T, et al. Prostate cancer, version 2.2019, NCCN clinical practice guidelines in oncology. J Natl Compr Cancer Netw (2019) 17(5):479–505.
32. Cooperberg MR, Hilton JF, Carroll PR. The CAPRA-S score. Cancer (2011) 117(22):5039–46. doi: 10.1002/cncr.26169
33. Bayani J, Yao CQ, Quintayo MA, Yan F, Haider S, D’Costa A, et al. Molecular stratification of early breast cancer identifies drug targets to drive stratified medicine. NPJ Breast Cancer (2017) 3(1):3. doi: 10.1038/s41523-016-0003-5
34. Patel PG, Selvarajah S, Guérard KP, Bartlett JMS, Lapointe J, Berman DM, et al. Reliability and performance of commercial RNA and DNA extraction kits for FFPE tissue cores. PloS One (2017) 12(6):e0179732. doi: 10.1371/journal.pone.0179732
35. Ayers M, Lunceford J, Nebozhyn M, Murphy E, Loboda A, Kaufman DR, et al. IFN-γ-related mRNA profile predicts clinical response to PD-1 blockade. J Clin Invest (2017) 127(8):2930–40. doi: 10.1172/JCI91190
36. Love MI, Huber W, Anders S. Moderated estimation of fold change and dispersion for RNA-seq data with DESeq2. Genome Biol (2014) 15(12):550. doi: 10.1186/s13059-014-0550-8
37. Wu T, Hu E, Xu S, Chen M, Guo P, Dai Z, et al. clusterProfiler 4.0: A universal enrichment tool for interpreting omics data. Innovation (2021) 2(3):100141. doi: 10.1016/j.xinn.2021.100141
38. Wickham H, Chang W, Henry L, Pedersen TL, Takahashi K, Wilke C, et al. ggplot2: Elegant Graphics for Data Analysis. Verlag New York: Springer (2016).
39. Abeshouse A, Ahn J, Akbani R, Ally A, Amin S, Andry CD, et al. The molecular taxonomy of primary prostate cancer. Cell (2015) 163(4):1011–25. doi: 10.1016/j.cell.2015.10.025
40. Long Q, Xu J, Osunkoya AO, Sannigrahi S, Johnson BA, Zhou W, et al. Global transcriptome analysis of formalin-fixed prostate cancer specimens identifies biomarkers of disease recurrence. Cancer Res (2014) 74(12):3228–37. doi: 10.1158/0008-5472.CAN-13-2699
41. Rocca A, Ravaioli S, Fonzi E, Barozzi I, Perone Y, Magnani L, et al. (2019). Abstract P4-07-06: Breast cancer subtype classification using NanoString and RNAseq technologies | Cancer Research | American Association for Cancer Research, in: Proceedings of the 2019 San Antonio Breast Cancer Symposium. doi: 10.1158/1538-7445.SABCS19-P4-07-06
42. Du WW, Fang L, Yang X, Sheng W, Yang BL, Seth A, et al. The role of versican in modulating breast cancer cell self-renewal. Mol Cancer Res (2013) 11(5):443–55. doi: 10.1158/1541-7786.MCR-12-0461
43. Hikisz P, Kiliańska Z. Puma, a critical mediator of cell death — one decade on from its discovery. Cell Mol Biol Lett (2012) 17(4):646–69. doi: 10.2478/s11658-012-0032-5
44. Singh AP, Bafna S, Chaudhary K, Venkatraman G, Smith L, Eudy JD, et al. Genome-wide expression profiling reveals transcriptomic variation and perturbed gene networks in androgen-dependent and androgen-independent prostate cancer cells. Cancer Lett (2008) 259(1):28–38. doi: 10.1016/j.canlet.2007.09.018
45. Reader KL, John-McHaffie S, Zellhuber-McMillan S, Jowett T, Mottershead DG, Cunliffe HE, et al. Activin B and activin C have opposing effects on prostate cancer progression and cell growth. Cancers (Basel) (2022) 15(1):147. doi: 10.3390/cancers15010147
46. Chen L, De Menna M, Groenewoud A, Thalmann GN, Kruithof-de Julio M, Snaar-Jagalska BE. A NF-ĸB-Activin A signaling axis enhances prostate cancer metastasis. Oncogene (2020) 39(8):1634–51. doi: 10.1038/s41388-019-1103-0
47. Tobin AJ, Noel NP, Christian SL, Brown RJ. Lipoprotein lipase hydrolysis products induce pro-inflammatory cytokine expression in triple-negative breast cancer cells. BMC Res Notes (2021) 14(1):315. doi: 10.1186/s13104-021-05728-z
48. van Loon K, Huijbers EJM, Griffioen AW. Secreted frizzled-related protein 2: a key player in noncanonical Wnt signaling and tumor angiogenesis. Cancer Metastasis Rev (2021) 40(1):191–203. doi: 10.1007/s10555-020-09941-3
49. Sun Y, Zhu D, Chen F, Qian M, Wei H, Chen W, et al. SFRP2 augments WNT16B signaling to promote therapeutic resistance in the damaged tumor microenvironment. Oncogene (2016) 35(33):4321–34. doi: 10.1038/onc.2015.494
50. Hassan M, Waheed A, Yadav S, Singh TP, Ahmad F. Prolactin inducible protein in cancer, fertility and immunoregulation: structure, function and its clinical implications. Cell Mol Life Sci (2009) 66(3):447–59. doi: 10.1007/s00018-008-8463-x
51. Ulloa L, Tabibzadeh S. Lefty inhibits receptor-regulated smad phosphorylation induced by the activated transforming growth factor-β Receptor. J Biol Chem (2001) 276(24):21397–404. doi: 10.1074/jbc.M010783200
52. Lin Y, Zhang Y, Tuo Z, Gao L, Ding D, Bi L, et al. ORC6, a novel prognostic biomarker, correlates with T regulatory cell infiltration in prostate adenocarcinoma: a pan-cancer analysis. BMC Cancer (2023) 23(1):285. doi: 10.1186/s12885-023-10763-z
53. Hou Y, Li H, Huo W. THBS4 silencing regulates the cancer stem cell-like properties in prostate cancer via blocking the PI3K/Akt pathway. Prostate (2020) 80(10):753–63. doi: 10.1002/pros.23989
54. Rochette A, Boufaied N, Scarlata E, Hamel L, Brimo F, Whitaker HC, et al. Asporin is a stromally expressed marker associated with prostate cancer progression. Br J Cancer (2017) 116(6):775–84. doi: 10.1038/bjc.2017.15
55. Qing Y, Wang Y, Hu C, Zhang H, Huang Y, Zhang Z, et al. Evaluation of NOTCH family genes’ expression and prognostic value in prostate cancer. Transl Androl Urol (2022) 11(5):627–42. doi: 10.21037/tau-22-281
56. True LD, Zhang H, Ye M, Huang CY, Nelson PS, von Haller PD, et al. CD90/THY1 is overexpressed in prostate cancer-associated fibroblasts and could serve as a cancer biomarker. Modern Pathol (2010) 23(10):1346–56. doi: 10.1038/modpathol.2010.122
57. Hintz HM, Gallant JP, Vander Griend DJ, Coleman IM, Nelson PS, LeBeau AM. Imaging fibroblast activation protein alpha improves diagnosis of metastatic prostate cancer with positron emission tomography. Clin Cancer Res (2020) 26(18):4882–91. doi: 10.1158/1078-0432.CCR-20-1358
58. Liu F, Qi L, Liu B, Liu J, Zhang H, Che D, et al. Fibroblast activation protein overexpression and clinical implications in solid tumors: A meta-analysis. PloS One (2015) 10(3):e0116683. doi: 10.1371/journal.pone.0116683
59. Long X, Wu L, Zeng X, Wu Z, Hu X, Jiang H, et al. Biomarkers in previous histologically negative prostate biopsies can be helpful in repeat biopsy decision-making processes. Cancer Med (2020) 9(20):7524–36. doi: 10.1002/cam4.3419
60. Zhang X, Wang L, Wang Y, Shi S, Zhu H, Xiao F, et al. Inhibition of FOXQ1 induces apoptosis and suppresses proliferation in prostate cancer cells by controlling BCL11A/MDM2 expression. Oncol Rep (2016) 36(4):2349–56. doi: 10.3892/or.2016.5018
61. Nonsrijun N, Mitchai J, Brown K, Leksomboon R, Tuamsuk P. Overexpression of matrix metalloproteinase 11 in thai prostatic adenocarcinoma is associated with poor survival. Asian Pacific J Cancer Prev (2013) 14(5):3331–5. doi: 10.7314/APJCP.2013.14.5.3331
62. Liu B, Li X, Li J, Jin H, Jia H, Ge X. Construction and validation of a robust cancer stem cell-associated gene set-based signature to predict early biochemical recurrence in prostate cancer. Dis Markers (2020) 2020:1–8. doi: 10.1155/2020/8860788
63. Xiong Z, Ge Y, Xiao J, Wang Y, Li L, Ma S, et al. GAS1RR, an immune-related enhancer RNA, is related to biochemical recurrence-free survival in prostate cancer. Exp Biol Med (2023) 248(1):1–13. doi: 10.1177/15353702221131888
64. Wightman SC, Uppal A, Pitroda SP, Ganai S, Burnette B, Stack M, et al. Oncogenic CXCL10 signalling drives metastasis development and poor clinical outcome. Br J Cancer (2015) 113(2):327–35. doi: 10.1038/bjc.2015.193
65. Garcia J, Krieger KD, Loitz C, Perez LM, Richards ZA, Helou Y, et al. Regulation of prostate androgens by megalin and 25-hydroxyvitamin D status: mechanism for high prostate androgens in african American men. Cancer Res Commun (2023) 3(3):371–82. doi: 10.1158/2767-9764.CRC-22-0362
66. Nan L, Kawamata H, Tan X, Kameyama S, Oyasu R. Differential expression of keratin 5 gene in non-tumorigenic and tumorigenic rat bladder cell lines. Cancer Lett (1993) 75(2):87–93. doi: 10.1016/0304-3835(93)90192-C
67. Stewart PA, Khamis ZI, Zhau HE, Duan P, Li Q, Chung LWK, et al. Upregulation of minichromosome maintenance complex component 3 during epithelial-to-mesenchymal transition in human prostate cancer. Oncotarget (2017) 8(24):39209–17. doi: 10.18632/oncotarget.16835
68. Yue W, Du X, Wang X, Gui N, Zhang W, Sun J, et al. Prognostic values of the core components of the mammalian circadian clock in prostate cancer. PeerJ (2021) 9:e12539. doi: 10.7717/peerj.12539
69. Mantzoros C, Tzonou A, Signorello L, Stampfer M, Trichopoulos D, Adami HO. Insulin-like growth factor 1 in relation to prostate cancer and benign prostatic hyperplasia. Br J Cancer (1997) 76(9):1115–8. doi: 10.1038/bjc.1997.520
70. Su Q, Zhang B, Zhang L, Dang T, Rowley D, Ittmann M, et al. Jagged1 upregulation in prostate epithelial cells promotes formation of reactive stroma in the Pten null mouse model for prostate cancer. Oncogene (2017) 36(5):618–27. doi: 10.1038/onc.2016.232
71. Du Z, Li L, Sun W, Zhu P, Cheng S, Yang X, et al. Systematic evaluation for the influences of the SOX17/notch receptor family members on reversing enzalutamide resistance in castration-resistant prostate cancer cells. Front Oncol (2021) 11. doi: 10.3389/fonc.2021.607291
72. Gao N, Zhang J, Rao MA, Case TC, Mirosevich J, Wang Y, et al. The role of hepatocyte nuclear factor-3α (Forkhead box A1) and androgen receptor in transcriptional regulation of prostatic genes. Mol Endocrinol (2003) 17(8):1484–507. doi: 10.1210/me.2003-0020
73. Carroll JS, Liu XS, Brodsky AS, Li W, Meyer CA, Szary AJ, et al. Chromosome-wide mapping of estrogen receptor binding reveals long-range regulation requiring the forkhead protein FoxA1. Cell (2005) 122(1):33–43. doi: 10.1016/j.cell.2005.05.008
74. Soulitzis N, Karyotis I, Delakas D, Spandidos D. Expression analysis of peptide growth factors VEGF, FGF2, TGFB1, EGF and IGF1 in prostate cancer and benign prostatic hyperplasia. Int J Oncol (2006) 29(2):305–14. doi: 10.3892/ijo.29.2.305
75. Danaher P, Warren S, Lu R, Samayoa J, Sullivan A, Pekker I, et al. Pan-cancer adaptive immune resistance as defined by the Tumor Inflammation Signature (TIS): results from The Cancer Genome Atlas (TCGA). J Immunother Cancer (2018) 6(1):63. doi: 10.1186/s40425-018-0367-1
76. Haffner MC, Guner G, Taheri D, Netto GJ, Palsgrove DN, Zheng Q, et al. Comprehensive evaluation of programmed death-ligand 1 expression in primary and metastatic prostate cancer. Am J Pathol (2018) 188(6):1478–85. doi: 10.1016/j.ajpath.2018.02.014
77. Solinas C, Carbognin L, de Silva P, Criscitiello C, Lambertini M. Tumor-infiltrating lymphocytes in breast cancer according to tumor subtype: Current state of the art. Breast (2017) 35:142–50. doi: 10.1016/j.breast.2017.07.005
78. Kase AM, Copland JA, Tan W. Novel therapeutic strategies for CDK4/6 inhibitors in metastatic castrate-resistant prostate cancer. Onco Targets Ther (2020) 13:10499–513. doi: 10.2147/OTT.S266085
79. Di Zazzo E, Galasso G, Giovannelli P, Di Donato M, Castoria G. Estrogens and their receptors in prostate cancer: therapeutic implications. Front Oncol (2018) 8. doi: 10.3389/fonc.2018.00002
80. Lygirou V, Fasoulakis K, Stroggilos R, Makridakis M, Latosinska A, Frantzi M, et al. Proteomic analysis of prostate cancer FFPE samples reveals markers of disease progression and aggressiveness. Cancers (Basel) (2022) 14(15):3765. doi: 10.3390/cancers14153765
81. Singh D, Deshmukh RK, Das A. SNAI1-mediated transcriptional regulation of epithelial-to-mesenchymal transition genes in breast cancer stem cells. Cell Signal (2021) 87:110151. doi: 10.1016/j.cellsig.2021.110151
82. Kischel P, Waltregny D, Dumont B, Turtoi A, Greffe Y, Kirsch S, et al. Versican overexpression in human breast cancer lesions: Known and new isoforms for stromal tumor targeting. Int J Cancer (2010) 126(3):640–50. doi: 10.1002/ijc.24812
83. Binder MJ, McCoombe S, Williams ED, McCulloch DR, Ward AC. ADAMTS-15 has a tumor suppressor role in prostate cancer. Biomolecules (2020) 10(5):682. doi: 10.3390/biom10050682
84. Oktem G, Sercan O, Guven U, Uslu R, Uysal A, Goksel G, et al. Cancer stem cell differentiation: TGFβ1 and versican may trigger molecules for the organization of tumor spheroids. Oncol Rep (2014) 32(2):641–9. doi: 10.3892/or.2014.3252
85. Cross NA, Chandrasekharan S, Jokonya N, Fowles A, Hamdy FC, Buttle DJ, et al. The expression and regulation of ADAMTS-1, -4, -5, -9, and -15, and TIMP-3 by TGF?1 in prostate cells: relevance to the accumulation of versican. Prostate (2005) 63(3):269–75. doi: 10.1002/pros.20182
86. Planche A, Bacac M, Provero P, Fusco C, Delorenzi M, Stehle JC, et al. Identification of prognostic molecular features in the reactive stroma of human breast and prostate cancer. PloS One (2011) 6(5):e18640. doi: 10.1371/journal.pone.0018640
87. Zhu Z, Wen Y, Xuan C, Chen Q, Xiang Q, Wang J, et al. Identifying the key genes and microRNAs in prostate cancer bone metastasis by bioinformatics analysis. FEBS Open Bio (2020) 10(4):674–88. doi: 10.1002/2211-5463.12805
88. Zi X, Guo Y, Simoneau AR, Hope C, Xie J, Holcombe RF, et al. Expression of Frzb/secreted frizzled-related protein 3, a secreted wnt antagonist, in human androgen-independent prostate cancer PC-3 cells suppresses tumor growth and cellular invasiveness. Cancer Res (2005) 65(21):9762–70. doi: 10.1158/0008-5472.CAN-05-0103
89. Liu Y, Zhou Q, Zhou D, Huang C, Meng X, Li J. Secreted frizzled-related protein 2-mediated cancer events: Friend or foe? Pharmacol Rep (2017) 69(3):403–8. doi: 10.1016/j.pharep.2017.01.001
90. Joesting MS, Perrin S, Elenbaas B, Fawell SE, Rubin JS, Franco OE, et al. Identification of SFRP1 as a candidate mediator of stromal-to-epithelial signaling in prostate cancer. Cancer Res (2005) 65(22):10423–30. doi: 10.1158/0008-5472.CAN-05-0824
91. García-Tobilla P, Solórzano SR, Salido-Guadarrama I, González-Covarrubias V, Morales-Montor G, Díaz-Otañez CE, et al. SFRP1 repression in prostate cancer is triggered by two different epigenetic mechanisms. Gene (2016) 593(2):292–301. doi: 10.1016/j.gene.2016.08.030
92. Kilinc D, Ozdemir O, Ozdemir S, Korgali E, Koksal B, Uslu A, et al. Alterations in promoter methylation status of tumor suppressor HIC1, SFRP2, and DAPK1 genes in prostate carcinomas. DNA Cell Biol (2012) 31(5):826–32. doi: 10.1089/dna.2011.1431
93. Zheng L, Sun D, Fan W, Zhang Z, Li Q, Jiang T. Diagnostic value of SFRP1 as a favorable predictive and prognostic biomarker in patients with prostate cancer. PloS One (2015) 10(2):e0118276. doi: 10.1371/journal.pone.0118276
94. O’Hurley G, Perry AS, O’Grady A, Loftus B, Smyth P, O’Leary JJ, et al. The role of secreted frizzled-related protein 2 expression in prostate cancer. Histopathology (2011) 59(6):1240–8. doi: 10.1111/j.1365-2559.2011.04073.x
95. Perry AS, O’Hurley G, Raheem OA, Brennan K, Wong S, O’Grady A, et al. Gene expression and epigenetic discovery screen reveal methylation of SFRP2 in prostate cancer. Int J Cancer (2013) 132(8):1771–80. doi: 10.1002/ijc.27798
96. Bhati R, Patterson C, Livasy CA, Fan C, Ketelsen D, Hu Z, et al. Molecular characterization of human breast tumor vascular cells. Am J Pathol (2008) 172(5):1381–90. doi: 10.2353/ajpath.2008.070988
97. Huang C, Ye Z, Wan J, Liang J, Liu M, Xu X, et al. Secreted frizzled-related protein 2 is associated with disease progression and poor prognosis in breast cancer. Dis Markers (2019) 2019:1–7. doi: 10.1155/2019/6149381
98. Ganesan S, Mehnert J. Biomarkers for response to immune checkpoint blockade. Annu Rev Cancer Biol (2020) 4:331–51. doi: 10.1146/annurev-cancerbio-030419-
99. Banchereau R, Leng N, Zill O, Sokol E, Liu G, Pavlick D, et al. Molecular determinants of response to PD-L1 blockade across tumor types. Nat Commun (2021) 12(1):3969. doi: 10.1038/s41467-021-24112-w
100. Jayarathna DK, Rentería ME, Malik A, Sauret E, Batra J, Gandhi NS. Integrative transcriptome-wide analyses uncover novel risk-associated microRNAs in hormone-dependent cancers. Front Genet (2021) 12. doi: 10.3389/fgene.2021.716236
Keywords: gene signature, RNA biomarkers, NanoString BC360, biochemical recurrence, CAPRA-S, TCGA-PRAD
Citation: Lautert-Dutra W, Melo CM, Chaves LP, Souza FC, Crozier C, Sundby AE, Woroszchuk E, Saggioro FP, Avante FS, dos Reis RB, Squire JA and Bayani J (2023) Identification of tumor-agnostic biomarkers for predicting prostate cancer progression and biochemical recurrence. Front. Oncol. 13:1280943. doi: 10.3389/fonc.2023.1280943
Received: 21 August 2023; Accepted: 12 October 2023;
Published: 26 October 2023.
Edited by:
Sakthivel Muniyan, University of Nebraska Medical Center, United StatesReviewed by:
Wensheng Zhang, Xavier University of Louisiana, United StatesGiuseppe Schepisi, Scientific Institute of Romagna for the Study and Treatment of Tumors (IRCCS), Italy
Copyright © 2023 Lautert-Dutra, Melo, Chaves, Souza, Crozier, Sundby, Woroszchuk, Saggioro, Avante, dos Reis, Squire and Bayani. This is an open-access article distributed under the terms of the Creative Commons Attribution License (CC BY). The use, distribution or reproduction in other forums is permitted, provided the original author(s) and the copyright owner(s) are credited and that the original publication in this journal is cited, in accordance with accepted academic practice. No use, distribution or reproduction is permitted which does not comply with these terms.
*Correspondence: Jane Bayani, amFuZS5iYXlhbmlAb2ljci5vbi5jYQ==