 Shengxing Feng1†
 Dongsheng Zhou2,3†
 Yueming Li2,3Runqiang Yuan3Jie Kong2,3Feng Jiang2,3Weitian Chen2,3Lijie Zhang2,3
 Mancheng Gong2,3*
- 1Reproductive Center, Maoming People’s Hospital, Maoming, China
- 2The First Clinical School of Medicine, Guangdong Medical University, Zhanjiang, China
- 3Department of Urology, The People’s Hospital of Zhongshan, Zhongshan, China
Objectives: This study aimed to create and validate a radiomics nomogram for non-invasive preoperative Ki-67 expression level prediction in patients with bladder cancer (BCa) using contrast-enhanced CT radiomics features.
Methods: A retrospective analysis of 135 patients was conducted, 79 of whom had high levels of Ki-67 expression and 56 of whom had low levels. For the dimensionality reduction analysis, the best features were chosen using the least absolute shrinkage selection operator and one-way analysis of variance. Then, a radiomics nomogram was created using multiple logistic regression analysis based on radiomics features and clinical independent risk factors. The performance of the model was assessed using the Akaike information criterion (AIC) value, the area under the curve (AUC) value, accuracy, sensitivity, and specificity. The clinical usefulness of the model was assessed using decision curve analysis (DCA).
Results: Finally, to establish a radiomics nomogram, the best 5 features were chosen and integrated with the independent clinical risk factors (T stage) and Rad-score. This radiomics nomogram demonstrated significant correction and discriminating performance in both the training and validation sets, with an AUC of 0.836 and 0.887, respectively. This radiomics nomogram had the lowest AIC value (AIC = 103.16), which was considered to be the best model. When compared to clinical factor model and radiomics signature, DCA demonstrated the more value of the radiomics nomogram.
Conclusion: Enhanced CT-based radiomics nomogram can better predict Ki-67 expression in BCa patients and can be used for prognosis assessment and clinical decision making.
1 Introduction
One of the diseases in the top 10 most prevalent worldwide is bladder cancer (BCa). Approximately 20% of newly diagnosed bladder cancers remain to be muscle-invasive bladder cancer (MIBC), and approximately 50% of patients with MIBC who undergo radical cystectomy (RC) with pelvic lymphadenectomy have distant metastases (1, 2). Despite curative local therapy, 50%–60% of patients with MIBC will continue to experience metastatic progression (3). In addition, BCa has the characteristics of easy recurrence, rapid progression, and easy metastasis (4), which brings great difficulties to our precision and individualized treatment.
All cells in the cycle express the proliferation-associated nuclear antigen Ki-67, with the exception of dormant cells in the g0 phase (5). Ki-67 protein is widely used as a proliferation marker reflecting the number of cells in a tumor (6). According to prior research, increased expression of Ki67 has been linked to a poor outcome for bladder tumors (7), tumor grade, tumor T stage (8), recurrence (9), and lymph node metastasis (10). At the same time, studies have shown that PD-L1 expression is closely related to Ki-67 positivity (11). Patients with non-muscle-invasive bladder cancer receiving intravesical immunotherapy with BCG have a higher risk of progression-free survival (PFS) if their Ki-67 levels are high (12). In conclusion, Ki-67 expression may be a useful indicator of immunotherapy effectiveness and response in BCa, in addition to serving as a reference index for clinical metastatic disease and patient prognosis. In BCa, Ki-67 expression is generally detected by immunohistochemistry in selected cystoscopic biopsies or postoperative specimens from radical surgery. However, because BCa specimens have a variety of tumor types and immunohistochemical detection uses a small sample size, the final Ki-67 expression cannot represent the whole BCa tissue, which limits the accuracy and application of this analysis. In addition, immunohistochemical staining takes 3–5 days, so it is not possible to evaluate Ki-67 index in real time. Therefore, it is crucial to look for a quick, reliable, and comprehensive method of predicting Ki-67 expression in BCa patients.
Radiomics is an image feature extraction technique based on automated algorithms, which can quickly and accurately obtain image information of different regions in a non-invasive manner, and can effectively reflect the heterogeneity of lesions (13, 14). Radiomics technology provides a new idea for quantitative evaluation of tumor heterogeneity and shows great advantages in clinical practice. The pathophysiology of bladder tumors can be evaluated using radiomics with a high degree of accuracy, according to prior studies, including the differentiation of benign and malignant (15), tumor invasion (16, 17) and tumor recurrence (18). In predicting Ki-67 expression in breast cancer (19) and liver cancer (20), radiomics has some advantages. To the best of the knowledge, it is the first the CT-based research that examines to whether radiomics can be employed as a tool to determine the status of Ki-67 expression in BCa. In order to support clinical decision making, we developed and validated a radiomics nomogram to forecast Ki-67 expression in BCa patients.
2 Materials and methods
2.1 Patients
Our workflow is shown in Figure 1. In this retrospective cohort research, between January 2016 and December 2022, patients with BCa who had been diagnosed by pathology at our hospital were gathered. The following criteria were used for inclusion: (1) BCa sufferers who have transurethral resection or radical cystectomy; (2) BCa diagnosed by histopathology and immunohistochemistry and BCa stage shown to correlate with Ki-67 expression; (3) preoperative enhanced CT examination; and (4) complete Ki-67 expression and prognostic data. Among the exclusion criteria were (1) poor or incomplete CT image quality, (2) chemotherapy or radiotherapy prior to CT examination, and (3) lesions with indeterminate boundaries. In the end, all 135 patients were included in the research. A total of 135 patients were randomly assigned to training and validation sets in a 7:3 ratio (21).
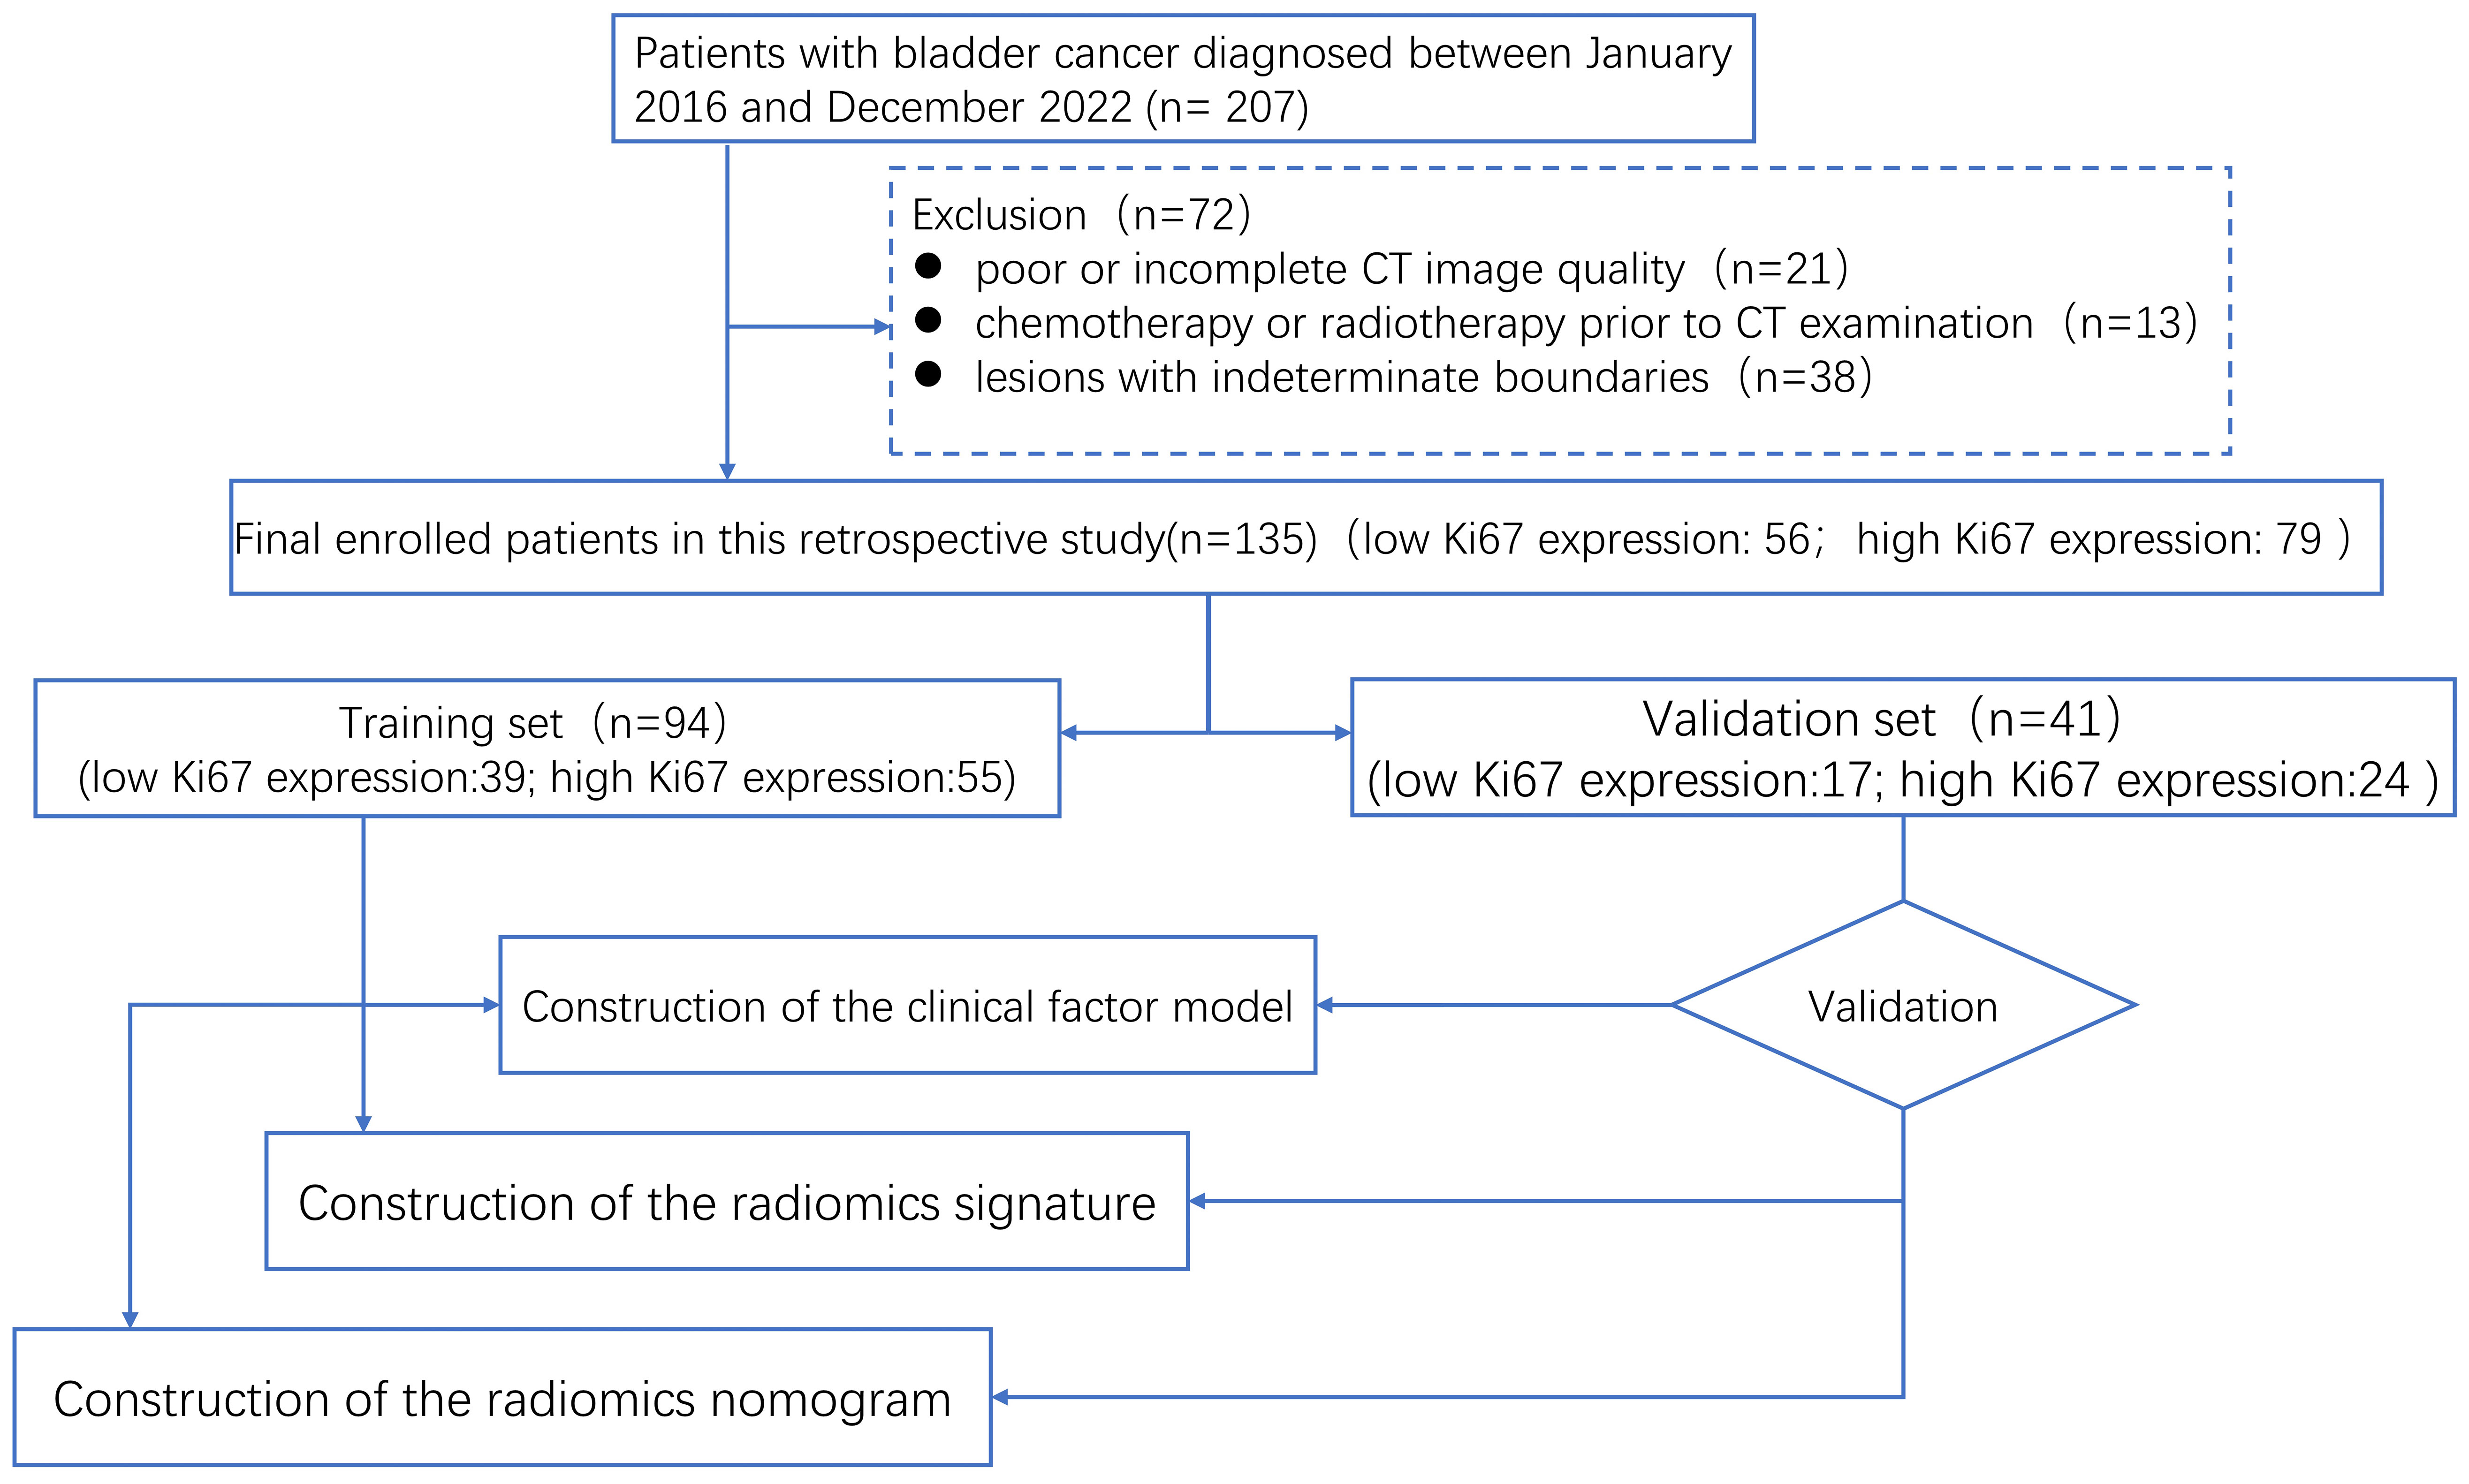
Figure 1 The study flow chart of the study.
2.2 Image acquisition (instruments and methods)
A 256-slice spiral CT-enhanced scan (Brilliance, Philips Healthcare) was performed on all patients. The following device specifications were used: collimation, 64×0.6 mm; tube voltage, 120 kV; automatic modulation of activated tube current; pitch, 0.9; image matrix, 512×512; and slice thickness/slice spacing, 3 mm/3 mm. From the transverse septum to the pelvic floor, patients underwent scans, and iopamidol 100 mL or ioversol 80 mL was intravenously injected, followed by saline 50 mL at a speed of 3 mL/s. At 30, 60, and 300 s following threshold, images of the corticomedullary phase, nephrogram phase, and excretory phase were obtained.
2.3 Evaluation of Ki-67 expression
An expert pathologist evaluated each specimen using immunohistochemistry. The kit’s instructions were followed for doing immunohistochemistry with mouse anti-human Ki-67 monoclonal antibody from Shanghai Gene Technology Co., Ltd. Cells with brown nuclei are considered positive. Positive cells were chosen from the five areas with the highest the positive density, and the portion of positive labeled cells was calculated using a high-power microscope (×400). The Ki-67 index used in this study was the average of the five locations with the highest proportion of Ki-67 labeled cells. According to previous research (7, 22–24), BCa patients were separated into two groups based on their Ki-67 expression levels: high expression (>15% cell staining) and low expression (≤15% cell staining).
2.4 CT image delineation and feature extraction
Before contouring, each and every CT image was resampled to a voxel size of 1×1×1 mm, discretized to grayscale preprocessing, and given a bandwidth of 25. A three-dimensional (3-D) region of interest (ROI) was drawn on the image not more than 1 mm along the lesion margin using 3D slicer software (version: 4.10.2.). A segmentation example is shown in Figure 2. For each patient, 107 picture characteristics in total, including 14 form features, 18 first-order features, and 75 texture features were retrieved. In the end, 1,223 radiomics features were obtained by LoG (σ: 0.5, 1.0, 1.5, and 2.0) and wavelet. About the set of radiology function for more information, please visit https://pyradiomics.readthedocs.io/en/latest/#. Data were then Z-score normalized before further analysis.
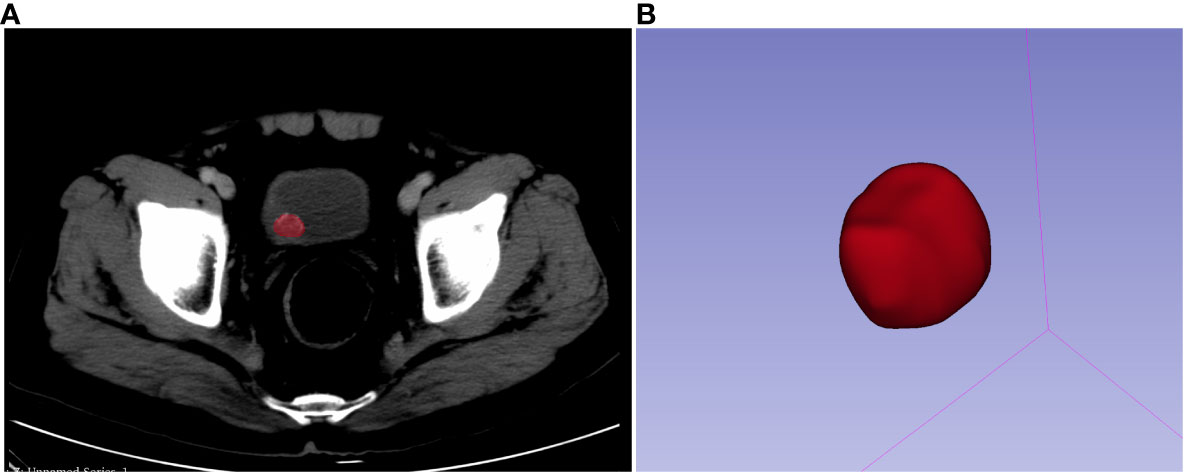
Figure 2 Manual segmentation of the mass (A) and three-dimensional volumetric reconstruction (B).
2.5 Observation of feature consistency
The repeatability of feature extraction was assessed using the inter- and intra-class correlation coefficients (ICCs). Radiologist A and radiologist B selected 20 lesions at random from the training set and delineated them to evaluate the reliability of interobserver features. Radiologist A delineated 20 lesions again 3 weeks later, and the first time that the features were extracted were compared to determine the intra-observer reliability. ICC > 0.75 was considered to have good consistency and stability of the selected features. Radiologist A will delineate the remaining lesions and extract features.
2.6 Feature selection and radiomics signature construction
First, to choose features with significant differences between high and low expression of the Ki-67 index, features with ICC > 0.75 were assessed by one-way analysis of variance (ANOVA). The least absolute shrinkage selection operator (LASSO) regression method was used to further select the key radiomics features with nonzero coefficients, and a 10-fold cross-validation was performed to determine the optimal modulation weights. The final radiomics features were chosen, and their corresponding coefficients were multiplied to create the radiomics score (Rad-score) for each patient, and finally, the radiomics signature was constructed.
2.7 Construction and model validation of radiomics nomogram
Using CT imaging features and clinical features from the training set as clinical variables, univariate and multivariate logistic regression analyses were done to identify independent predictors of Ki-67 expression level in BCa lesions, and a clinical factor model was developed. Then, by integrating Rad-score and clinical independent predictors, a radiomics nomogram was created. The validation set validated each model’s performance. We evaluated the predictive performance of the clinical factor model, radiomics signature, and radiomics nomogram in the training and validation sets based on sensitivity, specificity, accuracy, and area under curve (AUC) values. To compare the variations between them, the Delong test was employed. The Hosmer–Lemeshow test and calibration curve were used to confirm the nomogram model’s consistency. The Akaike information criterion (AIC) was employed to gauge how well the model fit the data. In addition, in order to assess the clinical utility of three models in predicting Ki-67 expression, decision curve analysis (DCA) was performed.
2.8 Statistical analysis
R software 4.2.0 was used to conduct statistical analysis on the data. Fisher’s exact test or chi-square test were used to compare qualitative data, while the t-test or Mann–Whitney U test were used to compare quantitative data, as applicable. The “rms” package was used to construct nomograms and calibration curves. The Hosmer–Lemeshow test is carried out using the “generalhoslem” package. We used “glmnet” for LASSO regression model analysis. We used the “pROC” software to plot the analytical ROC curve. The Delong test was employed to calculate how much the three models’ AUC values varied from one another. We used the software program “DCA.r” to perform DCA. Statistical significance was set at p < 0.05.
3 Results
3.1 Clinicopathological features
After screening, finally, 135 patients were enrolled in this trial; 108 of them were men, and 27 were women. The average age was 66.16 ± 12.67 years, and the average tumor size was 23.53 ± 14.96 mm. Table 1 displays specific clinical information for the groups with low and high Ki-67 expression. Table 2 displays the clinical features information from the training set and validation set. A clinical factor model was created after additional univariate and multivariate logistic regression analyses revealed that only clinical T stage was an independent risk factor for elevated Ki-67 expression (Table 3).
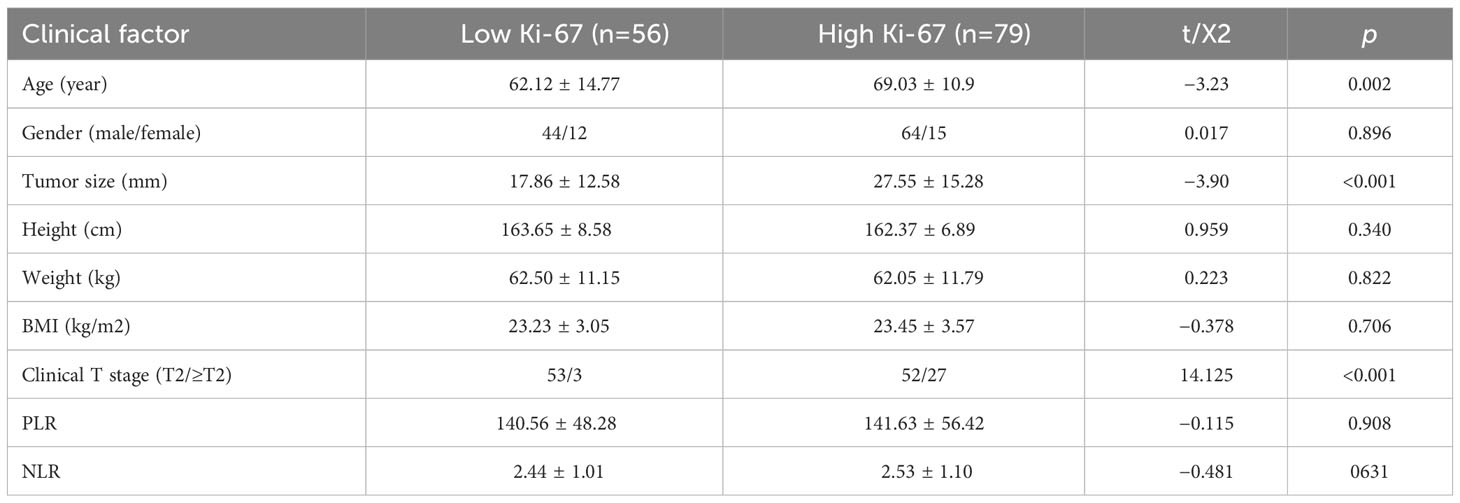
Table 1 Clinical data of bladder cancer patients in low Ki-67 group and high Ki-67 group.
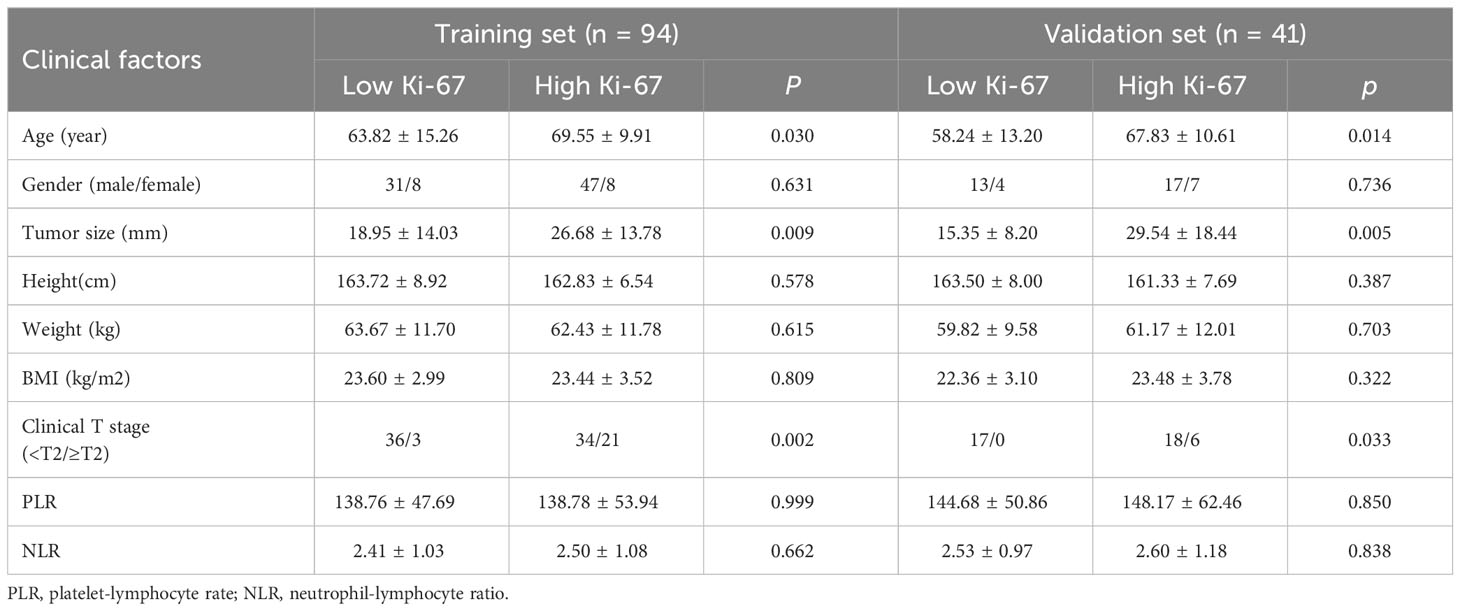
Table 2 The clinical data between low and high Ki-67 group in the training and validation cohorts.

Table 3 Univariate and multivariate logistic regression analysis of the clinical factors.
3.2 Radiomics feature extraction and analysis
From each patient’s CT scans, 1,223 radiomics features were collected, and 20 patients were randomly selected for ICC analyses, and for further investigation, characteristics with high reproducibility and stability (ICC > 0.75) were chosen. Features dimension reduction was performed by one-way ANOVA and LASSO review in turn. Finally, five radiomics features with important discrimination significance were selected (Table 4), and the best adjustment regularization parameter (λ = 0.039) under the minimum standard was found by 10-fold cross-validation (Figure 3) to construct the radiomics signature. This formula was used to determine the Rad-score:
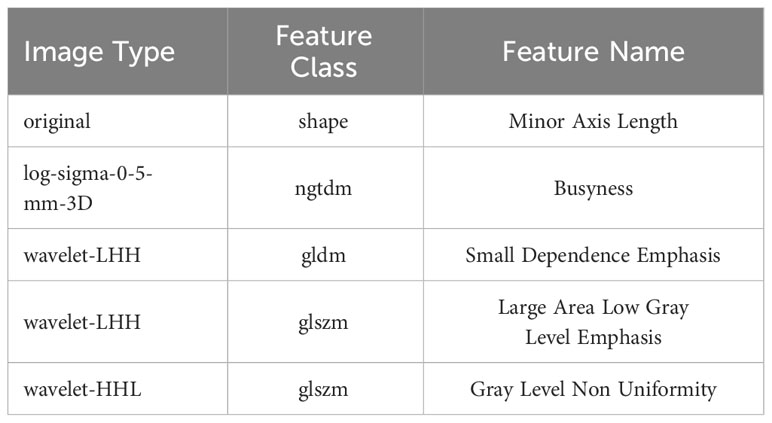
Table 4 List of the selected features with non-zero coefficients.
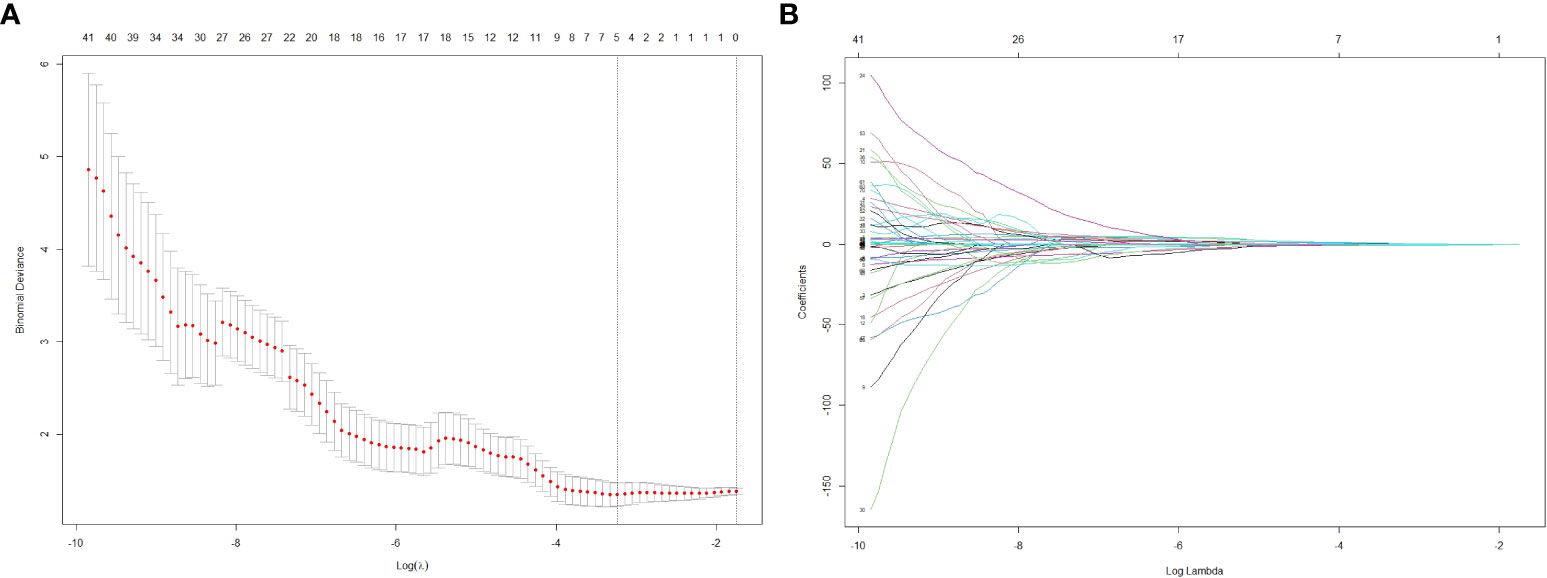
Figure 3 The LASSO regression model was used to select 5 radiomics features with significant discrimination significance. The optimal value of LASSO tuning parameter (λ) is represented by the vertical dashed line. The best adjustment of the regularization parameter λ to 0.039 under the minimum criterion was found by ten-fold cross validation (A). LASSO coefficient profiles of the radiomics features (B).
Rad-score=0.838 + 0.379*original.shape.Minor.Axis.Length+0.044*log-sigma-0-5-mm-3D.ngtdm.Busyness-1.005*wavelet-LHH.gldm.Small Dependence Emphasis-0.139*wavelet-LHH.glszm.Large Area Low Gray Level Emphasis+0.023*wavelet-HHL.glszm.Gray Level Non Uniformity.
As shown in Table 5, the AUC of the radiomics signature in the training and validation sets were 0.821 (95% CI, 0.734–0.908) and 0.877 (95% CI, 0.761, 0.994), respectively.
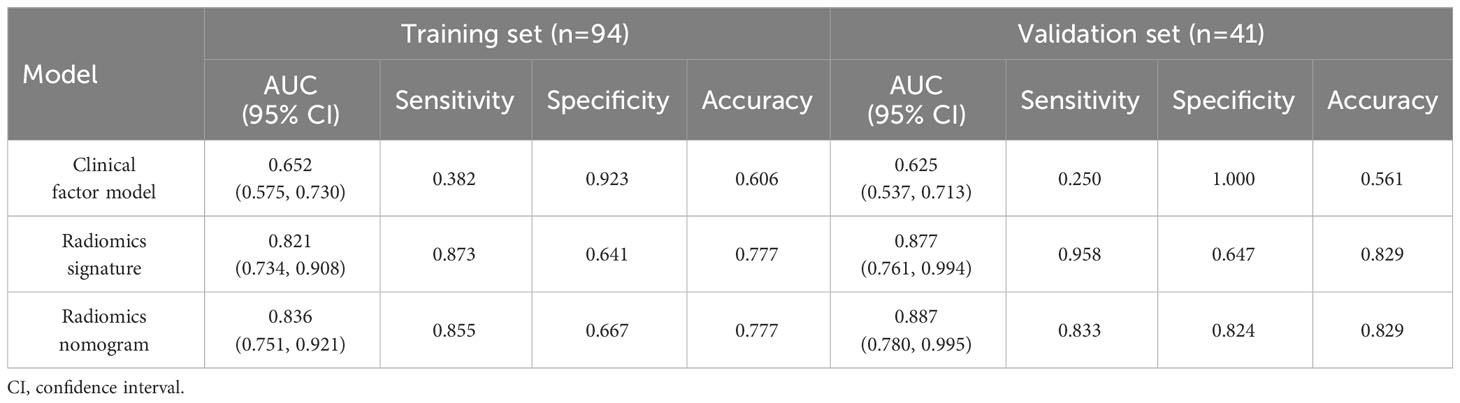
Table 5 Diagnostic performance of the clinical factor model, the radiomics signature, and the radiomics nomogram.
3.3 Construction of a nomogram and evaluation of the efficacy of several models
A radiomics nomogram was created using multivariate logistic regression analysis based on the clinical factor that were determined to be statistically significant (clinical T stage) and the Rad-score (Figure 4A). The calibration curve and Hosmer–Lemeshow test demonstrated strong calibration in both the training set (p = 0.098) and the validation set (p = 0.272) (Figures 4B, C), indicating good agreement between predictions and observations in both sets.
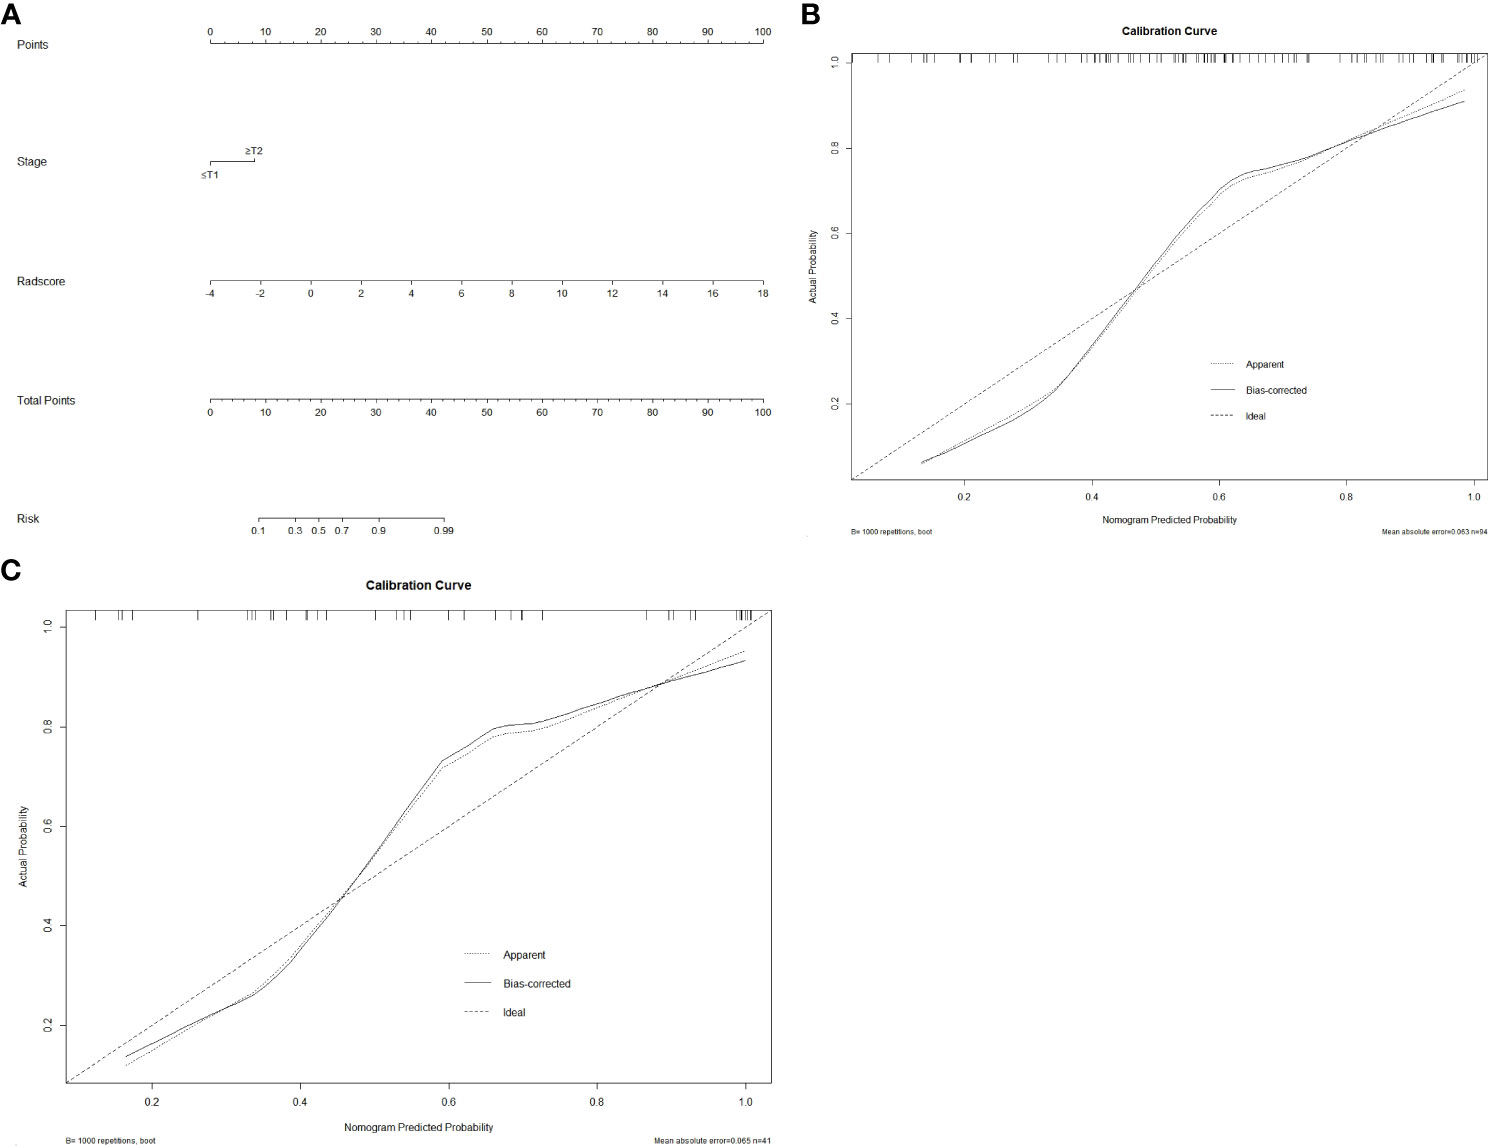
Figure 4 The radiomics nomogram and calibration curves. Based on the identified statistically significant clinical factor (clinical T stage) and Rad-score, a radiomics nomogram was established by multivariate logistic regression analysis (A). Calibration curves of the nomogram in the training (B) and validation (C) sets. The 45° straight line represents the ideal forecast. The closer the two curves are, the higher the accuracy will be.
Table 5 summarizes the prediction performance of the clinical factor model, radiomics signature, and radiomics nomogram on Ki-67 expression level in the training set (AUC = 0.652, 0.821, and 0.836) and validation set (AUC = 0.625, 0.877, and 0.887). Figures 5A, B display the ROC curves for the three models in the training and validation sets. The radiomics nomogram considerably outperformed the clinical factor model in both the training and validation sets (p < 0.001) with a higher AUC. However, the radiomics nomogram and radiomics signature’s AUC values did not differ significantly in the training and validation sets (p = 0.6123, 0.3047). When comparing radiomics signature with clinical factor model, radiomics signature had a higher AUC in the training and validation sets than the clinical factor model (p = 0.0038, 0.0002). The following formula was used to determine the Nomo-score:
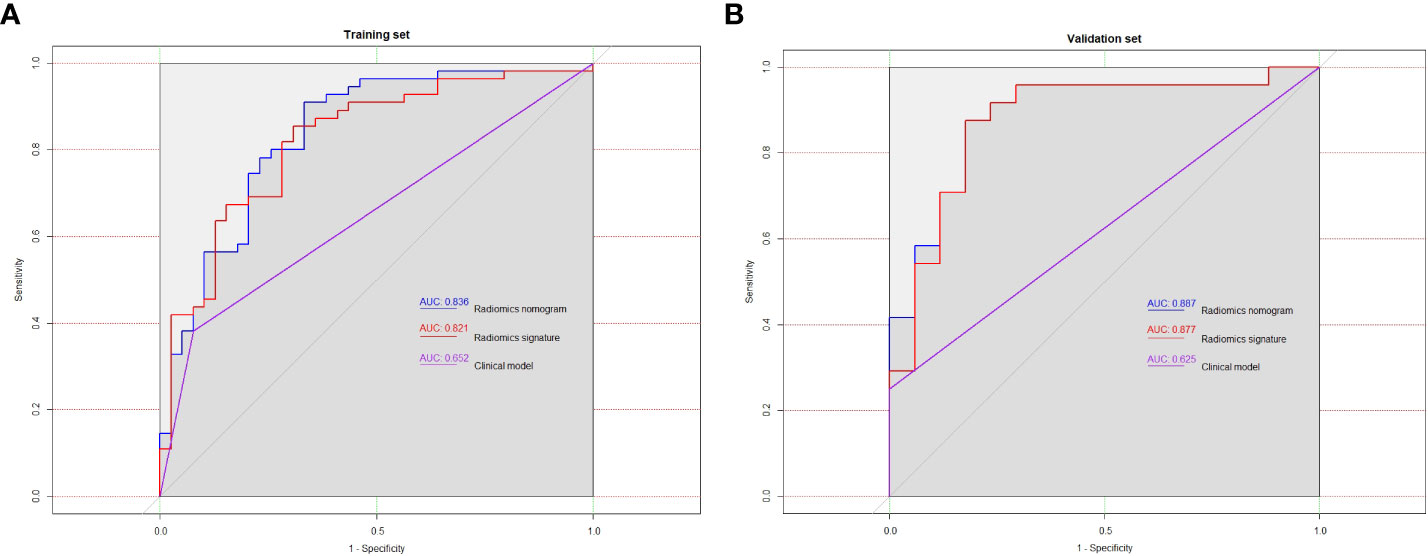
Figure 5 In training set (A) and validation set (B), the ROC curves of the three models were plotted, respectively.
Meanwhile, in comparison to the clinical factors model (AIC = 119.07) and the radiomics signature (AIC = 107.51), the radiomics nomogram (AIC = 103.16), which had the smallest AIC value, was deemed to be the most effective model. The three models in the training set’s clinical utility were evaluated using DCA (Figure 6). Compared to the clinical factor model or the radiomics signature, the radiomics nomogram was better at predicting the levels of Ki-67 expression and offered higher net benefit over a broader spectrum of risk thresholds.
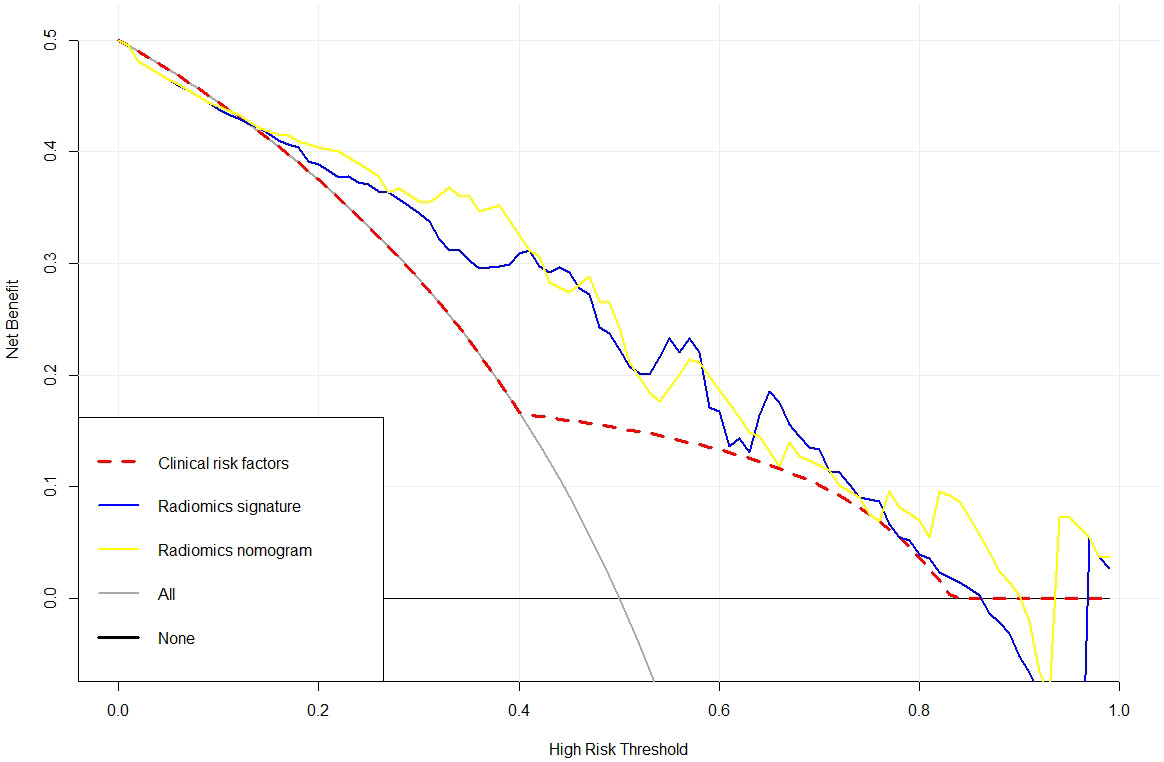
Figure 6 An analysis of decision curves for three models.
4 Discussion
In our research project, a radiomics nomogram based on enhanced CT was created and affirmed for non-invasive prediction of Ki-67 protein level in BCa. It includes clinical factor (clinical T stage) and Rad-score. Comparing the radiomics nomogram to the clinical factor model or the radiomics signature, the radiomics nomogram enhanced the prediction of Ki-67 protein level. In both the training and validation sets, the established radiomics nomogram demonstrated good discriminatory practices (AUC = 0.836 and 0.887). To the best of our knowledge, this is the first study to predict Ki-67 expression status in bladder cancer based on CT radiomics nomogram. The results showed that the radiomics nomogram showed good accuracy and practicality in predicting the expression level of Ki-67 protein, which may have potential application value for clinical decision making of BCa.
Ki-67 protein is a nuclear protein with proliferative activity found in tumors at many stages of cell, with the exception of quiescent cells in the g0 phase (25). Previous research has revealed that the high expression of Ki-67 may be associated with the malignant degree, invasive behavior, cell proliferation activity, immunotherapy, and poor prognosis of BCa. In a study by Wang et al., 313 patients with non-muscle invasive BCa were collected and analyzed, and the Ki-67 marker index was correlated with the pathological grade, clinical stage, tumor size, and number of BCa (6). In a study by Rubino et al., in which 130 patients with MIBC were analyzed based on the construction of tissue microarrays, regression modeling findings indicated that elevated expression of Ki-67 was closely connected with positive PD-L1 expression, from which it can be concluded that elevated expression of Ki-67 may be connected with immunotherapy for BCa. In addition, the regression model results showed that elevated expression of Ki-67 was strongly connected with poorer overall survival (11). By collecting 213 patients with papillary BCa, March-Villalba et al. revealed that the Ki-67 index improves the prediction of recurrence and PFS in papillary BCa (23). Similarly, Liu et al. showed that elevated expression of Ki-67 predicted bad prognosis in BCa patients by collecting 84 patients who underwent surgery (26). Culpan et al. included 101 patients with primary BCa, and the results suggested that, in pT1 BCa patients, the biomarker Ki-67 significantly predicted recurrence-free, progression-free, and cancer-specific survival (27).
CT is currently a common and important method for diagnosing BCa. In recent years, radiomics, as an emerging and popular medical clinical aid and diagnostic technique, can obtain radiomics features from a large number of medical imaging images to identify tumor heterogeneity (28) and can obtain quantitative information on tumor lesion size, shape, texture, and heterogeneity beyond visual assessment to filter the most valuable radiomics features of interest and construct predictive models (29). Previously, the viability and efficiency of radiomics in preoperative prediction of Ki-67 expression in malignancies have been shown in a variety of research. By collecting 339 patients with gastrointestinal stromal tumor (GIST) from four centers, Zhang et al. concluded that the radiomics features of CT were significantly connected with the levels of Ki-67 in GIST, and the AUC of external verification was as high as 0.784 (30). The levels of Ki-67 were predicted using the CT radiomics nomogram by Zheng et al. after collecting 217 patients with head and neck squamous cell carcinoma. The model demonstrated good prediction effect with AUC of 0.919 (31). Bao et al., with 206 lung adenocarcinoma patients, built a radiomics nomogram to forecast Ki-67 proliferation index; AUC is 0.91 (32).
Nevertheless, to the authors’ understanding, this research is the only study so far to investigate whether CT radiomics can be applied as an instrument to estimate the Ki-67 expression state in BCa patients. As in research, we developed and validated a radiomics nomogram stem from enhanced CT to forecast Ki-67 expression index on BCa patients. In this study, we sketched a 3D ROI, which is more comprehensive and provides a better understanding of tumor heterogeneity compared to 2D (33). In addition, we extract features by wavelet, which are not available from conventional texture analysis. We acquired a large number of the most valuable radiomics features from CT images and added clinical characteristics predictive factors for risk to build radiomics nomogram. Our study showed that the radiomics nomogram could well predict the expression of Ki-67 in BCa patients.
Additionally, this research has several drawbacks. First off, this was a retrospective study with some selection bias in enrolled patients. Furthermore, this research’s number of participants was somewhat limited, and there was no external validation. As a result, additional validation efforts involving larger samples, external validation, and multicenter investigations are required. Third, this study did not explore the expression of Ki-67 in various clinical subtypes; future research may examine this issue more.
5 Conclusion
To sum up, this radiomics nomogram incorporating pathological with radiomics features showed good forecasting accuracy and clinical application for forecasting Ki-67 expression levels in BCa patients. As a non-invasive method, it can provide important support for personalized treatment and prognosis evaluation of patients with BCa.
Data availability statement
The raw data supporting the conclusions of this article will be made available by the authors, without undue reservation.
Ethics statement
The studies involving humans were approved by The Ethics Committee of Zhongshan City People’s Hospital (approval code: 2023-012). The studies were conducted in accordance with the local legislation and institutional requirements. The requirement for informed consent was waived due to the retrospective nature of the study.
Author contributions
MG: Supervision, Writing – review & editing. SF: Conceptualization, Data curation, Methodology, Software, Writing – original draft. DZ: Conceptualization, Investigation, Methodology, Software, Visualization, Writing – original draft. YL: Writing – review & editing. RY: Writing – review & editing. JK: Investigation, Visualization, Writing – original draft. FJ: Data curation, Writing – original draft. WC: Software, Validation, Writing – original draft. LZ: Software, Validation, Writing – original draft.
Funding
The author(s) declare that no financial support was received for the research, authorship, and/or publication of this article.
Conflict of interest
The authors declare that the research was conducted in the absence of any commercial or financial relationships that could be construed as a potential conflict of interest.
Publisher’s note
All claims expressed in this article are solely those of the authors and do not necessarily represent those of their affiliated organizations, or those of the publisher, the editors and the reviewers. Any product that may be evaluated in this article, or claim that may be made by its manufacturer, is not guaranteed or endorsed by the publisher.
References
1. Stein J-P, Lieskovsky G, Cote R, Groshen S, Feng A-C, Boyd S, et al. Radical cystectomy in the treatment of invasive bladder cancer: long-term results in 1,054 patients. J Clin oncology: Off J Am Soc Clin Oncol. (2001) 3):666–75. doi: 10.1200/JCO.2001.19.3.666
2. Yafi FA, Aprikian AG, Chin JL, Fradet Y, Izawa J, Estey E, et al. Contemporary outcomes of 2287 patients with bladder cancer who were treated with radical cystectomy: a Canadian multicentre experience. Bju Int. (2011) 108:539–45. doi: 10.1111/j.1464-410X.2010.09912.x
3. Margulis V, Shariat SF, Ashfaq R, Sagalowsky AI, Lotan Y. Ki-67 is an independent predictor of bladder cancer outcome in patients treated with radical cystectomy for organ-confined disease. Clin Cancer Research: an Off J Am Assoc Cancer Res. (2006) 24):7369–73. doi: 10.1158/1078-0432.CCR-06-1472
4. Bellmunt J, Petrylak DP. New therapeutic challenges in advanced bladder cancer. Semin Oncol. (2012) 39:598–607. doi: 10.1053/j.seminoncol.2012.08.007
5. Scholzen T, Gerdes J. The Ki-67 protein: from the known and the unknown. J Cell Physiol. (2000) 3):311–22. doi: 10.1002/(SICI)1097-4652(200003)182:3<311::AID-JCP1>3.0.CO;2-9
6. Wang L, Feng C, Ding G, Ding Q, Zhou Z, Jiang H, et al. Ki67 and TP53 expressions predict recurrence of non-muscle-invasive bladder cancer. Tumour Biology: J Int Soc Oncodevelopmental Biol Med. (2013) 35:2989–95. doi: 10.1007/s13277-013-1384-9
7. Geelvink M, Babmorad A, Maurer A, Stöhr R, Grimm T, Bach C, et al. Diagnostic and prognostic implications of FGFR3high/Ki67high papillary bladder cancers. Int J Mol Sci. (2018) 19:2548. doi: 10.3390/ijms19092548
8. Wang L, Zhou M, Feng C, Gao P, Ding G, Zhou Z, et al. Prognostic value of Ki67 and p63 expressions in bladder cancer patients who underwent radical cystectomy. Int Urol Nephrology. (2016) 48:495–501. doi: 10.1007/s11255-015-1197-4
9. Stec R, Cierniak S, Lubas A, Brzóskowska U, Syryło T, Zieliński H, et al. Intensity of nuclear staining for Ki-67, p53 and survivin as a new prognostic factor in non-muscle invasive bladder cancer. Pathol Oncol Research: Por. (2019) 26:1211–9. doi: 10.1007/s12253-019-00678-1
10. Margulis V, Lotan Y, Karakiewicz PI, Fradet Y, Ashfaq R, Capitanio U, et al. Multi-institutional validation of the predictive value of Ki-67 labeling index in patients with urinary bladder cancer. J Natl Cancer Institute. (2009) 101:114–9. doi: 10.1093/jnci/djn451
11. Rubino S, Kim Y, Zhou J, Dhilon J, Li R, Spiess P, et al. Positive Ki-67 and PD-L1 expression in post-neoadjuvant chemotherapy muscle-invasive bladder cancer is associated with shorter overall survival: a retrospective study. World J Urology. (2020) 39:1539–47. doi: 10.1007/s00345-020-03342-5
12. He Y, Wang N, Zhou X, Wang J, Ding Z, Chen X, et al. Prognostic value of Ki67 in BCG-treated non-muscle invasive bladder cancer: a meta-analysis and systematic review. BMJ Open. (2018) 8:e019635. doi: 10.1136/bmjopen-2017-019635
13. Mayerhoefer ME, Materka A, Langs G, Häggström I, Szczypiński P, Gibbs P, et al. Introduction to radiomics. J Nucl Medicine: Off Publication Soc Nucl Med. (2020) 61:488–95. doi: 10.2967/jnumed.118.222893
14. Liu Z, Wang S, Dong D, Wei J, Fang C, Zhou X, et al. The applications of radiomics in precision diagnosis and treatment of oncology: opportunities and challenges. Theranostics. (2019) 9:1303–22. doi: 10.7150/thno.30309
15. Sarkar S, Min K, Ikram W, Tatton RW, Riaz IB, Silva AC, et al. Performing automatic identification and staging of urothelial carcinoma in bladder cancer patients using a hybrid deep-machine learning approach. Cancers. (2023) 15:1673. doi: 10.3390/cancers15061673
16. Kozikowski M, Suarez-ibarrola R, Osiecki R, Bilski K, Gratzke C, Shariat SF, et al. Role of radiomics in the prediction of muscle-invasive bladder cancer: A systematic review and meta-analysis. Eur Urol Focus. (2021) 8:728–38. doi: 10.1016/j.euf.2021.05.005
17. Zhang G, Wu Z, Zhang X, Xu L, Mao L, Li X, et al. CT-based radiomics to predict muscle invasion in bladder cancer. Eur Radiology. (2022) 32:3260–8. doi: 10.1007/s00330-021-08426-3
18. Qian J, Yang L, Hu S, Gu S, Ye J, Li Z, et al. Feasibility study on predicting recurrence risk of bladder cancer based on radiomics features of multiphase CT images. Front Oncol. (2022) 12:899897. doi: 10.3389/fonc.2022.899897
19. Wu C, Chen J, Fan Y, Zhao M, He X, Wei Y, et al. Nomogram based on CT radiomics features combined with clinical factors to predict Ki-67 expression in hepatocellular carcinoma. Front Oncol. (2022) 12:943942. doi: 10.3389/fonc.2022.943942
20. Zhu Y, Dou Y, Qin L, Wang H, Wen Z. Prediction of Ki-67 of invasive ductal breast cancer based on ultrasound radiomics nomogram. J Ultrasound Medicine: Off J Am Institute Ultrasound Med. (2022) 42:649–64. doi: 10.1002/jum.16061
21. Jinfeng C, Li Li, Ning L, Wenhong H, Yinjun D, Fengchang Y, et al. Model integrating CT-based radiomics and genomics for survival prediction in esophageal cancer patients receiving definitive chemoradiotherapy. biomark Res. (2023) 1:44. doi: 10.1186/s40364-023-00480-x
22. Burger M, Denzinger S, Hartmann A, Wieland W, Stoehr R, Obermann EC. Mcm2 predicts recurrence hazard in stage Ta/T1 bladder cancer more accurately than CK20, Ki67 and histological grade. Brit J Cancer (2007) 96(11):1711–5. doi: 10.1038/sj.bjc.6603784
23. March-villalba JA, Ramos-soler D, Soriano-sarrió P, Hervás-marín D, Martínez-garcía L, Martínez-jabaloyas JM. Immunohistochemical expression of Ki-67, Cyclin D1, p16INK4a, and Survivin as a predictive tool for recurrence and progression-free survival in papillary urothelial bladder cancer pTa/pT1 G2 (WHO 1973). Urologic Oncol. (2018) 37:158–65. doi: 10.1016/j.urolonc.2018.10.005
24. Zheng Z, Gu Z, Xu F, Maskey N, He Y, Yan Y, et al. Magnetic resonance imaging-based radiomics signature for preoperative prediction of Ki67 expression in bladder cancer. Cancer Imaging: Off Publ Int Cancer Imaging Society. (2021) 21:65. doi: 10.1186/s40644-021-00433-3
25. Li LT, Jiang G, Chen Q, Zheng JN. Ki67 is a promising molecular target in the diagnosis of cancer (Review). Mol Med Rep. (2014) 11:1566–72. doi: 10.3892/mmr.2014.2914
26. Liu J, Ma C, Li X, Li A, Wang Z. Circulating tumor cells correlating with Ki-67 predicts the prognosis of bladder cancer patients. Int Urol Nephrology. (2022) 55:309–18. doi: 10.1007/s11255-022-03406-y
27. Culpan M, Turan T, Ozkanli SS, Zenginkinet T, Kazan O, Ucar T, et al. Prognostic and clinicopathologic value of Ki-67 and profilin 1 immunohistochemical expression in primary pT1 urothelial bladder cancer. J Cancer Res Ther. (2021) 17:434–42. doi: 10.4103/jcrt.JCRT_408_19
28. Lambin P, Rios-velazquez E, Leijenaar R, Carvalho S, Stiphout RGPMV, Granton P, et al. Radiomics: Extracting more information from medical images using advanced feature analysis. Eur J Cancer (oxford England: 1990). (2012) 48:441–6. doi: 10.1016/j.ejca.2011.11.036
29. Gillies RJ, Kinahan PE, Hricak H. Radiomics: images are more than pictures, they are data. Radiology. (2015) 278:563–77. doi: 10.1148/radiol.2015151169
30. Zhang Q, Gao Y, Zhang R, Zhou X, Chen S, Zhang Y, et al. Personalized CT-based radiomics nomogram preoperative predicting Ki-67 expression in gastrointestinal stromal tumors: a multicenter development and validation cohort. Clin Trans Med. (2020) 9:12. doi: 10.1186/s40169-020-0263-4
31. Zheng Y, Chen J, Zhang M, Wu Z, Tang G, Zhang Y, et al. CT radiomics nomogram for prediction of the Ki-67 index in head and neck squamous cell carcinoma. Eur Radiology. (2022) 33:2160–70. doi: 10.1007/s00330-022-09168-6
32. Bao J, Liu Y, Ping X, Zha X, Hu S, Hu C. Preoperative Ki-67 proliferation index prediction with a radiomics nomogram in stage T1a-b lung adenocarcinoma. Eur J Radiology. (2022) 155:110437. doi: 10.1016/j.ejrad.2022.110437
Keywords: bladder cancer, Ki-67, radiomics, nomogram, computed tomography (CT)
Citation: Feng S, Zhou D, Li Y, Yuan R, Kong J, Jiang F, Chen W, Zhang L and Gong M (2024) Prediction of Ki-67 expression in bladder cancer based on CT radiomics nomogram. Front. Oncol. 14:1276526. doi: 10.3389/fonc.2024.1276526
Received: 12 August 2023; Accepted: 25 January 2024;
Published: 28 February 2024.
Edited by:
Pinuccia Faviana, University of Pisa, ItalyReviewed by:
Mengli Huang, Jinan University, ChinaMieszko Kozikowski, St. Anne’s Hospital EMC, Poland
Copyright © 2024 Feng, Zhou, Li, Yuan, Kong, Jiang, Chen, Zhang and Gong. This is an open-access article distributed under the terms of the Creative Commons Attribution License (CC BY). The use, distribution or reproduction in other forums is permitted, provided the original author(s) and the copyright owner(s) are credited and that the original publication in this journal is cited, in accordance with accepted academic practice. No use, distribution or reproduction is permitted which does not comply with these terms.
*Correspondence: Mancheng Gong, Z29uZ21hbmNoZW5nQDEyNi5jb20=
†These authors have contributed equally to this work and share first authorship