 Majid Janani1†
 Amirhoushang Poorkhani2†Taghi Amiriani2Ghazaleh Donyadideh3Farahnazsadat Ahmadi2Yalda Jorjanisorkhankalateh2Fereshteh Beheshti-Nia4Zahra Kalaei5Morad Roudbaraki6Mahsa Soltani1Vahid Khori2†
 Ali Mohammad Alizadeh1,5*†
- 1Breast Disease Research Center, Cancer Institute, Tehran University of Medical Sciences, Tehran, Iran
- 2Ischemic Disorders Research Center, Golestan University of Medical Sciences, Gorgan, Iran
- 3Metabolic Syndrome Research Center, School of Medicine, Mashhad University of Medical Sciences, Mashhad, Iran
- 4Department of Epidemiology and Biostatistics, School of Public Health, Isfahan University of Medical Sciences, Isfahan, Iran
- 5Cancer Research Center, Cancer Institute, Tehran University of Medical Sciences, Tehran, Iran
- 6Laboratory of Cell Physiology, Inserm U1003, University of Lille, Villeneuve d’Ascq, France
Introduction: Fibroblast activation protein-α (FAP-α) is a vital surface marker of cancer-associated fibroblasts, and its high expression is associated with a higher tumor grade and metastasis. A systematic review and a meta-analysis were performed to associate future metastasis with FAP-α expression in cancer.
Methods: In our meta-analysis, relevant studies published before 20 February 2024 were systematically searched through online databases that included PubMed, Scopus, and Web of Science. The association between FAP-α expression and metastasis, including distant metastasis, lymph node metastasis, blood vessel invasion, vascular invasion, and neural invasion, was evaluated. A pooled odds ratio (OR) with 95% confidence intervals (CI) was reported as the measure of association.
Results: A total of 28meta-analysis. The random-effects model for five parameters showed that a high FAP-α expression was associated with blood vessel invasion (OR: 3.04, 95% CI: 1.54–5.99, I2 = 63%, P = 0.001), lymphovascular invasion (OR: 3.56, 95% CI: 2.14–5.93, I2 = 0.00%, P < 0.001), lymph node metastasis (OR: 2.73, 95% CI: 1.96–3.81, I2 = 65%, P < 0.001), and distant metastasis (OR: 2.59; 95% CI: 1.16–5.79, I2 = 81%, P < 0.001). However, our analysis showed no statistically significant association between high FAP-α expression and neural invasion (OR: 1.57, 95% CI: 0.84–2.93, I2 = 38%, P = 0.161).
Conclusions: This meta-analysis indicated that cancer cells with a high FAP-α expression have a higher risk of metastasis than those with a low FAP-α expression. These findings support the potential importance of FAP-α as a biomarker for cancer metastasis prediction.
1 Introduction
Metastasis is the process by which cancer cells escape from the primary tumor location and colonize distant tissues. It is responsible for more than 90% of cancer deaths, making it a worthwhile goal in cancer therapy (1). The mechanisms leading to the multistep processes, from local invasion at the primary site to metastatic expansion at the secondary site, remain obscure. It has become apparent that the tumor microenvironment (TME) can play a dynamic role in modulating the motility and hostility of cancer cells in metastatic tissues (2). In this respect, TME can involve the extracellular matrix and basement membrane, endothelial cells, cancer-associated fibroblasts (CAFs), neuroendocrine cells, and signaling pathway molecules that regulate tumor development and metastasis (2). CAFs are the most common tumor stromal cells in TEM homeostasis. Studies have reported different origins or predecessors of CAFs, including resident tissue fibroblasts, bone marrow-derived mesenchymal stem cells, hematopoietic stem cells, and endothelial cells. It is possible to distinguish different subtypes of CAFs based on certain stromal markers, such as fibroblast activation protein-α (FAP-α), integrin β1, and α-smooth muscle actin (3). Among these, FAP-α, or seprase, is a vital surface marker belonging to prolyl-specific serine proteases (4). It is not detectable in healthy adult tissues outside of tissue remodeling or wound healing areas. FAP-α is highly expressed on the surface of CAFs surrounding epithelial cancer cells, including breast, colon, ovarian, pancreas, lung, etc. (5). The functions of FAP are mostly associated with its enzymatic activity. This can help tumor cells invade surrounding tissues, penetrate blood vessel walls, and travel to distant tissues (3). Accordingly, a high FAP-α expression can predict poor survival rates, for example, in oral squamous cell carcinoma, gastric cancer, and pancreatic cancer (4). Hence, we conducted a systematic review and meta-analysis of the available data regarding the FAP-α association with cancer metastasis.
2 Methods
2.1 Literature search strategies
The present study was performed based on the Preferred Reporting Items for Systematic Reviews and Meta-analyses (PRISMA) (6). Related studies with FAP-α and metastasis published before 20 February 2024 in PubMed, Scopus, and Web of Science were systematically included. The FAP-α keywords included “fibroblast activation protein” or “seprase” or “surface-expressed protease” or “FAPalpha” or “FAP-α” or “fibroblast proliferation factor” or “fibroblast-activating factor” or “FAP protein”, and the metastasis keywords were “metastasis” or “neoplasm metastases” or “metastase” or “lymph node metastasis” or “lymph node metastases” or “metastasis, lymph node” or “lymphatic metastases” or “nervous tissue neoplasms” or “nerve tissue neoplasms” or “blood vessel invasion”. Additional relevant searches were performed through a manual search of qualified study references to find relevant studies that linked FAP expression and metastasis.
2.2 Inclusion and exclusion criteria
The following outcomes were considered for the inclusion criteria (1): studies investigating FAP expression in cancer (2); studies published in English (3); studies related to human samples including human participants, body tissue samples, or human cell lines; and (4) necessary data supplied to the computation of the odds ratio (OR) with a 95% confidence interval (CI). Moreover, the exclusion criteria were as follows (1): duplicate articles (2); reviews and meta-analyses; and (3) studies that investigated only expression in the animal model.
2.3 Publication quality assessment
We evaluated the quality of the studies by employing the Quality Assessment Tool for Observational Cohort and Cross-Sectional Studies from the National Heart, Lung, and Blood Institute (NHLBI), National Institutes of Health (NIH) (7), which is suitable for risk of bias assessment of cohort and case–control studies (8). This is a standardized and structured tool consisting of 14 criteria that include aim description (item 1), study population description (item 2), participation rate (item 3), homogeneity of study population (item 4), sample size and power (item 5), exposure measurement (item 6), adequate timeframe (item 7), varied exposure levels (item 8), clear exposure measures (item 9), repeated exposure assessment (item 10), clear outcome measures (item 11), blinding of outcome assessors (item 12), loss to follow-up (item 13), and adjustment for confounding variables (item 14). Each criterion is assigned a binary score of 0 (absence) or 1 (presence), with additional codes for CD (cannot be determined), NA (not applicable), or NR (not reported). Two authors independently evaluated the included articles. Any disagreements were also resolved through a discussion involving all authors.
2.4 Data extraction
During the initial screening phase, the titles and abstracts of all collected articles were thoroughly examined to identify pertinent studies. In the subsequent screening phase, the authors extracted data from the selected studies using standard data collection forms. Before a final decision, controversial topics were discussed and compared with a third author’s opinion. Information was obtained from each study in the same format. This included the name of the first author, year of publication, country of origin, tumor type, sample size, FAP-α expression level, and OR as a measure of association. In some studies where ORs were not reported, the extracted data were analyzed to estimate ORs and 95% CIs. This was done using the OR calculation spreadsheet developed by Tierney et al. (2007) (9).
2.5 Statistical analysis
STATA Version 17.0 (College Station, Texas, USA) was used for all statistical analyses. The researchers employed the Restricted Maximum Likelihood (REML) method to calculate the pooled OR and their respective 95% CI. The primary objective was to investigate the association between FAP-α expression and cancer metastasis. The analyses were two-tailed, and statistical significance was considered at a P-value less than 0.05.
The heterogeneity of the article results was examined using the Higgins I-squared (I2) statistic.
Categorizing the heterogeneity results was carried out as follows: I2 < 25% indicated no heterogeneity, I2 = 25%–50% indicated moderate heterogeneity, I2 = 50%–75% indicated large heterogeneity, and I2 > 75% indicated extreme heterogeneity. In statistical analysis, when studies exhibit no heterogeneity, the fixed-effect model is conventionally employed. However, heterogeneous results were handled using the random-effects model. In addition, heterogeneity between subgroups was evaluated by subgroup analysis. To assess potential publication bias, a funnel plot was also created. Begg’s rank correlation and Egger’s linear regression tests were employed to quantify publication bias (10, 11). If significant publication bias was detected, a trim-and-fill analysis was conducted to evaluate the potential impact of this bias (12).
3 Results
3.1 Study and patient characteristics
Figure 1 shows that 4,358 articles were included in this systematic review, of which 281 were duplicates. After assessing the titles, abstracts, and keywords, 3,391 articles were excluded due to unrelated patient populations, exposures, or outcomes. Additionally, 686 articles that initially met the inclusion criteria were reassessed, and 28 articles (4, 13–39) were finally included in this meta-analysis. Table 1 shows the articles published between 2007 and 2023. Among the studies conducted to determine the association between FAP-α and metastasis, 13 studies were conducted in China (4, 17, 20, 26, 27, 29, 31–36, 38), three studies in Japan (22–24), three studies in South Korea (21, 25, 30), two studies in Spain (16, 19), and seven studies in seven countries such as Sweden (15), Switzerland (18), France (14), Egypt (13), USA (37), Germany (39), and Belgium (28). The majority of the included studies were designed as cohorts, and the most common methods used for FAP-α detection were immunohistochemistry and Western blotting. The median sample size of the included studies was 113 individuals (ranging from 42 to 440). Additionally, information about the patients (cancer type), the cutoff value for FAP-α, sample size, gender proportion, mean age, and proportion of individuals with a high FAP-α level are presented in Table 1.
Figure 1 Flowchart of the selection process of studies under the guidelines outlined by the preferred reporting items for Systematic Reviews and Meta-analyses.
Table 1 Characteristics of the articles included in the study.
3.2 Quality assessment
The quality assessment of the included studies showed a mean score of 11.07, with the highest score being 12 and the lowest score being 10. Considering that the maximum score possible on the checklist was 14, the findings suggest that the overall quality of the studies was within the range of fair to acceptable quality (Table 2).
Table 2 Quality assessment of the included studies.
3.3 Blood vessel invasion
In total, seven studies involving 597 patients were conducted to evaluate blood vessel invasion. The pooled OR indicated that patients with high FAP levels had 3.04 times higher odds of blood vessel invasion than patients with low FAP levels (OR: 3.04, 95% CI: 1.54–5.99, I2 = 63%, P = 0.001). The funnel plot for blood vessel invasion is shown in Figure 2. The Beggs (P = 0.230) and Egger (P = 0.104) tests showed no significant evidence of publication bias.
Figure 2 (A) Forest plot of studies evaluating the association between fibroblast activation protein-α (FAP-α) expression and blood vessel invasion. (B) Funnel plot of publication bias for comparing FAP-α expression with blood vessel invasion. VI, blood vessel invasion.
3.4 Lymphovascular invasion
In total, four studies involving 283 patients were conducted to evaluate lymphovascular invasion. The pooled OR indicated that patients with high FAP levels had 3.56 times higher odds of lymphovascular invasion than patients with low FAP levels (OR: 3.56, 95% CI: 2.14–5.93, I2 = 0.00%, P < 0.001). The funnel plot for lymphovascular invasion is shown in Figure 3. In addition, the Beggs (P = 0.999) and the Egger (P = 0.606) tests showed no significant evidence of publication bias.
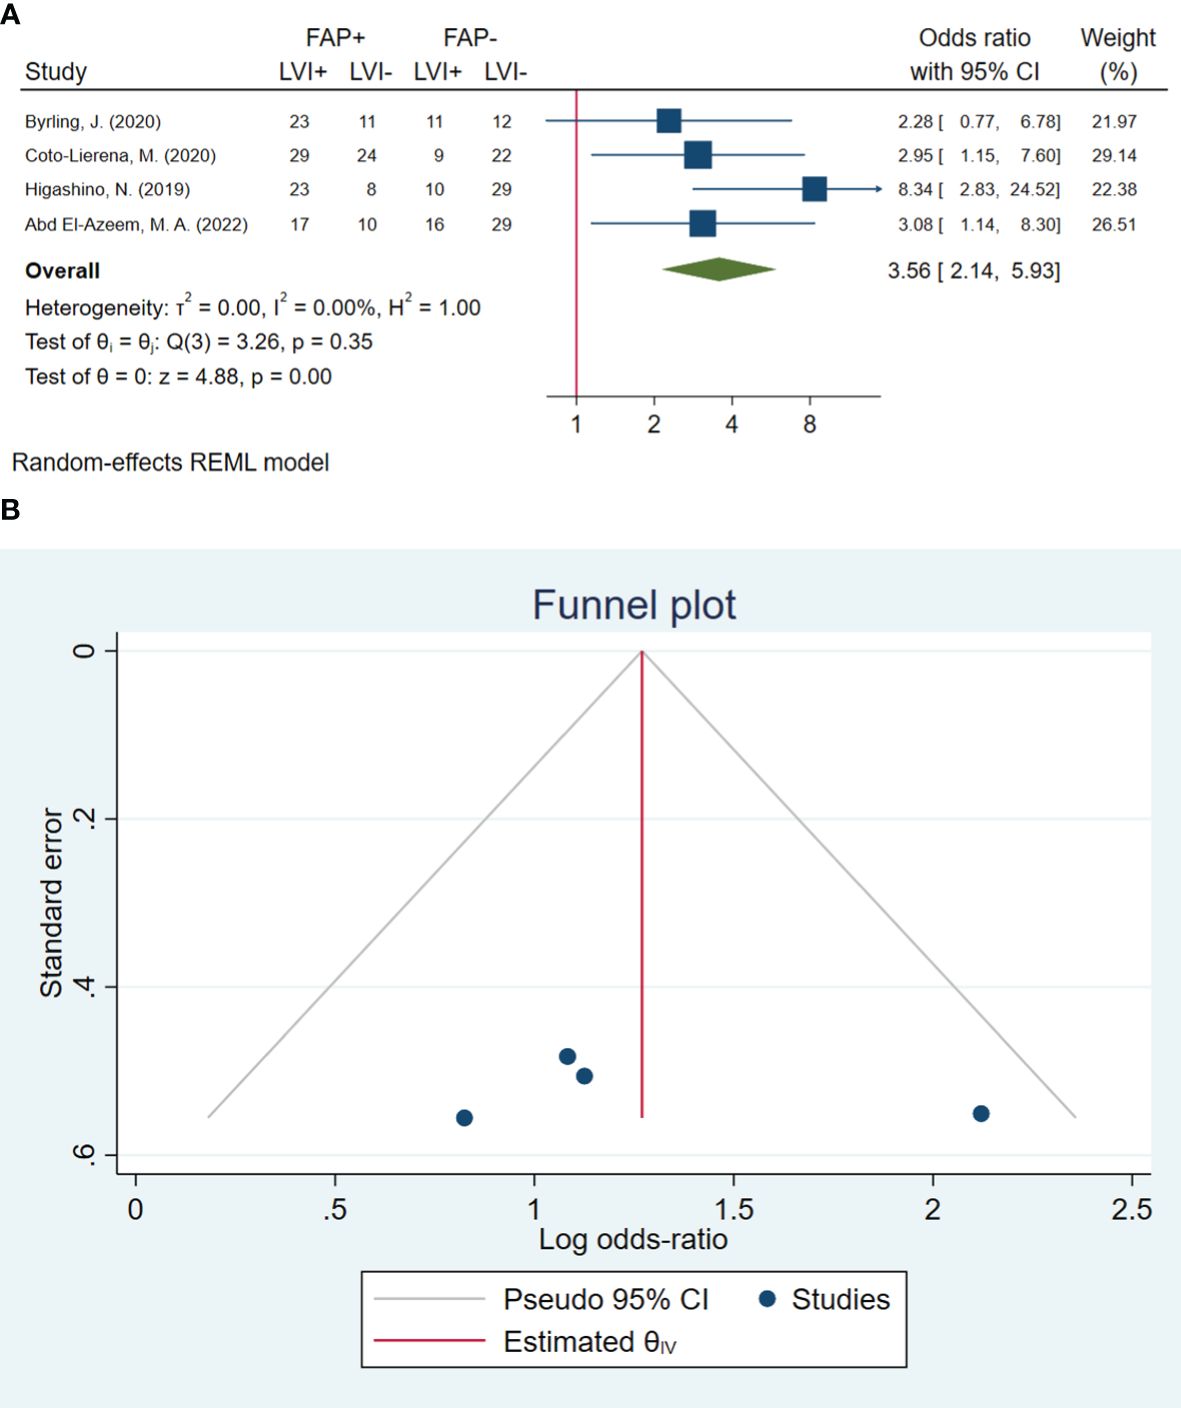
Figure 3 (A) Forest plot of studies evaluating the association between fibroblast activation protein-α (FAP-α) expression and lymphovascular invasion. (B) Funnel plot of publication bias for comparing FAP-α expression with lymphovascular invasion. LVI, lymphovascular invasion.
3.5 Lymph node metastasis
In total, 24 studies involving 2,536 patients were conducted to evaluate lymph node metastasis. The pooled OR indicated that patients with high FAP levels had 2.73 times higher odds of lymph node metastasis than patients with low FAP levels (OR: 2.73, 95% CI: 1.96–3.81, I2 = 65%, P < 0.001). The funnel plot for lymphovascular invasion is shown in Figure 4. In addition, the Beggs (P = 0.309) and the Egger (P = 0.249) tests showed no significant evidence of publication bias.
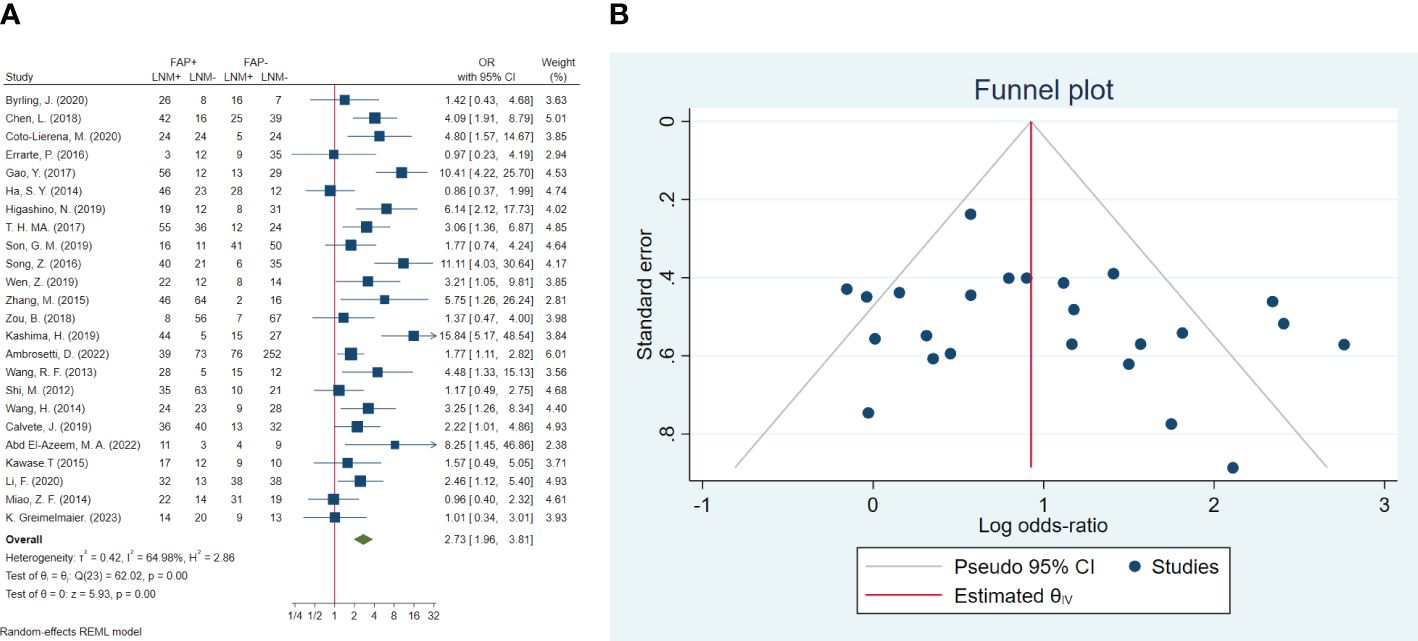
Figure 4 (A) Forest plot of studies evaluating the association between fibroblast activation protein-α (FAP-α) expression and risk of lymph node metastasis. (B) Funnel plot of publication bias for comparing FAP-α expression with lymph node metastasis. LNM, lymph node metastasis.
3.6 Distant metastasis
In total, 13 studies included 1,499 patients in assessing distant metastasis. The pooled OR showed that the odds of having distant metastasis in patients with high FAP were 2.59 times higher than in patients with low FAP (OR: 2.59; 95% CI: 1.16–5.79, I2 = 81%, P < 0.001). The statistical results of the Beggs (P = 0.127) and Egger (P = 0.071) tests showed non-significant publication bias, as illustrated in Figure 5.
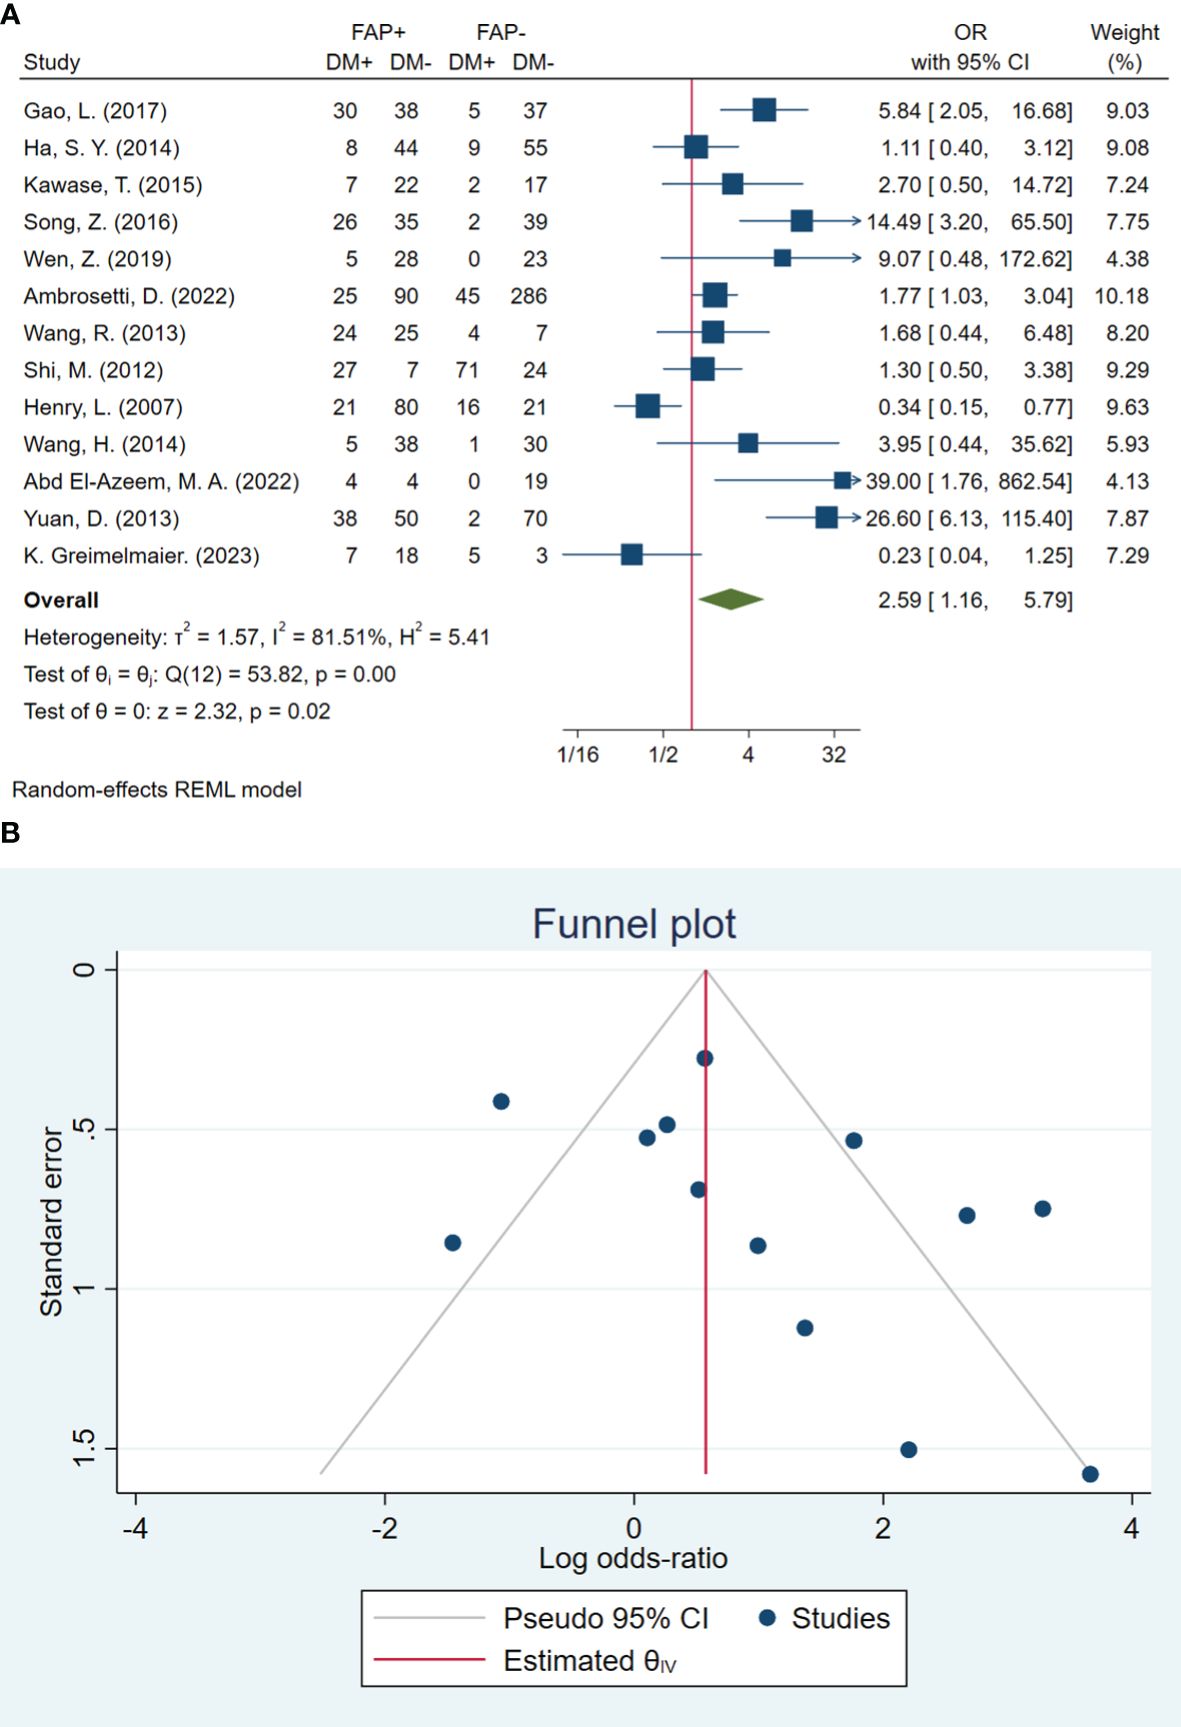
Figure 5 (A) Forest plot of studies evaluating the association between fibroblast activation protein-α (FAP-α) expression and distant metastasis (B). Funnel plot of publication bias for comparing FAP-α expression and distant metastasis. DM, distant metastasis.
3.7 Neural invasion
In total, four studies involving 395 patients were conducted to evaluate neural invasion. The pooled OR indicated that patients with high FAP-α levels had 1.57 times higher odds of neural invasion than patients with low FAP-α levels (OR: 1.57, 95% CI: 0.84–2.93, I2 = 38%, P = 0.161). The funnel plot of neural invasion is shown in Figure 6. The Beggs (P = 0.734) and Egger (P = 0.490) tests showed no significant evidence of publication bias.
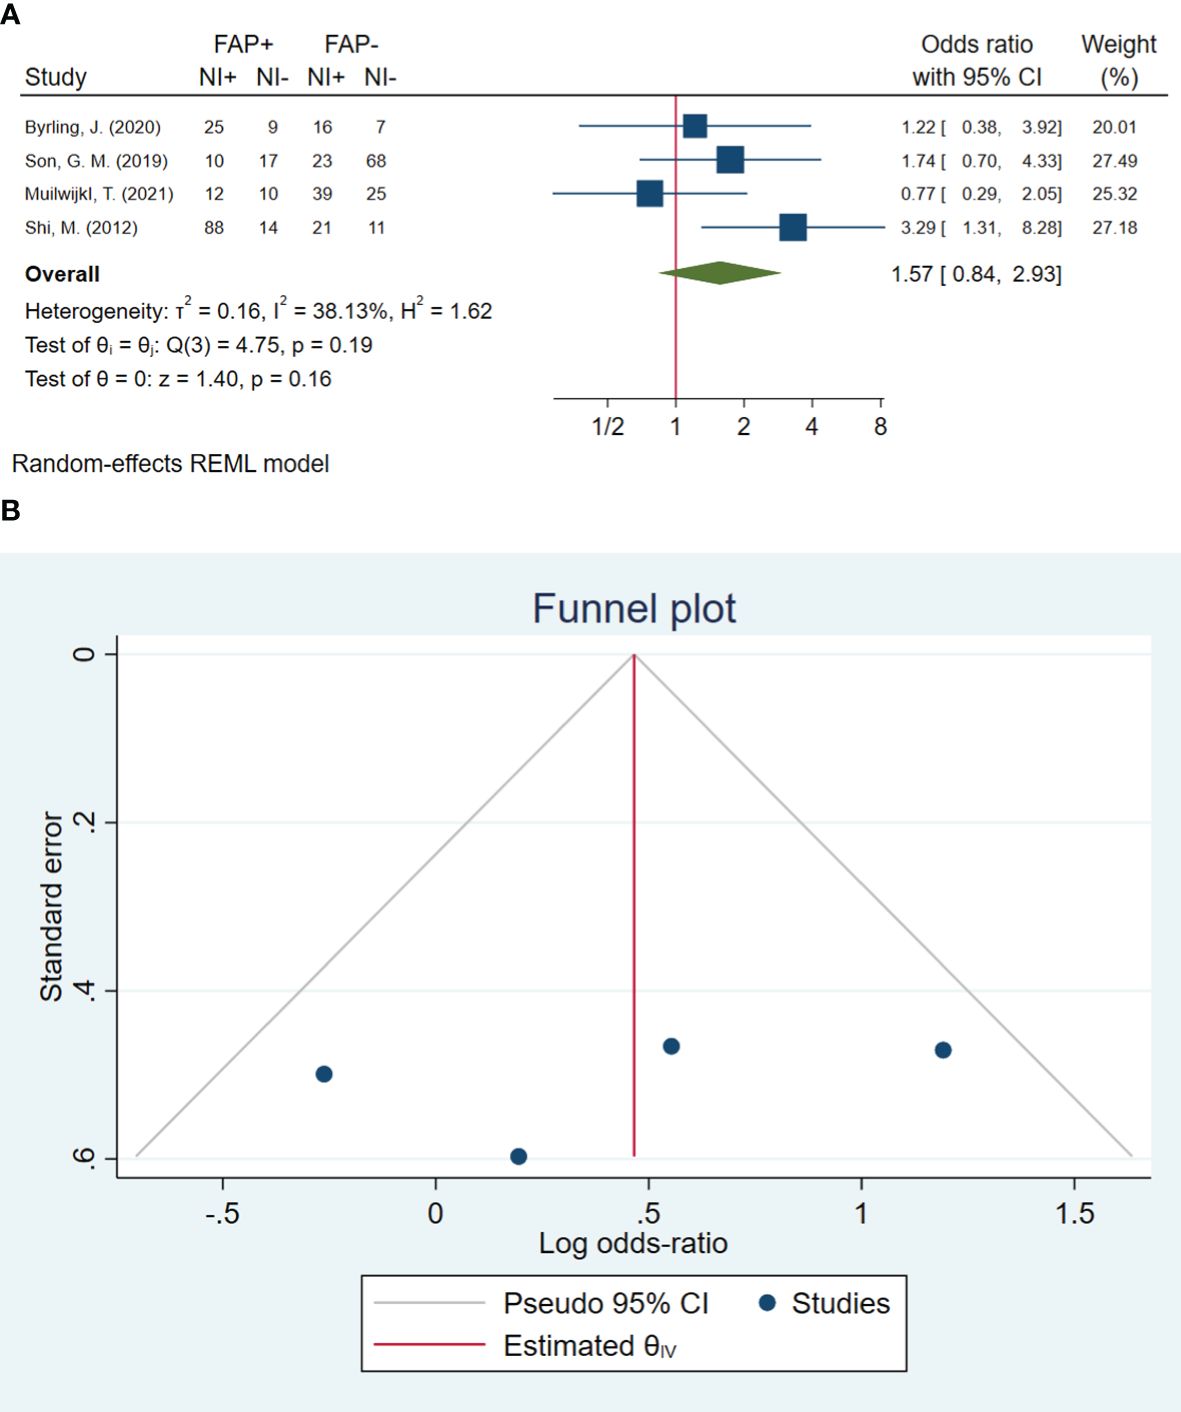
Figure 6 (A) Forest plot of studies evaluating the association between fibroblast activation protein-α (FAP-α) expression and neural invasion (B). Funnel plot of publication bias for comparing FAP-α expression with neural invasion. NI, neural invasion.
3.8 Subgroup analysis
Subgroup analysis was conducted for blood vessel invasion, lymph node metastasis, and distant metastasis, which showed significant heterogeneity in the results (Table 3). This analysis was conducted based on total sample size, high-FAP/low-FAP ratio, FAP cutoff method, cancer type, and FAP detection method subgroups. The results of the subgroup analysis showed non-significant differences from the total sample size (P = 0.261), high-FAP/low-FAP ratio (P = 0.675), and FAP cutoff method (P = 0.845) subgroups of blood vessel invasion. However, we were unable to conduct the subgroup analysis of cancer type and FAP detection method with blood vessel invasion since all of the studies were carried out on gastrointestinal (GI) cancer patients and determined by the immunohistochemistry method (Table 3).
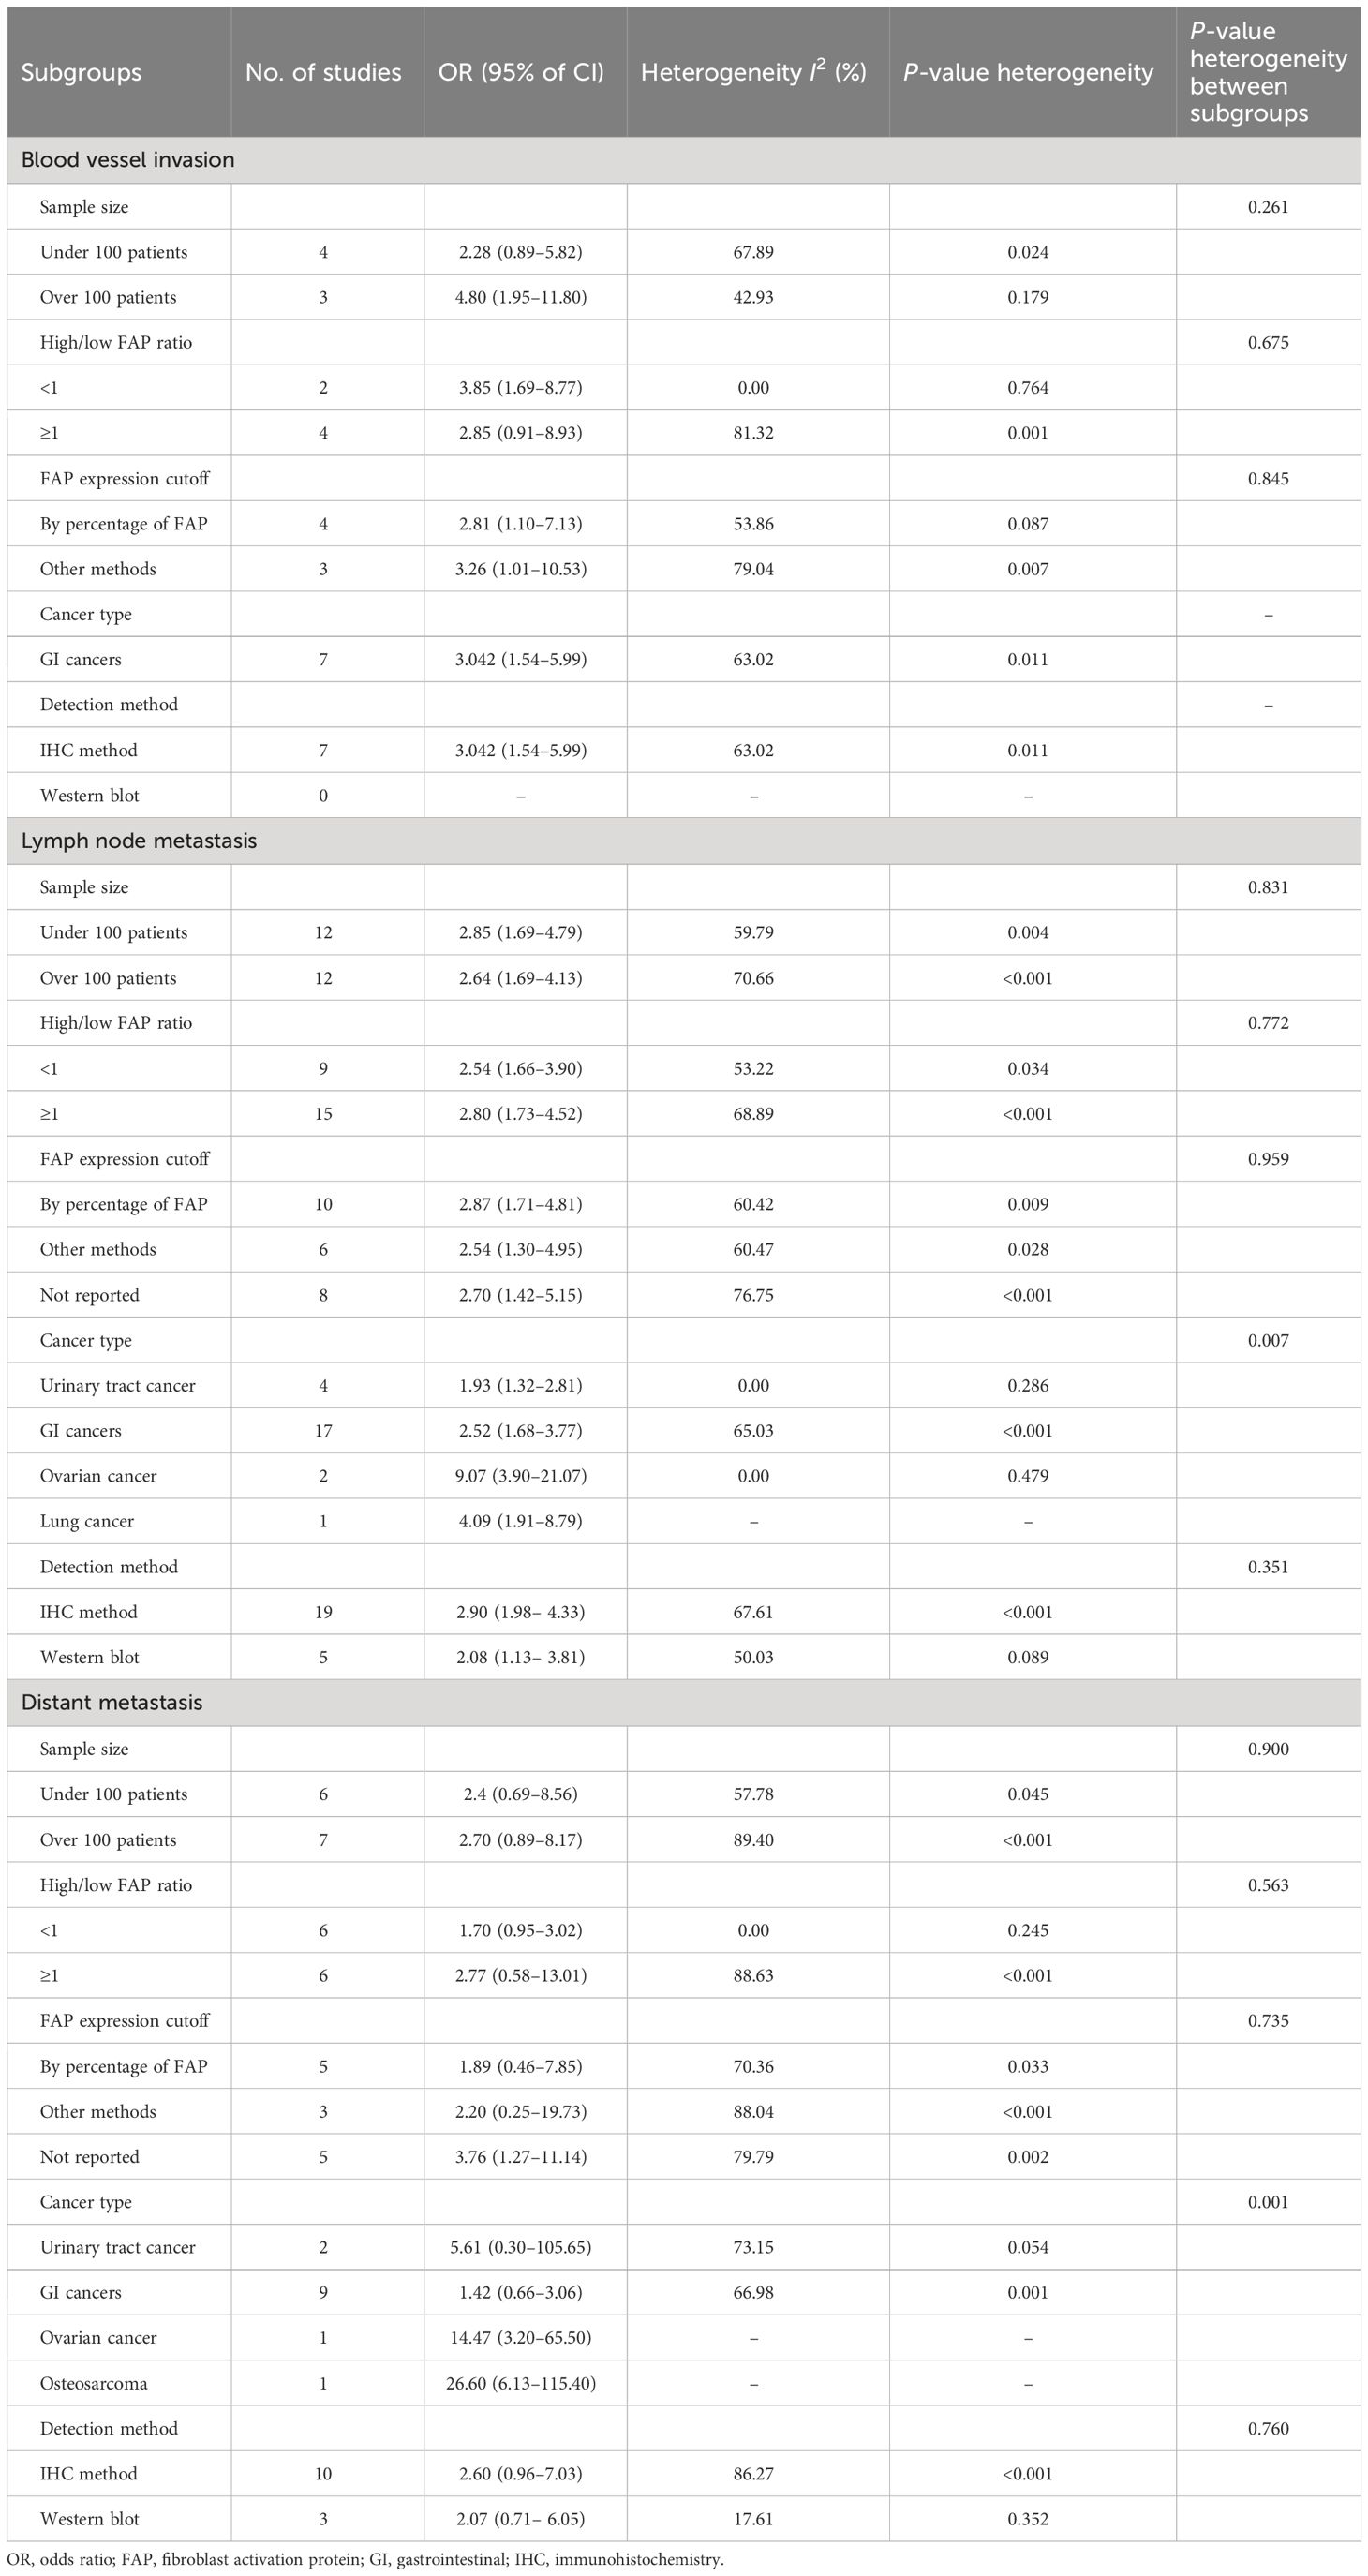
Table 3 Subgroup analysis of outcomes with heterogeneity, including blood vessel invasion, lymph node metastasis, and distant metastasis.
Additionally, the results of the subgroup analysis showed non-significant subgroup effects of study sample size (P = 0.831), ratio of high-FAP/low-FAP (P = 0.772), FAP cutoff method (P = 0.959), and FAP detection method (P = 0.351) on lymph node metastasis. However, a significant difference was observed between cancer-type subgroups (P = 0.007). The cancer type significantly modified the FAP effects on lymph node metastasis. High-FAP ovarian cancer patients (OR: 9.07, 95% CI: 3.90–21.07), lung cancer patients (OR: 4.09, 95% CI: 1.91–8.79), and GI cancer patients (OR: 2.52, 95% CI: 1.68–3.77) had higher odds of lymph node metastasis compared to patients with urinary tract cancer. Furthermore, heterogeneity was detected among studies conducted on GI cancer patients (I2 = 65.03%, P < 0.001) (Table 3).
Furthermore, the results of the subgroup analysis showed a non-significant subgroup effect, including sample size (P = 0.900), ratio of high-FAP/low-FAP (P = 0.563), FAP cutoff method (P = 0.735), and FAP detection method (P = 0.760) on distant metastasis. Similarly to lymph node metastasis, the test revealed a significant difference between cancer-type subgroups (P < 0.001). In other words, patients with high FAP and osteosarcoma cancer 26.60 (95% CI: 6.13–115.40), ovarian cancer 14.47 (95% CI: 3.20–65.50), and urinary tract cancer 5.61 (95% CI: 0.30–105.65) had higher odds of distant metastasis compared to patients with high FAP and GI cancer 1.42 (95% CI: 0.66–3.06). Additionally, the results showed heterogeneity among studies conducted in GI cancer patients (I2 = 66.98%, P = 0.001) (Table 3).
4 Discussion
Our results revealed a significant association between FAP-α expression and cancer metastasis. FAP-α expression increases vascular invasion, lymphovascular invasion, lymph node metastasis, and distant metastasis in various cancers. In addition, our subgroup analysis of blood vessel invasion, lymph node metastasis, and distant metastasis showed substantial heterogeneity. This highlights the complex role of FAP expression in cancer progression. The sample size, the ratio of high to low FAP, and the FAP cutoff method had no significant impact on blood vessel invasion, lymph node metastasis, or distant metastasis. As a result, cancer type was a significant modifier, particularly for distant metastases and lymph node metastases. There was a significant increase in lymph node metastasis for ovarian, lung, and GI cancers. In addition, there was a significant increase in distant metastases in osteosarcoma, ovarian, and urinary tract cancers. This was coupled with the considerable heterogeneity observed in GI cancer studies. These findings show that FAP expression affects cancer metastasis significantly, depending on the type of cancer. More diverse research is needed to determine the effect of FAP on cancer metastasis in different cancer types.
Previous studies showed that FAP-α overexpression was seen not only in malignant cells but also in stromal fibroblasts (32). In this setting, the FAP-α deficiency has an essential role in tumor inhibition, contributing to tumor angiogenesis reduction and altered ECM remodeling (40). In addition, FAP-α expression through CAF activation causes cancer growth and metastasis (24). Consistent with our meta-analysis results, a positive correlation of FAP-α expression with lymphatic vessel density in squamous cell carcinoma of the lung was reported (17). In this respect, there is a direct association between high FAP-α expression, increased tumor grade, and poor survival rates (41). Unlike normal tissues, the expression and abundance of stromal FAP-α in esophageal squamous cell carcinoma (ESCC) are shown (4). It seems that FAP-α can act as a biomarker in cancer development because of the significant correlation between FAP-α expression in primary tumors and their corresponding local and distant metastases (42). In other words, it has been shown that high FAP-α intensity plays a crucial role in the prognosis of non-small lung cancer associated with negligible anticipation in multivariable analysis (43, 44). Moreover, FAP-α expression results in the lymphatic invasion of colorectal tumors (45, 46). All the same, there was a positive correlation between FAP-α expression at both locations and lymph metastases. In this respect, FAP-α was found to be expressed in CAFs that penetrated lymph nodes, which can be a sign of fibroblast activation related to cancer cell migration (47). Moreover, higher FAP-α levels correlate with higher tumor size and lymphovascular invasion. The present findings confirm the potential practicality of FAP-α as a biomarker of cancer progression. However, further studies will be necessary to understand the role of FAP-α in cross-communication between TME cells from primary and metastatic tumors. A novel group of positron emission tracers was introduced in 2018 (48, 49). They summarized the evidence gathered to date from patients and discussed its possible implications for radiotherapy planning. Since metastasis represents a major problem in cancer, the importance of such studies will benefit the design of more effective diagnostic, prognostic, and therapeutic approaches.
4.1 Limitations and clinical applications
Our study has several limitations that need to be considered. First, some outcomes had moderate to high heterogeneity. This may affect the pooled estimates’ reliability. Second, all studies reported the value of FAP in patients as a categorized variable, which potentially causes boundary effect bias. Furthermore, variations in measurement methods for FAP-α expression could introduce inconsistency in the results. The design of the included studies was mainly cohorts, and exposure was measured once, so it is critical to be cautious when attributing causality to these associations. Finally, the search was limited to studies published in English, which may introduce language bias. Therefore, further studies are necessary to assess the association between FAP-α expression and metastasis.
Clinical applications recommend assessing FAP expression in screening and risk assessment protocols. It seems that identifying individuals with elevated FAP-α expression levels can facilitate the development of personalized treatment strategies, which may include more intensive therapeutic approaches or increased surveillance. Additionally, a high FAP-α expression can prove to be a valuable tool as a prognostic marker, emphasizing the necessity for enhanced follow-up and continuous monitoring in individuals exhibiting this characteristic.
5 Conclusion
In summary, this meta-analysis indicated that cancer cells with high FAP-α overexpression have a higher risk of metastasis than those with low FAP-α expression. These findings support the potential importance of FAP-α as a biomarker for cancer metastasis prediction.
Data availability statement
The original contributions presented in the study are included in the article/supplementary material. Further inquiries can be directed to the corresponding authors.
Author contributions
MJ: Data curation, Methodology, Software, Writing – original draft, Writing – review & editing. AP: Data curation, Formal analysis, Methodology, Writing – original draft. TA: Data curation, Software, Writing – original draft. GD: Data curation, Formal analysis, Writing – original draft. FA: Data curation, Formal analysis, Writing – original draft. YJ: Data curation, Formal analysis, Writing – original draft. FB-N: Data curation, Formal analysis, Software, Writing – original draft. ZK: Data curation, Funding acquisition, Writing – original draft. MR: Writing – original draft, Writing – review & editing. MS: Writing – original draft, Writing – review & editing. VK: Formal Analysis, Funding acquisition, Writing – original draft. AA: Data curation, Formal analysis, Project administration, Supervision, Validation, Writing – original draft, Writing – review & editing.
Funding
The author(s) declare that financial support was received for the research, authorship, and/or publication of this article. Elite Researcher Grant Committee supported the research reported in this publication under grant number no. 4021141 from the National Institute for Medical Research and Development (NIMAD), Tehran, Iran. In addition, this study was funded by the Tehran University of Medical Sciences (Grant Number: 56025). None of the funding sources had any role in the study design, data collection, analysis, and interpretation, or the decision to submit the article for publication.
Conflict of interest
The authors declare that the research was conducted in the absence of any commercial or financial relationship that could be construed as a potential conflict of interest.
Publisher’s note
All claims expressed in this article are solely those of the authors and do not necessarily represent those of their affiliated organizations, or those of the publisher, the editors and the reviewers. Any product that may be evaluated in this article, or claim that may be made by its manufacturer, is not guaranteed or endorsed by the publisher.
References
1. Kwa MQ, Herum KM, Brakebusch C. Cancer-associated fibroblasts: how do they contribute to metastasis? Clin Exp metastasis. (2019) 36:71–86. doi: 10.1007/s10585-019-09959-0
2. Neophytou CM, Panagi M, Stylianopoulos T, Papageorgis P. The role of tumor microenvironment in cancer metastasis: molecular mechanisms and therapeutic opportunities. Cancers. (2021) 13(9):2053. doi: 10.3390/cancers13092053
3. Liao Z, Tan ZW, Zhu P, Tan NS. Cancer-associated fibroblasts in tumor microenvironment - Accomplices in tumor Malignancy. Cell Immunol. (2019) 343:103729. doi: 10.1016/j.cellimm.2017.12.003
4. Li F, Wu X, Sun Z, Cai P, Wu L, Li D. Fibroblast activation protein-α Expressing fibroblasts promote lymph node metastasis in esophageal squamous cell carcinoma. OncoTargets Ther. (2020) 13:8141–8. doi: 10.2147/OTT.S257529
5. Liao Y, Ni Y, He R, Liu W, Du J. Clinical implications of fibroblast activation protein-α in non-small cell lung cancer after curative resection: a new predictor for prognosis. J Cancer Res Clin Oncol. (2013) 139:1523–8. doi: 10.1007/s00432-013-1471-8
6. Moher D, Liberati A, Tetzlaff J, Altman DG. Preferred reporting items for systematic reviews and meta-analyses: the PRISMA statement. Int J Surg. (2010) 8:336–41. doi: 10.1016/j.ijsu.2010.02.007
7. Nhlbi N. Quality assessment tool for observational cohort and cross-sectional studies. Study Quality Assessment Tools| NHLBI, NIH (2017). Available at: https://www.nhlbi.nih.gov/health-topics/study-quality-assessment-tools.
8. Ma L-L, Wang Y-Y, Yang Z-H, Huang D, Weng H, Zeng X-T. Methodological quality (risk of bias) assessment tools for primary and secondary medical studies: what are they and which is better? Military Med Res. (2020) 7:7. doi: 10.1186/s40779-020-00238-8
9. Tierney JF, Stewart LA, Ghersi D, Burdett S, Sydes MR. Practical methods for incorporating summary time-to-event data into meta-analysis. Trials. (2007) 8:1–16. doi: 10.1186/1745-6215-8-16
10. Begg CB, Mazumdar M. Operating characteristics of a rank correlation test for publication bias. Biometrics. (1994) 50:1088–101. doi: 10.2307/2533446
11. Egger M, Smith GD, Schneider M, Minder C. Bias in meta-analysis detected by a simple, graphical test. Bmj. (1997) 315(7109):629–34. doi: 10.1136/bmj.315.7109.629
12. Duval S, Tweedie R. Trim and fill: A simple funnel-plot-based method of testing and adjusting for publication bias in meta-analysis. Biometrics. (2000) 56:455–63. doi: 10.1111/j.0006-341X.2000.00455.x
13. Abd El-Azeem MA, Ali MA, El-Shorbagy SH. Expression of GLUT4 and FAP in urothelial bladder carcinoma: correlation with angiogenesis and clinicopathological characteristics. Journal of the Egyptian National Cancer Institute. (2022) 34(1):40. doi: 10.1186/s43046-022-00145-0
14. Ambrosetti D, Coutts M, Paoli C, Durand M, Borchiellini D, Montemagno C, et al. Cancer-associated fibroblasts in renal cell carcinoma: implication in prognosis and resistance to anti-angiogenic therapy. BJU International. (2022) 129(1):80–92. doi: 10.1111/bju.15506
15. Byrling J, Sasor A, Nilsson J, Said Hilmersson K, Andersson R, Andersson BJS. Expression of fibroblast activation protein and the clinicopathological relevance in distal cholangiocarcinoma. Scand J Gastroenterol. (2020) 55(1):82–9. doi: 10.1080/00365521.2019.1708449
16. Calvete J, Larrinaga G, Errarte P, Martin AM, Dotor A, Esquinas C, et al. The coexpression of fibroblast activation protein (FAP) and basal-type markers (CK 5/6 and CD44) predicts prognosis in high-grade invasive urothelial carcinoma of the bladder. Hum Pathol. (2019) 91:61–8. doi: 10.1016/j.humpath.2019.07.002
17. Chen L, Chen M, Han Z, Jiang F, Xu C, Qin Y, et al. Clinical significance of FAP-α on microvessel and lymphatic vessel density in lung squamous cell carcinoma. J Clin Pathol. (2018) 71:721–8. doi: 10.1136/jclinpath-2017-204872
18. Coto-Lierena M, Ercan C, Kancherla V, Taha-Mehlitz S, Eppenberger-Castori S, Soysal SD, et al. High expression of FAP in colorectal cancer is associated with angiogenesis and immunoregulation processes. Front Oncol. (2020) 10:979. doi: 10.3389/fonc.2020.00979
19. Errarte P, Guarch R, Pulido R, Blanco L, Nunes-Xavier CE, Beitia M, et al. The expression of fibroblast activation protein in clear cell renal cell carcinomas is associated with synchronous lymph node metastases. PLoS One. (2016) 11(12):e0169105. doi: 10.1371/journal.pone.0169105
20. Gao L-M, Wang F, Zheng Y, Fu Z-Z, Zheng L, Chen L-LJP, et al. Roles of fibroblast activation protein and hepatocyte growth factor expressions in angiogenesis and metastasis of gastric cancer. Pathol Oncol Res. (2019) 25:369–76. doi: 10.1007/s12253-017-0359-3
21. Ha SY, Yeo S-Y, Xuan Y-h, Kim S-H. The prognostic significance of cancer-associated fibroblasts in esophageal squamous cell carcinoma. PloS one. (2014) 9(6). doi: 10.1371/journal.pone.0099955
22. Higashino N, Y-i K, Hosono M, Takase N, Okamoto M, Kodaira H, et al. Fibroblast activation protein-positive fibroblasts promote tumor progression through secretion of CCL2 and interleukin-6 in esophageal squamous cell carcinoma. Lab Invest. (2019) 99(6):777–92. doi: 10.1038/s41374-018-0185-6
23. Kashima H, Noma K, Ohara T, Kato T, Katsura Y, Komoto S, et al. Cancer-associated fibroblasts (CAFs) promote the lymph node metastasis of esophageal squamous cell carcinoma. Int J Cancer. (2019) 144(4):828–40. doi: 10.1002/ijc.31953
24. Kawase T, Yasui Y, Nishina S, Hara Y, Yanatori I, Tomiyama Y, et al. Fibroblast activation protein-α-expressing fibroblasts promote the progression of pancreatic ductal adenocarcinoma. BMC gastroenterology. (2015) 15:1–9. doi: 10.1186/s12876-015-0340-0
25. Kim GJ, Rhee H, Yoo JE, Ko JE, Lee JS, Kim H, et al. Increased expression of CCN2, epithelial membrane antigen, and fibroblast activation protein in hepatocellular carcinoma with fibrous stroma showing aggressive behavior. PLoS One. (2014) 9(8):. doi: 10.1371/journal.pone.0105094
26. Ma T, Gao C, Xie R, Yang X, Dai W, Zhang J, et al. Predictive values of FAP and HGF for tumor angiogenesis and metastasis in colorectal cancer. Neoplasma. (2017) 64(6):880–6. doi: 10.4149/neo_2017_609
27. Miao Z-F, Zhao T-T, Wang Z-N, Miao F, Xu Y-Y, Mao X-Y, et al. Tumor-associated mesothelial cells are negative prognostic factors in gastric cancer and promote peritoneal dissemination of adherent gastric cancer cells by chemotaxis. Tumour Biol. (2014) 35:6105–11. doi: 10.1007/s13277-014-1808-1
28. Muilwijk T, Akand M, Daelemans S, Marien K, Waumans Y, Kockx M, et al. Stromal marker fibroblast activation protein drives outcome in T1 non-muscle invasive bladder cancer. PLoS One. (2021) 16(9):e0257195. doi: 10.1371/journal.pone.0257195
29. Shi M, Yu D-H, Chen Y, Zhao C-Y, Zhang J, Liu Q-H, et al. Expression of fibroblast activation protein in human pancreatic adenocarcinoma and its clinicopathological significance. WJG. (2012) 18(8):840. doi: 10.3748/wjg.v18.i8.840
30. Son GM, Kwon M-S, Shin D-H, Shin N, Ryu D, Kang CD. Comparisons of cancer-associated fibroblasts in the intratumoral stroma and invasive front in colorectal cancer. Medicine. (2019) 98(18):e15164. doi: 10.1097/MD.0000000000015164
31. Song Z, Lin Y, Zhang X, Ye X, Yang G, Feng C, et al. Expression of FAP is correlated with clinical prognosis in ovarian cancer patients. Int J Clin Exp Med. (2016) 9(6):11379–84.
32. Wang H, Wu Q, Liu Z, Luo X, Fan Y, Liu Y, et al. Downregulation of FAP suppresses cell proliferation and metastasis through PTEN/PI3K/AKT and Ras-ERK signaling in oral squamous cell carcinoma. Cell Death disease. (2014) 5:e1155–e. doi: 10.1038/cddis.2014.122
33. Wang R-F, Zhang L-H, Shan L-H, Sun W-G, Chai C-C, Wu H-M, et al. Effects of the fibroblast activation protein on the invasion and migration of gastric cancer. Exp Mol Pathol. (2013) 95(3):350–6. doi: 10.1016/j.yexmp.2013.10.008
34. Wen Z, Liu Q, Wu J, Xu B, Wang J, Liang L, et al. Fibroblast activation protein α-positive pancreatic stellate cells promote the migration and invasion of pancreatic cancer by CXCL1-mediated Akt phosphorylation. Ann Transl Med. (2019) 7(20):532. doi: 10.21037/atm.2019.09.164
35. Zhang M, Xu L, Wang X, Sun B, Ding J. Expression levels of seprase/FAPα and DPPIV/CD26 in epithelial ovarian carcinoma. Oncol Lett. (2015) 10(1):34–42. doi: 10.3892/ol.2015.3151
36. Zou B, Liu X, Zhang B, Gong Y, Cai C, Li P, et al. The expression of FAP in hepatocellular carcinoma cells is induced by hypoxia and correlates with poor clinical outcomes. J Cancer. (2018) 9(18):3278. doi: 10.7150/jca.25775
37. Henry LR, Lee HO, Lee JS, Klein-Szanto A, Watts P, Ross EA, et al. Clinical implications of fibroblast activation protein in patients with colon cancer. Clin Cancer Res. (2007) 13:1736–41. doi: 10.1158/1078-0432.CCR-06-1746
38. Yuan D, Liu B, Liu K, Zhu G, Dai Z, Xie Y. Overexpression of fibroblast activation protein and its clinical implications in patients with osteosarcoma. J Surg Oncol. (2013) 108:157–62. doi: 10.1002/jso.23368
39. Greimelmaier K, Klopp N, Mairinger E, Wessolly M, Borchert S, Steinborn J, et al. Fibroblast activation protein-α expression in fibroblasts is common in the tumor microenvironment of colorectal cancer and may serve as a therapeutic target. Pathology and Oncology Research. (2023) 29:1611163. doi: 10.3389/pore.2023.1611163
40. Ramirez-Montagut T, Blachere NE, Sviderskaya EV, Bennett DC, Rettig WJ, Garin-Chesa P, et al. FAP α, a surface peptidase expressed during wound healing, is a tumor suppressor. Oncogene. (2004) 23:5435–46. doi: 10.1038/sj.onc.1207730
41. Liu F, Qi L, Liu B, Liu J, Zhang H, Che D, et al. Fibroblast activation protein overexpression and clinical implications in solid tumors: a meta-analysis. PloS One. (2015) 10:e0116683. doi: 10.1371/journal.pone.0116683
42. Solano-Iturri JD, Beitia M, Errarte P, Calvete-Candenas J, Etxezarraga MC, Loizate A, et al. Altered expression of fibroblast activation protein-α (FAP) in colorectal adenoma-carcinoma sequence and in lymph node and liver metastases. Aging (Albany NY). (2020) 12:10337. doi: 10.18632/aging.v12i11
43. Moreno-Ruiz P, Corvigno S, Te Grootenhuis NC, La Fleur L, Backman M, Strell C, et al. Stromal FAP is an independent poor prognosis marker in non-small cell lung adenocarcinoma and associated with p53 mutation. Lung Cancer. (2021) 155:10–9. doi: 10.1016/j.lungcan.2021.02.028
44. Vennin C, Mélénec P, Rouet R, Nobis M, Cazet AS, Murphy KJ, et al. CAF hierarchy driven by pancreatic cancer cell p53-status creates a pro-metastatic and chemoresistant environment via perlecan. Nat Commun. (2019) 10:1–22. doi: 10.1038/s41467-019-10968-6
45. Akagi Y, Adachi Y, Ohchi T, Kinugasa T, Shirouzu K. Prognostic impact of lymphatic invasion of colorectal cancer: a single-center analysis of 1,616 patients over 24 years. Anticancer Res. (2013) 33:2965–70.
46. Wen Y, Wang CT, Ma TT, Li ZY, Zhou LN, Mu B, et al. Immunotherapy targeting fibroblast activation protein inhibits tumor growth and increases survival in a murine colon cancer model. Cancer Sci. (2010) 101(11):2325–32. doi: 10.1111/j.1349-7006.2010.01695.x
47. Yeung TM, Buskens C, Wang LM, Mortensen NJ, Bodmer WF. Myofibroblast activation in colorectal cancer lymph node metastases. Br J Cancer. (2013) 108:2106–15. doi: 10.1038/bjc.2013.209
48. Hintz HM, Gallant JP, Vander Griend DJ, Coleman IM, Nelson PS, LeBeau AM. Imaging fibroblast activation protein alpha improves diagnosis of metastatic prostate cancer with positron emission tomography. Clin Cancer Res. (2020) 26(18):4882–91. doi: 10.1158/1078-0432.CCR-20-1358
Keywords: fibroblast activation protein, association, meta-analysis, metastasis, cancer
Citation: Janani M, Poorkhani A, Amiriani T, Donyadideh G, Ahmadi F, Jorjanisorkhankalateh Y, Beheshti-Nia F, Kalaei Z, Roudbaraki M, Soltani M, Khori V and Alizadeh AM (2024) Association of future cancer metastases with fibroblast activation protein-α: a systematic review and meta-analysis. Front. Oncol. 14:1339050. doi: 10.3389/fonc.2024.1339050
Received: 15 November 2023; Accepted: 04 April 2024;
Published: 01 May 2024.
Edited by:
Khosrow Kashfi, City University of New York, United StatesReviewed by:
Chao Teng, China Pharmaceutical University, ChinaSajad Jeddi, Shahid Beheshti University of Medical Sciences, Iran
Copyright © 2024 Janani, Poorkhani, Amiriani, Donyadideh, Ahmadi, Jorjanisorkhankalateh, Beheshti-Nia, Kalaei, Roudbaraki, Soltani, Khori and Alizadeh. This is an open-access article distributed under the terms of the Creative Commons Attribution License (CC BY). The use, distribution or reproduction in other forums is permitted, provided the original author(s) and the copyright owner(s) are credited and that the original publication in this journal is cited, in accordance with accepted academic practice. No use, distribution or reproduction is permitted which does not comply with these terms.
*Correspondence: Ali Mohammad Alizadeh, YWFsaXphZGVoQHNpbmEudHVtcy5hYy5pcg==
†These authors have contributed equally to this work