 Dachen Luo1†
 Qingyuan Zhan
 Shan Lin
- 1Department of Respiratory and Critical Care Medicine, Affiliated Hospital of North Sichuan Medical College, Nanchong, China
- 2Department of Pulmonary and Critical Care Medicine, Center of Respiratory Medicine, National Center for Respiratory Medicine, China-Japan Friendship Hospital, Beijing, China
Background: Lung cancer is the deadliest and most prevalent malignancy worldwide. While smoking is an established cause, evidence to identify other causal factors remains lacking. Current research indicates chronic inflammation is involved in tumorigenesis and cancer development, though the specific mechanisms underlying the role of inflammatory cytokines in lung cancer pathogenesis remain unclear. This study implemented Mendelian randomization (MR) analysis to investigate the causal effects of circulating cytokines on lung cancer development.
Methods: We performed a two-sample MR analysis in Europeans utilizing publicly available genome-wide association study summary statistics. Single nucleotide polymorphisms significantly associated with cytokine were selected as genetic instrumental variables.
Results: Genetically predicted levels of the chemokine interleukin-18 (IL-18) (OR = 0.942, 95% CI: 0.897–0.990, P = 0.018) exerted significant negative causal effects on overall lung cancer risk in this analysis. Examining specific histologic subtypes revealed further evidence of genetic associations. Stem cell factor (SCF) (OR = 1.150, 95% CI: 1.021–1.296, P = 0.021) and interleukin-1beta (IL-1β) (OR = 1.152, 95% CI: 1.003–1.325, P = 0.046) were positively associated with lung adenocarcinoma risk, though no inflammatory factors showed causal links to squamous cell lung cancer risk. Stratified by smoking status, interferon gamma-induced protein 10 (IP-10) (OR = 0.861, 95% CI: 0.781–0.950, P = 0.003) was inversely associated while IL-1β (OR = 1.190, 95% CI: 1.023–1.384, P = 0.024) was positively associated with lung cancer risk in ever smokers. Among never smokers, a positive association was observed between lung cancer risk and SCF (OR = 1.474, 95% CI: 1.105–1.964, P = 0.008). Importantly, these causal inferences remained robust across multiple complementary MR approaches, including MR-Egger, weighted median, weighted mode and simple mode regressions. Sensitivity analyses also excluded potential bias stemming from pleiotropy.
Conclusion: This MR study found preliminary evidence that genetically predicted levels of four inflammatory cytokines—SCF, IL-1β, IL-18, and IP-10—may causally influence lung cancer risk in an overall and subtype-specific manner, as well as stratified by smoking status. Identifying these cytokine pathways that may promote lung carcinogenesis represents potential new targets for the prevention, early detection, and treatment of this deadly malignancy.
Introduction
As the deadliest cancer worldwide, lung cancer was responsible for 1,817,000 deaths in 2022, accounting for 18.7% of all cancer-related fatalities (1). Due to typically late-stage diagnosis once symptoms arise, the 5-year survival rate for lung cancer patients is dismally low at around 20% (2). Smoking is a well-known predominant risk factor, yet evidence to elucidate other potential causes remains scarce (3, 4). Identifying additional contributory risk factors to promote early detection and treatment thus represents a critical need in combating this devastating disease.
Over the past two decades, a sizable body of evidence has firmly established chronic infection and inflammation as key promoters of carcinogenesis (5–8). The inflammatory tumor microenvironment, comprised of leukocytes releasing cytokines, chemokines, reactive oxygen species and other cytotoxic mediators, can drive tumor progression through processes such as genotoxicity, aberrant tissue repair, heightened cellular proliferation, invasion and metastasis (5, 9). Critical transcription factors including STAT3 and NF-κB have been implicated in inflammation-fueled carcinogenesis (10, 11). Tumors can further manipulate the inflammatory milieu to suppress anti-tumor T cell responses (12). However, despite substantial links between cytokines and cancer, the precise underlying mechanisms, particularly in lung cancer, remain to be fully deciphered.
Mendelian randomization (MR) analysis utilizes genetic variation as an instrumental variable to infer the potential causal relationship between modifiable exposures and disease outcomes (13). As genetic variation is randomly assigned and not susceptible to reverse causation, this ingenious approach circumvents confounding and reverse causation bias that plague traditional observational studies (14). In this study, we implemented MR to investigate the causal role of circulating cytokines in lung cancer pathogenesis. Using genetic instruments as surrogates for cytokine levels, we evaluated whether inflammation actively drives lung cancer development or simply represents an epiphenomenon. Elucidating these causal pathways will provide novel mechanistic insights and could reveal previously unrecognized therapeutic targets for this pernicious lung disease.
Method
Study design
In this two-sample MR analysis, we utilized single nucleotide polymorphisms (SNPs) as instrumental variables (IVs). To ensure validity, SNPs were chosen based on three critical assumptions: (1) significant associations with exposure factors, satisfying relevance; (2) effects on outcomes solely via exposures, not through alternative pathways, fulfilling exclusivity; and (3) independence from confounding factors (15).
Data resource
SNPs associated with circulating cytokines were obtained from the latest genome-wide association studies (GWAS), as listed in Supplementary Table 1. Summary data from a large-scale cytokine GWAS meta-analysis were used to generate genetic instruments for cytokines (16). This meta-analysis measured cytokine levels in plasma and blood samples from 8,293 Finnish individuals across three population-based cohorts.
To investigate causal effects of circulating cytokines on lung cancer risk, we obtained lung cancer GWAS summary statistics from the IEU open database. Lung cancer data were obtained from the International Lung Cancer Consortium (ILCCO) (https://ilcco.iarc.fr/), including 29,836 cases and 55,586 controls (17). The study also provided associations between instrumental SNPs and different histologic subtypes of lung cancer, including lung adenocarcinoma (case: 11,245, control: 54,619), squamous cell carcinoma (case: 7,704, control: 54,763), and small cell lung cancer (case: 2,791, control: 20,580). Subgroup analyses were performed according to smoking status, including smokers (23,223 cases and 16,964 controls) and never-smokers (2,355 cases and 7,504 controls), and all populations were restricted to European ethnic groups.
SNPs selection
To identify valid SNPs for MR, we implemented several filtering steps: First, we selected independent SNPs strongly associated with different cytokine levels (P <5×10⁻⁶) to maximize instrument availability (18, 19). Second, we used clumping to prune correlated SNPs in linkage disequilibrium (r2<0.001, 10,000 kb) and avoid biased results. Third, we excluded pleiotropic SNPs associated with potential confounders including smoking, diabetes and anxiety using PhenoScanner (20). Fourth, we retained only concordant SNPs between exposure and outcome datasets as valid instruments. Finally, we excluded weak instruments with F-statistics <10 (calculated as F = R2×(N-2)/1-R2) to minimize bias (21).
Statistical analysis
After SNP filtering, our primary MR analysis utilized inverse-variance weighted (IVW) estimation to evaluate the overall causal effects, given its accuracy when all instruments are valid (22). Complementary approaches including weighted median, MR Egger, weighted mode and simple mode were also implemented (23, 24). To probe potential horizontal pleiotropy, we performed MR Egger regression and Mendelian randomization pleiotropy residual sum and outlier (MR-PRESSO) testing (25, 26). Heterogeneity was assessed via Cochran’s Q and MR Egger regression, and result robustness was verified through leave-one-out analysis. Furthermore, we conducted Steiger testing to evaluate possible reverse causation (27).
To correct for multiple hypothesis testing, we applied Bonferroni correction and set statistical significance at P < 0.0012 based on the number of cytokines analyzed. P-values ranging from 0.0012 to 0.05 were considered suggestive evidence for potential causality (28, 29). All Mendelian randomization analyses were implemented in R utilizing the TwoSampleMR and MR-PRESSO packages. A P-value below 0.05 was deemed statistically significant.
Results
Causal effects of circulating cytokines on lung cancer and different subtypes
After implementing the described filtering procedures, 4–16 SNPs were retained as instruments for the circulating cytokines (Supplementary Table 1). High F-statistics confirmed all selected SNPs were robust instruments (all F values >10). We then leveraged these SNPs to infer causality between cytokines and lung cancer. MR estimates from the various analytical methods are visualized in Figure 1 (Supplementary Table S2). Specifically, IVW analysis revealed interleukin-18 (IL-18) exerted significant negative causal effects on lung cancer risk (OR = 0.942, 95% CI: 0.897–0.990, P = 0.018), while eotaxin had significant positive causal effects (OR = 1.061, 95% CI: 1.002–1.123, P = 0.043) (Figures 1A, B). Eotaxin, however, has a statistical efficacy of only 67%, thus it remains to be verified. Consistent estimates were yielded by MR Egger and weighted median methods. Scatter plots visualized the effects for each method across datasets (Supplementary Figure 1).
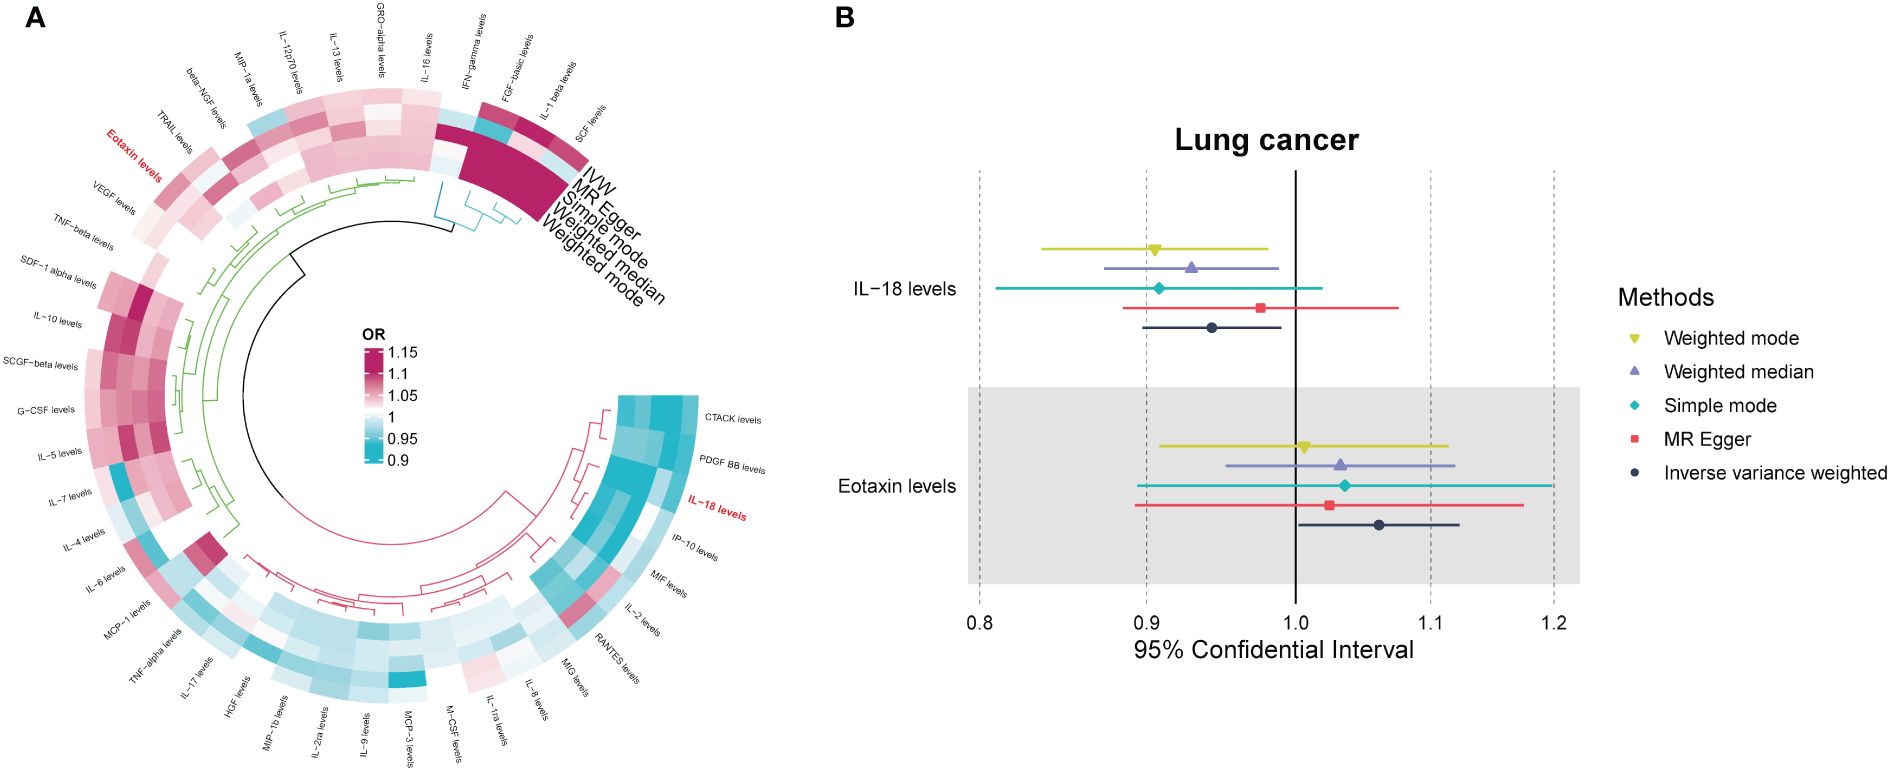
Figure 1 (A) Odds ratio cyclic heatmap of the MR analysis results for circulating cytokines and risk of lung cancer. (B) Forest plot of results with statistical significance.
Among the different histologic lung cancer types, we found further evidence of genetic associations (Figures 2-4). No inflammatory factor was found to be causally associated with the risk of squamous cell lung cancer (Figure 2) (Supplementary Table S3). Stem cell factor (SCF) (OR = 1.150, 95% CI: 1.021–1.296, P = 0.021) and interleukin-1beta (IL-1β) (OR = 1.152, 95% CI: 1.003–1.325, P = 0.046) were positively associated with the risk of lung adenocarcinoma (Figures 3A, B) (Supplementary Table S4). Vascular endothelial growth factor (VEGF) (OR = 1.117, 95% CI: 1.008–1.237, P = 0.035) was positively associated with the risk of small cell lung carcinoma (Figure 4A, B) (Supplementary Table S5), but the statistical efficacy of VEGF was limited to 21%, which makes the causal hypothesis unreliable. Scatter plots visualized the effects for each method across datasets (Supplementary Figures 2, 3).
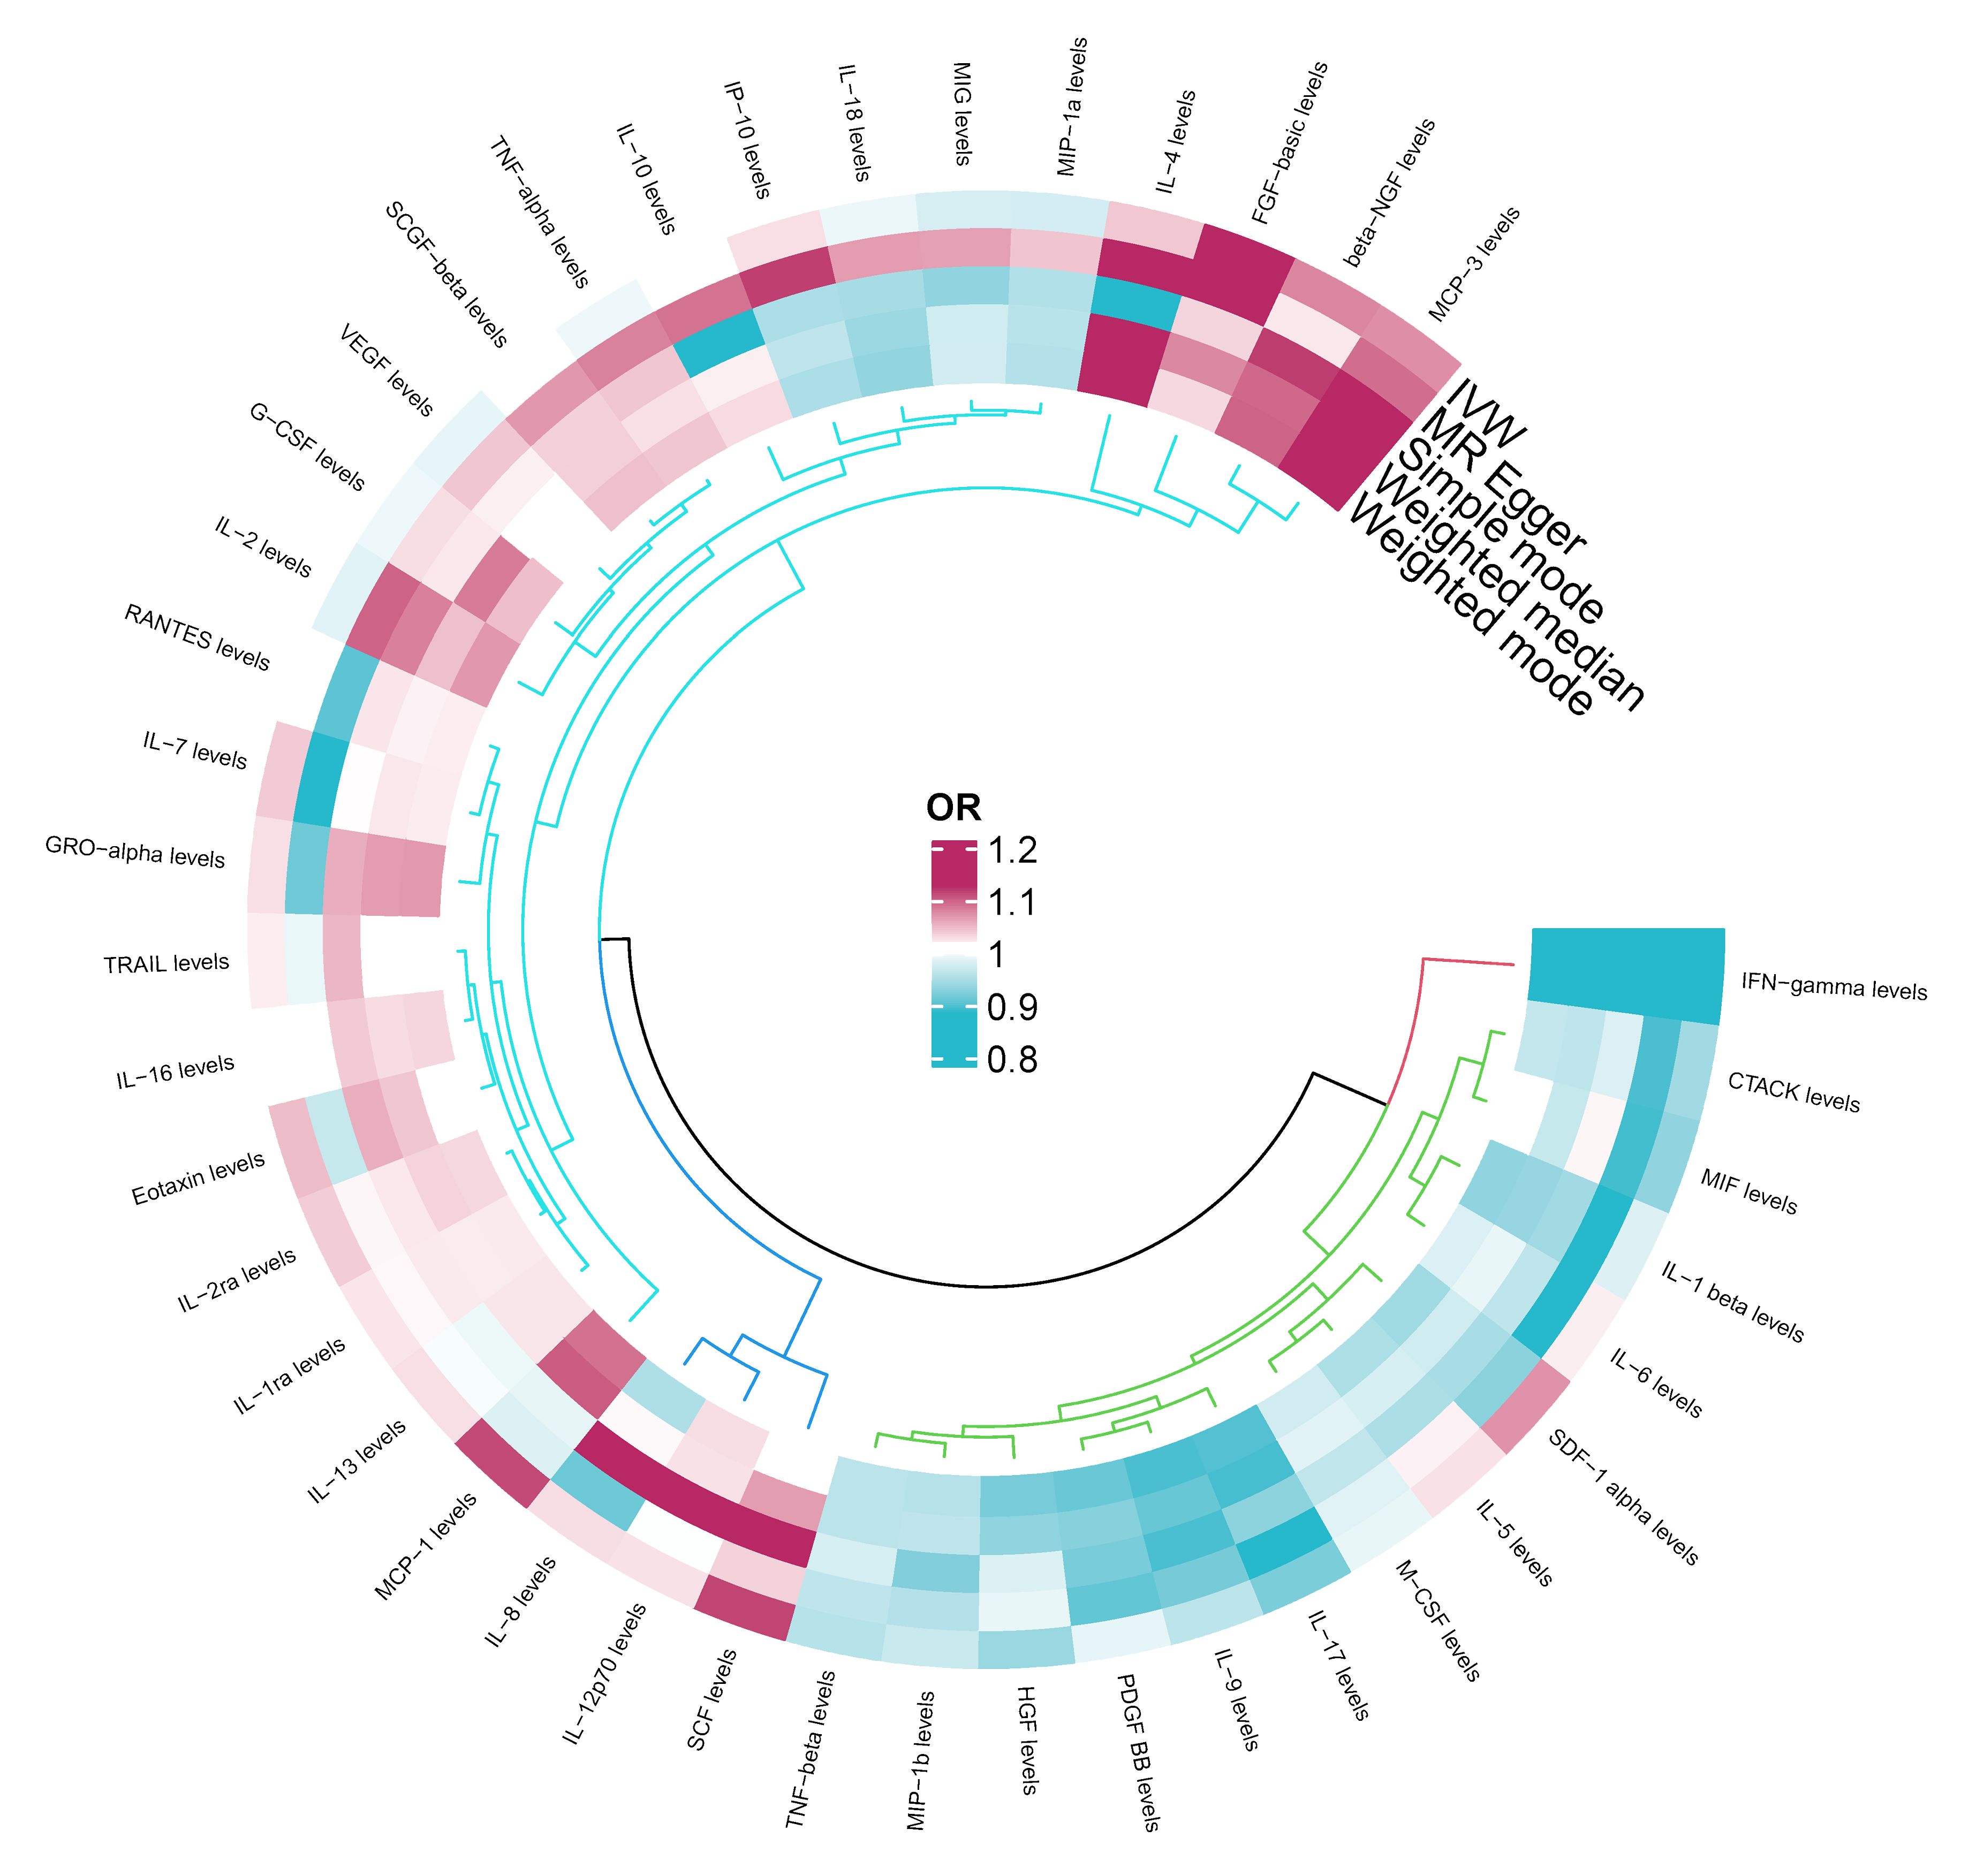
Figure 2 Odds ratio cyclic heatmap of the MR analysis results for circulating cytokines and risk of squamous cell lung cancer.
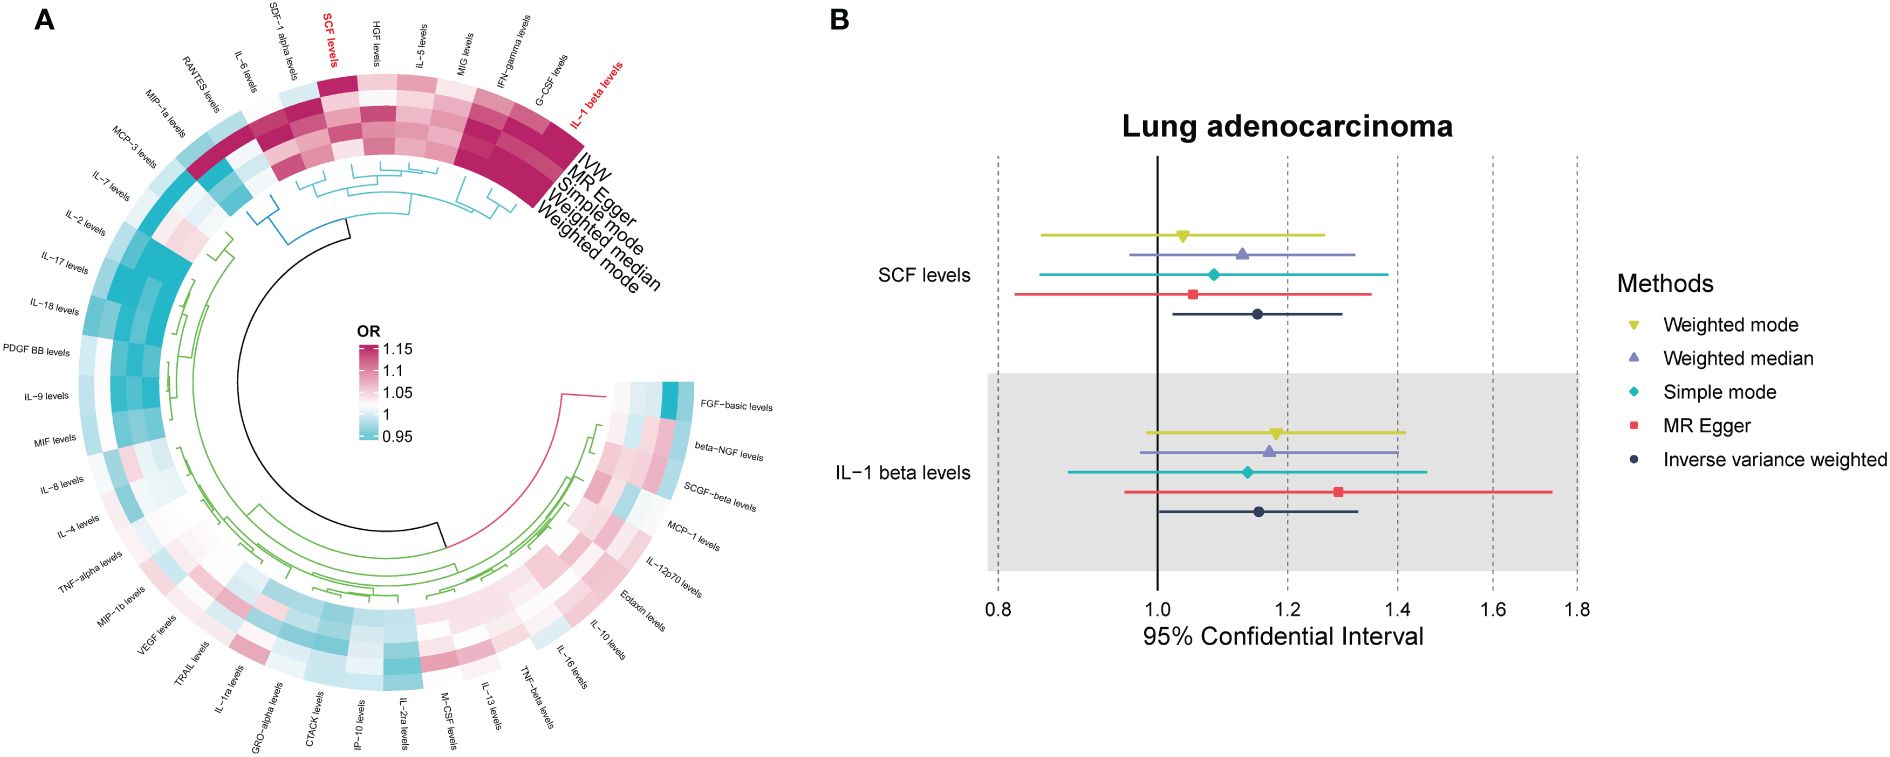
Figure 3 (A) Odds ratio value cyclic heatmap of the MR analysis results for circulating cytokines and risk of lung adenocarcinoma. (B) Forest plot of results with statistical significance.
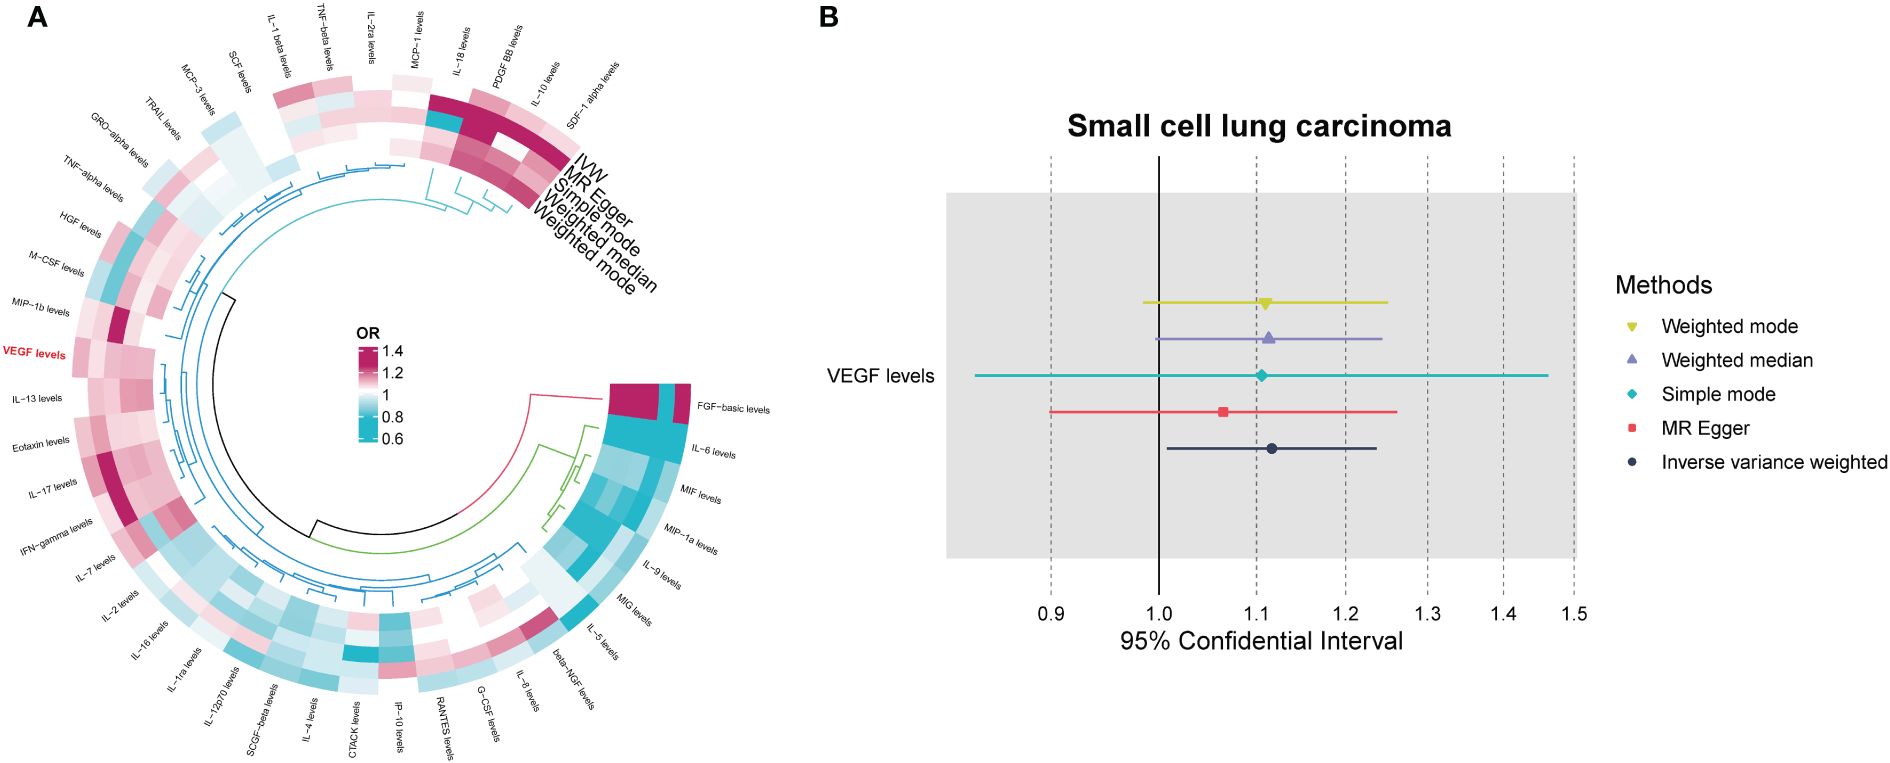
Figure 4 (A) Odds ratio value cyclic heatmap of the MR analysis results for circulating cytokines and risk of small cell lung carcinoma. (B) Forest plot of results with statistical significance.
MR Egger regression and MR-PRESSO global testing showed no evidence of horizontal pleiotropy (Table 1 and Supplementary Tables 6-9). Importantly, Cochran’s Q statistics and MR Egger regression revealed no significant heterogeneity among the individual SNP instruments (P > 0.05). MR-PRESSO global test p-values exceeding 0.05 for all cytokine-lung cancer associations, including different pathological types, further ruled out pleiotropy. Leave-one-out analysis confirmed the robustness of the causal estimates (Supplementary Figures 4-6).
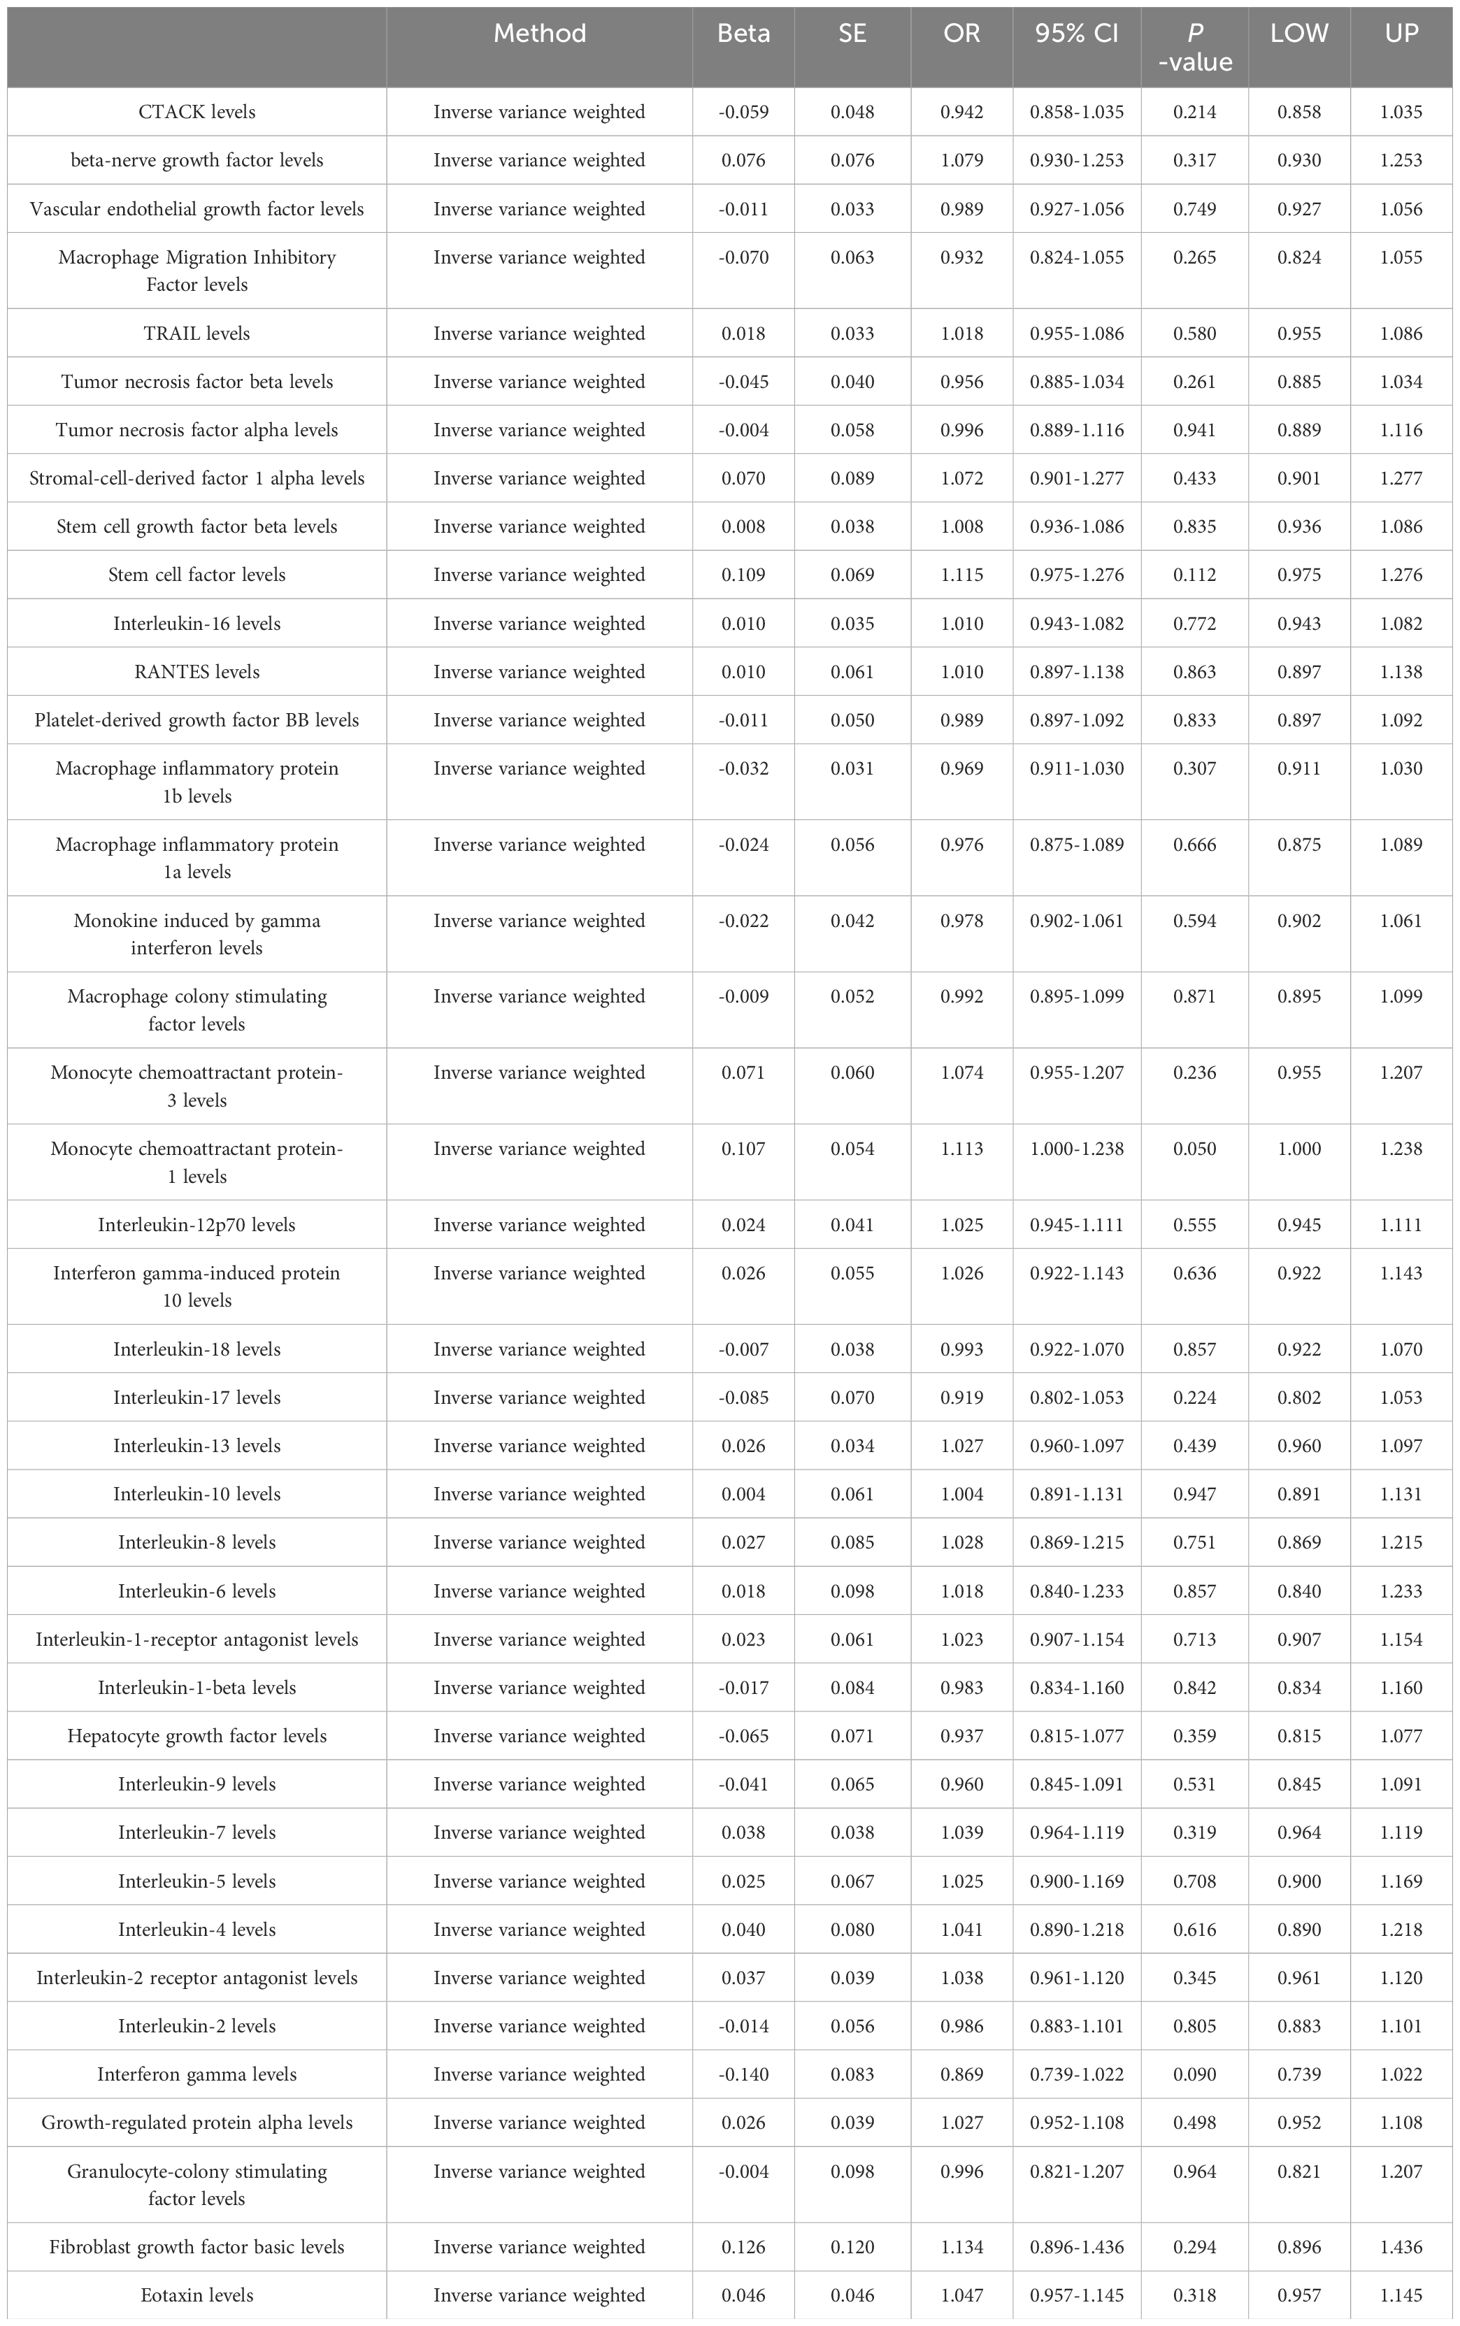
Table 1 Primary results of MR analysis on squamous cell lung cancer.
Among the other 35 examined cytokines, none demonstrated significant correlation with lung cancer risk or pathological types in IVW or secondary MR analyses (Tables 1–4). Heterogeneity testing showed no significant heterogeneity for any of the cytokines (Tables 5–8). Across all cytokines, MR Egger regression consistently revealed no evidence of pleiotropy (Tables 5–8). MR-PRESSO outlier testing validated the significant MR findings, except for monocyte chemoattractant protein-3 (MCP-3) in lung cancer (including different pathologic types) (Supplementary Tables 6-9), and macrophage migration inhibitory factor (MIF) and IL-5 in small-cell lung carcinoma, where limited SNPs were available (Supplementary Table 9). Furthermore, Steiger p-values <0.05 verified the detected causal direction was correct for all cytokines (Table 9–12).
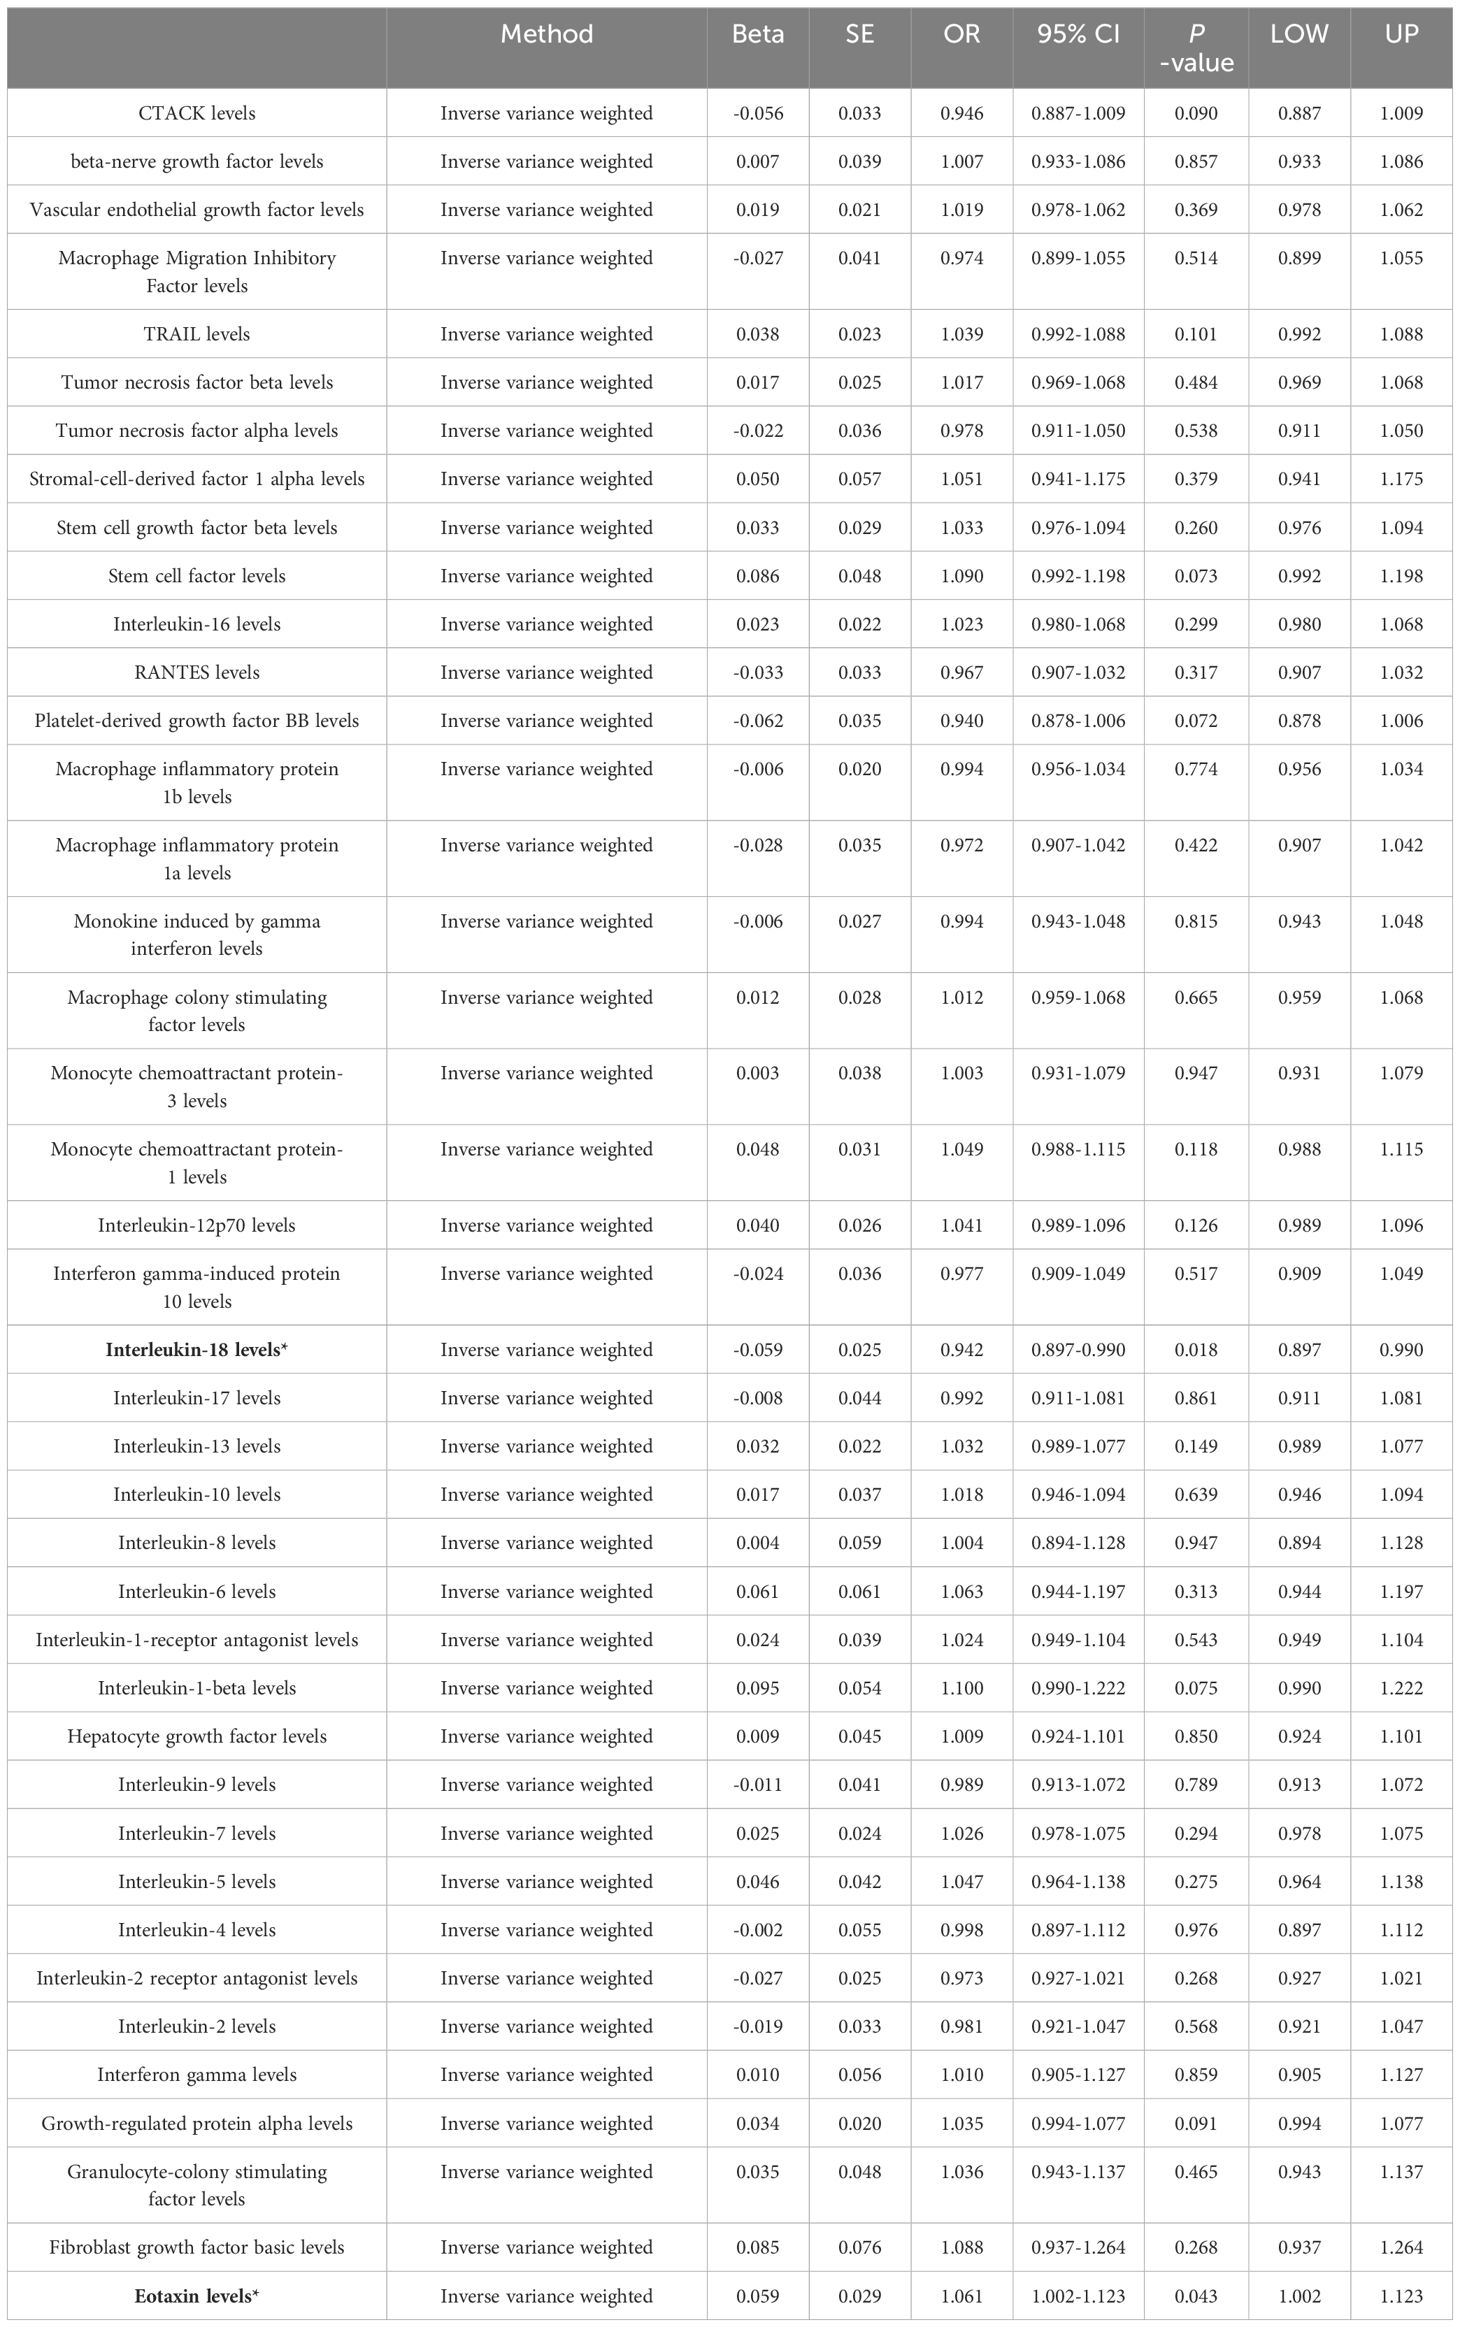
Table 2 Primary results of MR analysis on lung cancer.
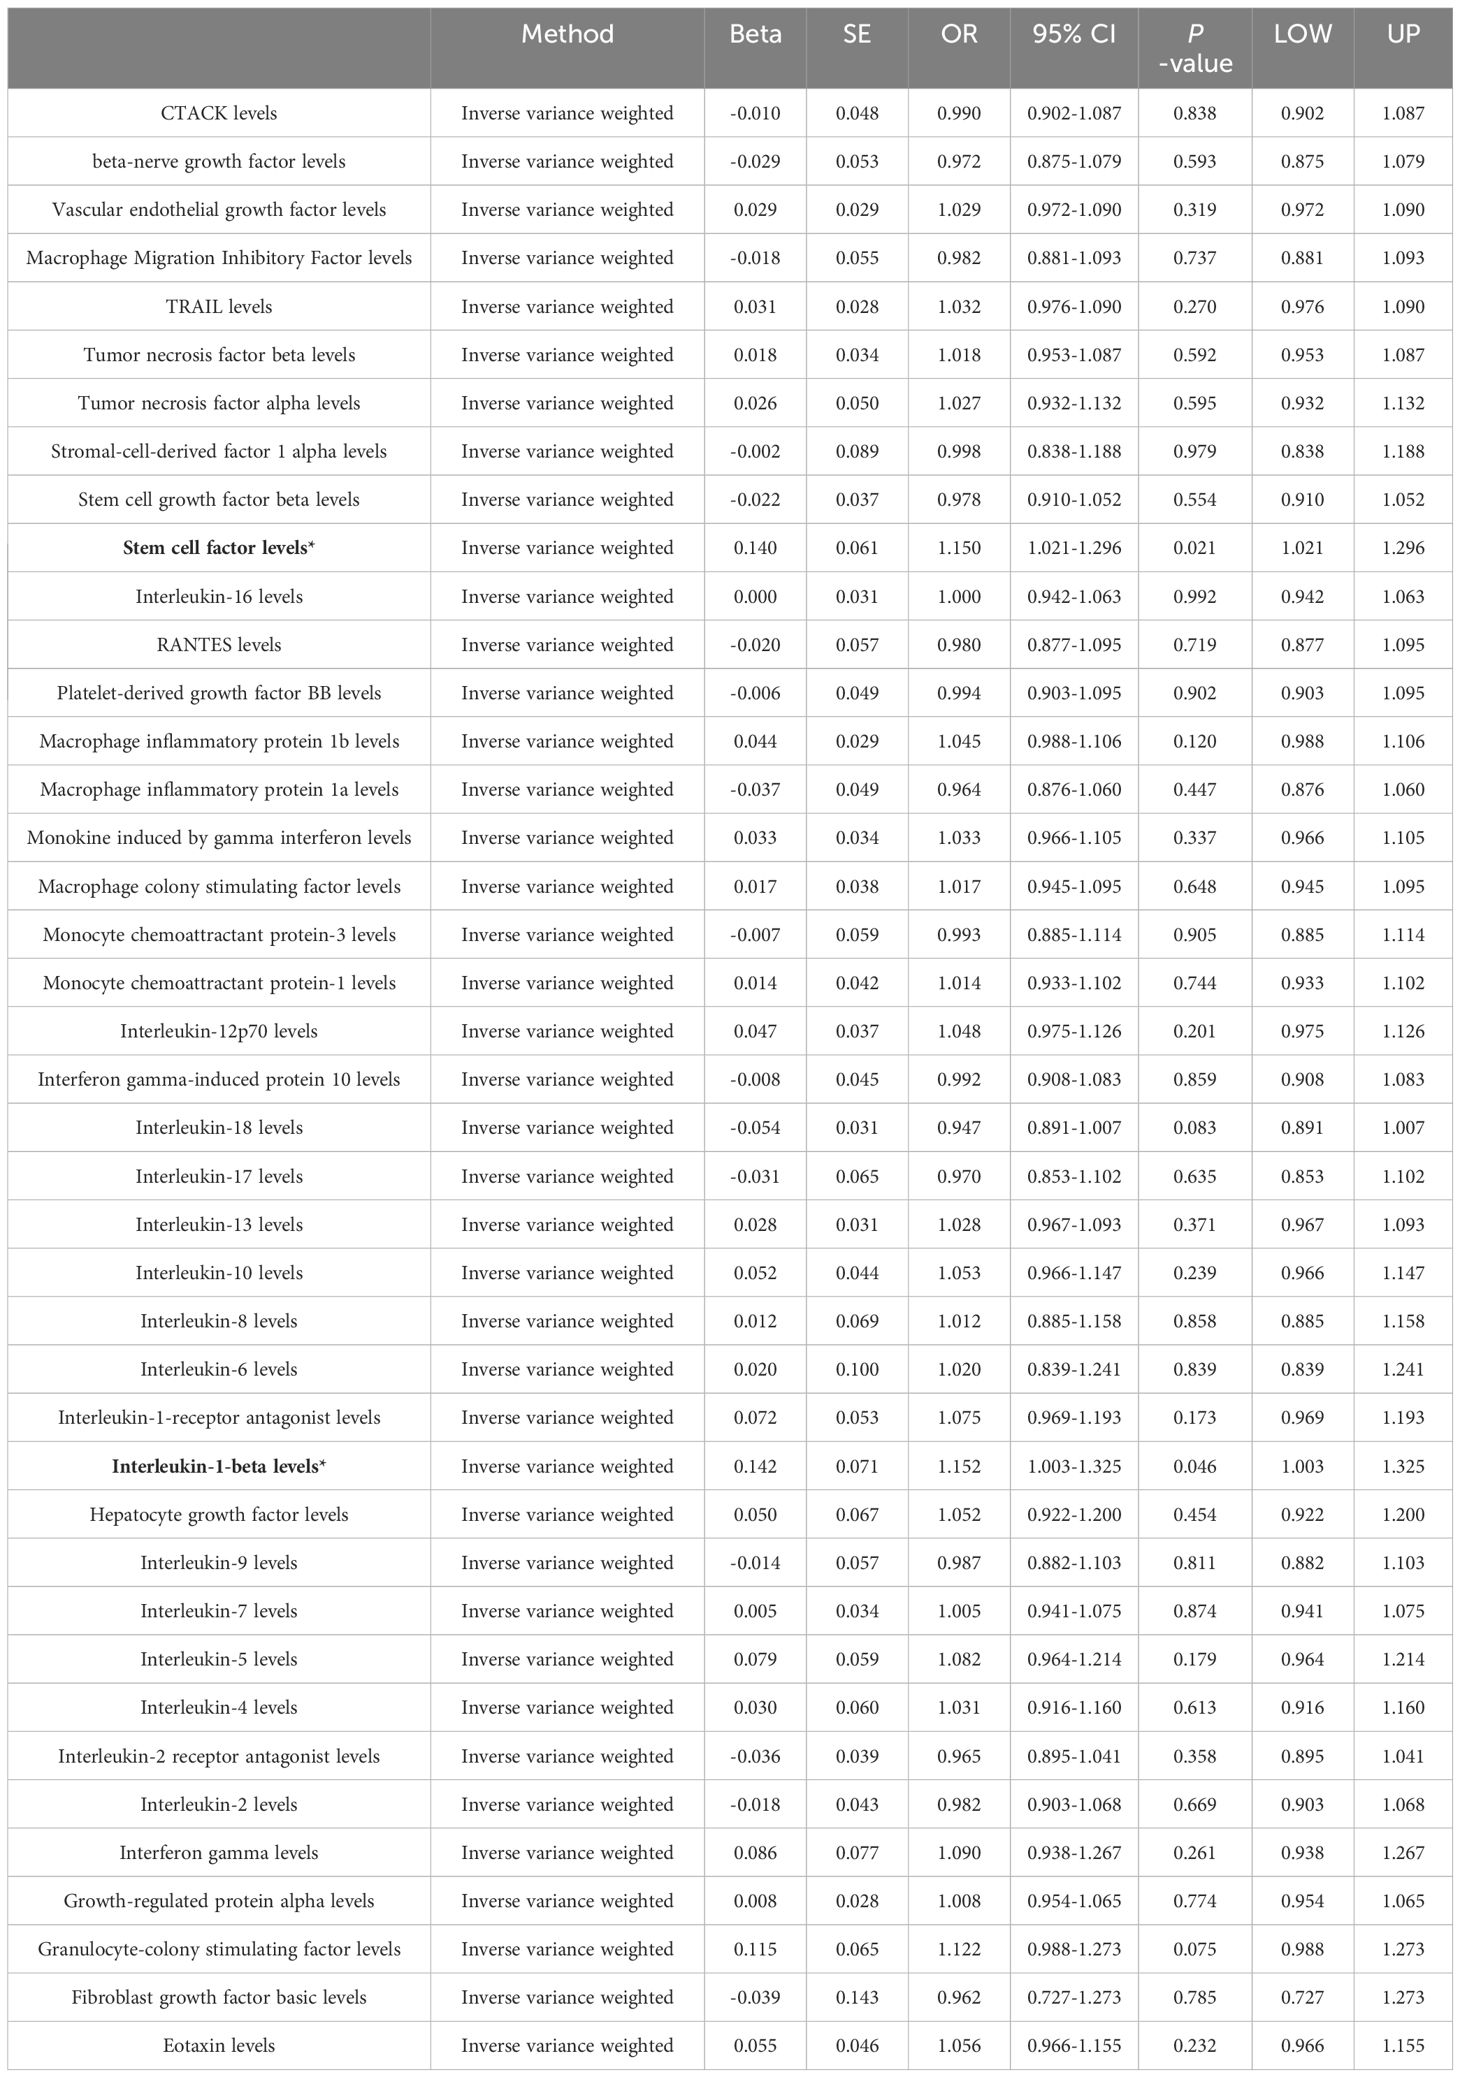
Table 3 Primary results of MR analysis on lung adenocarcinoma.
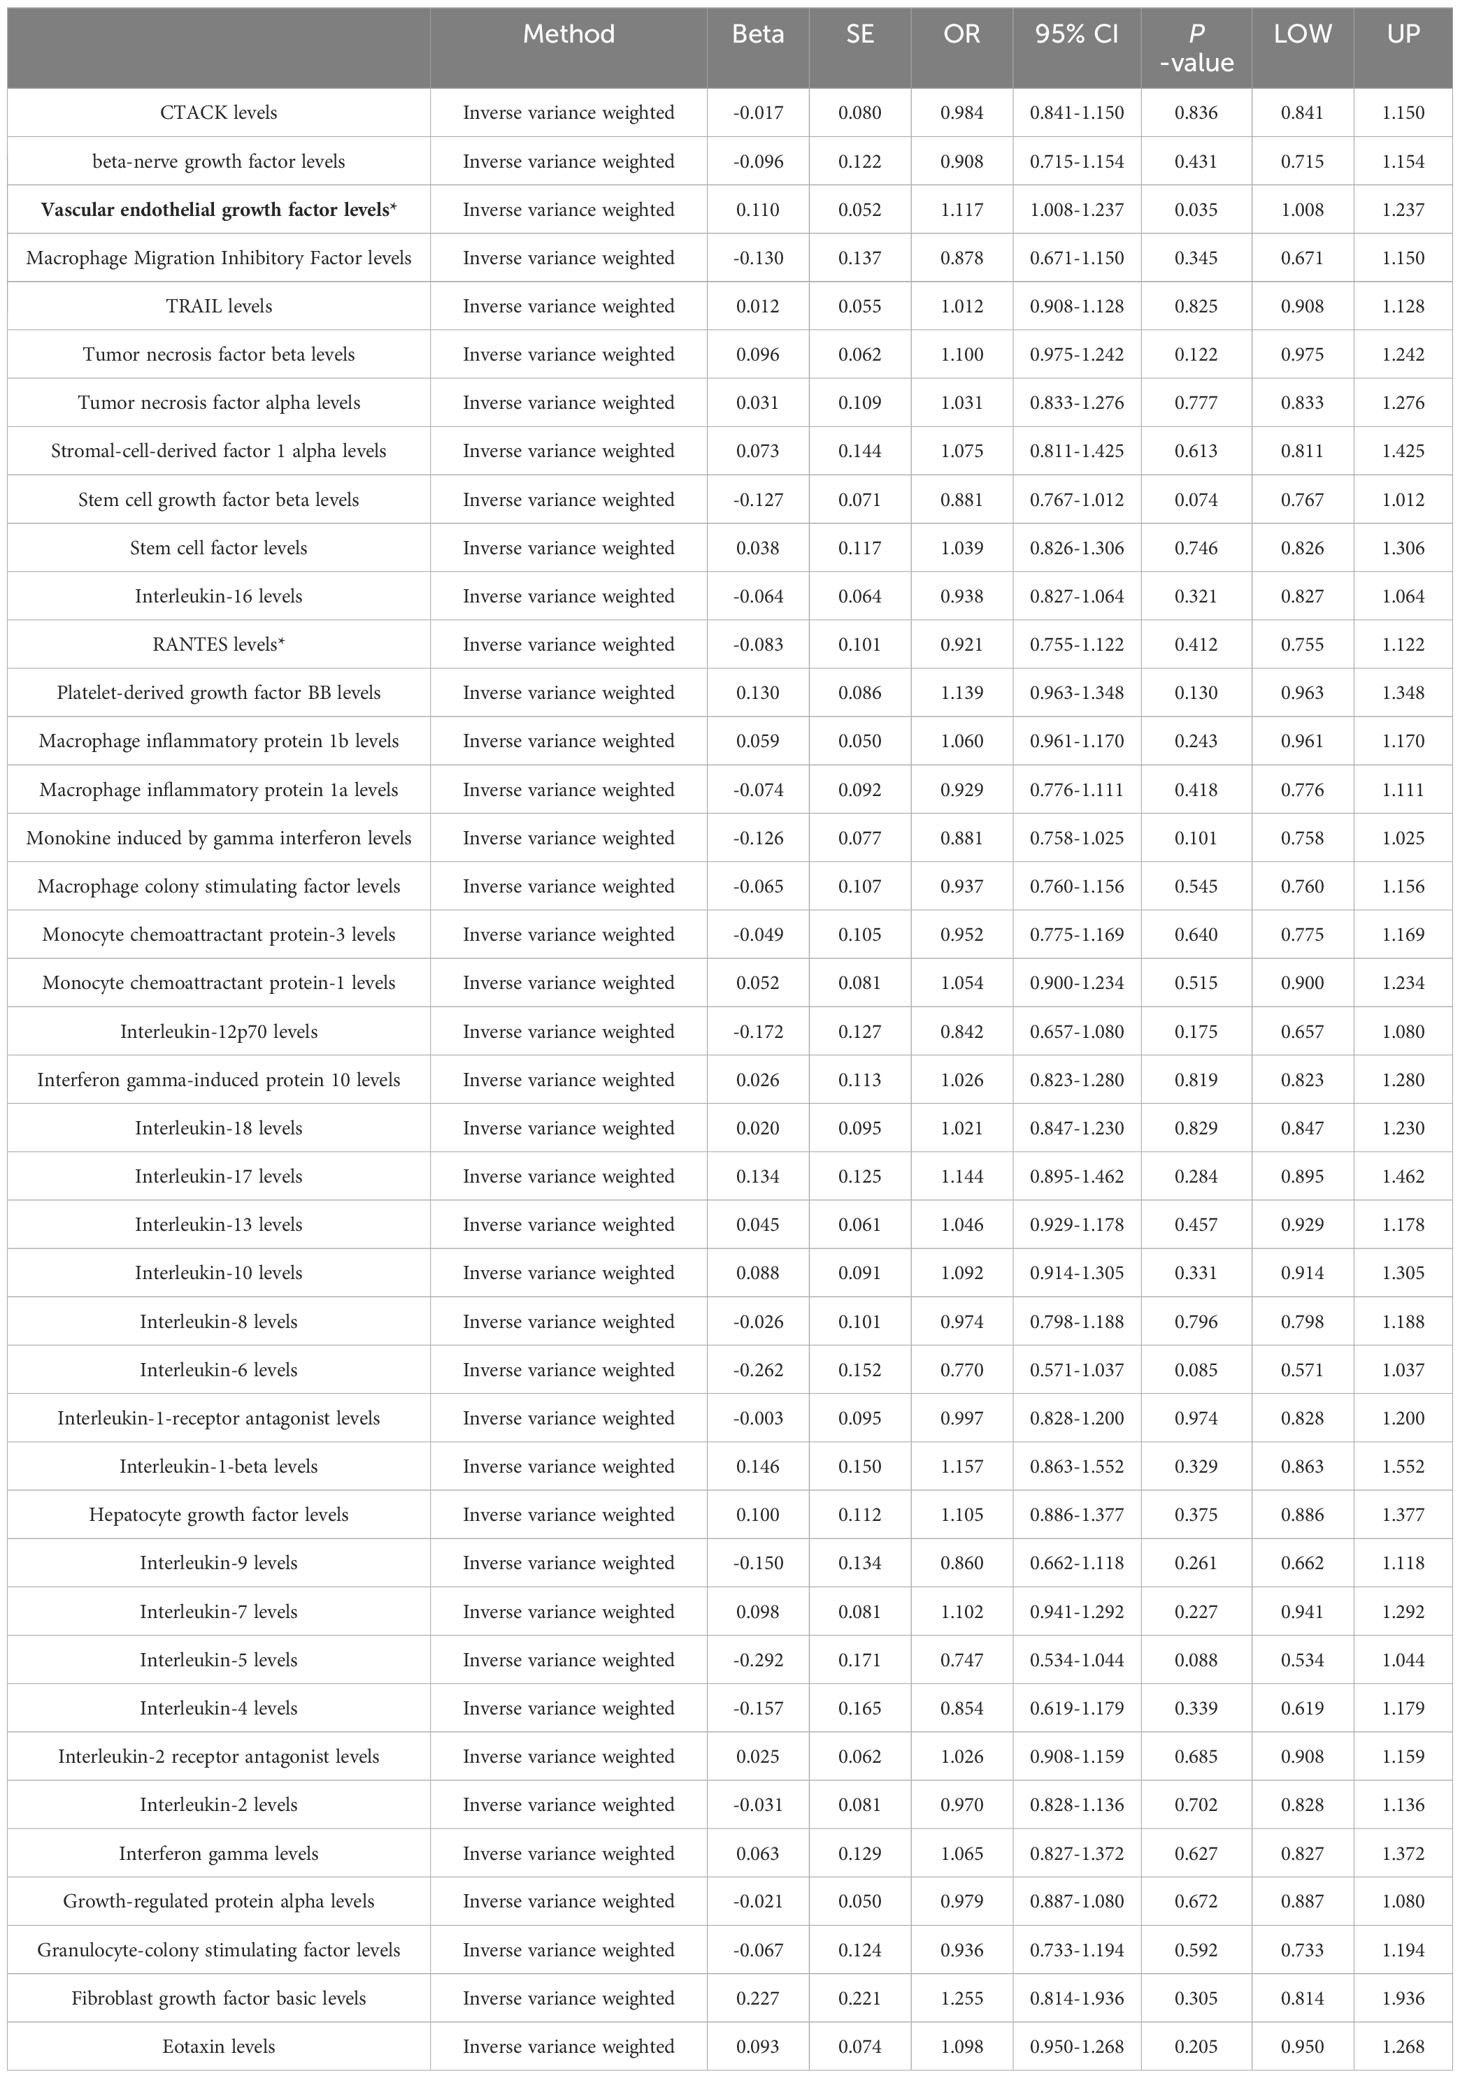
Table 4 Primary results of MR analysis on small cell lung carcinoma.
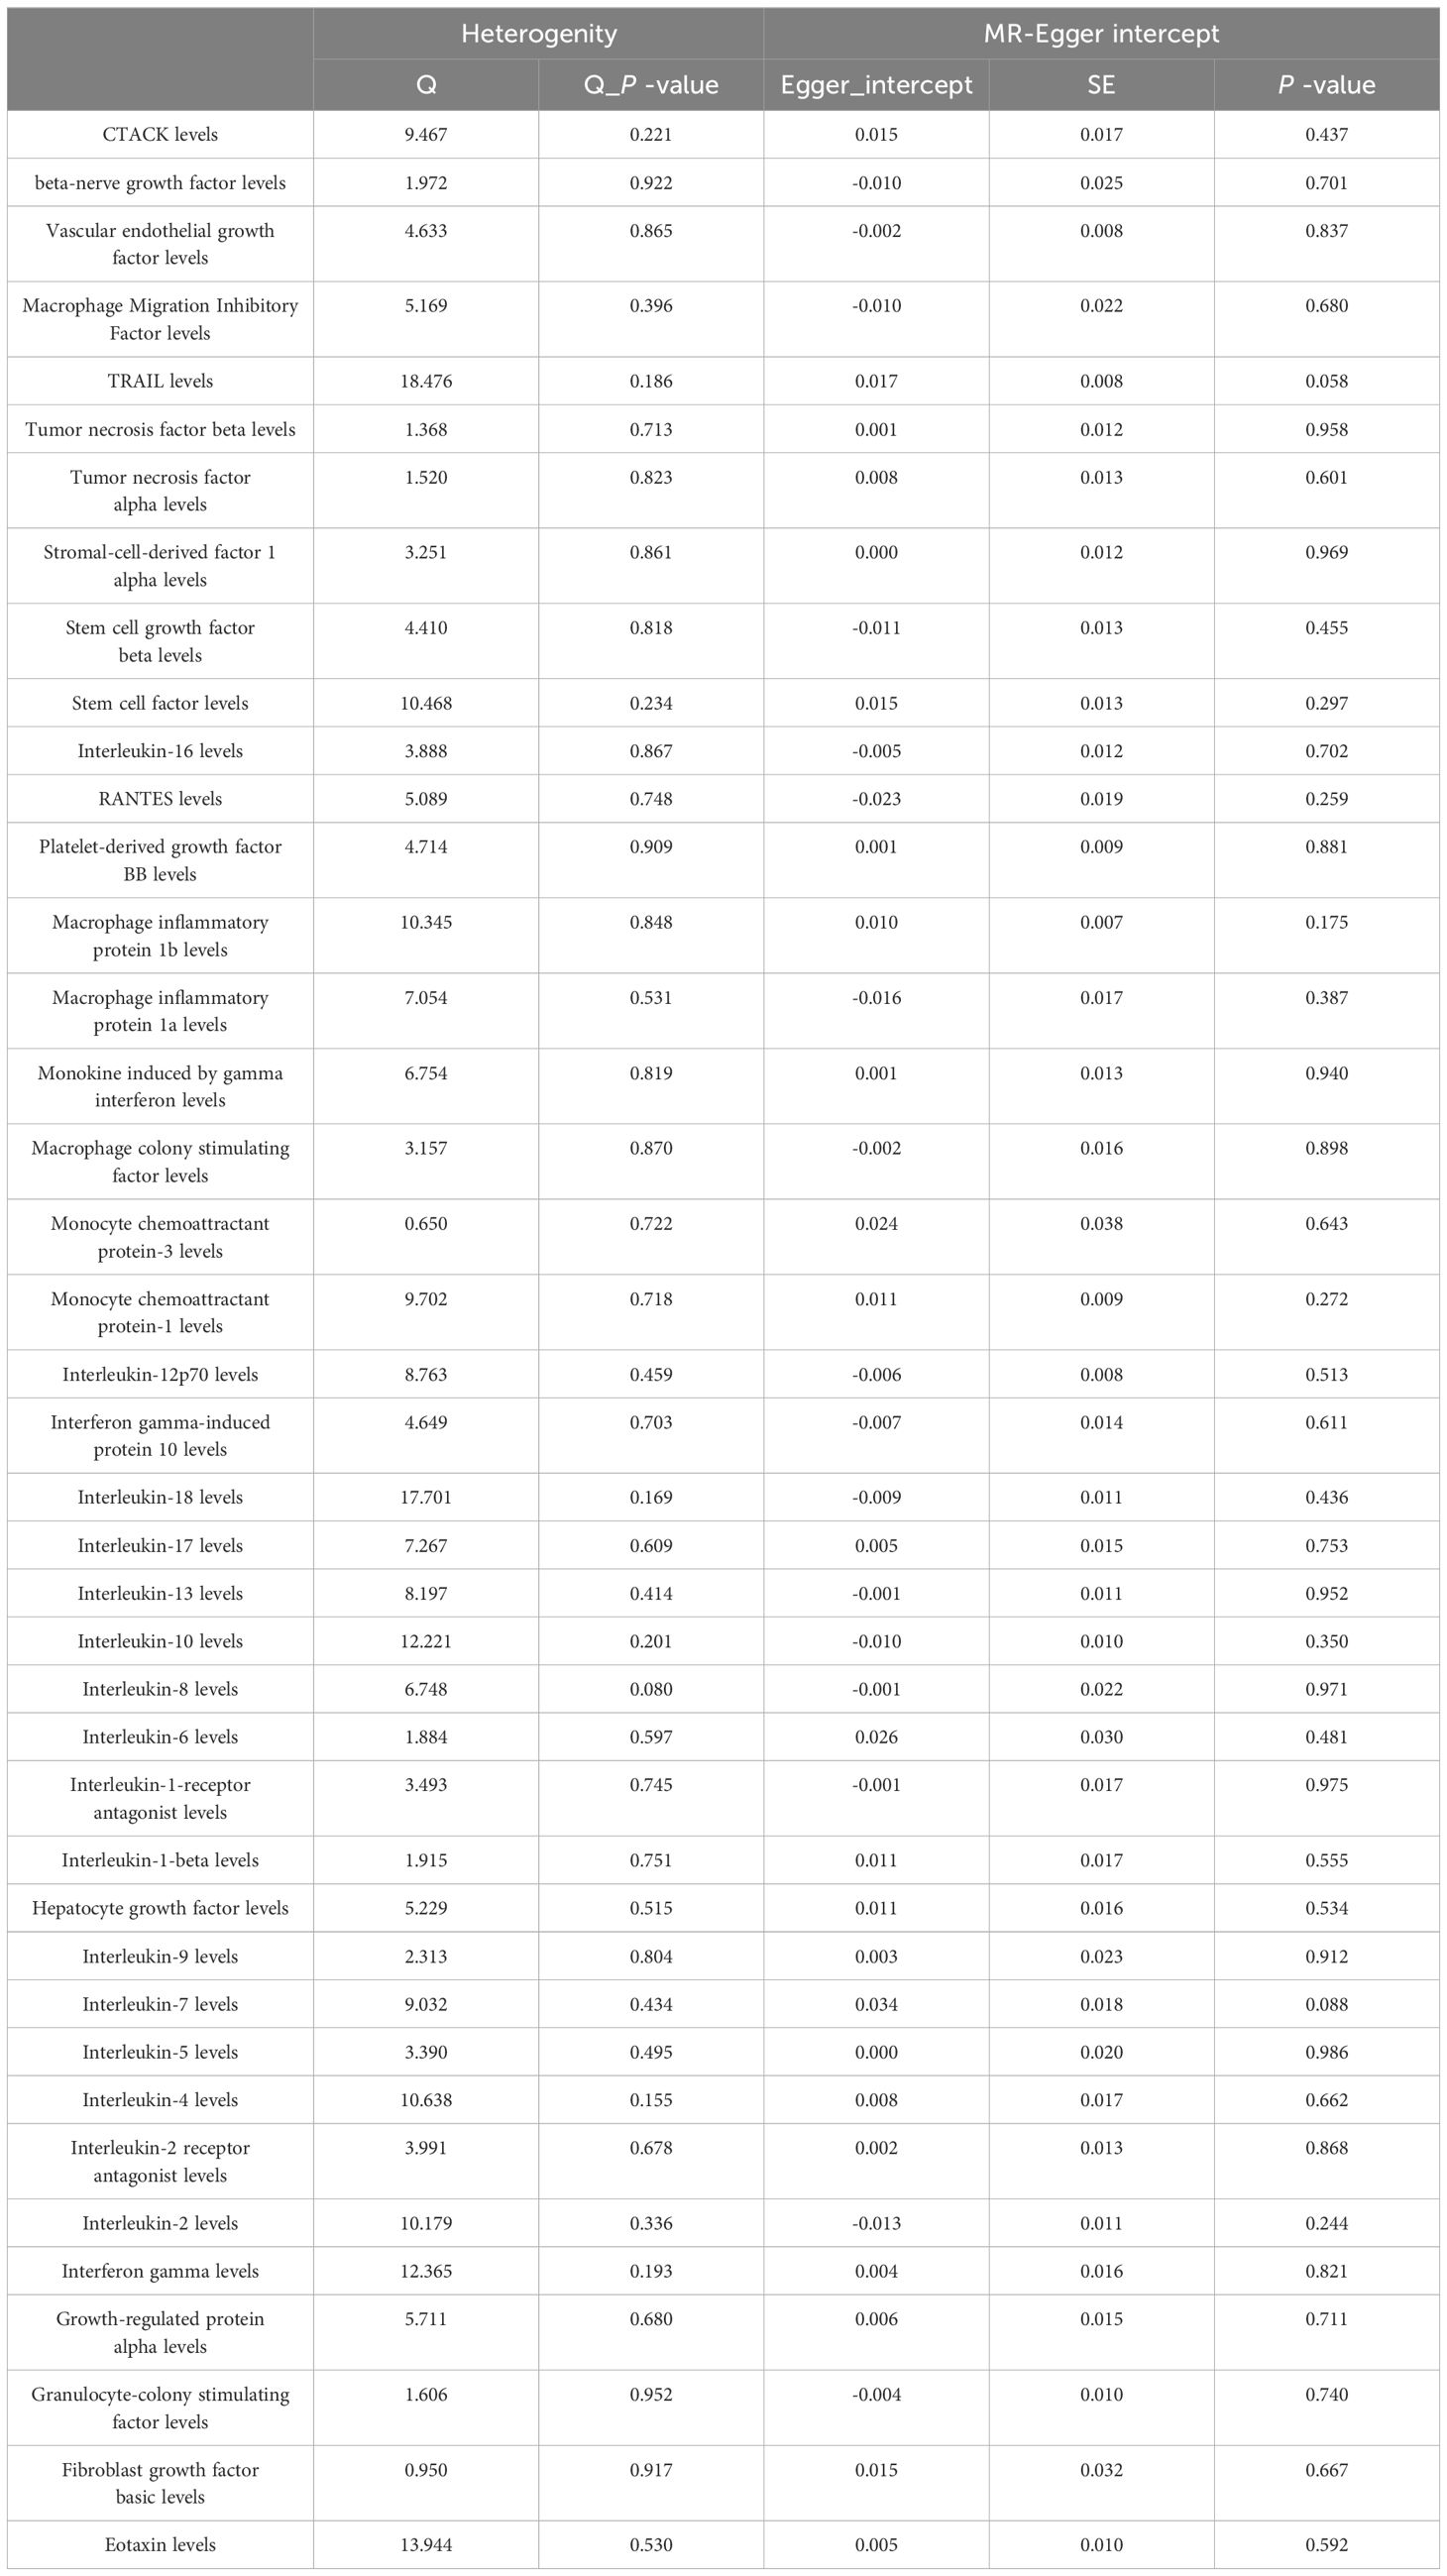
Table 5 Heterogeneity and pleiotropy analyses for lung cancer.
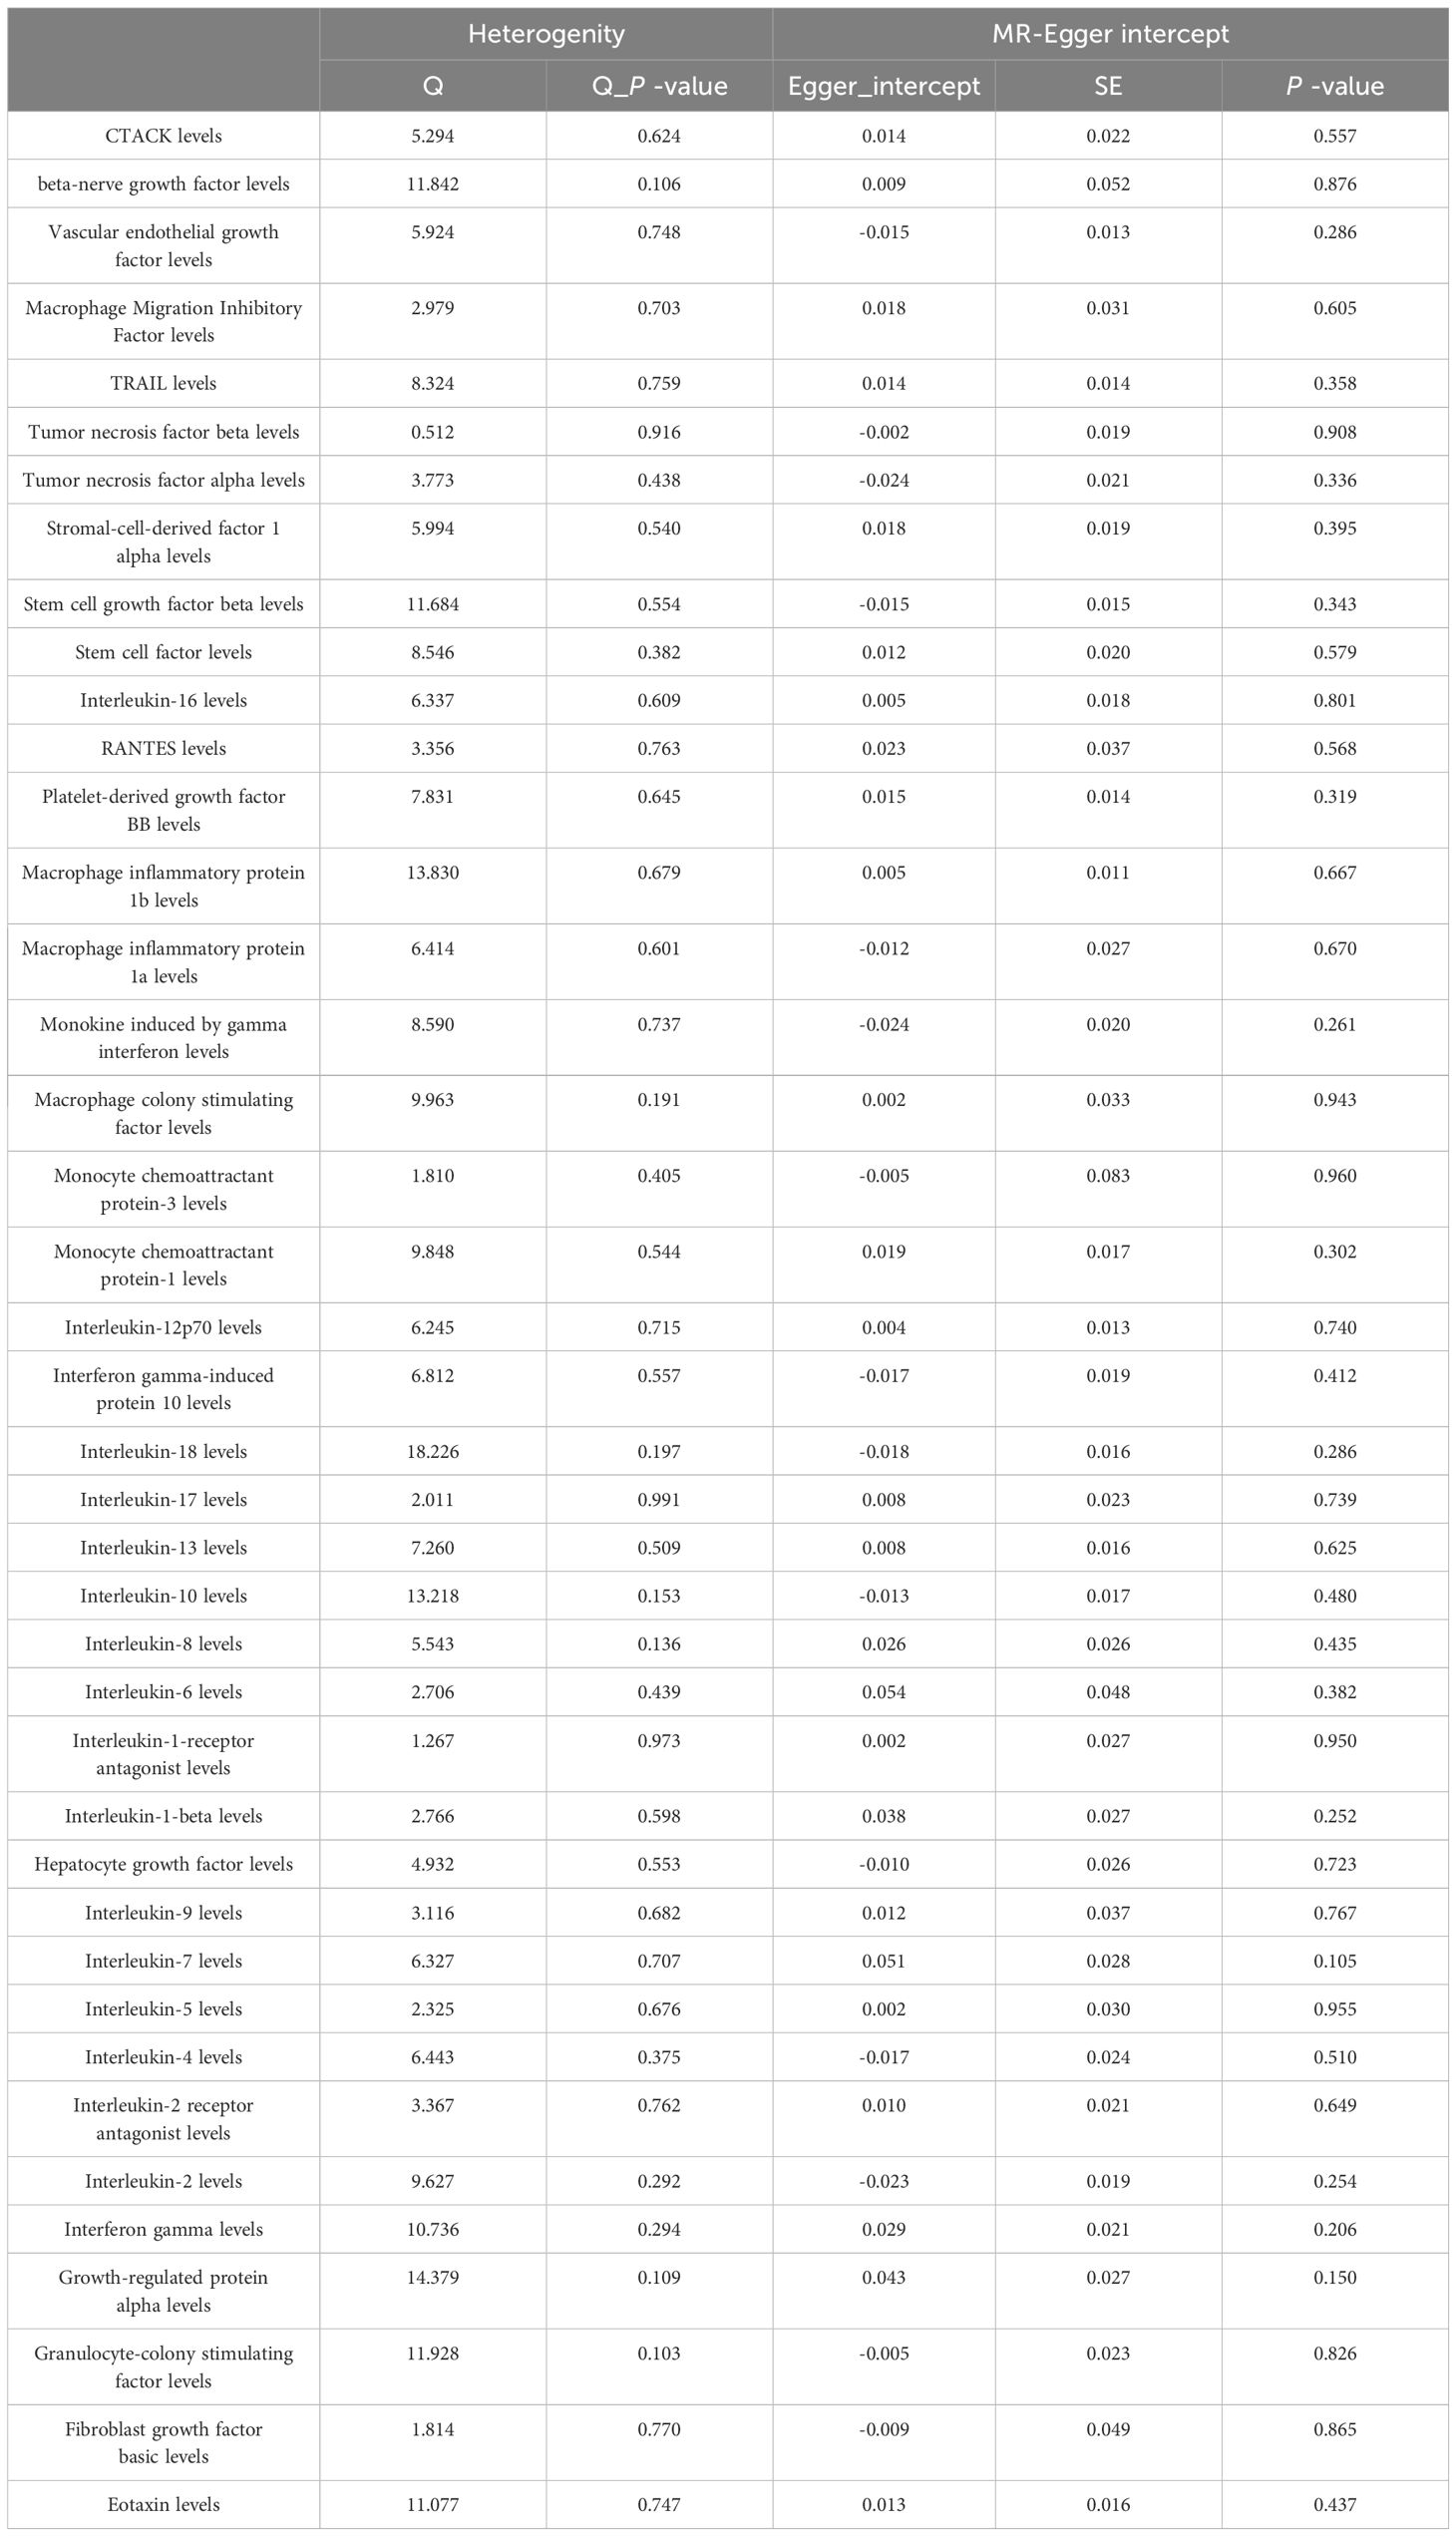
Table 6 Heterogeneity and pleiotropy analyses for squamous cell lung cancer.

Table 7 Heterogeneity and pleiotropy analyses for lung adenocarcinoma.
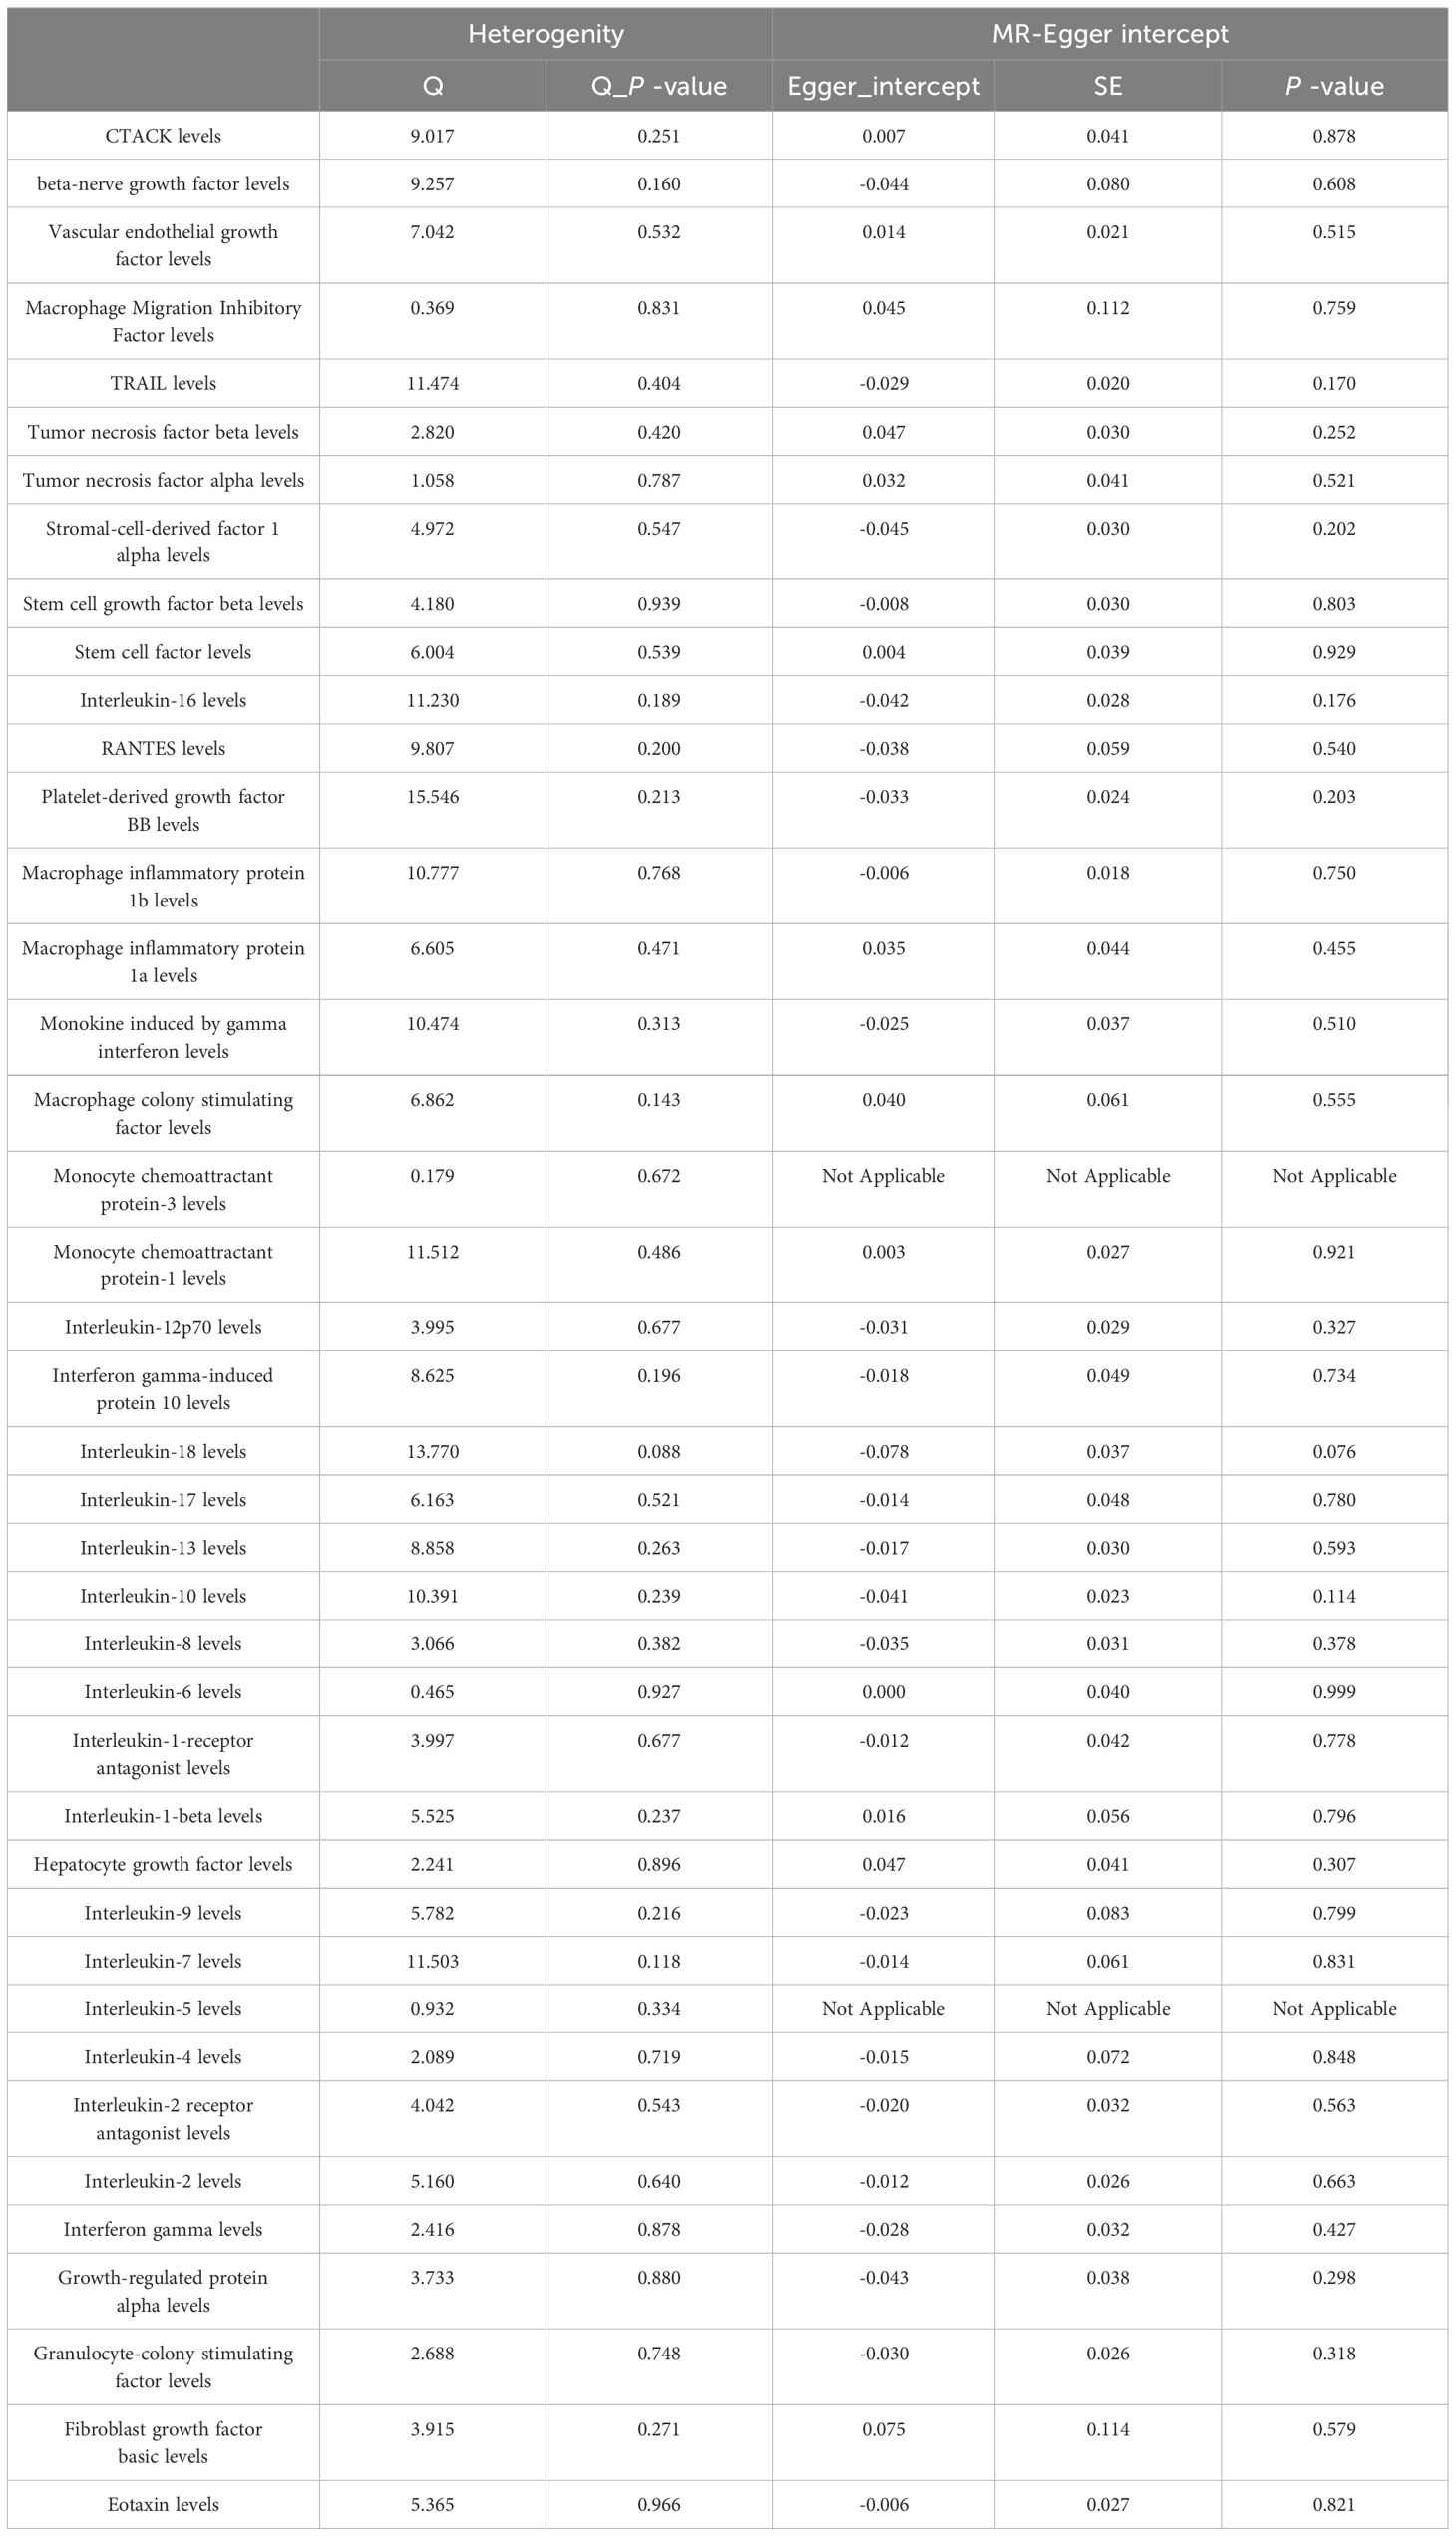
Table 8 Heterogeneity and pleiotropy analyses for small cell lung carcinoma.
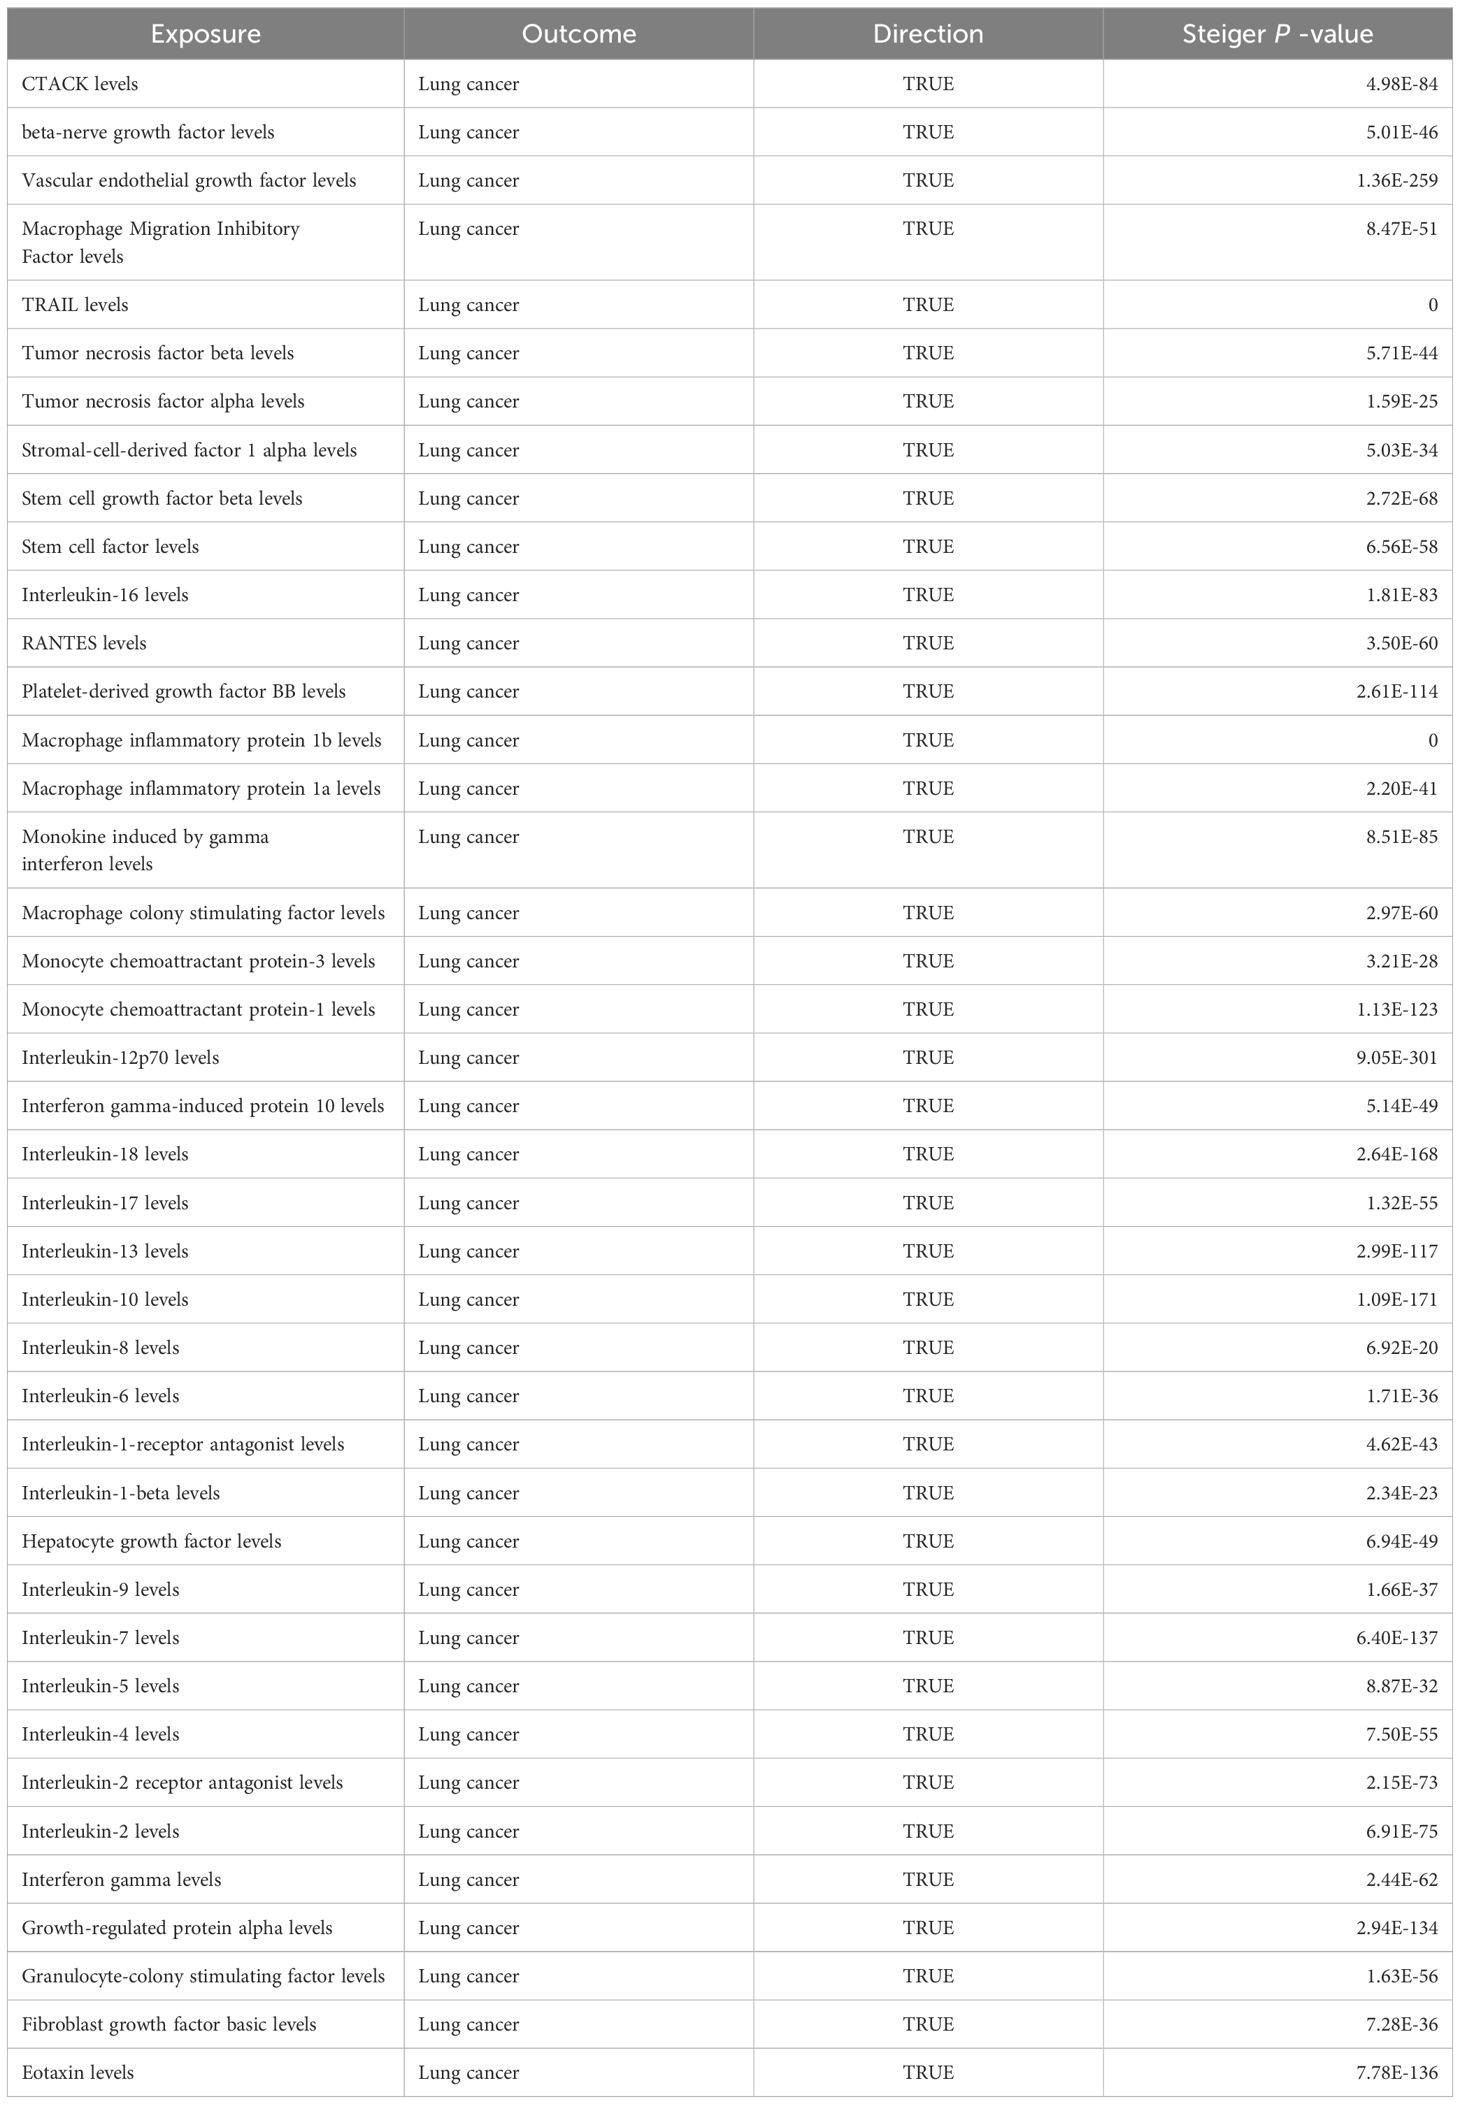
Table 9 Direction test for lung cancer.

Table 10 Direction test for squamous cell lung cancer.
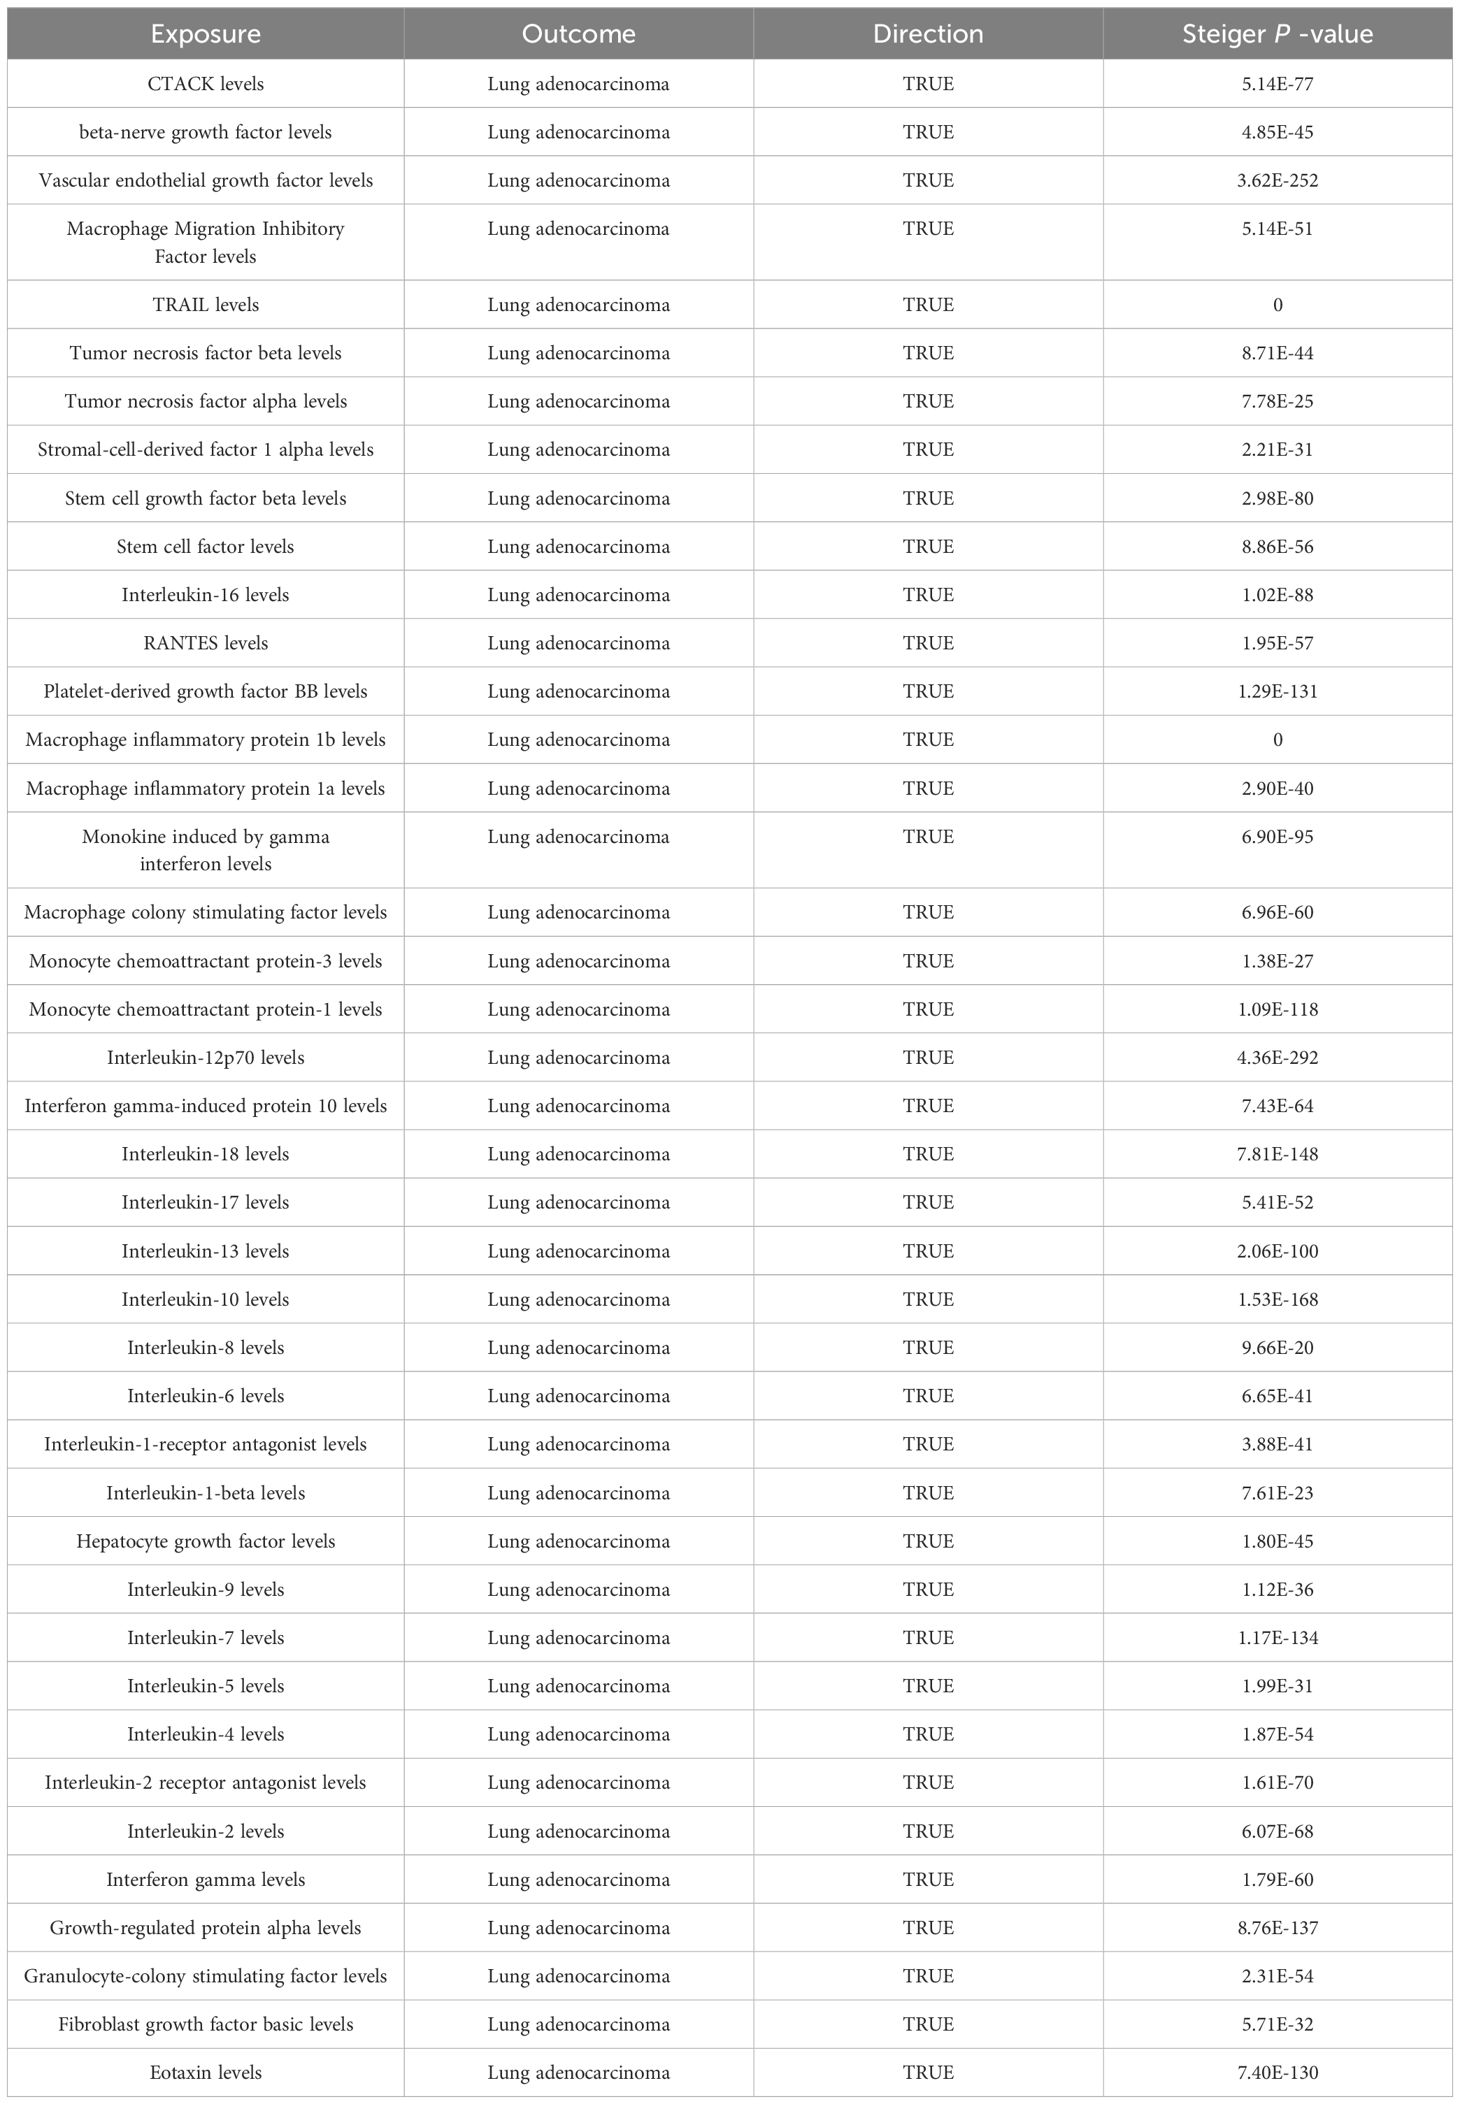
Table 11 Direction test for lung adenocarcinoma.
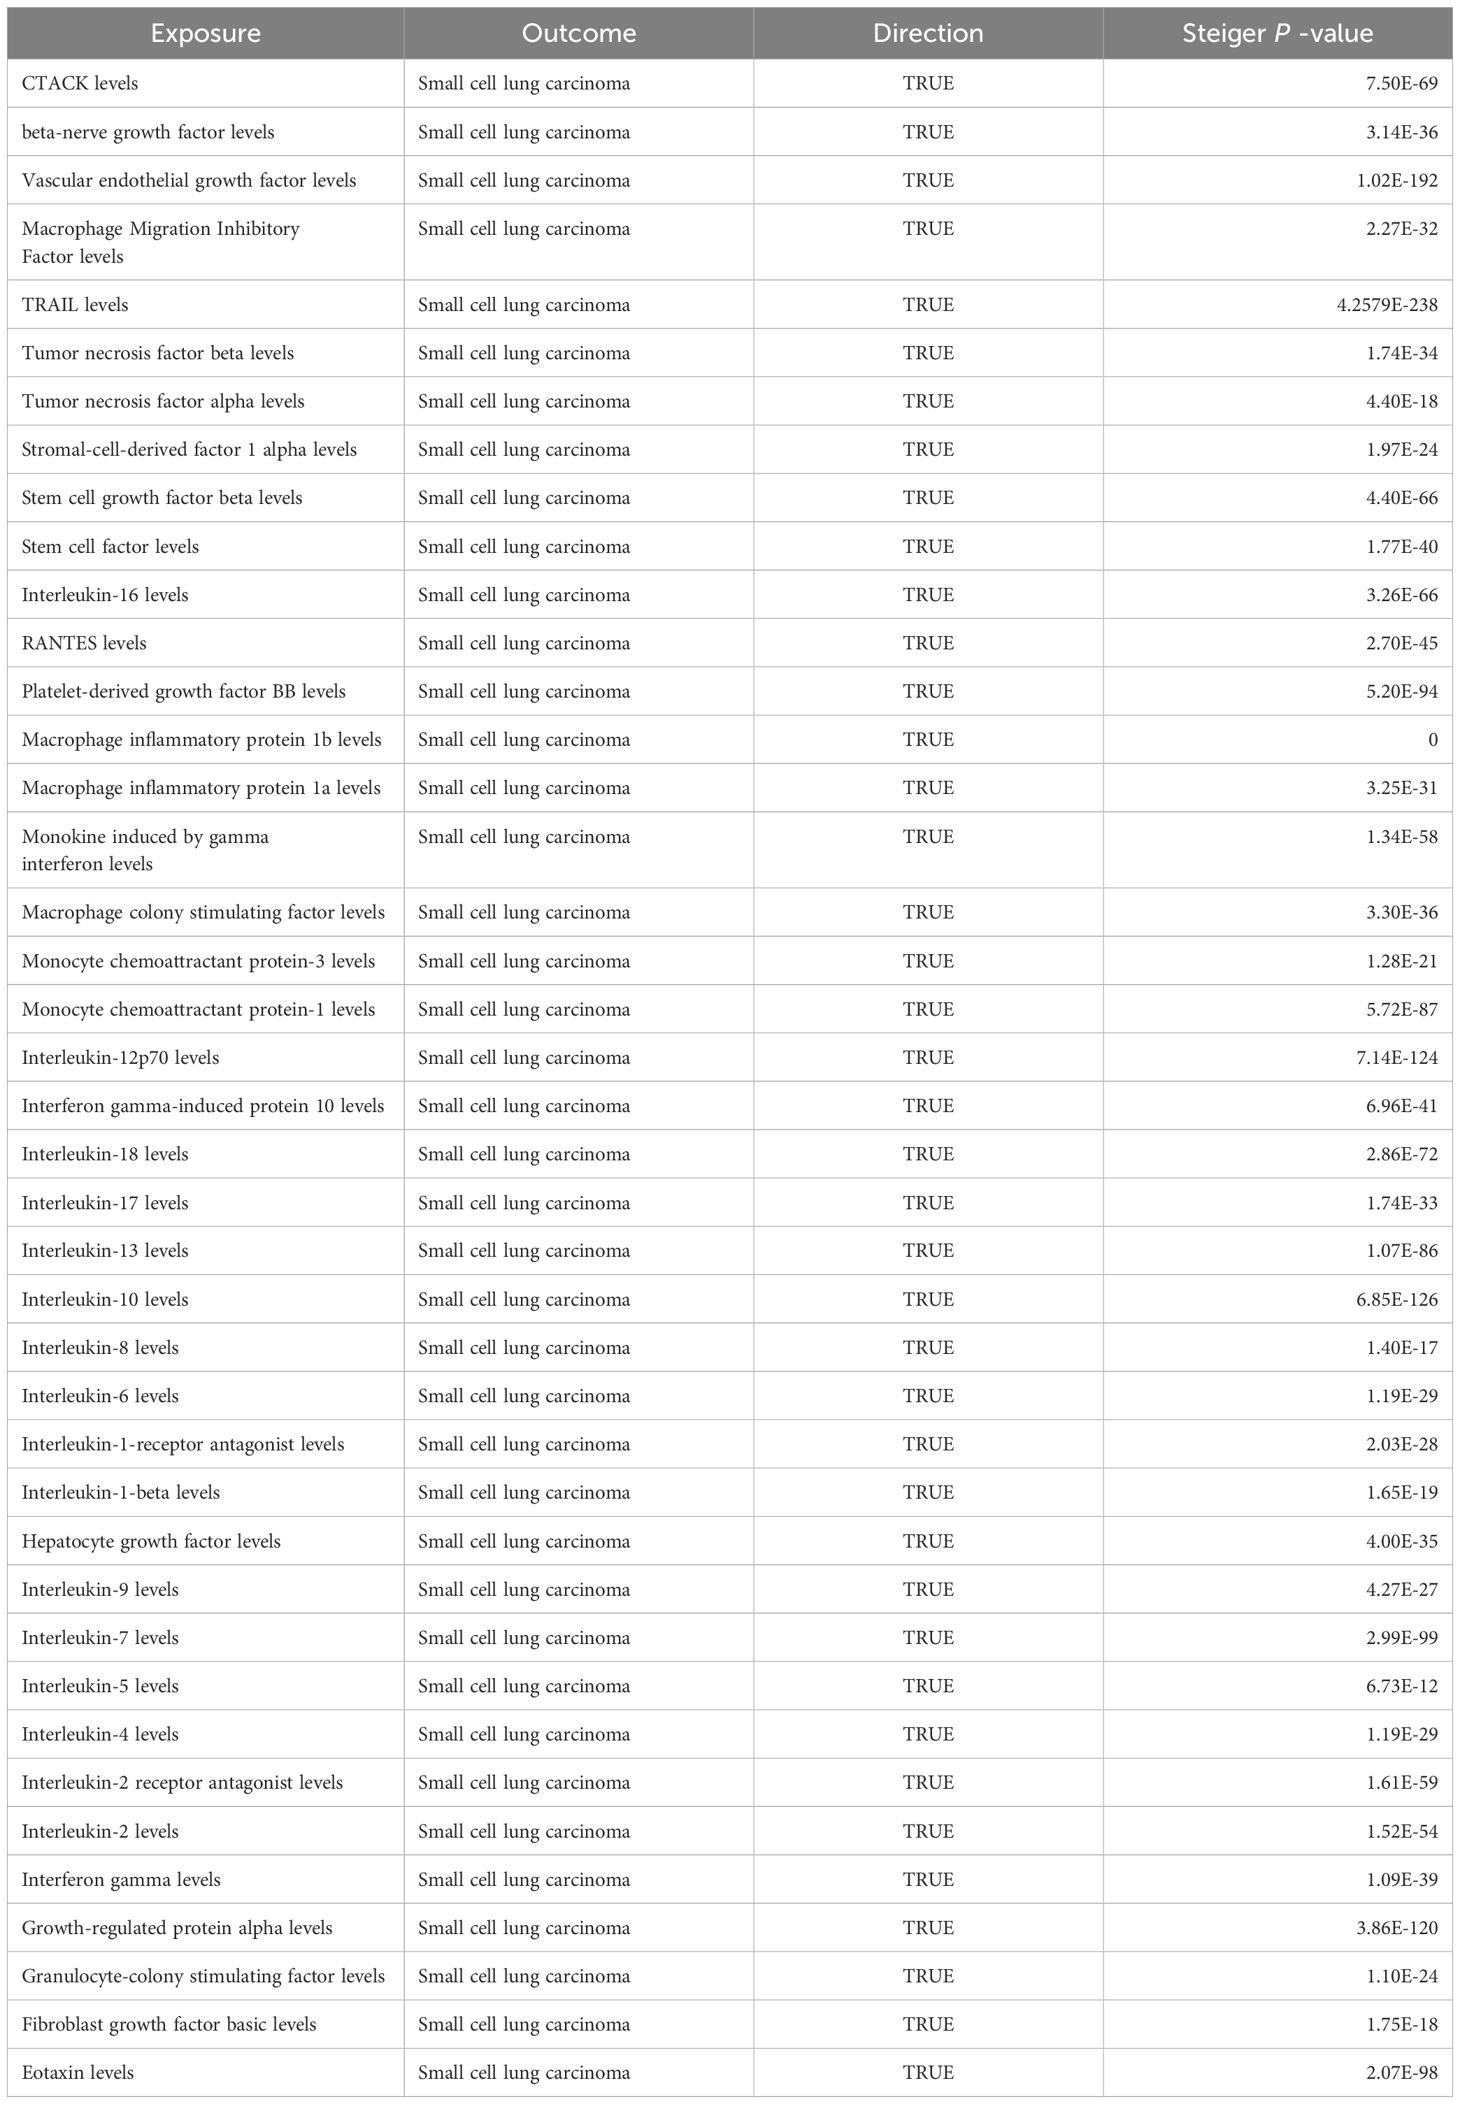
Table 12 Direction test for small cell lung carcinoma.
Subgroup analyses
Additional subgroup analyses stratified by smoking status were conducted to investigate whether the causal effect of cytokines on lung cancer risk was modified by smoking. In ever smokers, we found that interferon gamma-induced protein 10 (IP-10) (OR = 0.861, 95% CI: 0.781-0.950, P = 0.003) was inversely associated with lung cancer risk, while IL-1β (OR = 1.190, 95% CI: 1.023-1.384, P = 0.024) was positively associated with lung cancer risk (Supplementary Tables 10, 11). Scatter plots visualized the effects for each method across datasets (Supplementary Figures 7, 8). Heterogeneity tests showed no significant heterogeneity across cytokines, except for tumor necrosis factor (TNF)-α (Supplementary Table 12). MR-Egger regression revealed no evidence of horizontal pleiotropy for any cytokine (Supplementary Table 12). The MR-PRESSO outlier test confirmed significant MR findings, except for TNF-β, TNF-α, and MCP-3, due to limited SNP availability (Supplementary Table 13). Leave-one-out analysis confirmed the robustness of the causal estimates (Supplementary Figures 9, 10). Furthermore, Steiger p-values <0.05 verified the correct causal direction for all detected cytokines (Supplementary Table 14).
Among never smokers, positive association was observed between lung cancer risk and SCF (OR = 1.474, 95% CI: 1.105-1.964, P = 0.008) (Supplementary Tables 15, 16). Scatter plots visualized the effects for each method across datasets (Supplementary Figure 11). Heterogeneity was non-significant across all cytokines (Supplementary Table 17). MR-Egger and MR-PRESSO global tests showed no evidence of pleiotropy (Supplementary Tables 17, 18). The MR-PRESSO outlier test confirmed significant MR findings, except for MCP-3, IL-8, and fibroblast growth factor basic (FGF-basic), due to limited SNPs (Supplementary Table 18). Leave-one-out analysis confirmed the robustness of the causal estimates (Supplementary Figures 12). Additionally, Steiger p-values <0.05 verified the expected causal direction for all detected cytokines (Supplementary Table 19).
Discussion
In this MR study, we investigated potential causal relationships between 41 circulating cytokines and lung cancer risk. Our analysis provides preliminary evidence that genetically predicted levels of certain cytokines may influence cancer susceptibility. We identified four inflammatory mediators - SCF, IL-1β, IL-18, and IP-10 - involved in genetic susceptibility to lung cancer overall and in specific histologic subtypes, as well as differences based on smoking status. These results illuminate cytokine pathways that may promote cancer development, representing potential targets for prevention, early detection, and treatment. Our findings reveal putative causal effects of circulating cytokines in lung cancer pathogenesis and shed light on cytokine-mediated mechanisms influencing susceptibility across lung cancer subtypes and smoking strata.
Eotaxin, a chemokine, plays a pivotal role in managing a spectrum of inflammatory and immune-responsive conditions, chiefly by recruiting and activating eosinophils (30, 31). However, its specific function in lung cancer remains to be elucidated. Multiple studies have shown that eotaxin expression levels correlate with occurrence and prognosis in several cancers. Specifically, Yamaguchi et al. found lower eotaxin levels in healthy controls versus colon cancer patients, while Melisi et al. showed decreased eotaxin-2 levels in pancreatic cancer patients after treatment with a TGF-β receptor inhibitor and gemcitabine (32, 33). Additionally, Siva et al. reported reduced serum eotaxin-1 in non-small cell lung cancer patients following radiotherapy compared to radiotherapy alone, and Tsao et al. revealed an association between low serum eotaxin-1 and shorter progression-free survival in non-small cell lung cancer patients on vandetanib (34, 35). The statistical power of eotaxin was calculated to be only 67% and had a non-significant p-value after Bonferroni correction. In summary, although eotaxin is closely linked to pathogenesis and prognosis in some cancers, further research is warranted to elucidate its precise role in lung cancer. SCF activates the c-Kit signaling pathway to stimulate lung cancer cell proliferation, migration and invasion (36). In vitro experiments show SCF promotes lung cancer cell proliferation, migration and metastasis (37–39). Moreover, clinical studies find elevated SCF and c-Kit expression correlates with lung cancer progression and metastasis (40, 41). IL-1β advances lung cancer progression through numerous mechanisms including inducing angiogenic factors like VEGF, activating oncogenic signaling, and promoting immunosuppression and inflammation (42–44). Mechanistically, IL-1β spurs tumor growth by activating MAPK/NF-κB pathways, recruiting immunosuppressive cells, promoting inflammation, angiogenesis, invasion and metastasis, downregulating tumor suppressors, upregulating oncogenes, and enabling immune evasion and inhibition of apoptosis (45). Preclinical studies also demonstrate beneficial effects of IL-1β knockdown and inhibition. No inflammation or angiogenesis occurred in IL-1β-deficient mice, and IL-1β-deficient mice showed no local tumor growth or lung metastasis compared to wild-type mice (46). Moreover, IL-1β antibody treatment inhibited tumor progression and boosted antitumor immunity in mice by reducing inflammation and promoting M1 macrophage maturation (47). VEGF is a pivotal driver of angiogenesis in lung cancer, promoting tumor growth and metastasis (48). Furthermore, IL-1β induces VEGF secretion, which also spurs tumor expansion and spread (49). In lung cancer, VEGF overexpression critically supports angiogenesis and correlates with disease progression and prognosis (50). Multiple studies demonstrate VEGF inhibition slows lung cancer growth and improves chemotherapy efficacy (51, 52). Anti-VEGF monoclonal antibody therapies including bevacizumab are now widely used in lung cancer treatment (53). Similarly, the calculated statistical power of VEGF is only 21%.
In contrast, increased genetic predisposition to higher interleukin-18 (IL-18) and interferon gamma-induced protein 10 (IP-10) levels are negatively associated with lung cancer risk. IL-18, a pro-inflammatory cytokine, plays a significant role in anti-tumor immunity through several mechanisms. Firstly, IL-18 activates natural killer (NK) cells and certain subsets of T cells, enhancing their cytotoxic activity against tumor cells by upregulating cytotoxic molecules such as perforin and granzymes, which are crucial for direct tumor cell killing (54). Secondly, IL-18 stimulates the production of key anti-tumor cytokines, notably interferon-gamma (IFN-γ), which has potent anti-tumor effects, including the inhibition of tumor cell proliferation, induction of tumor cell apoptosis, and enhancement of antigen presentation to help the immune system better recognize and target tumor cells (55). Thirdly, IL-18 facilitates the infiltration of immune cells, particularly T cells and NK cells, into the tumor microenvironment, thereby enhancing the overall immune response against the tumor (56). Additionally, IL-18 promotes the differentiation of T cells towards a Th1 phenotype; Th1 cells produce IFN-γ and activate macrophages and other immune cells that contribute to anti-tumor immunity, making this shift towards a Th1-dominated response crucial for effective anti-tumor activity (57, 58). Furthermore, IL-18 often works synergistically with other cytokines and immune signals to amplify the immune response, significantly boosting IFN-γ production and enhancing the cytotoxic activity of NK cells and T cells when combined with IL-12 (59, 60). IL-18 also exhibits anti-angiogenic and pro-lymphangiogenic properties that contribute to its anti-tumor activity (57). However, Jiang et al. found that IL-18 may promote metastasis by inhibiting E-cadherin expression (58). Conversely, experimental studies by Xiong et al. and Chen et al. demonstrated that IL-18 inhibited tumor proliferation and growth, enhanced apoptosis, and normalized the Th1/Th2 imbalance (59, 60).
In contrast, increased genetic predisposition to higher levels of interleukin-18 (IL-18) and interferon gamma-induced protein 10 (IP-10) is negatively associated with lung cancer risk. IL-18, a pro-inflammatory cytokine, plays a significant role in anti-tumor immunity through several mechanisms. Firstly, IL-18 activates natural killer (NK) cells and certain subsets of T cells, enhancing their cytotoxic activity against tumor cells by upregulating cytotoxic molecules such as perforin and granzymes, which are crucial for direct tumor cell killing (54). Secondly, IL-18 stimulates the production of key anti-tumor cytokines, notably interferon-gamma (IFN-γ), which has potent anti-tumor effects, including the inhibition of tumor cell proliferation, induction of tumor cell apoptosis, and enhancement of antigen presentation to help the immune system better recognize and target tumor cells (55). Thirdly, IL-18 facilitates the infiltration of immune cells, particularly T cells and NK cells, into the tumor microenvironment, thereby enhancing the overall immune response against the tumor (56). Additionally, IL-18 promotes the differentiation of T cells towards a Th1 phenotype; Th1 cells produce IFN-γ and activate macrophages and other immune cells that contribute to anti-tumor immunity, making this shift towards a Th1-dominated response crucial for effective anti-tumor activity (57, 58). Finally, IL-18 often works synergistically with other cytokines and immune signals to amplify the immune response, significantly boosting IFN-γ production and enhancing the cytotoxic activity of NK cells and T cells when combined with IL-12 (59, 60). IL-18 also has anti-angiogenic and pro-lymphangiogenic properties contributing to its anti-tumor activity (61). However, Jiang et al. found that IL-18 may promote metastasis by inhibiting E-cadherin expression (62). Conversely, experimental studies by Xiong et al. and Chen et al. demonstrated that IL-18 inhibited tumor proliferation and growth, enhanced apoptosis, and normalized the Th1/Th2 imbalance (63, 64). IP-10 attracts immune cells to tumors, inhibits angiogenesis, and reduces tumor burden (65). Previous studies confirm IP-10 participates in anti-tumor immunity by promoting immune cell migration to tumors, inducing apoptosis, and suppressing angiogenesis (66–69). In xenograft models of lymphoma, squamous cell carcinoma, and lung adenocarcinoma, CXCL10 production negatively correlated with tumor growth and significantly reduced tumor-associated angiogenesis (70). In advanced endometrial cancer, CXCL10 was shown to antagonize fibroblast growth factor action, thereby inhibiting angiogenesis. In estrogen receptor-positive breast tumors, CXCL10 inhibits vascular endothelial growth factor levels to reduce tumor burden (71).
We utilized Mendelian randomization to evaluate associations between circulating cytokines and lung cancer risk. Contrary to a prior study by Bouras et al. showing positive CTACK-nonsmoking lung cancer and negative IL-18-lung cancer/adenocarcinoma relationships (72), we found no evidence for CTACK-nonsmoking lung cancer or IL-18-adenocarcinoma associations, potentially attributable to divergent instrument variable selection and GWAS data pooling. Notably, our analysis revealed novel causal links between SCF, IL-1β, IL-18, and IP-10 in overall lung cancer as well as specific histological subtypes, highlighting important etiological roles for these cytokines. However, some limitations should be considered. First, the relaxed IV significance threshold of P < 5×10⁻⁶ introduces possible false positives and bias, although the consistent F-statistics >10 suggest weak instrument bias is less likely. Second, the single Finnish ethnicity limits generalizability to other populations. Third, no cytokines were statistically significantly associated with cancer risk or subtypes after Bonferroni correction, including six inflammatory factors with suggestive correlations - Eotaxin, SCF, IL-1β, VEGF, IL-18, and IP-10. However, excluding Eotaxin and VEGF, the other factors (SCF, IL-1β, IL-18, and IP-10) had statistical power over 80% but still require validation of these potential associations in larger cohorts and GWAS. Fourth, while efforts were made to mitigate confounding, pleiotropy cannot be completely ruled out. Finally, while not addressed here, inflammatory factors may influence lung cancer progression and survival rather than development. Therefore, further studies should analyze the role of inflammatory factors in lung cancer aggressiveness.
Conclusion
This MR study found preliminary evidence that genetically predicted levels of four inflammatory cytokines—SCF, IL-1β, IL-18, and IP-10—may causally influence lung cancer risk overall, in specific histologic subtypes, and stratified by smoking status. The identification of these cytokine pathways, which may promote lung carcinogenesis, represents potential new targets for the prevention, early detection, and treatment of lung cancer. Overall, these findings reveal putative causal effects of circulating cytokines in lung cancer pathogenesis, illuminating cytokine-mediated immunological mechanisms affecting susceptibility across lung cancer subtypes and smoking exposure groups.
Data availability statement
The original contributions presented in the study are included in the article/Supplementary Material, further inquiries can be directed to the corresponding authors.
Author contributions
DL: Data curation, Formal analysis, Writing – original draft. ZG: Data curation, Formal analysis, Writing – original draft. QZ: Data curation, Formal analysis, Writing – original draft, Writing – review & editing. SL: Conceptualization, Data curation, Formal analysis, Funding acquisition, Writing – original draft, Writing – review & editing.
Funding
The author(s) declare financial support was received for the research, authorship, and/or publication of this article. This work was supported by the Key Project of the Affiliated Hospital of North Sichuan Medical College (2023ZD008).
Conflict of interest
The authors declare that the research was conducted in the absence of any commercial or financial relationships that could be construed as a potential conflict of interest.
Publisher’s note
All claims expressed in this article are solely those of the authors and do not necessarily represent those of their affiliated organizations, or those of the publisher, the editors and the reviewers. Any product that may be evaluated in this article, or claim that may be made by its manufacturer, is not guaranteed or endorsed by the publisher.
Supplementary material
The Supplementary Material for this article can be found online at: https://www.frontiersin.org/articles/10.3389/fonc.2024.1373380/full#supplementary-material
Supplementary Figure 1 | Scatter plot of IL-18 levels on lung cancer.
Supplementary Figure 2 | Scatter plot of SCF levels on lung lung adenocarcinoma.
Supplementary Figure 3 | Scatter plot of IL-1β levels on lung lung adenocarcinoma.
Supplementary Figure 4 | Leave-one-out plot of IL-1β levels on lung cancer.
Supplementary Figure 5 | Leave-one-out plot of SCF levels on lung adenocarcinoma.
Supplementary Figure 6 | Leave-one-out plot of IL-1β levels on lung adenocarcinoma.
Supplementary Figure 7 | Scatter plot of IP-10 levels on lung cancer in ever smokers.
Supplementary Figure 8 | Scatter plot of IL-1β levels on lung cancer in ever smokers.
Supplementary Figure 9 | Leave-one-out plot of IP-10 levels on lung cancer in ever smokers.
Supplementary Figure 10 | Leave-one-out plot of IL-1β levels on lung cancer in ever smokers.
Supplementary Figure 11 | Scatter plot of SCF levels on lung cancer in never smokers.
Supplementary Figure 12 | Leave-one-out plot of SCF levels on lung cancer in never smokers.
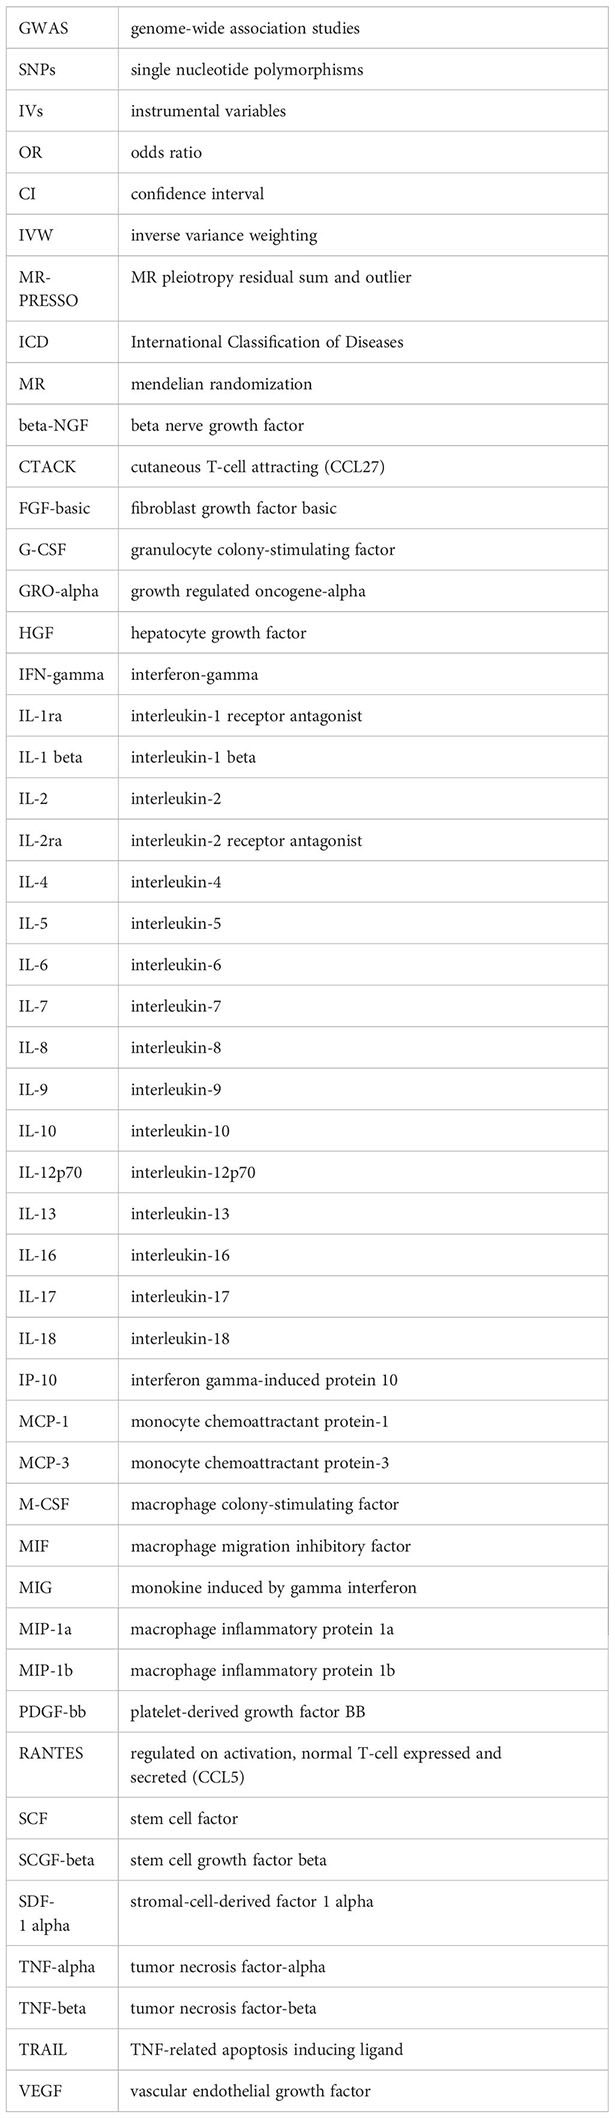
Abbreviations
References
1. Bray F, Laversanne M, Sung H, Ferlay J, Siegel RL, Soerjomataram I, et al. Global cancer statistics 2022: GLOBOCAN estimates of incidence and mortality worldwide for 36 cancers in 185 countries. CA Cancer J Clin. (2024) 74:229–63. doi: 10.3322/caac.21834
2. Allemani C, Matsuda T, Di Carlo V, Harewood R, Matz M, Nikšić M, et al. Global surveillance of trends in cancer survival 2000–14 (CONCORD-3): analysis of individual records for 37 513 025 patients diagnosed with one of 18 cancers from 322 population-based registries in 71 countries. Lancet. (2018) 391:1023–75. doi: 10.1016/S0140-6736(17)33326-3
3. Cannon-Albright LA, Carr SR, Akerley W. Population-based relative risks for lung cancer based on complete family history of lung cancer. J Thorac Oncol. (2019) 14:1184–91. doi: 10.1016/j.jtho.2019.04.019
4. Larsson SC, Carter P, Kar S, Vithayathil M, Mason AM, Michaëlsson K, et al. Smoking, alcohol consumption, and cancer: A mendelian randomisation study in UK Biobank and international genetic consortia participants. PloS Med. (2020) 17:e1003178. doi: 10.1371/journal.pmed.1003178
5. Elinav E, Nowarski R, Thaiss CA, Hu B, Jin C, Flavell RA. Inflammation-induced cancer: crosstalk between tumours, immune cells and microorganisms. Nat Rev Cancer. (2013) 13:759–71. doi: 10.1038/nrc3611
6. Aggarwal BB, Shishodia S, Sandur SK, Pandey MK, Sethi G. Inflammation and cancer: how hot is the link? Biochem Pharmacol. (2006) 72:1605–21. doi: 10.1016/j.bcp.2006.06.029
7. Candido J, Hagemann T. Cancer-related inflammation. J Clin Immunol. (2013) 33 Suppl 1:S79–84. doi: 10.1007/s10875-012-9847-0
8. Qu X, Tang Y, Hua S. Immunological approaches towards cancer and inflammation: A cross talk. Front Immunol. (2018) 9:563. doi: 10.3389/fimmu.2018.00563
9. Mantovani A, Allavena P, Sica A, Balkwill F. Cancer-related inflammation. Nature. (2008) 454:436–44. doi: 10.1038/nature07205
10. Aggarwal BB, Vijayalekshmi RV, Sung B. Targeting inflammatory pathways for prevention and therapy of cancer: short-term friend, long-term foe. Clin Cancer Res. (2009) 15:425–30. doi: 10.1158/1078-0432.CCR-08-0149
11. Yu H, Kortylewski M, Pardoll D. Crosstalk between cancer and immune cells: role of STAT3 in the tumour microenvironment. Nat Rev Immunol. (2007) 7:41–51. doi: 10.1038/nri1995
12. Zou W. Immunosuppressive networks in the tumour environment and their therapeutic relevance. Nat Rev Cancer. (2005) 5:263–74. doi: 10.1038/nrc1586
13. Burgess S, Butterworth A, Thompson SG. Mendelian randomization analysis with multiple genetic variants using summarized data. Genet Epidemiol. (2013) 37:658–65. doi: 10.1002/gepi.21758
14. Emdin CA, Khera AV, Kathiresan S. Mendelian randomization. JAMA. (2017) 318:1925–6. doi: 10.1001/jama.2017.17219
15. Davey Smith G, Holmes MV, Davies NM, Ebrahim S. Mendel's laws, Mendelian randomization and causal inference in observational data: substantive and nomenclatural issues. Eur J Epidemiol. (2020) 35:99–111. doi: 10.1007/s10654-020-00622-7
16. Ahola-Olli AV, Würtz P, Havulinna AS, Aalto K, Pitkänen N, Lehtimäki T, et al. Genome-wide association study identifies 27 loci influencing concentrations of circulating cytokines and growth factors. Am J Hum Genet. (2017) 100:40–50. doi: 10.1016/j.ajhg.2016.11.007
17. McKay JD, Hung RJ, Han Y, Zong X, Carreras-Torres R, Christiani DC, et al. Large-scale association analysis identifies new lung cancer susceptibility loci and heterogeneity in genetic susceptibility across histological subtypes. Nat Genet. (2017) 49:1126–32. doi: 10.1038/ng.3892
18. Luo J, le Cessie S, Blauw GJ, Franceschi C, Noordam R, van Heemst D. Systemic inflammatory markers in relation to cognitive function and measures of brain atrophy: a Mendelian randomization study. Geroscience. (2022) 44:2259–70. doi: 10.1007/s11357-022-00602-7
19. Lin S, Mao X, He W. Causal association of circulating cytokines with sepsis: a Mendelian randomization study. Front Immunol. (2023) 14:1281845. doi: 10.3389/fimmu.2023.1281845
20. Kamat MA, Blackshaw JA, Young R, Surendran P, Burgess S, Danesh J, et al. PhenoScanner V2: an expanded tool for searching human genotype-phenotype associations. Bioinformatics. (2019) 35:4851–3. doi: 10.1093/bioinformatics/btz469
21. Burgess S, Thompson SG, CRP CHD Genetics Collaboration. Avoiding bias from weak instruments in Mendelian randomization studies. Int J Epidemiol. (2011) 40:755–64. doi: 10.1093/ije/dyr036
22. Bowden J, Del Greco MF, Minelli C, Zhao Q, Lawlor DA, Sheehan NA, et al. Improving the accuracy of two-sample summary-data Mendelian randomization: moving beyond the NOME assumption. Int J Epidemiol. (2019) 48:728–42. doi: 10.1093/ije/dyy258
23. Bowden J, Davey Smith G, Haycock PC, Burgess S. Consistent estimation in mendelian randomization with some invalid instruments using a weighted median estimator. Genet Epidemiol. (2016) 40:304–14. doi: 10.1002/gepi.21965
24. Bowden J, Davey Smith G, Burgess S. Mendelian randomization with invalid instruments: effect estimation and bias detection through Egger regression. Int J Epidemiol. (2015) 44:512–25. doi: 10.1093/ije/dyv080
25. Verbanck M, Chen CY, Neale B, Do R. Detection of widespread horizontal pleiotropy in causal relationships inferred from Mendelian randomization between complex traits and diseases. Nat Genet. (2018) 50:693–8. doi: 10.1038/s41588-018-0099-7
26. Burgess S, Thompson SG. Interpreting findings from Mendelian randomization using the MR-Egger method. Eur J Epidemiol. (2017) 32:377–89. doi: 10.1007/s10654-017-0255-x
27. Hemani G, Tilling K, Davey Smith G. Orienting the causal relationship between imprecisely measured traits using GWAS summary data. PloS Genet. (2017) 13:e1007081. doi: 10.1371/journal.pgen.1007081
28. Larsson SC, Traylor M, Malik R, Dichgans M, Burgess S, Markus HS, et al. Modifiable pathways in Alzheimer's disease: Mendelian randomisation analysis. BMJ. (2017) 359:j5375. doi: 10.1136/bmj.j5375
29. Liu B, Lyu L, Zhou W, Song J, Ye D, Mao Y, et al. Associations of the circulating levels of cytokines with risk of amyotrophic lateral sclerosis: a Mendelian randomization study. BMC Med. (2023) 21:39. doi: 10.1186/s12916-023-02736-7
30. Daugherty BL, Siciliano SJ, DeMartino JA, Malkowitz L, Sirotina A, Springer MS. Cloning, expression, and characterization of the human eosinophil eotaxin receptor. J Exp Med. (1996) 183:2349–54. doi: 10.1084/jem.183.5.2349
32. Yamaguchi M, Okamura S, Yamaji T, Iwasaki M, Tsugane S, Shetty V, et al. Plasma cytokine levels and the presence of colorectal cancer. PloS One. (2019) 14:e0213602. doi: 10.1371/journal.pone.0213602
33. Melisi D, Garcia-Carbonero R, Macarulla T, Pezet D, Deplanque G, Fuchs M, et al. TGFβ receptor inhibitor galunisertib is linked to inflammation- and remodeling-related proteins in patients with pancreatic cancer. Cancer Chemother Pharmacol. (2019) 83:975–91. doi: 10.1007/s00280-019-03807-4
34. Siva S, MacManus M, Kron T, Best N, Smith J, Lobachevsky P, et al. A pattern of early radiation-induced inflammatory cytokine expression is associated with lung toxicity in patients with non-small cell lung cancer. PloS One. (2014) 9:e109560. doi: 10.1371/journal.pone.0109560
35. Tsao AS, Liu S, Lee JJ, Alden CM, Blumenschein GR Jr, Herbst R, et al. Clinical and biomarker outcomes of the phase II vandetanib study from the BATTLE trial. J Thorac Oncol. (2013) 8:658–61. doi: 10.1097/JTO.0b013e31828d08ae
36. Martin FH, Suggs SV, Langley KE, Lu HS, Ting J, Okino KH, et al. Primary structure and functional expression of rat and human stem cell factor DNAs. Cell. (1990) 63:203–11. doi: 10.1016/0092-8674(90)90301-T
37. Matsui J, Yamamoto Y, Funahashi Y, Tsuruoka A, Watanabe T, Wakabayashi T, et al. E7080, a novel inhibitor that targets multiple kinases, has potent antitumor activities against stem cell factor producing human small cell lung cancer H146, based on angiogenesis inhibition. Int J Cancer. (2008) 122:664–71. doi: 10.1002/ijc.23131
38. Levina V, Marrangoni A, Wang T, Parikh S, Su Y, Herberman R, et al. Elimination of human lung cancer stem cells through targeting of the stem cell factor-c-kit autocrine signaling loop. Cancer Res. (2010) 70:338–46. doi: 10.1158/0008-5472.CAN-09-1102
39. Maulik G, Bharti A, Khan E, Broderick RJ, Kijima T, Salgia R. Modulation of c-Kit/SCF pathway leads to alterations in topoisomerase-I activity in small cell lung cancer. J Environ Pathol Toxicol Oncol. (2004) 23:237–51. doi: 10.1615/JEnvPathToxOncol.v23.i4
40. Pietsch T, Nicotra MR, Fraioli R, Wolf HK, Mottolese M, Natali PG. Expression of the c-Kit receptor and its ligand SCF in non-small-cell lung carcinomas. Int J Cancer. (1998) 75:171–5. doi: 10.1002/(ISSN)1097-0215
41. Micke P, Basrai M, Faldum A, Bittinger F, Rönnstrand L, Blaukat A, et al. Characterization of c-kit expression in small cell lung cancer: prognostic and therapeutic implications. Clin Cancer Res. (2003) 9:188–94.
42. Sharma S, Yang SC, Zhu L, Reckamp K, Gardner B, Baratelli F, et al. Tumor cyclooxygenase-2/prostaglandin E2-dependent promotion of FOXP3 expression and CD4+ CD25+ T regulatory cell activities in lung cancer. Cancer Res. (2005) 65:5211–20. doi: 10.1158/0008-5472.CAN-05-0141
43. Garon EB, Chih-Hsin Yang J, Dubinett SM. The role of interleukin 1β in the pathogenesis of lung cancer. JTO Clin Res Rep. (2020) 1:100001. doi: 10.1016/j.jtocrr.2020.100001
44. Green DR. The coming decade of cell death research: five riddles. Cell. (2019) 177:1094–107. doi: 10.1016/j.cell.2019.04.024
45. Wong J, Magun BE, Wood LJ. Lung inflammation caused by inhaled toxicants: a review. Int J Chron Obstruct Pulmon Dis. (2016) 11:1391–401. doi: 10.2147/COPD
46. Dinarello CA. Why not treat human cancer with interleukin-1 blockade? Cancer Metastasis Rev. (2010) 29:317–29. doi: 10.1007/s10555-010-9229-0
47. Carmi Y, Dotan S, Rider P, Kaplanov I, White MR, Baron R, et al. The role of IL-1β in the early tumor cell-induced angiogenic response. J Immunol. (2013) 190:3500–9. doi: 10.4049/jimmunol.1202769
48. Hanahan D, Weinberg RA. Hallmarks of cancer: the next generation. Cell. (2011) 144:646–74. doi: 10.1016/j.cell.2011.02.013
49. Voronov E, Carmi Y, Apte RN. The role IL-1 in tumor-mediated angiogenesis. Front Physiol. (2014) 5:114. doi: 10.3389/fphys.2014.00114
50. Kajdaniuk D, Marek B, Foltyn W, Kos-Kudła B. Vascular endothelial growth factor (VEGF) - part 2: in endocrinology and oncology. Endokrynol Pol. (2011) 62:456–64.
51. Ma J, Waxman DJ. Combination of antiangiogenesis with chemotherapy for more effective cancer treatment. Mol Cancer Ther. (2008) 7:3670–84. doi: 10.1158/1535-7163.MCT-08-0715
52. Rosen LS. VEGF-targeted therapy: therapeutic potential and recent advances. Oncologist. (2005) 10:382–91. doi: 10.1634/theoncologist.10-6-382
53. Frezzetti D, Gallo M, Maiello MR, D'Alessio A, Esposito C, Chicchinelli N, et al. VEGF as a potential target in lung cancer. Expert Opin Ther Targets. (2017) 21:959–66. doi: 10.1080/14728222.2017.1371137
54. Dinarello CA. Interleukin-18 and the pathogenesis of inflammatory diseases. Semin Nephrol. (2007) 27:98–114. doi: 10.1016/j.semnephrol.2006.09.013
55. Castro F, Cardoso AP, Gonçalves RM, Serre K, Oliveira MJ. Interferon-gamma at the crossroads of tumor immune surveillance or evasion. Front Immunol. (2018) 9:847. doi: 10.3389/fimmu.2018.00847
56. Wong JL, Berk E, Edwards RP, Kalinski P. IL-18-primed helper NK cells collaborate with dendritic cells to promote recruitment of effector CD8+ T cells to the tumor microenvironment. Cancer Res. (2013) 73:4653–62. doi: 10.1158/0008-5472.CAN-12-4366
57. Esmailbeig M, Ghaderi A. Interleukin-18: a regulator of cancer and autoimmune diseases. Eur Cytokine Netw. (2017) 28:127–40. doi: 10.1684/ecn.2018.0401
58. Liu Y, Gu Y, Han Y, Zhang Q, Jiang Z, Zhang X, et al. Tumor exosomal RNAs promote lung pre-metastatic niche formation by activating alveolar epithelial TLR3 to recruit neutrophils. Cancer Cell. (2016) 30:243–56. doi: 10.1016/j.ccell.2016.06.021
59. Yoshimoto T, Okamura H, Tagawa YI, Iwakura Y, Nakanishi K. Interleukin 18 together with interleukin 12 inhibits IgE production by induction of interferon-gamma production from activated B cells. Proc Natl Acad Sci U.S.A. (1997) 94:3948–53. doi: 10.1073/pnas.94.8.3948
60. Weinstock JV, Blum A, Metwali A, Elliott D, Arsenescu R. IL-18 and IL-12 signal through the NF-kappa B pathway to induce NK-1R expression on T cells. J Immunol. (2003) 170:5003–7. doi: 10.4049/jimmunol.170.10.5003
61. Shen J, Choy DF, Yoshida T, et al. Interleukin-18 has antipermeablity and antiangiogenic activities in the eye: reciprocal suppression with VEGF. J Cell Physiol. (2014) 229:974–83. doi: 10.1002/jcp.24575
62. Jiang D, Ying W, Lu Y, et al. Identification of metastasis-associated proteins by proteomic analysis and functional exploration of interleukin-18 in metastasis. Proteomics. (2003) 3:724–37. doi: 10.1002/pmic.200300411
63. Xiong D, Feng R, Yang S, Lin T, Chen X. Antitumor activity of interleukin-18 on A549 human lung cancer cell line. J Cancer Res Ther. (2019) 15:1635–41. doi: 10.4103/jcrt.JCRT_226_19
64. Chen X, Feng R, Xiong D, Yang S, Lin T. Effect of lentiviral vector-packaged interleukin-18 gene on the Malignant behavior of lung cancer. Exp Ther Med. (2020) 19:319–26. doi: 10.3892/etm.2019.8204
65. Dufour JH, Dziejman M, Liu MT, Leung JH, Lane TE, Luster AD. IFN-gamma-inducible protein 10 (IP-10; CXCL10)-deficient mice reveal a role for IP-10 in effector T cell generation and trafficking. J Immunol. (2002) 168:3195–204. doi: 10.4049/jimmunol.168.7.3195
66. Lu XL, Jiang XB, Liu RE, Zhang SM. The enhanced anti-angiogenic and antitumor effects of combining flk1-based DNA vaccine and IP-10. Vaccine. (2008) 26:5352–7. doi: 10.1016/j.vaccine.2008.08.012
67. Yang X, Chu Y, Wang Y, Zhang R, Xiong S. Targeted in vivo expression of IFN-gamma-inducible protein 10 induces specific antitumor activity. J Leukoc Biol. (2006) 80:1434–44. doi: 10.1189/jlb.0306212
68. Persano L, Crescenzi M, Indraccolo S. Anti-angiogenic gene therapy of cancer: current status and future prospects. Mol Aspects Med. (2007) 28:87–114. doi: 10.1016/j.mam.2006.12.005
69. Tokunaga R, Zhang W, Naseem M, et al. CXCL9, CXCL10, CXCL11/CXCR3 axis for immune activation - A target for novel cancer therapy. Cancer Treat Rev. (2018) 63:40–7. doi: 10.1016/j.ctrv.2017.11.007
70. Liu M, Guo S, Hibbert JM, et al. CXCL10/IP-10 in infectious diseases pathogenesis and potential therapeutic implications. Cytokine Growth Factor Rev. (2011) 22:121–30. doi: 10.1016/j.cytogfr.2011.06.001
71. Aronica SM, Raiber L, Hanzly M, Kisela C. Antitumor/antiestrogenic effect of the chemokine interferon inducible protein 10 (IP-10) involves suppression of VEGF expression in mammary tissue. J Interferon Cytokine Res. (2009) 29:83–92. doi: 10.1089/jir.2008.0034
Keywords: cytokines, lung cancer, Mendelian randomization, causality, genome-wide association study
Citation: Luo D, Gong Z, Zhan Q and Lin S (2024) Causal association of circulating cytokines with the risk of lung cancer: a Mendelian randomization study. Front. Oncol. 14:1373380. doi: 10.3389/fonc.2024.1373380
Received: 19 January 2024; Accepted: 03 June 2024;
Published: 18 June 2024.
Edited by:
Amancio Carnero, Sevilla University, SpainReviewed by:
James K. Fields, Johns Hopkins University, United StatesMaria V. Guijarro, University of Florida, United States
Copyright © 2024 Luo, Gong, Zhan and Lin. This is an open-access article distributed under the terms of the Creative Commons Attribution License (CC BY). The use, distribution or reproduction in other forums is permitted, provided the original author(s) and the copyright owner(s) are credited and that the original publication in this journal is cited, in accordance with accepted academic practice. No use, distribution or reproduction is permitted which does not comply with these terms.
*Correspondence: Shan Lin, ZHIuc2hhbmxpbkBmb3htYWlsLmNvbQ==; Qingyuan Zhan, ZHJ6aGFucXlAMTYzLmNvbQ==
†These authors have contributed equally to this work