Abstract
Background:
Cancer metastasis is dependent on cell migration. Several mechanisms, including epithelial-to-mesenchymal transition (EMT) and actin fiber formation, could be involved in cancer cell migration. As a downstream effector of the Hippo signaling pathway, transcriptional coactivator with PDZ-binding motif (TAZ) is recognized as a key mediator of the metastatic ability of breast cancer cells. We aimed to examine whether TAZ affects the migration of breast cancer cells through the regulation of EMT or actin cytoskeleton.
Methods:
MCF-7 and MDA-MB-231 cells were treated with siRNA to attenuate TAZ abundance. Transwell migration assay and scratch wound healing assay were performed to study the effects of TAZ knockdown on cancer cell migration. Fluorescence microscopy was conducted to examine the vinculin and phalloidin. Semiquantitative immunoblotting and quantitative real-time PCR were performed to study the expression of small GTPases and kinases. Changes in the expression of genes associated with cell migration were examined through next-generation sequencing.
Results:
TAZ-siRNA treatment reduced TAZ abundance in MCF-7 and MDA-MB-231 breast cancer cells, which was associated with a significant decrease in cell migration. TAZ knockdown increased the expression of fibronectin, but it did not exhibit the typical pattern of EMT progression. TGF-β treatment in MDA-MB-231 cells resulted in a reduction in TAZ and an increase in fibronectin levels. However, it paradoxically promoted cell migration, suggesting that EMT is unlikely to be involved in the decreased migration of breast cancer cells in response to TAZ suppression. RhoA, a small Rho GTPase protein, was significantly reduced in response to TAZ knockdown. This caused a decrease in the expression of the Rho-dependent downstream pathway, i.e., LIM kinase 1 (LIMK1), phosphorylated LIMK1/2, and phosphorylated cofilin, leading to actin depolymerization. Furthermore, myosin light chain kinase (MLCK) and phosphorylated MLC2 were significantly decreased in MDA-MB-231 cells with TAZ knockdown, inhibiting the assembly of stress fibers and focal adhesions.
Conclusion:
TAZ knockdown inhibits the migration of breast cancer cells by regulating the intracellular actin cytoskeletal organization. This is achieved, in part, by reducing the abundance of RhoA and Rho-dependent downstream kinase proteins, which results in actin depolymerization and the disassembly of stress fibers and focal adhesions.
Introduction
Breast cancer is one of the most common types of cancer and the second leading cause of death among women (1). Despite advancements in the diagnosis and treatment of early-stage disease, approximately 6-10% of breast cancer patients are diagnosed with metastasis. Furthermore, it has been estimated that around 30% of patients who are initially diagnosed with early-stage breast cancer will ultimately experience recurrent advanced or metastatic disease (2). As opposed to the primary tumor, the cause of mortality in breast cancer patients is predominantly the metastatic dissemination to multiple organs, including bone, lung, and liver (3, 4). Thus, the heterogeneous nature of breast cancer metastasis makes it challenging to identify risk factors and underlying mechanisms for disease progression and define appropriate treatments for each breast cancer patient (5).
Tumor metastasis involves a complex set of sequential events. For instance, local invasion into the surrounding tissues, intravasation by infiltrating the blood or lymphatic vessels, and survival as circulating tumor cells (CTCs) in the circulation are all required. In addition, the release of CTCs from the circulatory system, extravasation, adaptation to the microenvironments as disseminated tumor cells, and metamorphosis into metastasis-initiating cells are necessary for the formation of a metastatic lesion (6–9). In particular, cell migration, a fundamental process that is implicated in numerous biological phenomena, is critical for the invasion and metastasis of cancer (10–12).
Several mechanisms could be implicated in cancer cell migration, including epithelial-to-mesenchymal transition (EMT) and actin fiber formation (13). In addition, we previously demonstrated that aquaporin-5 (AQP5) expression is associated with breast cancer cell migration, activated Rac1, and cell detachment and dissemination from migrating cell sheets (14–16). The EMT is known to be engaged in the initiation of cancer cell migration, as it involves the loss of epithelial markers, trans-differentiation into mesenchymal-like cells, and the acquisition of motile and invasive capacities (17, 18). For instance, Snail1, a crucial transcription factor of EMT, is associated with the tumor grade, a high rate of recurrence, and distant or lymph node metastasis of invasive ductal carcinoma (19, 20), suggesting a plausible target for therapeutic intervention. Furthermore, cancer-associated fibroblasts (CAF) assemble a fibronectin-rich extracellular matrix that facilitates CAF-cancer cell interaction and directs cell migration (21).
Importantly, the Hippo signaling pathway, which regulates cell proliferation, differentiation, and apoptosis (22, 23), has emerged as a cancer signaling network in a range of malignancies, including breast cancer (24). Dysregulation of the Hippo pathway is associated with breast cancer metastasis (25–27). Particularly, Bartucci et al. (28) demonstrated that the loss of TAZ (transcriptional co-activator with PDZ-binding motif, also known as WWTR1) in breast cancer stem cells significantly hindered metastasis colonization formation and reduced chemoresistance. Based on these studies, we hypothesized that Hippo signaling might change the ability of cancer cells to metastasize (i.e., cell migration) by controlling EMT or actin fiber formation, in addition to regulating the expression of genes linked to tumor metastasis (29).
This study aimed to investigate the role of TAZ in breast cancer cell migration and its underlying mechanisms. We have focused on studying the alterations in EMT and actin fiber formation in response to TAZ knockdown in breast cancer cells, as these changes may be linked to cancer cell migration. Furthermore, we used next-generation sequencing (NGS) to study alterations in genes associated with TAZ knockdown in breast cancer cells.
Materials and methods
Human breast cancer cells
Human breast cancer cell lines [MCF-7 (HTB-22) and MDA-MB-231 (HTB-26)] were purchased from the American Type Culture Collection (ATCC, Manassas, VA). MCF-7 cells were maintained in high glucose Dulbecco’s Modified Eagle’s Medium (DMEM, 25 mM glucose), while MDA-MB-231 cells were cultured in low glucose DMEM (5.5 mM glucose) at 37°C. Both media contained 0.1% penicillin-streptomycin and 10% heat-inactivated fetal bovine serum (FBS). Cells were incubated in a humidified incubator at 37°C and 5% CO2. MCF-7 cells and MDA-MB-231 cells were seeded on 6- or 12-well plates and transfected with small interfering RNA (siRNA) specific for TAZ, using siGENOME human WWTR1 siRNA (M-016083-00-0010, Dharmacon; Horizon Discovery, Cambridge, UK), siGENOME human RHOA siRNA (M-003860-03-0010, Dharmacon; Horizon Discovery, Cambridge, UK), and DharmaFECT4 (T-2004-03, Dharmacon; Horizon Discovery, Cambridge, UK). To isolate proteins from the cells for performing immunoblotting, cells were lysed with Laemmli buffer (10 mM Tris-HCl, 1.5% SDS, pH 6.8), containing protease and phosphatase inhibitors (0.4 μg/mL leupeptin, 0.1 mg/mL pefabloc, 1 mM Na3VO4, 24 mM NaF, and 0.1 μM okadaic acid). Total RNA was extracted using Direct-zol RNA MiniPrep (R2050, Zymo Research, Irvine, CA) following the manufacturer’s instructions for quantitative real-time PCR (qRT-PCR).
Semiquantitative immunoblotting analysis
Cells were lysed in Laemmli buffer (10 mM Tris-HCl, 1.5% SDS, pH 6.8) The lysates prepared using Laemmli buffer were loaded onto a QIAshredder column (QIAGEN, Hilden, Germany) and centrifuged at 10,000 g for 2 min at room temperature. Total protein concentration was measured using a BCA protein assay kit (Pierce BCA protein assay reagent kit; Pierce, Rockford, IL). Semiquantitative immunoblot analyses were performed, as previously described (16, 30). Primary antibodies used were anti-TAZ (1:1,000, 560235, BD bioscience, Franklin Lakes, NJ), YAP (1:1,000, #14074, Cell signaling Technology, Danvers, MA), RhoA (1:1,000, ab187027, Abcam, Cambridge, UK), RhoC (1:1,000, #3430, Cell signaling Technology, Danvers, MA), ROCK1/2 (1:1,000, ab45171, Abcam, Cambridge, UK), Cdc42 (1:1,000, ab187643, Abcam, Cambridge, UK), Rac1 (1:1,000, 610651, BD bioscience, Franklin Lakes, NJ), vimentin (1:1,000, #5741, Cell signaling Technology, Danvers, MA), Occludin (1:1,000, 71-1500, Invitrogen, Waltham, MA), E-cadherin (1:1,000, 610181, BD bioscience, Franklin Lakes, NJ), N-cadherin (1:1,000, ab18203, Abcam, Cambridge, UK), fibronectin (1:1,000, ab2413, Abcam, Cambridge, UK), Myosin Light Chain Kinase (1:1,000, M7905, Sigma), Myosin Light Chain 2 (1:1,000, #3672, Cell signaling Technology), Phospho-Myosin Light Chain 2 (1:1,000, #3675, Cell signaling Technology), LIMK1 (1:1,000, #3842, Cell signaling Technology), LIMK2 (1:1,000, #3845, Cell signaling Technology), phospho-LIMK (1:1,000, #3841, Cell signaling Technology), cofilin (1:1,000, #5175, Cell signaling Technology), and phospho-cofilin (1:1,000, #3313, Cell signaling Technology). Immunoblots were visualized by horseradish peroxidase-conjugated secondary antibodies (P447 or P448, DAKO, Glostrup, Denmark). The band density was quantitated by Image J (NIH, Bethesda, MD), and the value of densitometry was corrected by the densitometry value of β-actin (1:200,000, A1978, Sigma).
Quantitative real-time PCR
MDA-MB-231 cells were seeded in 6-well plates and transfected with 25 nM of TAZ-siRNA for 24 h. Total RNA purification was performed by Direct-zol RNA MiniPrep, and total RNA (1 μg) was used to synthesize cDNA with the Takara cDNA synthesis kit (6110A, Takara, Otsu, Shiga, Japan). The relative mRNA expression of TAZ, RhoA, RhoC, ROCK1, ROCK2, Cdc42, Rac1, and Myosin Light Chain 2 (MLC2) was analyzed using a QuantiTect SYBR Green PCR Kit (204143, QIAGEN, Hilden, Germany). β-actin mRNA was used as an internal control. qRT-PCR was run on Rotor-Gene-A (QIAGEN, Hilden, Germany) and threshold was set by 0.02 to determine the threshold cycle (Ct) value. The relative mRNA expression was calculated, as we described previously (31). Each sample was tested in duplicate, and the primer sequences used for qRT-PCR are depicted in Table 1.
Table 1
| TAZ forward | GAGGACTTCCTCAGCAATGTGG |
| TAZ reverse | CGTTTGTTCCTGGAAGACAGTCA |
| RhoA forward | TCTGTCCCAACGTGCCCATCAT |
| RhoA reverse | CTGCCTTCTTCAGGTTTCACCG |
| RhoC forward | AAGACGAGCACACCAGGAGAGA |
| RhoC reverse | TTGGCTGAGCACTCAAGGTAGC |
| ROCK1 forward | GAAACAGTGTTCCATGCTAGACG |
| ROCK1 reverse | GCCGCTTATTTGATTCCTGCTCC |
| ROCK2 forward | TGCGGTCACAACTCCAAGCCTT |
| ROCK2 reverse | CGTACAGGCAATGAAAGCCATCC |
| Cdc42 forward | TGACAGATTACGACCGCTGAGTT |
| Cdc42 reverse | GGAGTCTTTGGACAGTGGTGAG |
| Rac1 forward | CGGTGAATCTGGGCTTATGGGA |
| Rac1 reverse | GGAGGTTATATCCTTACCGTACG |
| MLC2 forward | CGGAGAGGTTTTCCAAGGAGGA |
| MLC2 reverse | CTCTTCTCCGTGGGTGATGATG |
Primer sequences for quantitative real time PCR.
Transwell cell migration assay
Breast cancer cell lines (MCF-7 and MDA-MB-231) were transfected with 25 nM of control siRNA or TAZ-siRNA using DharmaFECT 4 reagent. After treatment with siRNA for 24 h and changing to fresh growth media, the cells were grown for another 24 h and detached using trypsin/EDTA. The detached cells were resuspended in low- or high-glucose DMEM without FBS and were seeded on the permeable filter of the transwell system (8 μm pore size, transwell) at a density of 2.0 x10⁴ cells per well. Cell migration was stimulated with DMEM media containing 10% FBS for 6 h (MDA-MB-231 cells) or for 12 h (MCF-7 cells). The upper chamber contained the medium without FBS, and the lower chamber was filled with the medium containing 10% FBS. Migrated cells on the lower face were fixed with 4% paraformaldehyde for 10 min, then stained with 0.03% crystal violet for 10 min. The numbers of the migrated cells in five randomly selected fields were counted under a light microscope at 100 X magnification.
Scratch wound healing assay for cell migration
In 96-well IncuCyte® ImageLock Plates (Essen BioScience, Ann Arbor, MI), MDA-MB-231 and MCF7 cells were grown to confluency. Negative control-siRNA or TAZ-targeting siRNA were transfected into cells in low or high glucose DMEM when they reached 50 - 60% confluence. MDA-MB-231 and MCF-7 cells were transfected with 25 nM of either control siRNA or TAZ-siRNA. After treatment with siRNA for 24 h and changing to a fresh growth medium, cells were grown for an additional 24 h and then preincubated with mitomycin C (10 μg/mL, Sigma, St. Louis, MO) for 4 h before scratching to prevent cell proliferation. Mitomycin C treatment was maintained throughout the wound closure assay. A 96-pin WoundMaker™ (IncuCyte ZOOM® Live-Cell Imaging System; Essen BioScience, Ann Arbor, MI) was used to scratch the cell monolayer. After scratching, cell migration was induced for 24 h by 10% FBS-containing media. Every 2 h, images were automatically captured, saved, and registered by the IncuCyte™ software system. The data was analyzed using an integrated metric. The values were expressed as relative wound density.
Fluorescence microscopy
Immunofluorescence microscopy was performed on cultured cells, as previously described (31). For immunolabeling of vinculin, cultured cells were incubated with mouse anti-vinculin monoclonal antibody (1:100, V9131, Invitrogen, Waltham, MA), followed by Alexa Fluor 488-conjugated goat anti-mouse (1:100, 16-240, sigma-aldrich). The Alexa Fluor 568 Phalloidin (A12380, ThermoFisher Scientific) dissolved in 150 μL of anhydrous DMSO to yield a 400X stock was diluted by DPBS. After incubation of the secondary antibody for vimentin immunolabeling, cells were stained with diluted phalloidin stock solution for 30 min. For double-immunolabeling of myosin light chain 2 (MLC2) and phosphorylated MLC2, cultured cells were incubated with rabbit anti-MLC2 antibody (1:100, #3672, Cell signaling Technology) and mouse anti-phosphorylated MLC2 (1:100, #3675, Cell signaling Technology), followed by Alexa Fluor 488-conjugated goat anti-rabbit (1:100, 16-240, sigma-aldrich) and Alexa Fluor 568-conjugated goat anti-mouse (1:100, sigma-aldrich). Immunofluorescence microscopy was performed using a laser scanning confocal microscope (Zeiss LSM 800; Jena, Germany).
Next-generation sequencing
Total RNA was isolated from control-siRNA or TAZ-siRNA-treated MDA-MB-231 cells. The number of cell preparations that were included in each group was three. For transcriptome sequencing, mRNA libraries were generated using TruSeq Stranded mRNA library prep kit according to the manufacturer’s protocol (TruSeq Stranded mRNA reference guide # 1000000040498v00). Libraries were pooled and sequenced to obtain 100-bp paired-end reads on the Illumina NovaSeq platform to a depth of more than 40 million reads per sample (>10 million reads per cell). Genomic reference (GRCh38) was used to map cDNA fragments obtained through RNA-seq data. The quality of sequencing data was checked using FastQC. Trimmed reads were mapped to known reference genomes using the HISAT2 program after preprocessing. Genes/transcripts were assembled using the reference gene model through the StringTie program. After assembly, the abundance amount of the corresponding transcript was calculated using read count and normalized value; FPKM (Fragments Per Kilobase of transcript per Million mapped reads) and TPM (Transcripts Per Kilobase Million) were estimated. Gene ontology was analyzed using g:Profiler (https://biit.cs.ut.ee/gprofiler/orth) for the list of significant differentially expressed genes (DEGs). Gene set enrichment by functional classification: biological process (BP), molecular function (MF), and cellular component (CC) analyses were carried out.
Statistical analysis
Values are presented as means ± SEM. Comparisons between the two groups were made by unpaired t-test. A comparison of multiple groups was made by one-way ANOVA followed by a post-hoc Bonferroni’s multiple comparison test. Multiple comparison tests were only applied when a significant difference was determined by ANOVA (P < 0.05). P values < 0.05 were considered statistically significant.
Results
Reduced cell migration in breast cancer cells (MCF-7 and MDA-MB-231 cells) treated with TAZ-siRNA
MCF-7 and MDA-MB-231 breast cancer cell lines were treated for 24 h with control-siRNA or TAZ-siRNA. Immunoblot analysis demonstrated that TAZ knockdown was induced by TAZ-siRNA treatment in both MCF-7 and MDA-MB-231 cells (Figures 1A–D). We then conducted a transwell cell migration assay and a scratch wound healing assay to determine whether TAZ knockdown affects the migration of breast cancer cells. On the upper side of the transwell, serum-free DMEM media was added with cells treated with siRNA. In order to stimulate cell migration, 10% FBS was added to the DMEM media in the lower chamber. The migration of the MCF-7 cells was observed for 12 h, while MDA-MB-231 cells were observed for 6 h. TAZ knockdown significantly decreased cell migration of MCF-7 cells (49 ± 1% of control-siRNA, P < 0.05, Figures 1E, F) and MDA-MB-231 cells (73 ± 2% of control-siRNA, P < 0.05, Figures 1G, H), as determined by the transwell cell migration assay counting the numbers of migrated cells on the lower face. Furthermore, to perform the scratch wound healing assay, cells were scratched and subsequently starved for 24 h without FBS. The results demonstrated that TAZ knockdown significantly reduced cell migration in both MCF-7 and MDA-MB-231 cells (Figures 1I–L). Compared to control-siRNA, TAZ knockdown reduced cell migration in both MCF-7 cells (from 12 to 22 h, P < 0.05, Figures 1I, J) and MDA-MB-231 cells (from 4 to 24 h, P < 0.05, Figures 1K, L).
Figure 1
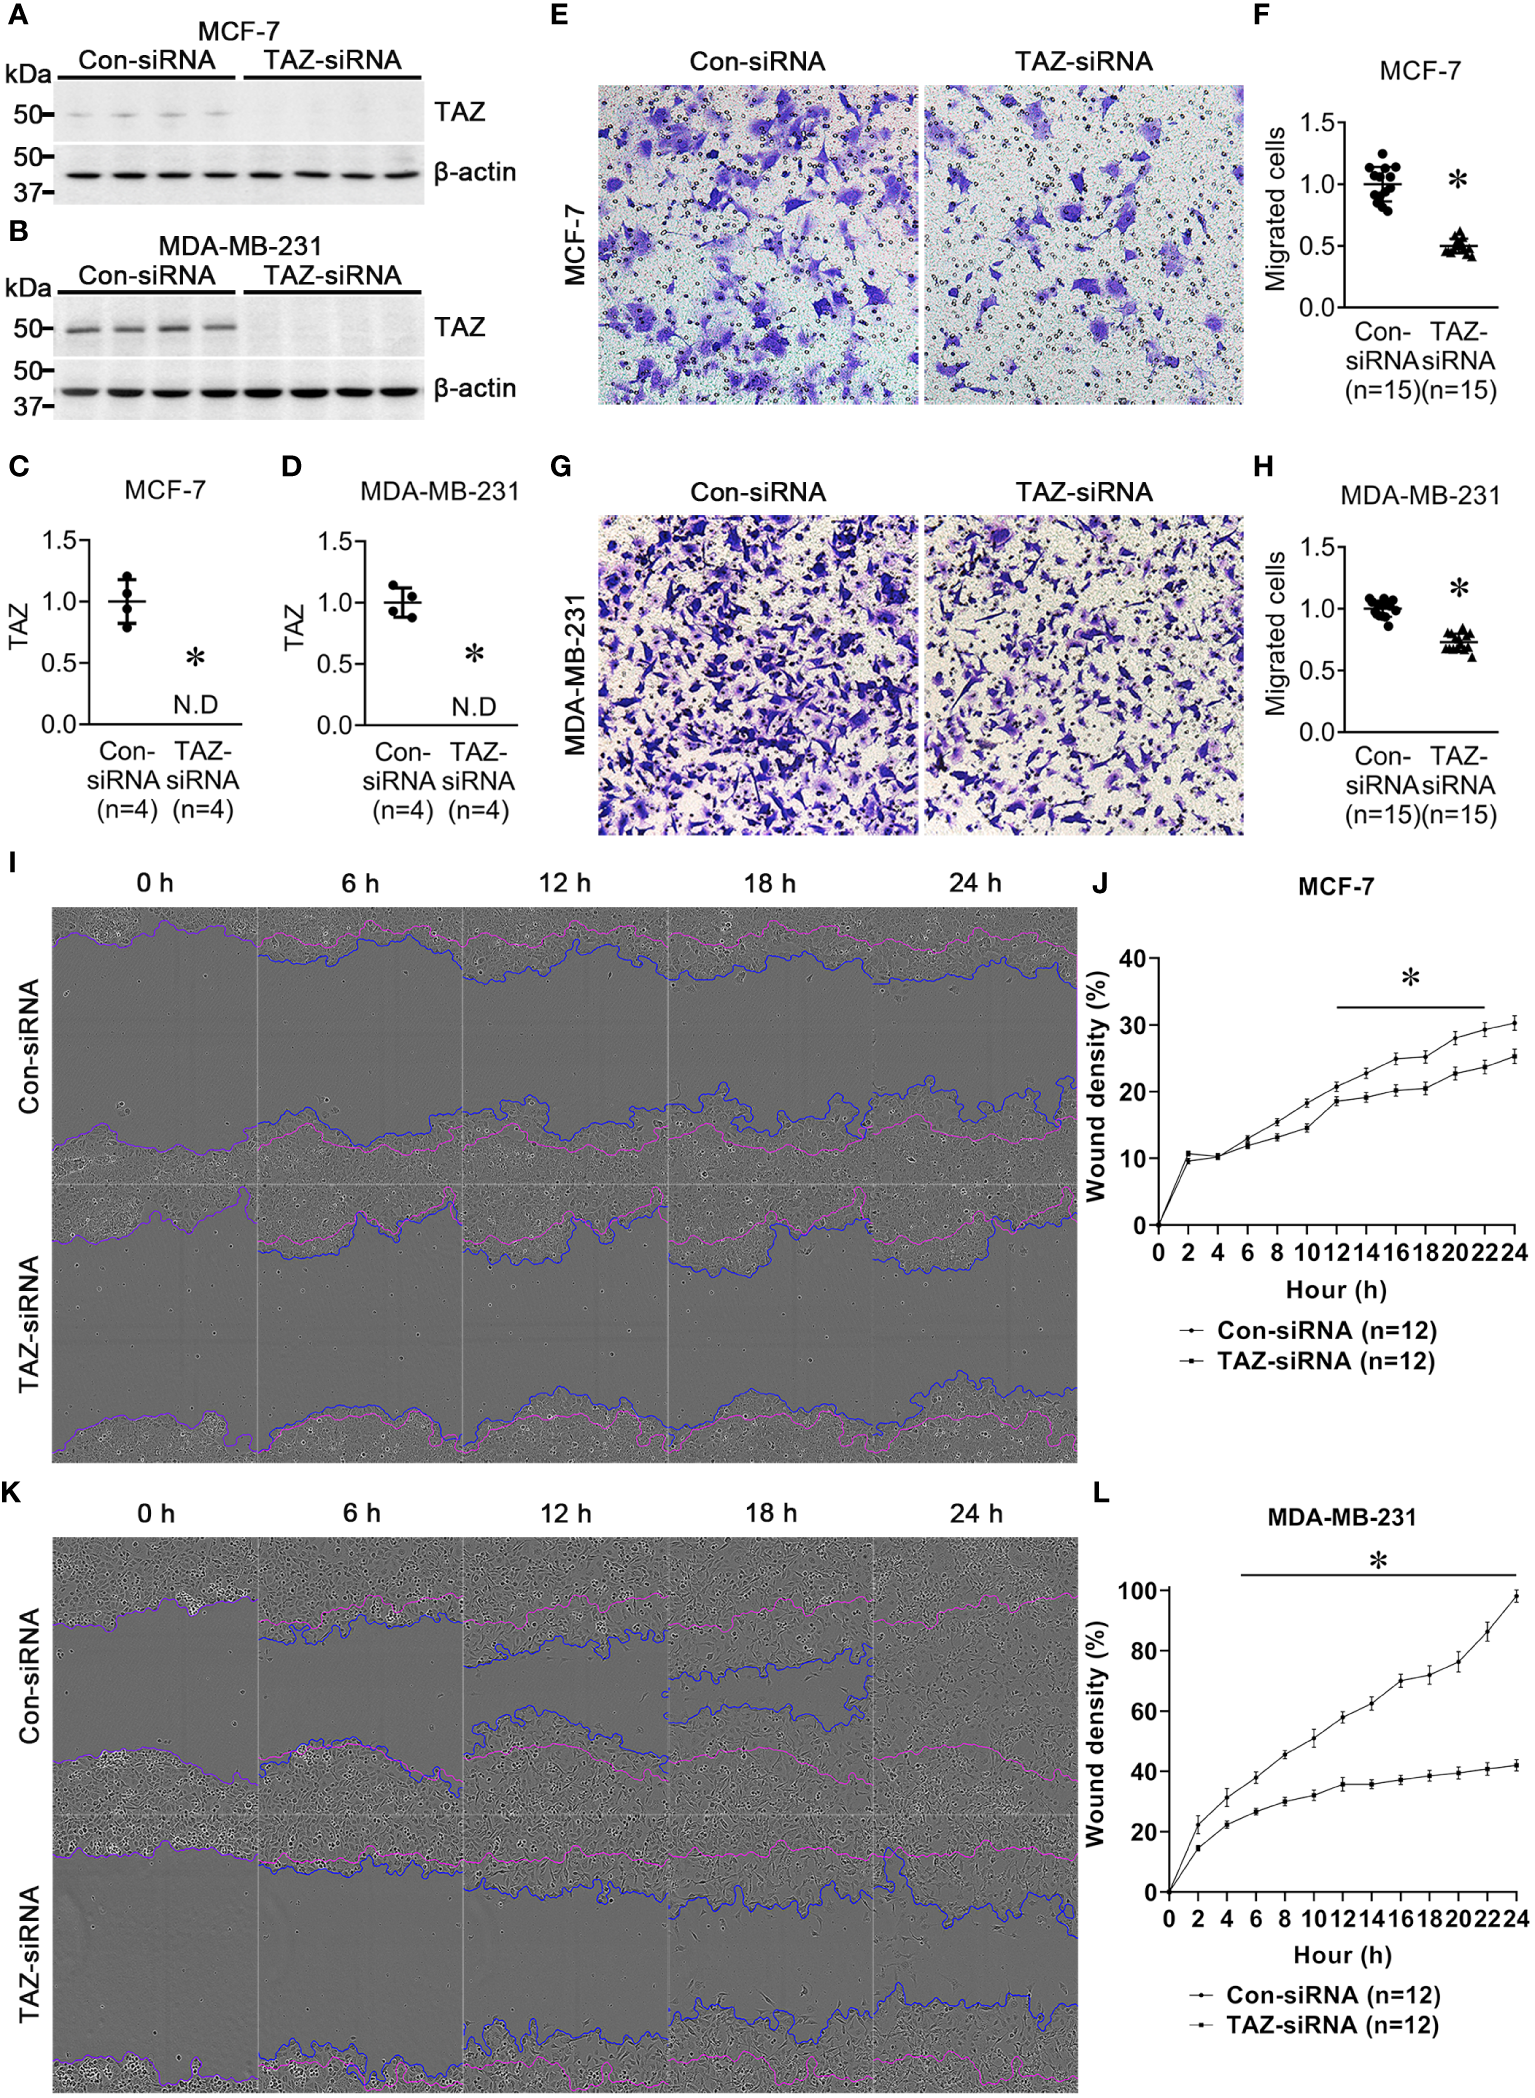
Semiquantitative immunoblotting of TAZ and cell migration assay in breast cancer cells (MCF-7 and MDA-MB-231) treated with control-siRNA or TAZ-siRNA. (A–D) Changes in protein abundance of TAZ in breast cancer cells treated with control-siRNA or TAZ-siRNA for 24 hours. *P < 0.05, when compared with control-siRNA. The immunoblots were reacted with antibodies against TAZ (~49 kDa) and β-actin (~42 kDa). n indicates the number of cell preparation in each group. (E–H) Transwell cell migration assay of breast cancer cells treated with control-siRNA or TAZ-siRNA. The numbers of migrated cells were counted in the randomly selected fields (x100) per well. n indicates the number of randomly selected fields in each group. *P < 0.05, when compared with control-siRNA. (I–L) Scratch wound healing assay. *P < 0.05, when compared with control-siRNA. n indicates the number of wells containing cell treated with control-siRNA or TAZ-siRNA.
Epithelial-to-mesenchymal transition in MDA-MB-231 cells with siRNA-mediated TAZ knockdown
To determine if TAZ-knockdown per se is associated with EMT in MDA-MB-231 cells, the changes in the expression of EMT markers in breast cancer cells were examined using semiquantitative immunoblotting. As epithelial markers, E-cadherin and occludin were used, while fibronectin, N-cadherin, and vimentin were employed as mesenchymal markers. The protein abundance of E-cadherin (188 ± 23% of control-siRNA, P < 0.05, Figures 2A, C) and fibronectin (172 ± 18% of control-siRNA, P < 0.05, Figures 2A, D) was significantly increased in response to TAZ-knockdown (Figure 2B), whereas N-cadherin was decreased (77 ± 9% of control-siRNA, P < 0.05, Figures 2A, F). The protein levels of occludin and vimentin were unaltered (Figures 2A, E, G).
Figure 2
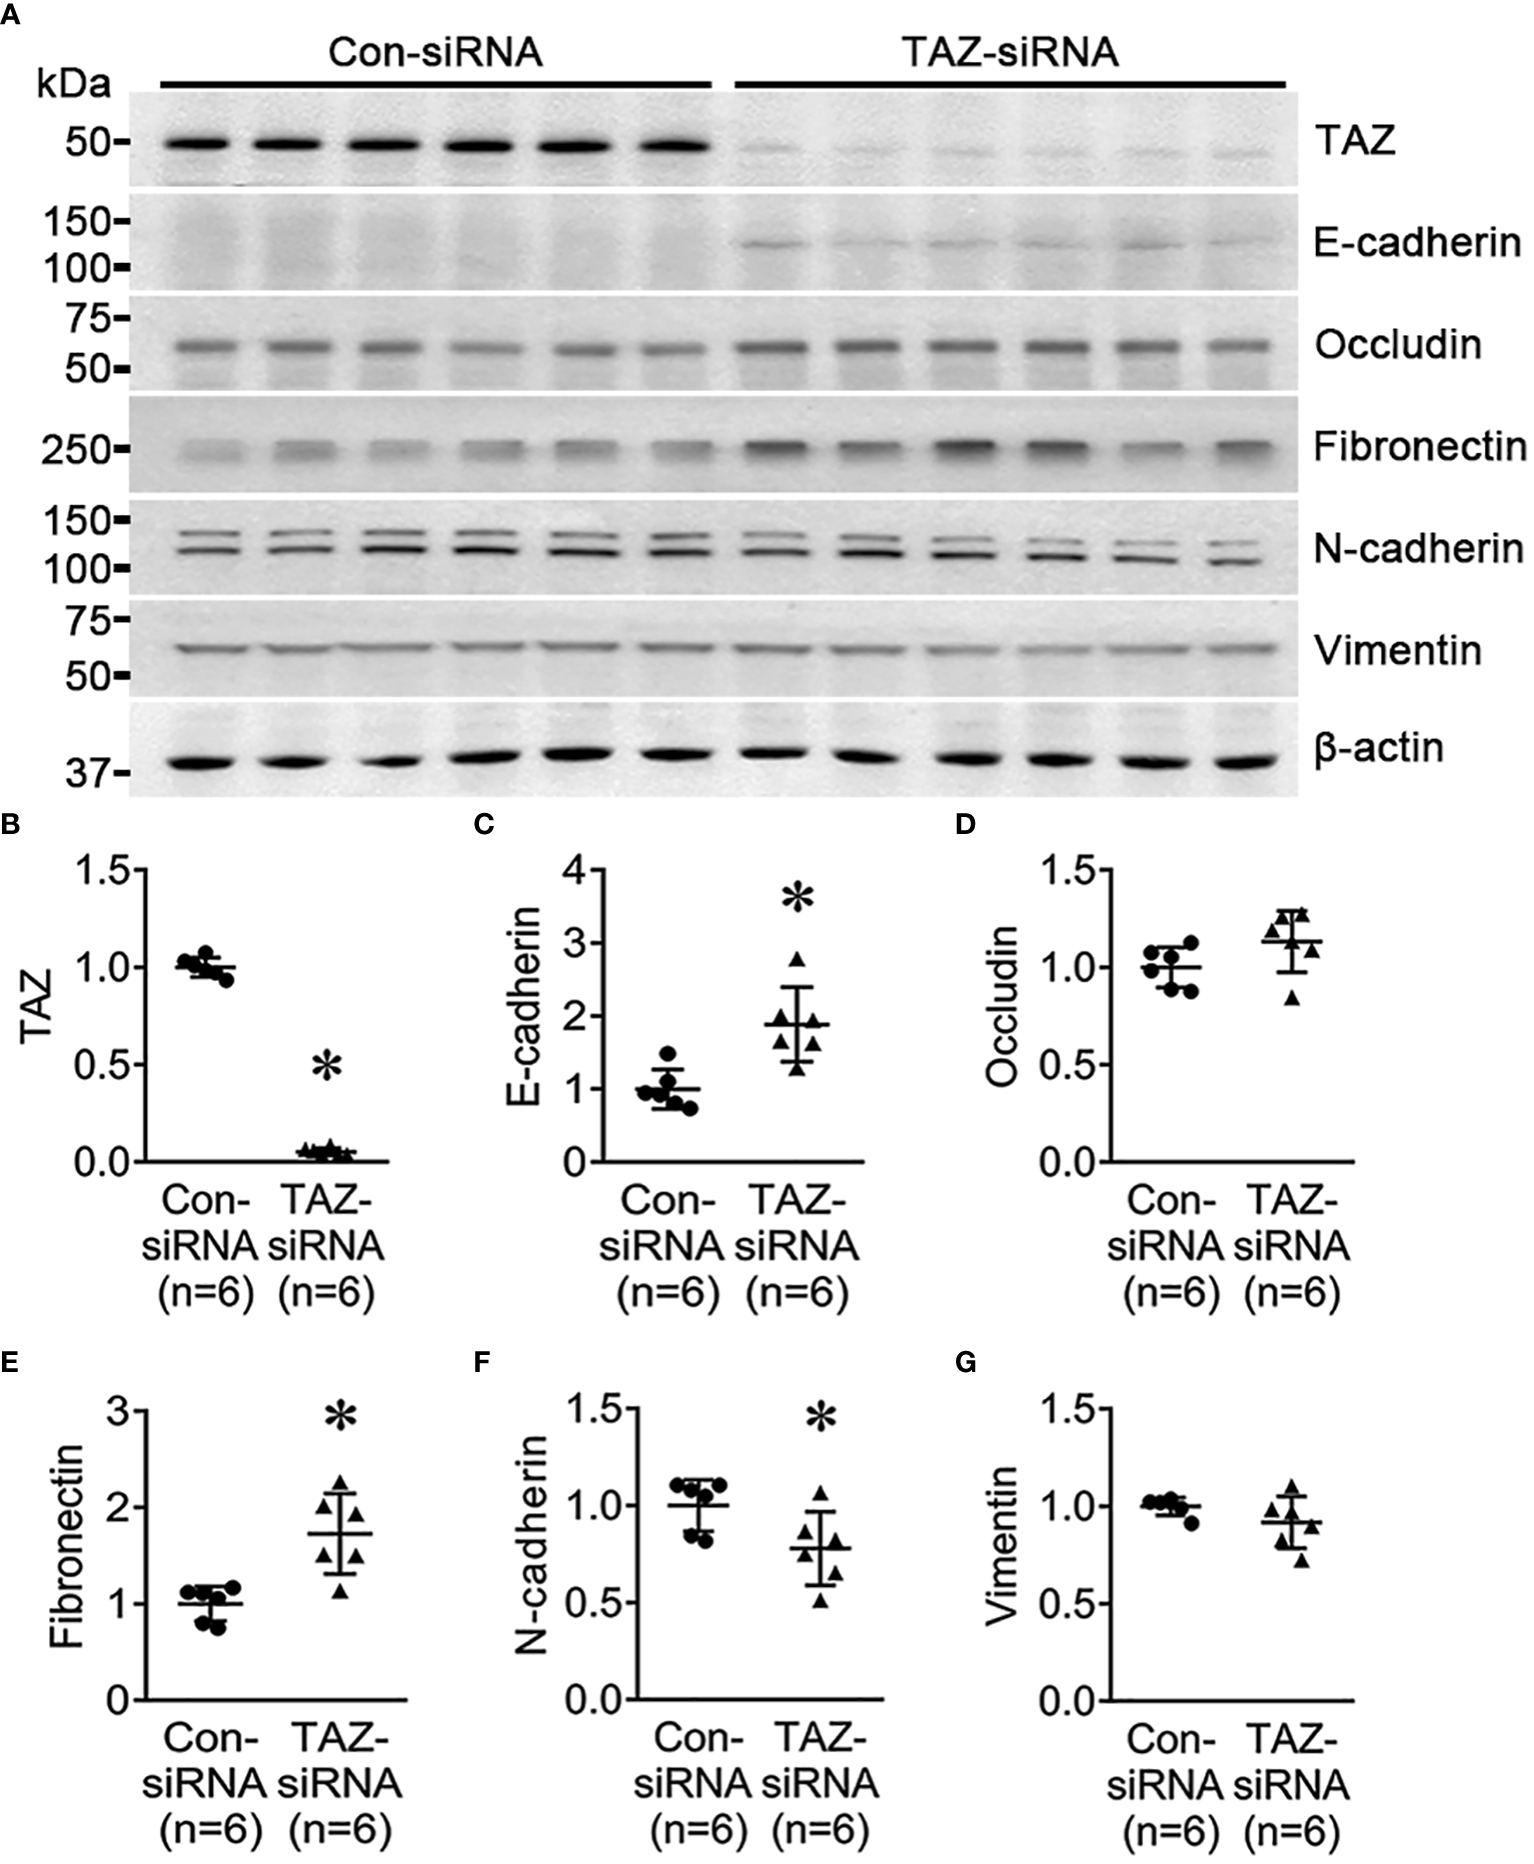
Semiquantitative immunoblotting for the studies of EMT. (A–G) Semiquantitative immunoblotting of TAZ, E-cadherin, occludin, fibronectin, N-cadherin, vimentin and β-actin in MDA-MB-231 cells treated with control-siRNA or TAZ-siRNA. The immunoblots were reacted with antibodies against TAZ (~49 kDa), E-cadherin (~135 kDa), occludin (~65 kDa), fibronectin (~262 kDa), N-cadherin (~125 kDa), vimentin (~57 kDa), and β-actin (~42 kDa). *P < 0.05, when compared with control-siRNA. n indicates the number of cell preparation in each group.
Next, we investigated the effect of TGF-β (5 ng/ml, 24 h) on MDA-MB-231 cells pre-treated with control-siRNA or TAZ-siRNA. TGF-β is known to trigger EMT, cause cancer cells to develop characteristics of stem cells, and promote cell migration. We aimed to find out if TAZ knockdown in MDA-MB-231 cells could also impede TGF-β-induced cell migration and EMT. In the control-siRNA-treated MDA-MB-231 cells, TGF-β treatment significantly reduced the protein abundance of TAZ (65 ± 4% of vehicle, P < 0.05, Figures 3A, C), occludin (77 ± 5% of vehicle, P < 0.05, Figures 3A, E), N-cadherin (80 ± 6% of vehicle, P < 0.05, Figures 3A, G), and vimentin (82 ± 6% of vehicle, P < 0.05, Figures 3A, H). In contrast, TGF-β treatment increased the protein abundance of fibronectin (377 ± 14% of vehicle, P < 0.05, Figures 3A, F), but not E-cadherin (Figures 3A, D). In MDA-MB-231 cells with siRNA-mediated TAZ knockdown, TGF-β treatment decreased the protein abundance of TAZ further (61 ± 7% of vehicle, P < 0.05, Figures 3B, I). E-cadherin (58 ± 6% of vehicle, P < 0.05, Figures 3B, J) and occludin (72 ± 7% of vehicle, P < 0.05, Figures 3B, K) were also significantly decreased. In contrast, fibronectin protein abundance was increased (282 ± 42% of vehicle, P < 0.05, Figures 3B, L), and N-cadherin and vimentin were unchanged (Figures 3B, M, N) after TGF-β treatment.
Figure 3
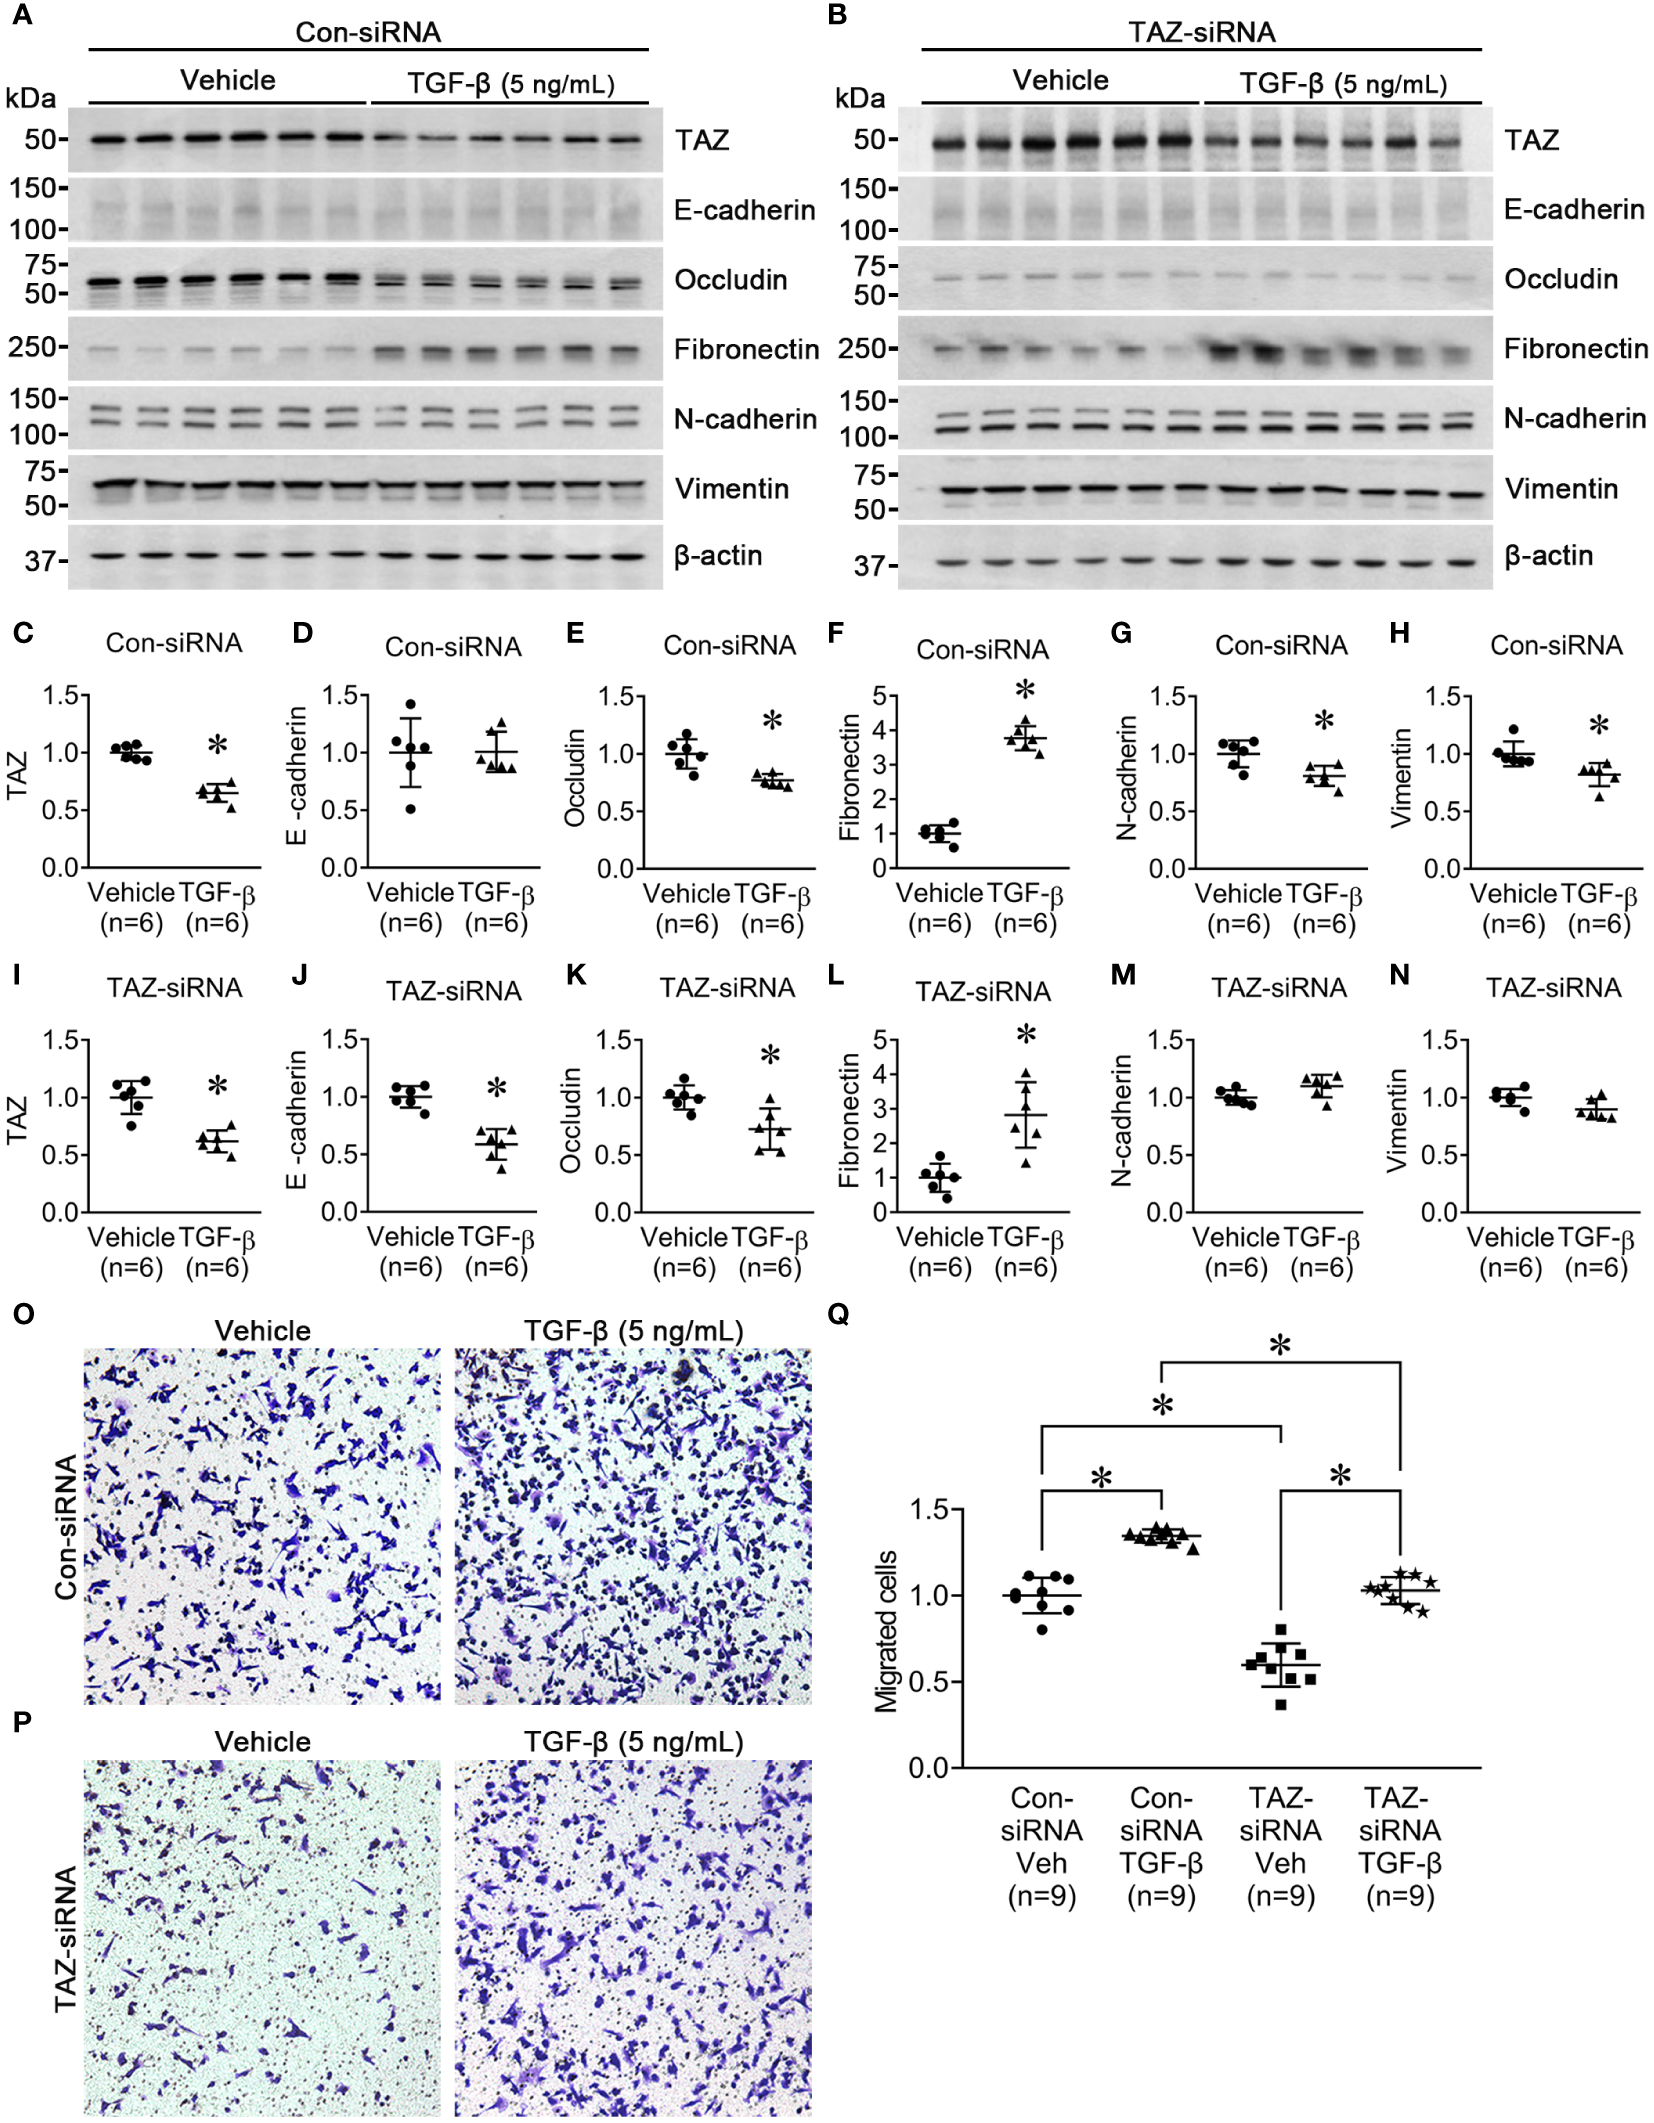
Semiquantitative immunoblotting for the studies of TGF-β treatment. (A, C–H) Semiquantitative immunoblotting of TAZ, E-cadherin, occludin, fibronectin, N-cadherin, vimentin, and β-actin in MDA-MB-231 cells treated with vehicle or TGF-β (5 ng/ml) under control-siRNA treatment. The immunoblots were reacted with antibodies against TAZ (~49 kDa), E-cadherin (~135 kDa), occludin (~65 kDa), fibronectin (~262 kDa), N-cadherin (~125 kDa), vimentin (~57 kDa), and β-actin (~42 kDa). (B, I–N) Semiquantitative immunoblotting of TAZ, E-cadherin, occludin, fibronectin, N-cadherin, vimentin, and β-actin in MDA-MB-231 cells treated with vehicle or TGF-β (5 ng/ml) under TAZ-siRNA treatment. *P < 0.05, when compared with vehicle. n indicates the number of cell preparation in each group. Transwell cell migration assay of MDA-MB-231 cells treated with vehicle or TGF-β (5 ng/ml) under control-siRNA (O) or TAZ-siRNA treatment (P). (Q) The numbers of migrated cells were counted in the randomly selected fields (x100) per well. n indicates the number of randomly selected fields in each group. *P < 0.05.
Then, we examined the effects of TGF-β treatment on cell migration under TAZ knockdown, in which decreased cell migration (Figure 1) and increased fibronectin abundance (Figure 2) were observed. The transwell migration assay demonstrated that TGF-β treatment significantly increased cell migration in both control-siRNA-treated MDA-MB-231 cells (134 ± 3% of control-siRNA vehicle, P < 0.05, Figures 3O, Q) and TAZ-siRNA-treated MDA-MB-231 cells (143 ± 5% of TAZ-siRNA vehicle, P < 0.05, Figures 3P, Q).
Next-generation sequencing in MDA-MB-231 cells with siRNA-mediated TAZ knockdown
The effects of siRNA-mediated TAZ knockdown on gene expression and gene ontology were studied using NGS. Using DESeq2, DEGs (differentially expressed genes) were identified by comparing MDA-MB-231 cells treated with control-siRNA and TAZ-siRNA. 285 genes met the criteria of fold change ≥ 2 and P value < 0.05. After excluding cases where expression levels were either zero or rarely detected, 140 genes were selected. Table 2 shows the 78 genes with increased expression levels and 62 genes with decreased expression levels.
Table 2
| Gene_Symbol | Transcript_ID | Description | Gene expression | p-Value | *Fold change |
|---|---|---|---|---|---|
| ACAP1 | NM_014716 | ArfGAP with coiled-coil, ankyrin repeat and PH domains 1 | upregulated | 0.004949308 | 2.050517268 |
| ADAM19 | NM_033274 | ADAM metallopeptidase domain 19 | upregulated | 2.26011E-34 | 2.241697685 |
| ADORA1 | NM_000674 | adenosine A1 receptor | upregulated | 7.57317E-10 | 2.005889332 |
| ASB2 | NM_001202429 | ankyrin repeat and SOCS box containing 2 | upregulated | 0.004604688 | 2.02119655 |
| ASPRV1 | NM_152792 | aspartic peptidase retroviral like 1 | upregulated | 0.004463118 | 2.36156629 |
| ATP2B2 | NM_001001331 | ATPase plasma membrane Ca2+ transporting 2 | upregulated | 6.1251E-05 | 2.257761163 |
| ATP5MF-PTCD1 | NM_001198879 | ATP5MF-PTCD1 readthrough | upregulated | 0.01180048 | 2.158618851 |
| B3GALT4 | NM_003782 | beta-1,3-galactosyltransferase 4 | upregulated | 0.002678431 | 2.120775696 |
| B3GNT7 | NM_145236 | UDP-GlcNAc:betaGal beta-1,3-N-acetylglucosaminyltransferase 7 | upregulated | 0.002001943 | 3.695922388 |
| BDKRB2 | NM_000623 | bradykinin receptor B2 | upregulated | 6.44346E-24 | 2.237463238 |
| C1QTNF2 | NM_001366504 | C1q and TNF related 2 | upregulated | 0.001434428 | 2.030810691 |
| CACNA1H | NM_001005407 | calcium voltage-gated channel subunit alpha1 H | upregulated | 0.000228487 | 2.29453092 |
| CALHM5 | NM_153711 | calcium homeostasis modulator family member 5 | upregulated | 1.21204E-05 | 2.585085982 |
| CCDC146 | NM_020879 | coiled-coil domain containing 146 | upregulated | 1.33824E-08 | 2.247317851 |
| CNIH3 | NM_001322302 | cornichon family AMPA receptor auxiliary protein 3 | upregulated | 2.76126E-15 | 2.04075093 |
| CREB3L3 | NM_001271995 | cAMP responsive element binding protein 3 like 3 | upregulated | 0.000785913 | 2.141721197 |
| CST1 | NM_001898 | cystatin SN | upregulated | 2.29545E-23 | 2.126122181 |
| CST2 | NM_001322 | cystatin SA | upregulated | 1.79636E-08 | 2.077961636 |
| CTTNBP2 | NM_001363349 | cortactin binding protein 2 | upregulated | 0.002054734 | 2.065075445 |
| CYGB | NM_134268 | cytoglobin | upregulated | 3.01827E-05 | 2.408874975 |
| EBF2 | NM_022659 | EBF transcription factor 2 | upregulated | 6.03458E-05 | 3.352858635 |
| EGR2 | NM_000399 | early growth response 2 | upregulated | 2.48677E-28 | 2.10662509 |
| EPHB1 | NM_004441 | EPH receptor B1 | upregulated | 0.000315418 | 2.10017562 |
| FRMPD3 | NM_032428 | FERM and PDZ domain containing 3 | upregulated | 9.90805E-05 | 2.057414227 |
| GALNT9 | NM_001122636 | polypeptide N-acetylgalactosaminyltransferase 9 | upregulated | 0.000471314 | 2.153385179 |
| GAS7 | NM_001130831 | growth arrest specific 7 | upregulated | 5.99582E-11 | 2.530431268 |
| GLI1 | NM_001160045 | GLI family zinc finger 1 | upregulated | 0.000975769 | 2.386161697 |
| GLI2 | NM_001371271 | GLI family zinc finger 2 | upregulated | 3.08373E-09 | 2.112878586 |
| GPR75-ASB3 | NM_001164165 | GPR75-ASB3 readthrough | upregulated | 0.000433613 | 10.14243653 |
| GRIK4 | NM_001282470 | glutamate ionotropic receptor kainate type subunit 4 | upregulated | 0.005584754 | 2.280123644 |
| GRIN2D | NM_000836 | glutamate ionotropic receptor NMDA type subunit 2D | upregulated | 0.003465746 | 2.212926712 |
| HOXC4 | NM_014620 | homeobox C4 | upregulated | 0.002403674 | 2.570203546 |
| HS3ST5 | NM_153612 | heparan sulfate-glucosamine 3-sulfotransferase 5 | upregulated | 0.001772065 | 2.987878292 |
| ISY1-RAB43 | NM_001204890 | ISY1-RAB43 readthrough | upregulated | 0.002365041 | 2.091108351 |
| ITGB8 | NM_002214 | integrin subunit beta 8 | upregulated | 2.57859E-10 | 2.879197568 |
| JAKMIP2 | NM_001270934 | janus kinase and microtubule interacting protein 2 | upregulated | 4.40569E-15 | 2.289780135 |
| KIAA0319 | NM_001168374 | KIAA0319 | upregulated | 3.50748E-05 | 2.036202765 |
| LINGO2 | NM_001258282 | leucine rich repeat and Ig domain containing 2 | upregulated | 0.000259012 | 2.100330628 |
| LRP1B | NM_018557 | LDL receptor related protein 1B | upregulated | 3.08927E-11 | 2.196172524 |
| LYNX1 | NM_001356370 | Ly6/neurotoxin 1 | upregulated | 5.58439E-06 | 2.261644166 |
| MAP1A | NM_002373 | microtubule associated protein 1A | upregulated | 5.65799E-07 | 2.042410989 |
| MEF2B | NM_001145785 | myocyte enhancer factor 2B | upregulated | 0.007041908 | 3.222022292 |
| MMP13 | NM_002427 | matrix metallopeptidase 13 | upregulated | 1.69723E-05 | 2.189041085 |
| MUC5AC | NM_001304359 | mucin 5AC, oligomeric mucus/gel-forming | upregulated | 6.96806E-07 | 2.335975675 |
| NCALD | NM_001040624 | neurocalcin delta | upregulated | 7.39606E-06 | 2.047862034 |
| NEURL1B | NM_001142651 | neuralized E3 ubiquitin protein ligase 1B | upregulated | 1.46035E-15 | 2.084240965 |
| NOS2 | NM_000625 | nitric oxide synthase 2 | upregulated | 0.006064819 | 2.917128143 |
| NTNG2 | NM_032536 | netrin G2 | upregulated | 1.10923E-18 | 2.647092514 |
| PAPPA | NM_002581 | pappalysin 1 | upregulated | 6.50121E-05 | 2.076060673 |
| PCDHGA10 | NM_018913 | protocadherin gamma subfamily A, 10 | upregulated | 2.17784E-11 | 2.184171382 |
| PCDHGA4 | NM_018917 | protocadherin gamma subfamily A, 4 | upregulated | 0.001059173 | 2.867036292 |
| PCDHGB2 | NM_018923 | protocadherin gamma subfamily B, 2 | upregulated | 9.60892E-05 | 2.067449003 |
| PDE3A | NM_000921 | phosphodiesterase 3A | upregulated | 2.95899E-06 | 2.546710938 |
| PIWIL4 | NM_152431 | piwi like RNA-mediated gene silencing 4 | upregulated | 0.001863325 | 2.558595344 |
| PLA2G3 | NM_015715 | phospholipase A2 group III | upregulated | 0.009640603 | 2.523948258 |
| PRSS2 | NM_001303414 | serine protease 2 | upregulated | 1.01379E-06 | 4.049252026 |
| RAPGEF4 | NM_001100397 | Rap guanine nucleotide exchange factor 4 | upregulated | 1.87693E-08 | 2.09450615 |
| RIBC1 | NM_001031745 | RIB43A domain with coiled-coils 1 | upregulated | 0.006111328 | 2.352863559 |
| RSAD2 | NM_080657 | radical S-adenosyl methionine domain containing 2 | upregulated | 1.79674E-10 | 2.686175673 |
| SCN3A | NM_001081676 | sodium voltage-gated channel alpha subunit 3 | upregulated | 1.96522E-18 | 2.339632917 |
| SDC3 | NM_014654 | syndecan 3 | upregulated | 3.30358E-23 | 2.129624098 |
| SEMA6B | NM_032108 | semaphorin 6B | upregulated | 3.32935E-19 | 2.033166468 |
| SHC3 | NM_016848 | SHC adaptor protein 3 | upregulated | 2.39484E-16 | 2.059833666 |
| SHISAL1 | NM_001099294 | shisa like 1 | upregulated | 1.59111E-43 | 4.371413572 |
| SIDT1 | NM_001308350 | SID1 transmembrane family member 1 | upregulated | 5.19619E-08 | 2.184384332 |
| SKOR1 | NM_001365915 | SKI family transcriptional corepressor 1 | upregulated | 5.52554E-05 | 2.605223616 |
| SLC16A14 | NM_152527 | solute carrier family 16 member 14 | upregulated | 8.96874E-08 | 2.805860918 |
| SLC7A9 | NM_001126335 | solute carrier family 7 member 9 | upregulated | 0.008918305 | 2.234025665 |
| SLCO3A1 | NM_001145044 | solute carrier organic anion transporter family member 3A1 | upregulated | 3.77828E-28 | 2.029622149 |
| SLIT1 | NM_003061 | slit guidance ligand 1 | upregulated | 0.000330772 | 2.601772769 |
| SNED1 | NM_001080437 | sushi, nidogen and EGF like domains 1 | upregulated | 5.38365E-27 | 2.063355178 |
| SORCS2 | NM_020777 | sortilin related VPS10 domain containing receptor 2 | upregulated | 0.004475073 | 2.793598438 |
| SOX5 | NM_001261414 | SRY-box transcription factor 5 | upregulated | 3.32301E-09 | 2.299998702 |
| SPOCK3 | NM_001040159 | SPARC (osteonectin), cwcv and kazal like domains proteoglycan 3 | upregulated | 2.61619E-13 | 2.153042128 |
| STON1-GTF2A1L | NM_001198593 | STON1-GTF2A1L readthrough | upregulated | 0.011749062 | 2.527554438 |
| TRPC3 | NM_001130698 | transient receptor potential cation channel subfamily C member 3 | upregulated | 7.37691E-06 | 2.003098213 |
| TSPAN2 | NM_001308315 | tetraspanin 2 | upregulated | 8.34757E-23 | 2.57367749 |
| WNT2B | NM_001291880 | Wnt family member 2B | upregulated | 1.11759E-10 | 2.014696062 |
| ADAMTS6 | NM_197941 | ADAM metallopeptidase with thrombospondin type 1 motif 6 | downregulated | 1.33754E-18 | -2.947030193 |
| ADORA2A | NM_000675 | adenosine A2a receptor | downregulated | 0.000138245 | -5.610140894 |
| ADRB2 | NM_000024 | adrenoceptor beta 2 | downregulated | 5.46856E-30 | -2.165878349 |
| ALPP | NM_001632 | alkaline phosphatase, placental | downregulated | 2.95397E-07 | -4.92898576 |
| ANKRD1 | NM_014391 | ankyrin repeat domain 1 | downregulated | 1.0413E-239 | -7.642980386 |
| ANXA8 | NM_001040084 | annexin A8 | downregulated | 1.05811E-09 | -2.045346899 |
| ATP6V0A4 | NM_020632 | ATPase H+ transporting V0 subunit a4 | downregulated | 1.23259E-20 | -2.867355966 |
| BHLHA15 | NM_177455 | basic helix-loop-helix family member a15 | downregulated | 3.61056E-06 | -2.036769741 |
| BIRC3 | NM_001165 | baculoviral IAP repeat containing 3 | downregulated | 3.77772E-23 | -2.03557939 |
| CALCB | NM_000728 | calcitonin related polypeptide beta | downregulated | 0.006008249 | -2.006325926 |
| CAVIN2 | NM_004657 | caveolae associated protein 2 | downregulated | 1.95421E-37 | -2.508809933 |
| CCBE1 | NM_133459 | collagen and calcium binding EGF domains 1 | downregulated | 5.94893E-12 | -2.01164236 |
| CCDC187 | NM_001291516 | coiled-coil domain containing 187 | downregulated | 0.008829489 | -2.474151393 |
| CCN1 | NM_001554 | cellular communication network factor 1 | downregulated | 8.95353E-47 | -2.682098404 |
| CCN2 | NM_001901 | cellular communication network factor 2 | downregulated | 2.58103E-36 | -2.023159559 |
| CD33 | NM_001082618 | CD33 molecule | downregulated | 0.00355832 | -2.152520404 |
| CLDN1 | NM_021101 | claudin 1 | downregulated | 5.44775E-64 | -3.99767905 |
| CYB5R2 | NM_001302826 | cytochrome b5 reductase 2 | downregulated | 0.002805243 | -2.314005407 |
| DKK1 | NM_012242 | dickkopf WNT signaling pathway inhibitor 1 | downregulated | 8.6222E-115 | -3.421346763 |
| DMBT1 | NM_001320644 | deleted in malignant brain tumors 1 | downregulated | 6.18097E-19 | -2.420670798 |
| DNAH10 | NM_001372106 | dynein axonemal heavy chain 10 | downregulated | 0.000264421 | -2.241281661 |
| EDN1 | NM_001168319 | endothelin 1 | downregulated | 1.22556E-21 | -2.610701767 |
| FAM71D | NM_173526 | family with sequence similarity 71 member D | downregulated | 2.09536E-07 | -4.874890615 |
| FCMR | NM_001142473 | Fc fragment of IgM receptor | downregulated | 8.29639E-05 | -2.723808531 |
| FGF1 | NM_000800 | fibroblast growth factor 1 | downregulated | 7.87286E-05 | -2.957285531 |
| FSBP | NM_001256141 | fibrinogen silencer binding protein | downregulated | 0.00499564 | -4.225295114 |
| IGF2 | NM_000612 | insulin like growth factor 2 | downregulated | 0.001368233 | -2.935129821 |
| IL32 | NM_001012631 | interleukin 32 | downregulated | 2.6262E-08 | -2.229805348 |
| INSL4 | NM_002195 | insulin like 4 | downregulated | 0.003824492 | -2.351407347 |
| KISS1 | NM_002256 | KiSS-1 metastasis suppressor | downregulated | 3.59686E-15 | -2.813016872 |
| KLF15 | NM_014079 | Kruppel like factor 15 | downregulated | 4.04905E-09 | -2.624248806 |
| KLHDC7B | NM_138433 | kelch domain containing 7B | downregulated | 0.000643973 | -2.74562398 |
| KRT34 | NM_021013 | keratin 34 | downregulated | 2.99731E-06 | -2.438219034 |
| KRTAP2-3 | NM_001165252 | keratin associated protein 2-3 | downregulated | 1.82545E-70 | -28.21070197 |
| LAMA1 | NM_005559 | laminin subunit alpha 1 | downregulated | 1.6628E-08 | -2.277195707 |
| LINC01638 | NM_001350812 | long intergenic non-protein coding RNA 1638 | downregulated | 0.012699043 | -2.051900622 |
| LPAR1 | NM_001351397 | lysophosphatidic acid receptor 1 | downregulated | 1.98376E-56 | -3.563934724 |
| MIOX | NM_017584 | myo-inositol oxygenase | downregulated | 1.81877E-07 | -3.236151315 |
| MYPN | NM_001256267 | myopalladin | downregulated | 1.19265E-06 | -2.918838385 |
| NCKAP1L | NM_001184976 | NCK associated protein 1 like | downregulated | 1.56938E-05 | -2.685570058 |
| NGF | NM_002506 | nerve growth factor | downregulated | 1.15007E-05 | -2.482904593 |
| NNMT | NM_001372045 | nicotinamide N-methyltransferase | downregulated | 0.00010588 | -2.451627125 |
| NUPR1 | NM_001042483 | nuclear protein 1, transcriptional regulator | downregulated | 2.36919E-08 | -2.304730661 |
| OLAH | NM_001039702 | oleoyl-ACP hydrolase | downregulated | 2.82214E-05 | -4.434731739 |
| PAWR | NM_001354732 | pro-apoptotic WT1 regulator | downregulated | 2.16924E-58 | -2.009112218 |
| PDGFB | NM_002608 | platelet derived growth factor subunit B | downregulated | 7.0234E-20 | -2.500457341 |
| PIK3R5 | NM_001142633 | phosphoinositide-3-kinase regulatory subunit 5 | downregulated | 0.002895495 | -2.979348849 |
| PRR16 | NM_001300783 | proline rich 16 | downregulated | 5.34033E-10 | -2.019548481 |
| RELN | NM_005045 | reelin | downregulated | 0.000737683 | -2.39185058 |
| RGS7 | NM_001282773 | regulator of G protein signaling 7 | downregulated | 0.004049836 | -2.069475563 |
| RIMS2 | NM_001100117 | regulating synaptic membrane exocytosis 2 | downregulated | 1.00694E-20 | -3.412280862 |
| SCEL | NM_001160706 | sciellin | downregulated | 9.95617E-11 | -5.055784635 |
| SNAPC1 | NM_003082 | small nuclear RNA activating complex polypeptide 1 | downregulated | 1.09615E-68 | -2.102240661 |
| ST6GALNAC5 | NM_001320273 | ST6 N-acetylgalactosaminide alpha-2,6-sialyltransferase 5 | downregulated | 5.3001E-13 | -5.875676597 |
| STK31 | NM_001260504 | serine/threonine kinase 31 | downregulated | 1.11305E-12 | -3.184050246 |
| STMN3 | NM_001276310 | stathmin 3 | downregulated | 0.000998287 | -2.503628441 |
| TGFB2 | NM_001135599 | transforming growth factor beta 2 | downregulated | 1.9667E-55 | -2.544268019 |
| TNFSF15 | NM_001204344 | TNF superfamily member 15 | downregulated | 0.000385755 | -2.409755599 |
| TNFSF18 | NM_005092 | TNF superfamily member 18 | downregulated | 9.64041E-05 | -3.788137775 |
| TREX1 | NM_007248 | three prime repair exonuclease 1 | downregulated | 3.83515E-05 | -2.162873135 |
| WWTR1 | NM_001168278 | WW domain containing transcription regulator 1 | downregulated | 0 | -11.55672309 |
Significantly changed gene expressions.
*Fold change: siRNA-mediated TAZ knockdown vs. control-siRNA treatment in MDA-MB-231 cells.
Next, NGS data were categorized using the Pathcards database (https://pathcards.genecards.org), an integrated database consolidating 1,626 SuperPath entries from 11 sources and clustering human pathways based on gene content similarity. Each PathCard offers information about a SuperPath, representing one or more human pathways (32). The superpathway regarding the “cytoskeleton remodeling regulation of actin cytoskeleton by Rho GTPases” had the highest relevance score among the actin-related pathways (https://pathcards.genecards.org/Search/Results?query=actin). The superpathway includes 5 subpathways. A total of 187 genes were included in the superpathways database, and 68 genes from our NGS data were found in the superpathways (Table 3). The superpathway regarding the “actin nucleation by ARP-WASP complex” had the second highest relevance score among the actin-related pathways. The superpathway consists of 4 subpathways, including a total of 344 genes, and 109 genes in our NGS data were found in the superpathways (Table 4).
Table 3
| Gene symbol | Description | *Fold change | p-Value | Pathways | ||||
|---|---|---|---|---|---|---|---|---|
| 1 | 2 | 3 | 4 | 5 | ||||
| CLDN1 | claudin 1 | -3.99767905 | 5.4477E-64 | o | x | o | x | o |
| NGF | nerve growth factor | -2.482904593 | 1.1501E-05 | x | x | x | o | x |
| MYH16 | myosin heavy chain 16 pseudogene | -2.456489246 | 0.02661264 | x | o | o | x | x |
| LAMA1 | laminin subunit alpha 1 | -2.277195707 | 1.6628E-08 | x | x | x | o | x |
| MYLK | myosin light chain kinase | -1.766201798 | 9.2088E-18 | x | x | o | x | x |
| CAV1 | caveolin 1 | -1.517664331 | 2.8082E-31 | o | x | o | x | x |
| TJP3 | tight junction protein 3 | -1.498195657 | 0.02635195 | o | o | x | x | x |
| BDNF | brain derived neurotrophic factor | -1.35723822 | 5.6757E-10 | x | x | x | o | x |
| LIMK1 | LIM domain kinase 1 | -1.283294164 | 1.356E-09 | o | x | o | x | o |
| MYL5 | myosin light chain 5 | -1.24055366 | 0.0363567 | o | x | x | x | o |
| MTDH | metadherin | -1.195451363 | 6.4973E-05 | x | x | x | x | o |
| PARVA | parvin alpha | -1.147989421 | 0.00068592 | x | o | x | o | x |
| ARPC1A | actin related protein 2/3 complex subunit 1A | -1.142329517 | 0.00121682 | x | x | x | o | x |
| ACTG1 | actin gamma 1 | -1.139588554 | 0.00126064 | x | x | o | o | x |
| LAMB1 | laminin subunit beta 1 | -1.137453523 | 0.00476849 | o | x | o | o | o |
| ARPC3 | actin related protein 2/3 complex subunit 3 | -1.134523376 | 0.00310162 | o | o | x | x | x |
| AKT1 | AKT serine/threonine kinase 1 | -1.122800151 | 0.00377361 | o | o | x | x | x |
| ACTR2 | actin related protein 2 | -1.113349939 | 0.02293064 | x | x | x | x | o |
| PFN1 | profilin 1 | -1.102688536 | 0.04932765 | x | o | x | x | x |
| MAP2K2 | mitogen-activated protein kinase kinase 2 | -1.101010313 | 0.02770762 | x | o | x | x | x |
| LIMS1 | LIM zinc finger domain containing 1 | -1.099780659 | 0.02882081 | o | o | x | x | x |
| TJP1 | tight junction protein 1 | -1.096777222 | 0.03364182 | o | o | x | x | x |
| RAC1 | Rac family small GTPase 1 | -1.095428061 | 0.02060815 | x | x | x | o | x |
| RHOA | ras homolog family member A | -1.081022243 | 0.04842445 | x | o | x | x | o |
| NECTIN1 | nectin cell adhesion molecule 1 | 1.822283021 | 1.6983E-11 | x | x | x | x | o |
| CGN | cingulin | 1.519925052 | 0.00020374 | o | x | o | x | o |
| ACTA2 | actin alpha 2, smooth muscle | 1.474911523 | 0.00037032 | x | x | x | o | x |
| ITGA5 | integrin subunit alpha 5 | 1.42891795 | 6.2022E-19 | x | o | x | x | x |
| ITGA2 | integrin subunit alpha 2 | 1.410654554 | 2.8573E-17 | x | x | x | o | x |
| COL1A1 | collagen type I alpha 1 chain | 1.341339411 | 8.1901E-05 | o | o | o | x | x |
| CLDN4 | claudin 4 | 1.332312801 | 1.0855E-05 | x | x | x | x | o |
| F11R | F11 receptor | 1.329528093 | 2.8868E-10 | o | x | o | o | o |
| PIP5K1C | phosphatidylinositol-4-phosphate 5-kinase type 1 gamma | 1.323904977 | 8.9421E-06 | x | x | x | x | o |
| LAMC1 | laminin subunit gamma 1 | 1.310431122 | 5.196E-09 | x | x | o | x | x |
| SOS1 | SOS Ras/Rac guanine nucleotide exchange factor 1 | 1.309673303 | 3.1039E-08 | x | x | x | o | x |
| GSK3B | glycogen synthase kinase 3 beta | 1.284382287 | 1.6098E-05 | o | x | o | o | o |
| COL4A2 | collagen type IV alpha 2 chain | 1.284017641 | 1.5696E-06 | o | o | o | x | x |
| NKX2-1 | NK2 homeobox 1 | 1.224347264 | 0.00039888 | o | o | o | x | x |
| TCF7L1 | transcription factor 7 like 1 | 1.214999894 | 0.03303257 | x | x | x | x | o |
| ITGA3 | integrin subunit alpha 3 | 1.209847644 | 6.5632E-06 | x | o | x | x | x |
| VCL | vinculin | 1.202821163 | 2.8119E-05 | o | o | o | x | x |
| ARHGDIA | Rho GDP dissociation inhibitor alpha | 1.200288011 | 1.5837E-05 | x | x | x | x | o |
| JUN | Jun proto-oncogene, AP-1 transcription factor subunit | 1.189242711 | 0.00313305 | x | x | x | o | x |
| MYL9 | myosin light chain 9 | 1.187975048 | 3.1899E-05 | o | o | x | x | x |
| ITGB3 | integrin subunit beta 3 | 1.186807455 | 0.02016037 | x | o | x | x | x |
| AKT3 | AKT serine/threonine kinase 3 | 1.179099523 | 0.00061083 | x | x | x | x | o |
| AFDN | afadin, adherens junction formation factor | 1.170414867 | 0.00180193 | o | x | x | x | x |
| PAK1 | p21 (RAC1) activated kinase 1 | 1.163451028 | 0.0006292 | o | x | o | o | o |
| OCLN | occludin | 1.163300921 | 0.01288947 | x | o | x | x | x |
| FSCN1 | fascin actin-bundling protein 1 | 1.154980882 | 0.00047982 | x | o | x | x | x |
| PSEN1 | presenilin 1 | 1.153257277 | 0.00073728 | o | o | x | x | x |
| ITGAV | integrin subunit alpha V | 1.1530368 | 0.00185572 | x | x | x | o | x |
| COL4A1 | collagen type IV alpha 1 chain | 1.15161724 | 0.01119491 | x | o | x | x | x |
| MYH10 | myosin heavy chain 10 | 1.14590334 | 0.02421947 | o | x | o | o | o |
| CFL2 | cofilin 2 | 1.145469135 | 0.00048494 | x | o | x | x | x |
| APH1B | aph-1 homolog B, gamma-secretase subunit | 1.137905039 | 0.04616204 | o | o | x | x | x |
| MPDZ | multiple PDZ domain crumbs cell polarity complex component | 1.133446898 | 0.02275105 | o | x | o | x | x |
| PTK2 | protein tyrosine kinase 2 | 1.119547762 | 0.0108876 | o | o | x | x | x |
| DOCK1 | dedicator of cytokinesis 1 | 1.113358015 | 0.04466996 | x | x | x | o | x |
| FN1 | fibronectin 1 | 1.110664249 | 0.00607455 | o | o | o | x | x |
| MAPK1 | mitogen-activated protein kinase 1 | 1.110169679 | 0.01551715 | o | o | x | x | x |
| ITGB1 | integrin subunit beta 1 | 1.104527597 | 0.00940893 | o | o | o | x | x |
| CTNNB1 | catenin beta 1 | 1.100673225 | 0.00977357 | o | x | x | x | x |
| ARHGAP32 | Rho GTPase activating protein 32 | 1.099262279 | 0.03856255 | o | x | o | x | x |
| CDC42 | cell division cycle 42 | 1.096140069 | 0.01942584 | o | o | x | x | x |
| PPP1CB | protein phosphatase 1 catalytic subunit beta | 1.090758523 | 0.0204361 | x | x | x | o | x |
| ARPC5 | actin related protein 2/3 complex subunit 5 | 1.088349017 | 0.02903029 | x | x | x | o | x |
| ACTB | actin beta | 1.085123631 | 0.03165157 | o | o | o | o | o |
Cytoskeleton remodeling regulation of actin cytoskeleton by Rho GTPases.
*Fold change: siRNA-mediated TAZ knockdown vs. control-siRNA treatment in MDA-MB-231 cells.
Five pathways included in the Cytoskeleton remodeling Regulation of actin cytoskeleton by Rho GTPases.
1. Cell adhesion Integrin-mediated cell adhesion and migration.
2. Cytoskeleton remodeling Integrin outside-in signaling.
3. Cytoskeleton remodeling Regulation of actin cytoskeleton by Rho GTPases.
4. Cell adhesion Tight junctions.
5. Development MAG-dependent inhibition of neurite outgrowth.
o indicates the genes involved in each pathway.
x indicates the genes not involved in each pathway.
Table 4
| Gene symbol | Description | *Fold change | p-Value | Pathways | |||
|---|---|---|---|---|---|---|---|
| 1 | 2 | 3 | 4 | ||||
| LPAR1 | lysophosphatidic acid receptor 1 | -3.563934724 | 1.9838E-56 | o | x | x | x |
| IGF2 | insulin like growth factor 2 | -2.935129821 | 0.00136823 | o | x | x | x |
| MYLK | myosin light chain kinase | -1.766201798 | 9.2088E-18 | o | x | x | o |
| ARHGEF16 | Rho guanine nucleotide exchange factor 16 | -1.341379419 | 0.00116608 | o | x | x | x |
| DIAPH3 | diaphanous related formin 3 | -1.322755836 | 5.2985E-09 | x | x | x | o |
| ANAPC11 | anaphase promoting complex subunit 11 | -1.311004082 | 3.3428E-05 | x | x | x | o |
| FGFR4 | fibroblast growth factor receptor 4 | -1.304664841 | 0.04253518 | x | o | o | o |
| LIMK1 | LIM domain kinase 1 | -1.283294164 | 1.356E-09 | o | x | o | o |
| AXL | AXL receptor tyrosine kinase | -1.272280842 | 6.9603E-09 | x | o | o | o |
| CDC42EP2 | CDC42 effector protein 2 | -1.253520617 | 0.00016956 | o | x | x | o |
| MYL5 | myosin light chain 5 | -1.24055366 | 0.0363567 | o | o | x | x |
| MYO1C | myosin IC | -1.240502602 | 6.912E-09 | o | o | x | x |
| CDC42EP1 | CDC42 effector protein 1 | -1.223862456 | 1.6408E-05 | o | x | x | x |
| ARHGAP1 | Rho GTPase activating protein 1 | -1.191913598 | 0.00013602 | o | x | x | o |
| RHOD | ras homolog family member D | -1.186898355 | 0.02239112 | x | o | o | x |
| CDC16 | cell division cycle 16 | -1.164967396 | 0.00022158 | x | x | x | o |
| PKN1 | protein kinase N1 | -1.162509401 | 4.7476E-05 | o | x | x | x |
| EGFR | epidermal growth factor receptor | -1.154558601 | 0.00039365 | x | o | o | o |
| ANAPC13 | anaphase promoting complex subunit 13 | -1.154069336 | 0.00442327 | x | x | x | o |
| RHOQ | ras homolog family member Q | -1.151634797 | 0.02200722 | x | o | o | x |
| MET | MET proto-oncogene, receptor tyrosine kinase | -1.145460301 | 0.00508763 | x | o | o | o |
| ACTG1 | actin gamma 1 | -1.139588554 | 0.00126064 | o | o | o | o |
| SLC9A1 | solute carrier family 9 member A1 | -1.138542976 | 0.04042663 | o | x | x | x |
| NCK1 | NCK adaptor protein 1 | -1.135705274 | 0.01043462 | x | o | x | x |
| EXOC1 | exocyst complex component 1 | -1.128054763 | 0.00435309 | x | x | x | o |
| EXOC4 | exocyst complex component 4 | -1.116996551 | 0.02846444 | x | x | x | o |
| ARHGEF1 | Rho guanine nucleotide exchange factor 1 | -1.11474951 | 0.01183559 | o | x | x | x |
| ANAPC1 | anaphase promoting complex subunit 1 | -1.113967328 | 0.04915229 | x | x | x | o |
| ACTR2 | actin related protein 2 | -1.113349939 | 0.02293064 | o | o | o | o |
| MYO1B | myosin IB | -1.112310896 | 0.00713856 | o | o | x | x |
| PFN1 | profilin 1 | -1.102688536 | 0.04932765 | o | x | o | x |
| RAC1 | Rac family small GTPase 1 | -1.095428061 | 0.02060815 | x | o | o | x |
| ANAPC5 | anaphase promoting complex subunit 5 | -1.093957201 | 0.04915229 | x | x | x | o |
| RAC2 | Rac family small GTPase 2 | -1.090616496 | 0.04780764 | x | o | o | x |
| RHOA | ras homolog family member A | -1.081022243 | 0.04842445 | o | o | o | x |
| SEPTIN2 | septin 2 | -1.077901985 | 0.03785428 | o | x | 3x | x |
| ITGB8 | integrin subunit beta 8 | 2.879197568 | 2.5786E-10 | o | o | o | o |
| EPHB1 | EPH receptor B1 | 2.10017562 | 0.00031542 | x | o | o | o |
| PAK6 | p21 (RAC1) activated kinase 6 | 1.949324406 | 0.00543178 | x | x | o | x |
| LMTK3 | lemur tyrosine kinase 3 | 1.745155208 | 0.0244554 | x | o | o | o |
| RHOB | ras homolog family member B | 1.689607967 | 6.6832E-21 | x | o | o | x |
| IQGAP2 | IQ motif containing GTPase activating protein 2 | 1.671468429 | 4.3329E-11 | x | x | x | o |
| PTK2B | protein tyrosine kinase 2 beta | 1.655828278 | 4.0174E-08 | o | x | x | x |
| ARHGEF4 | Rho guanine nucleotide exchange factor 4 | 1.641362862 | 8.1958E-08 | o | x | x | x |
| MCF2L | MCF.2 cell line derived transforming sequence like | 1.50313654 | 0.00013788 | o | x | x | x |
| ACTA2 | actin alpha 2, smooth muscle | 1.474911523 | 0.00037032 | o | o | o | o |
| NET1 | neuroepithelial cell transforming 1 | 1.438739422 | 6.8135E-14 | o | x | x | x |
| ITGA5 | integrin subunit alpha 5 | 1.42891795 | 6.2022E-19 | o | o | o | o |
| DDR1 | discoidin domain receptor tyrosine kinase 1 | 1.425857275 | 5.8597E-11 | x | o | o | o |
| ITGA2 | integrin subunit alpha 2 | 1.410654554 | 2.8573E-17 | o | o | o | o |
| FGFR1 | fibroblast growth factor receptor 1 | 1.385355239 | 3.0876E-16 | x | o | o | o |
| MAP3K12 | mitogen-activated protein kinase kinase kinase 12 | 1.378139035 | 2.3852E-06 | x | x | x | o |
| SEPTIN4 | septin 4 | 1.372521899 | 0.00611883 | o | x | x | x |
| CHN2 | chimerin 2 | 1.369051099 | 0.00047132 | o | x | x | x |
| PDGFRB | platelet derived growth factor receptor beta | 1.354335269 | 4.5742E-06 | x | o | o | o |
| LIFR | LIF receptor subunit alpha | 1.351314061 | 1.1386E-07 | x | o | o | o |
| PIP4K2B | phosphatidylinositol-5-phosphate 4-kinase type 2 beta | 1.336482992 | 2.9871E-07 | o | x | x | x |
| PIP5K1C | phosphatidylinositol-4-phosphate 5-kinase type 1 gamma | 1.323904977 | 8.9421E-06 | o | x | x | x |
| ITGA6 | integrin subunit alpha 6 | 1.322962717 | 8.6525E-08 | o | o | o | o |
| EPHB3 | EPH receptor B3 | 1.320573823 | 0.00429305 | x | o | o | o |
| GNAZ | G protein subunit alpha z | 1.308554099 | 0.01242951 | x | o | o | x |
| MYO1E | myosin IE | 1.295857547 | 1.1979E-07 | o | o | x | x |
| ARHGEF3 | Rho guanine nucleotide exchange factor 3 | 1.295099694 | 1.8085E-05 | o | x | x | x |
| ITGB5 | integrin subunit beta 5 | 1.294068834 | 2.6966E-08 | o | o | o | o |
| FGD1 | FYVE, RhoGEF and PH domain containing 1 | 1.293390365 | 0.00276582 | x | x | x | o |
| CHN1 | chimerin 1 | 1.292968441 | 8.408E-07 | o | x | x | x |
| GSK3B | glycogen synthase kinase 3 beta | 1.284382287 | 1.6098E-05 | x | x | x | o |
| ITGB4 | integrin subunit beta 4 | 1.264871913 | 2.0347E-05 | o | o | o | o |
| ARHGAP5 | Rho GTPase activating protein 5 | 1.255481781 | 6.8416E-06 | o | x | x | x |
| HLA-C | major histocompatibility complex, class I, C | 1.254438349 | 1.2528E-06 | x | x | x | o |
| HLA-A | major histocompatibility complex, class I, A | 1.246355082 | 8.0578E-07 | x | x | x | o |
| EPHB4 | EPH receptor B4 | 1.243643416 | 0.00118085 | x | o | o | o |
| HLA-F | major histocompatibility complex, class I, F | 1.238993345 | 0.04650243 | x | x | x | o |
| EPHB2 | EPH receptor B2 | 1.224566405 | 0.00068172 | x | o | o | o |
| HLA-B | major histocompatibility complex, class I, B | 1.215249703 | 0.00014349 | x | x | x | o |
| ITGA3 | integrin subunit alpha 3 | 1.209847644 | 6.5632E-06 | o | o | o | o |
| VCL | vinculin | 1.202821163 | 2.8119E-05 | o | x | x | x |
| ARHGDIA | Rho GDP dissociation inhibitor alpha | 1.200288011 | 1.5837E-05 | o | o | x | x |
| IGF1R | insulin like growth factor 1 receptor | 1.199220562 | 0.01572043 | o | o | o | o |
| JUN | Jun proto-oncogene, AP-1 transcription factor subunit | 1.189242711 | 0.00313305 | x | x | x | o |
| MYL9 | myosin light chain 9 | 1.187975048 | 3.1899E-05 | o | o | x | o |
| MYO9B | myosin IXB | 1.187943016 | 0.00428323 | o | o | x | x |
| PLD1 | phospholipase D1 | 1.187738026 | 0.04987579 | o | x | x | x |
| EPHA2 | EPH receptor A2 | 1.187549756 | 0.00034545 | x | o | o | o |
| ITGB3 | integrin subunit beta 3 | 1.186807455 | 0.02016037 | o | o | o | o |
| MYO5A | myosin VA | 1.186442248 | 0.00036971 | o | o | x | x |
| PPP1R12B | protein phosphatase 1 regulatory subunit 12B | 1.184630095 | 0.04034509 | o | o | x | o |
| ERBB2 | erb-b2 receptor tyrosine kinase 2 | 1.183609587 | 0.01206792 | x | o | o | o |
| EXOC2 | exocyst complex component 2 | 1.180644057 | 0.00091177 | x | x | x | o |
| INSR | insulin receptor | 1.178764715 | 0.0388677 | x | o | o | o |
| MYO10 | myosin X | 1.175458354 | 0.00141153 | o | o | x | x |
| LMTK2 | lemur tyrosine kinase 2 | 1.167684492 | 0.0038115 | x | o | o | o |
| PTK7 | protein tyrosine kinase 7 (inactive) | 1.164691586 | 0.00475138 | x | o | o | o |
| PAK1 | p21 (RAC1) activated kinase 1 | 1.163451028 | 0.0006292 | x | x | o | o |
| ITGAV | integrin subunit alpha V | 1.1530368 | 0.00185572 | o | o | o | o |
| ARHGEF10 | Rho guanine nucleotide exchange factor 10 | 1.148558901 | 0.02088124 | o | x | x | x |
| MYH10 | myosin heavy chain 10 | 1.14590334 | 0.02421947 | o | o | x | x |
| CFL2 | cofilin 2 | 1.145469135 | 0.00048494 | o | x | o | o |
| GNAI1 | G protein subunit alpha i1 | 1.135917237 | 0.01154773 | o | o | o | x |
| CDC23 | cell division cycle 23 | 1.133939819 | 0.00520006 | x | x | x | o |
| GNB4 | G protein subunit beta 4 | 1.129748179 | 0.03846163 | x | o | o | x |
| ARHGEF11 | Rho guanine nucleotide exchange factor 11 | 1.127955696 | 0.04200375 | o | x | x | x |
| GNB5 | G protein subunit beta 5 | 1.125092329 | 0.00858585 | x | o | o | x |
| PTK2 | protein tyrosine kinase 2 | 1.119547762 | 0.0108876 | o | x | x | x |
| FNBP1L | formin binding protein 1 like | 1.116873793 | 0.01280916 | x | x | x | o |
| CDC42EP4 | CDC42 effector protein 4 | 1.116132825 | 0.01300773 | o | x | x | x |
| ITGB1 | integrin subunit beta 1 | 1.104527597 | 0.00940893 | o | o | o | o |
| CDC42 | cell division cycle 42 | 1.096140069 | 0.01942584 | x | o | o | o |
| ACTB | actin beta | 1.085123631 | 0.01735541 | o | o | o | o |
Actin nucleation by ARP-WASP complex.
*Fold change: siRNA-mediated TAZ knockdown vs. control-siRNA treatment in MDA-MB-231 cells.
Four pathways included in Actin nucelation by ARP-WASP complex.
1. RhoA pathway.
2. Actin nucleation by ARP-WASP complex.
3. Actin nucleation and Branching.
4. CDC42 pathway.
o indicates the genes involved in each pathway.
x indicates the genes not involved in each pathway.
In Tables 3, 4 demonstrating NGS data, MYLK, LIMK1, and LPAR1, which are involved in RhoA/ROCK-mediated actin dynamics, were downregulated in response to TAZ knockdown. Moreover, several genes which are involved in regulation of actin dynamics and Rho GTPases, such as ACTG1, ARPC2, ACTR2, RAC1, RHOA, ARHGEF16, DIAPH3, ARHGAP1, RHOD, RHOQ, ARHGEF1, PFN1, and RAC2, were also downregulated in MDA-MB-231 cells with TAZ knockdown.
Next, g:Profiler (https://biit.cs.ut.ee/gprofiler/orth) was used to examine gene ontology to compile a list of important DEGs. Gene set enrichment using functional classification, e.g., the studies of cellular components (CC), molecular functions (MF), and biological processes (BP) were performed. Supplementary Table 1 displays the biological process subcategories in which gene expression was substantially changed in response to TAZ knockdown. Supplementary Table 1 categorizes the genes with significantly increased or decreased expression by TAZ knockdown that are involved in biological processes. Furthermore, we classified genes with significantly increased or decreased expression by TAZ knockdown into molecular functions (Supplementary Table 2).
Rho GTPase protein and mRNA levels in MDA-MB-231 cells with siRNA-mediated TAZ knockdown
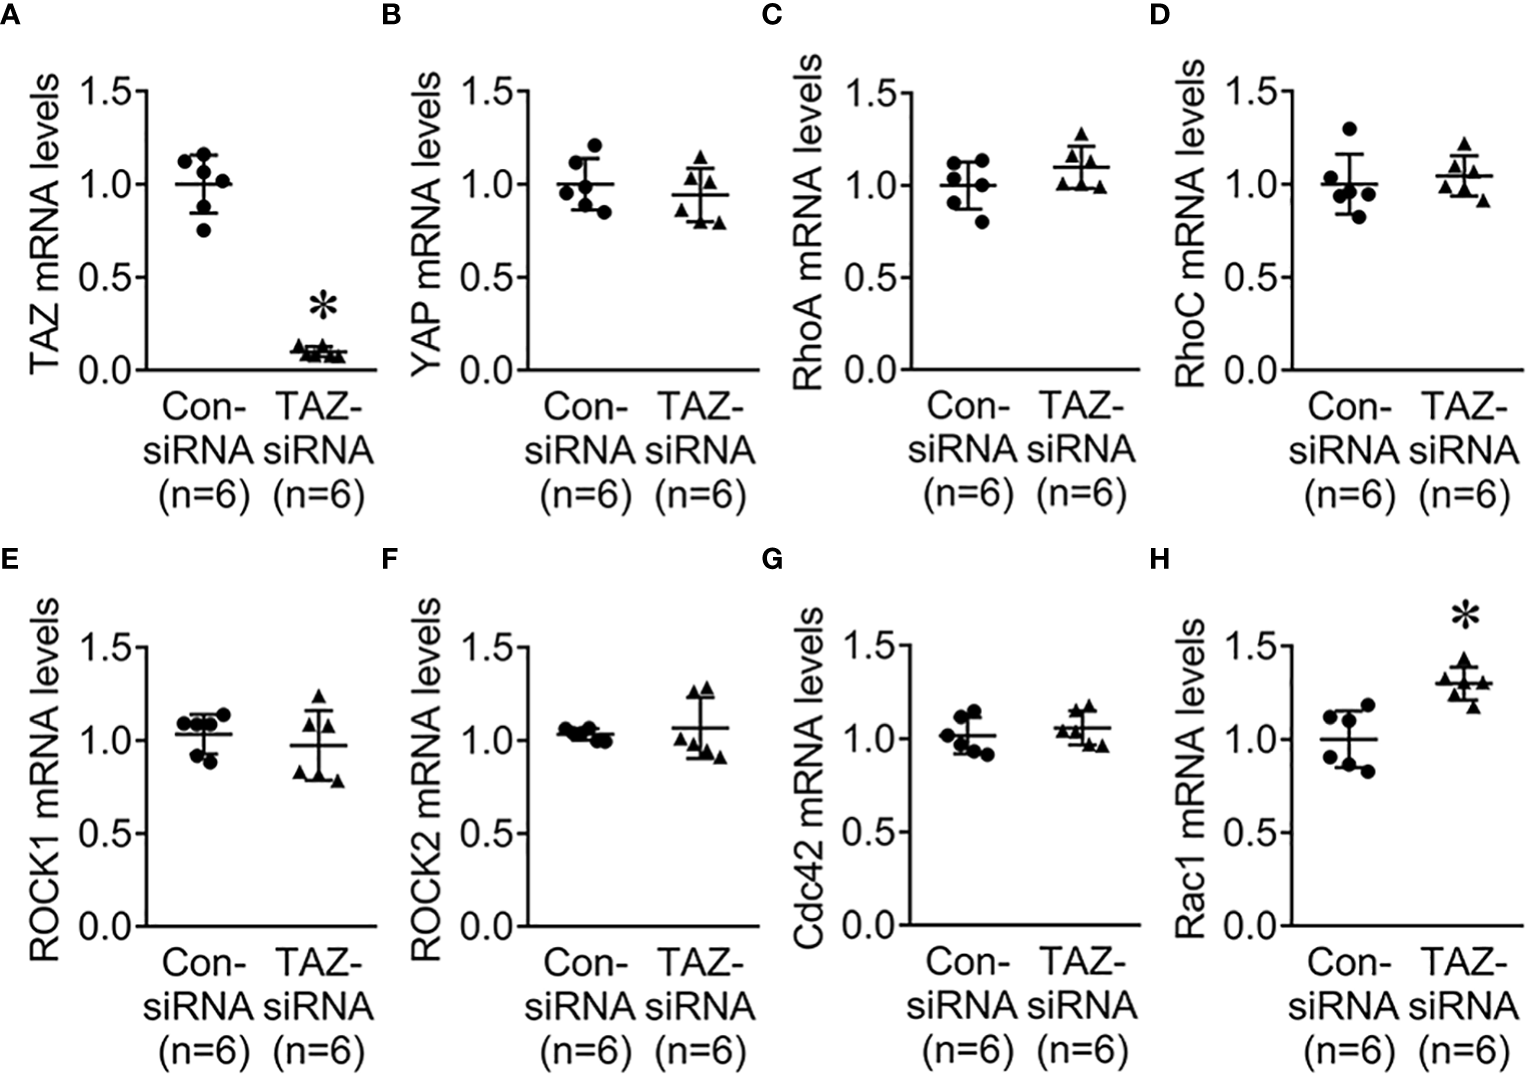
Previous studies revealed that the Rho family GTPases, RhoA, Cdc42, and Rac1, are associated with cytoskeleton rearrangements and cell motility (33, 34). Our NGS data revealed that several genes which are involved in regulation of actin dynamics and Rho GTPases were downregulated in MDA-MB-231 cells with TAZ knockdown (Tables 3, 4). The alterations in the abundance of Rho GTPase proteins and mRNAs were further examined in MDA-MB-231 cells with siRNA-mediated TAZ knockdown. siRNA-mediated TAZ knockdown significantly decreased the protein abundance of TAZ (5 ± 2% of control-siRNA, Figures 4A, B), RhoA (50 ± 5% of control-siRNA, P < 0.05, Figures 4A, D). In contrast, YAP, ROCK, RhoC, Cdc42, and Rac1 were unchanged (Figures 4A, C, E–H). In addition, quantitative real-time PCR demonstrated that TAZ-siRNA mediated TAZ knockdown significantly decreased TAZ mRNA expression (10 ± 6% of control-siRNA, P < 0.05, Figure 5A). In contrast, RAC1 mRNA levels were increased (130 ± 7% of control-siRNA, P < 0.05, Figure 5H) in TAZ-knockdown condition, whereas YAP, RHOA, RHOC, ROCK1, ROCK2 and CDC42 mRNA levels were unchanged (Figures 5B–G).
Figure 4
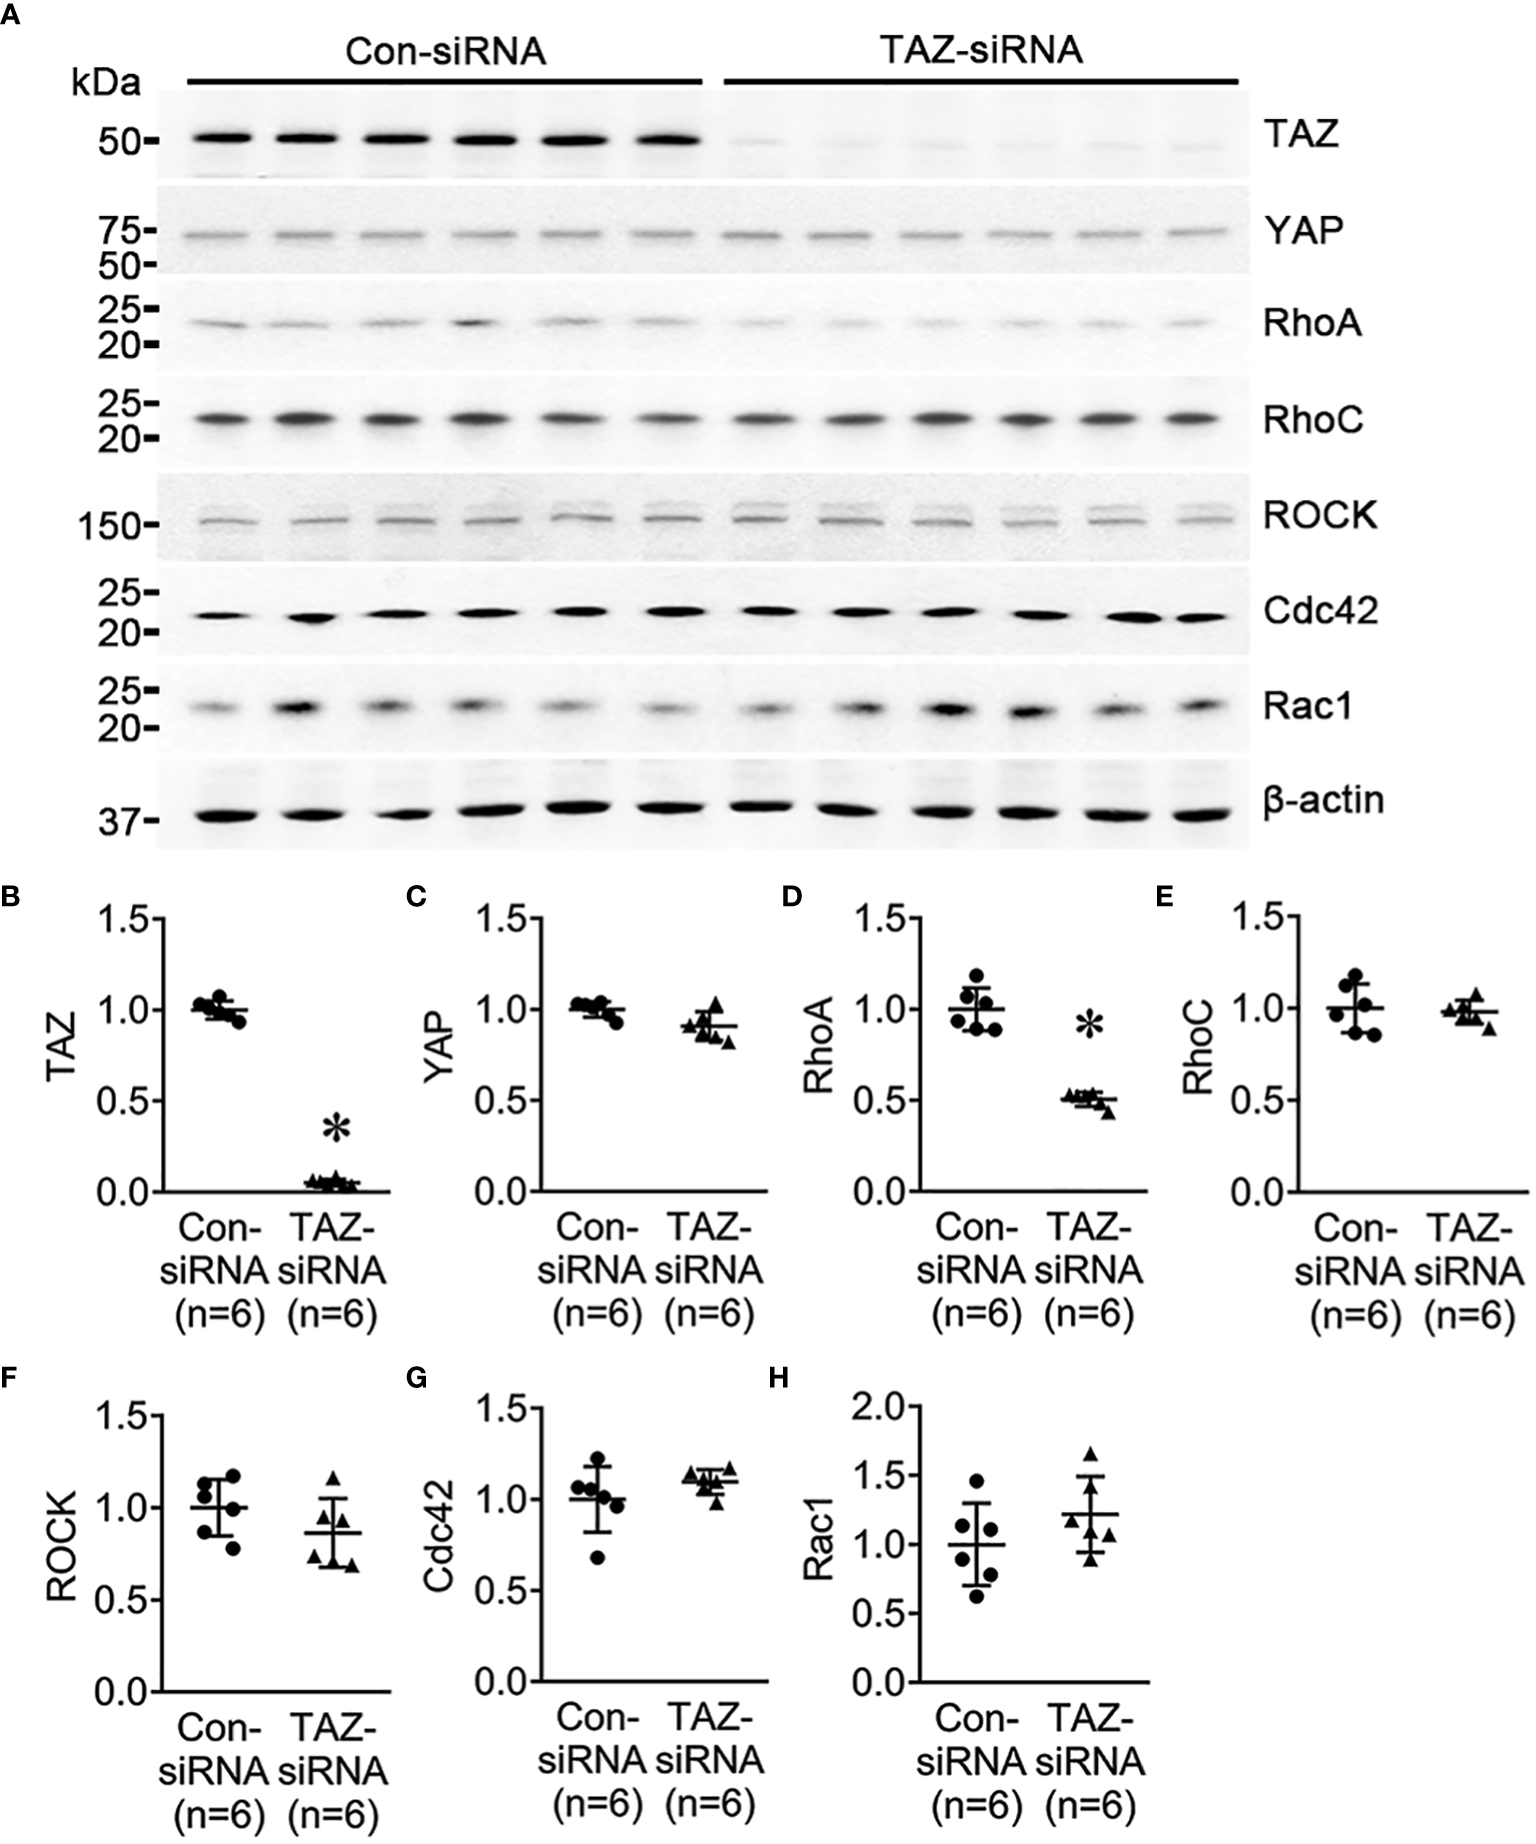
Semiquantitative immunoblotting for Rho family GTPases. Changes in Rho GTPase protein abundance in breast cancer cells treated with control-siRNA or TAZ-siRNA. (A–H) Semiquantitative immunoblotting of TAZ, YAP, RhoA, RhoC, ROCK, Cdc42, Rac1, and β-actin in MDA-MB-231 cells treated with control-siRNA or TAZ-siRNA. The immunoblots were reacted with antibodies against TAZ (~49 kDa), RhoA (~22 kDa), RhoC (~21 kDa), ROCK (~158 kDa), Cdc42 (~21 kDa), Rac1 (~21 kDa), and β-actin (~42 kDa).
Figure 5
Quantitative real-time PCR for Rho family GTPases. (A–H) mRNA levels of TAZ, YAP, RhoA, RhoC, ROCK1, ROCK2, Cdc42, and Rac1 in MDA-MB-231 cells treated with control-siRNA or TAZ-siRNA. *P < 0.05, when compared with control-siRNA. n indicates the number of cell preparation in each group.
Next, we investigated the changes in cell migration in response to siRNA-mediated RhoA knockdown. MDA-MB-231 were treated for 24 h with control-siRNA, TAZ-siRNA, or RhoA-siRNA. Immunoblot analysis demonstrated that RhoA knockdown was induced by RhoA-siRNA treatment in MDA-MB-231 cells (Figures 6A, B). RhoA-siRNA treatment significantly decreased the protein abundance of RhoA (6 ± 13% of control-siRNA, P < 0.05, Figures 6A, B) and TAZ (73 ± 6% of control-siRNA, P < 0.05, Figures 6A, C). The transwell migration assay demonstrated that migration of MDA-MB-231 cells was significantly decreased in response to TAZ-siRNA-mediated knockdown (59 ± 3% of control-siRNA treated cells, P < 0.05, Figures 6D, E) or RhoA-siRNA-mediated knockdown (33 ± 2% of control-siRNA treated cells, P < 0.05, Figures 6D, E).
Figure 6
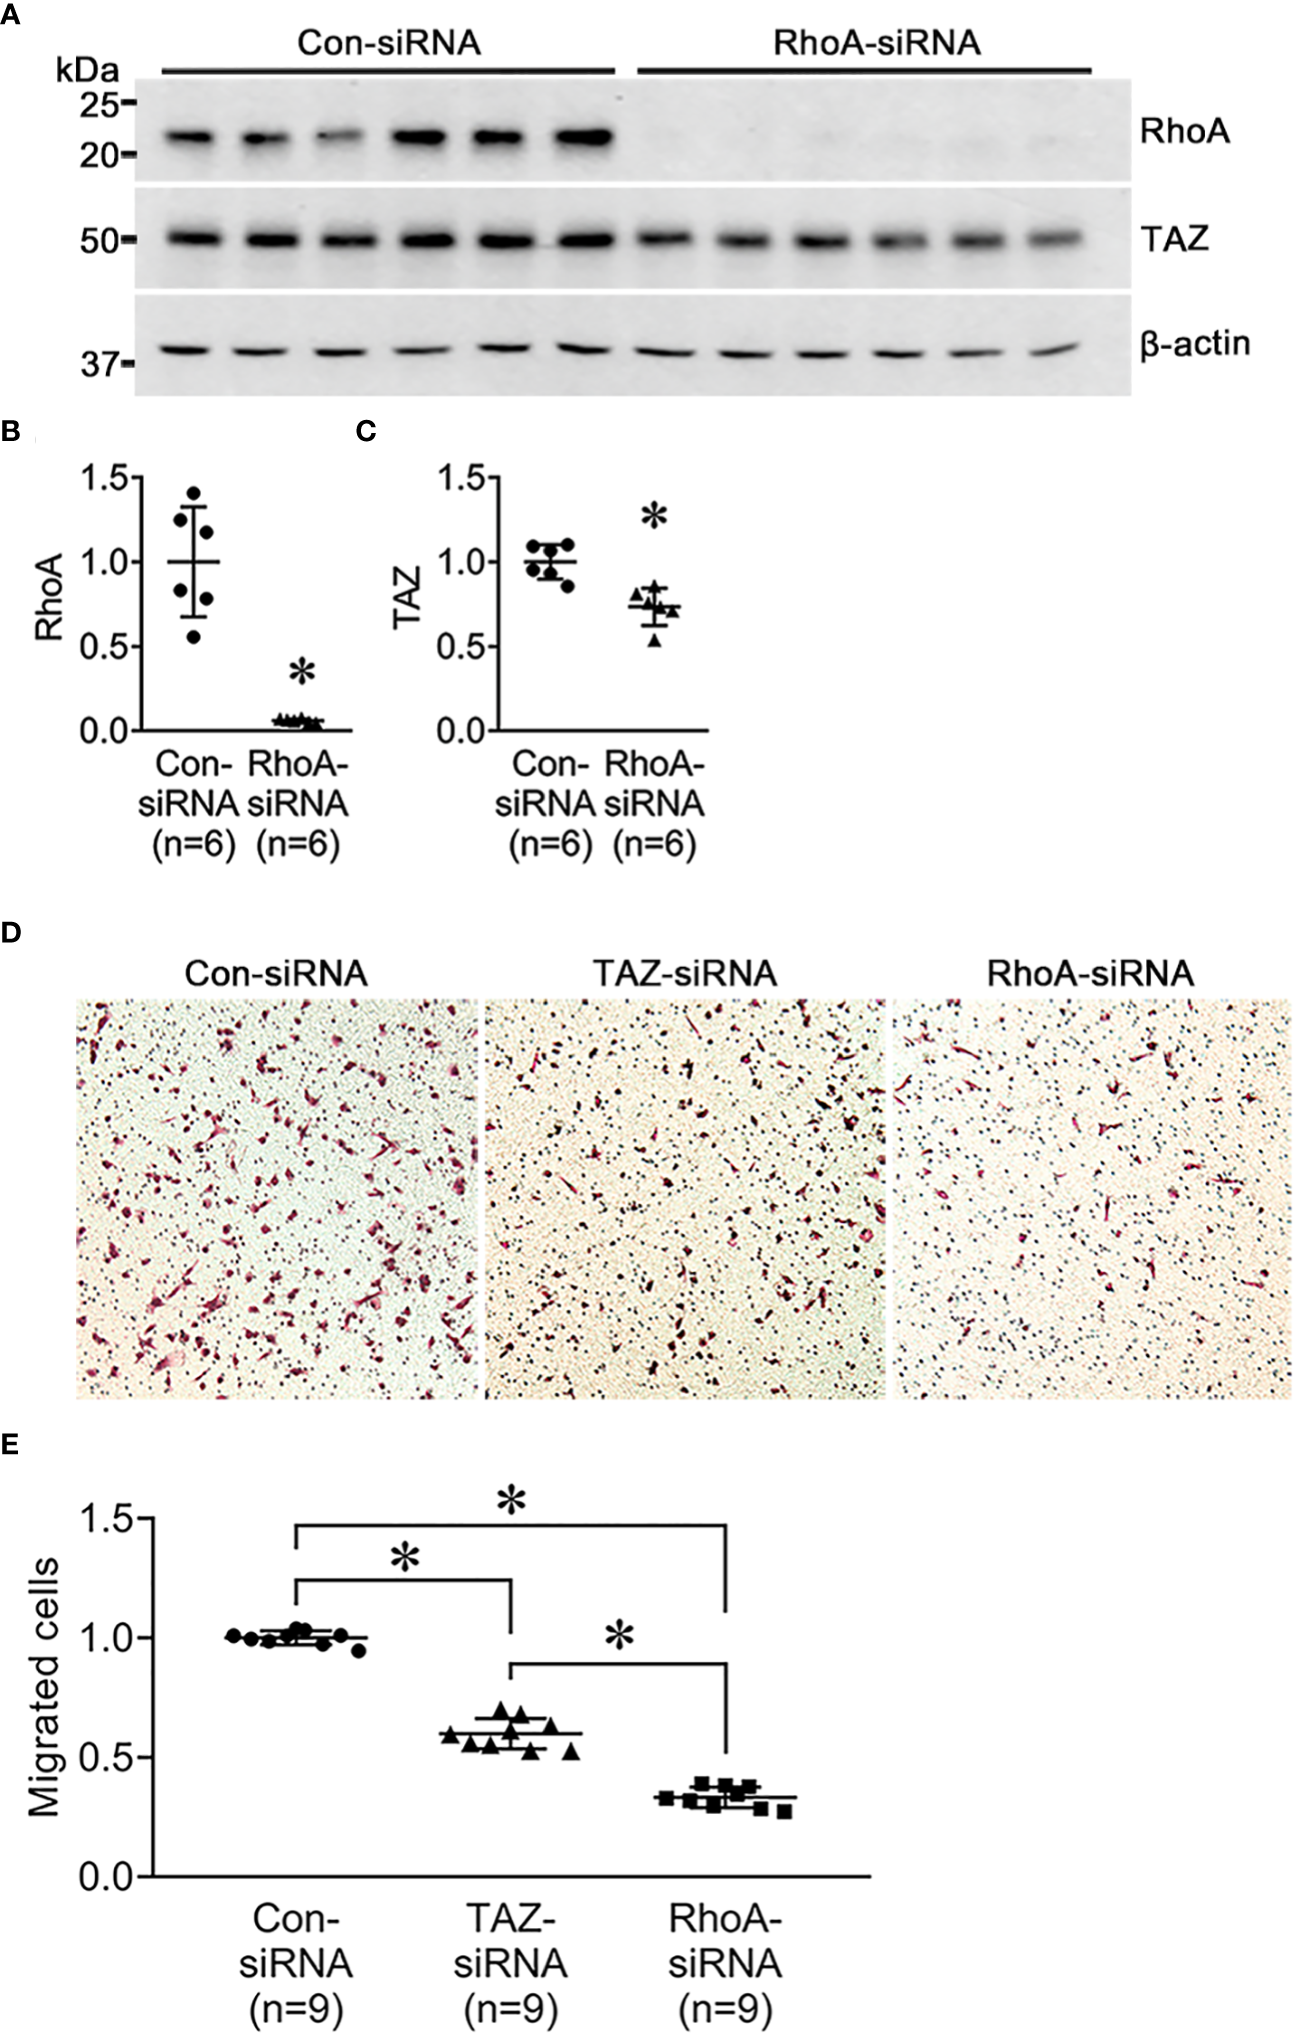
Semiquantitative immunoblotting of RhoA-siRNA-treated MDA-MB-231 cells and cell migration assay in MDA-MB-231 cells treated with control-siRNA, TAZ-siRNA, or RhoA-siRNA, respectively. (A–D) Changes in protein abundance of RhoA and TAZ in MDA-MB-231 cell treated with control-siRNA or RhoA-siRNA for 24 hours. *P < 0.05, when compared with control-siRNA. The immunoblots were reacted with antibodies against RhoA (~22kDa), TAZ (~49 kDa), and β-actin (~42 kDa). n indicates the number of cell preparation in each group. (D, E) Transwell cell migration assay of MDA-MB-231 cells treated with control-siRNA, TAZ-siRNA, or RhoA-siRNA treatment. The numbers of migrated cells were counted in the randomly selected fields (x100) per well. n indicates the number of randomly selected fields in each group. *P < 0.05.
Rho/ROCK pathway-dependent downstream protein levels in breast cancer cells with siRNA-mediated TAZ knockdown
LIM kinase (LIMK), activated by the small GTPase Rho and its downstream protein kinase ROCK, phosphorylates cofilin, an actin-depolymerizing factor, to regulate actin cytoskeletal reorganization. (35). An immunoprecipitation assay yielded no evidence of direct binding of TAZ and RhoA (Figures 7B–D). TAZ-specific siRNA treatment significantly decreased the protein abundance of TAZ (not detectable, Figures 7A, E), RhoA (51 ± 7% of control-siRNA, P < 0.05, Figurse 7A, F), LIMK1 (44 ± 4% of control-siRNA, P < 0.05, Figures 7A, G), phosphorylated LIMK1 at threonine 508/LIMK2 at threonine 505 (p-LIMK1/2, 52 ± 9% of control-siRNA, P < 0.05, Figures 7A, I) and phosphorylated cofilin at serine 3 (40 ± 7% of control-siRNA, P < 0.05, Figures 7A, K). In contrast, LIMK2 protein abundance was increased (124 ± 10% of control-siRNA, P < 0.05, Figures 7A, H), and cofilin and MLC2 were unchanged (Figures 7A, J, M). Next, we studied whether TAZ knockdown affects the expression and phosphorylation of myosin light chain kinase (MLCK), which phosphorylates myosin light chain (MLC) and plays a role in stress fiber assembly and focal adhesion formation. siRNA-mediated TAZ knockdown was associated with significantly decreased protein abundance of MLCK (71 ± 8% of control-siRNA, P < 0.05, Figures 7A, L) and phosphorylated MLC2 at serine 19 (39 ± 6% of control-siRNA, P < 0.05, Figures 7A, N).
Figure 7
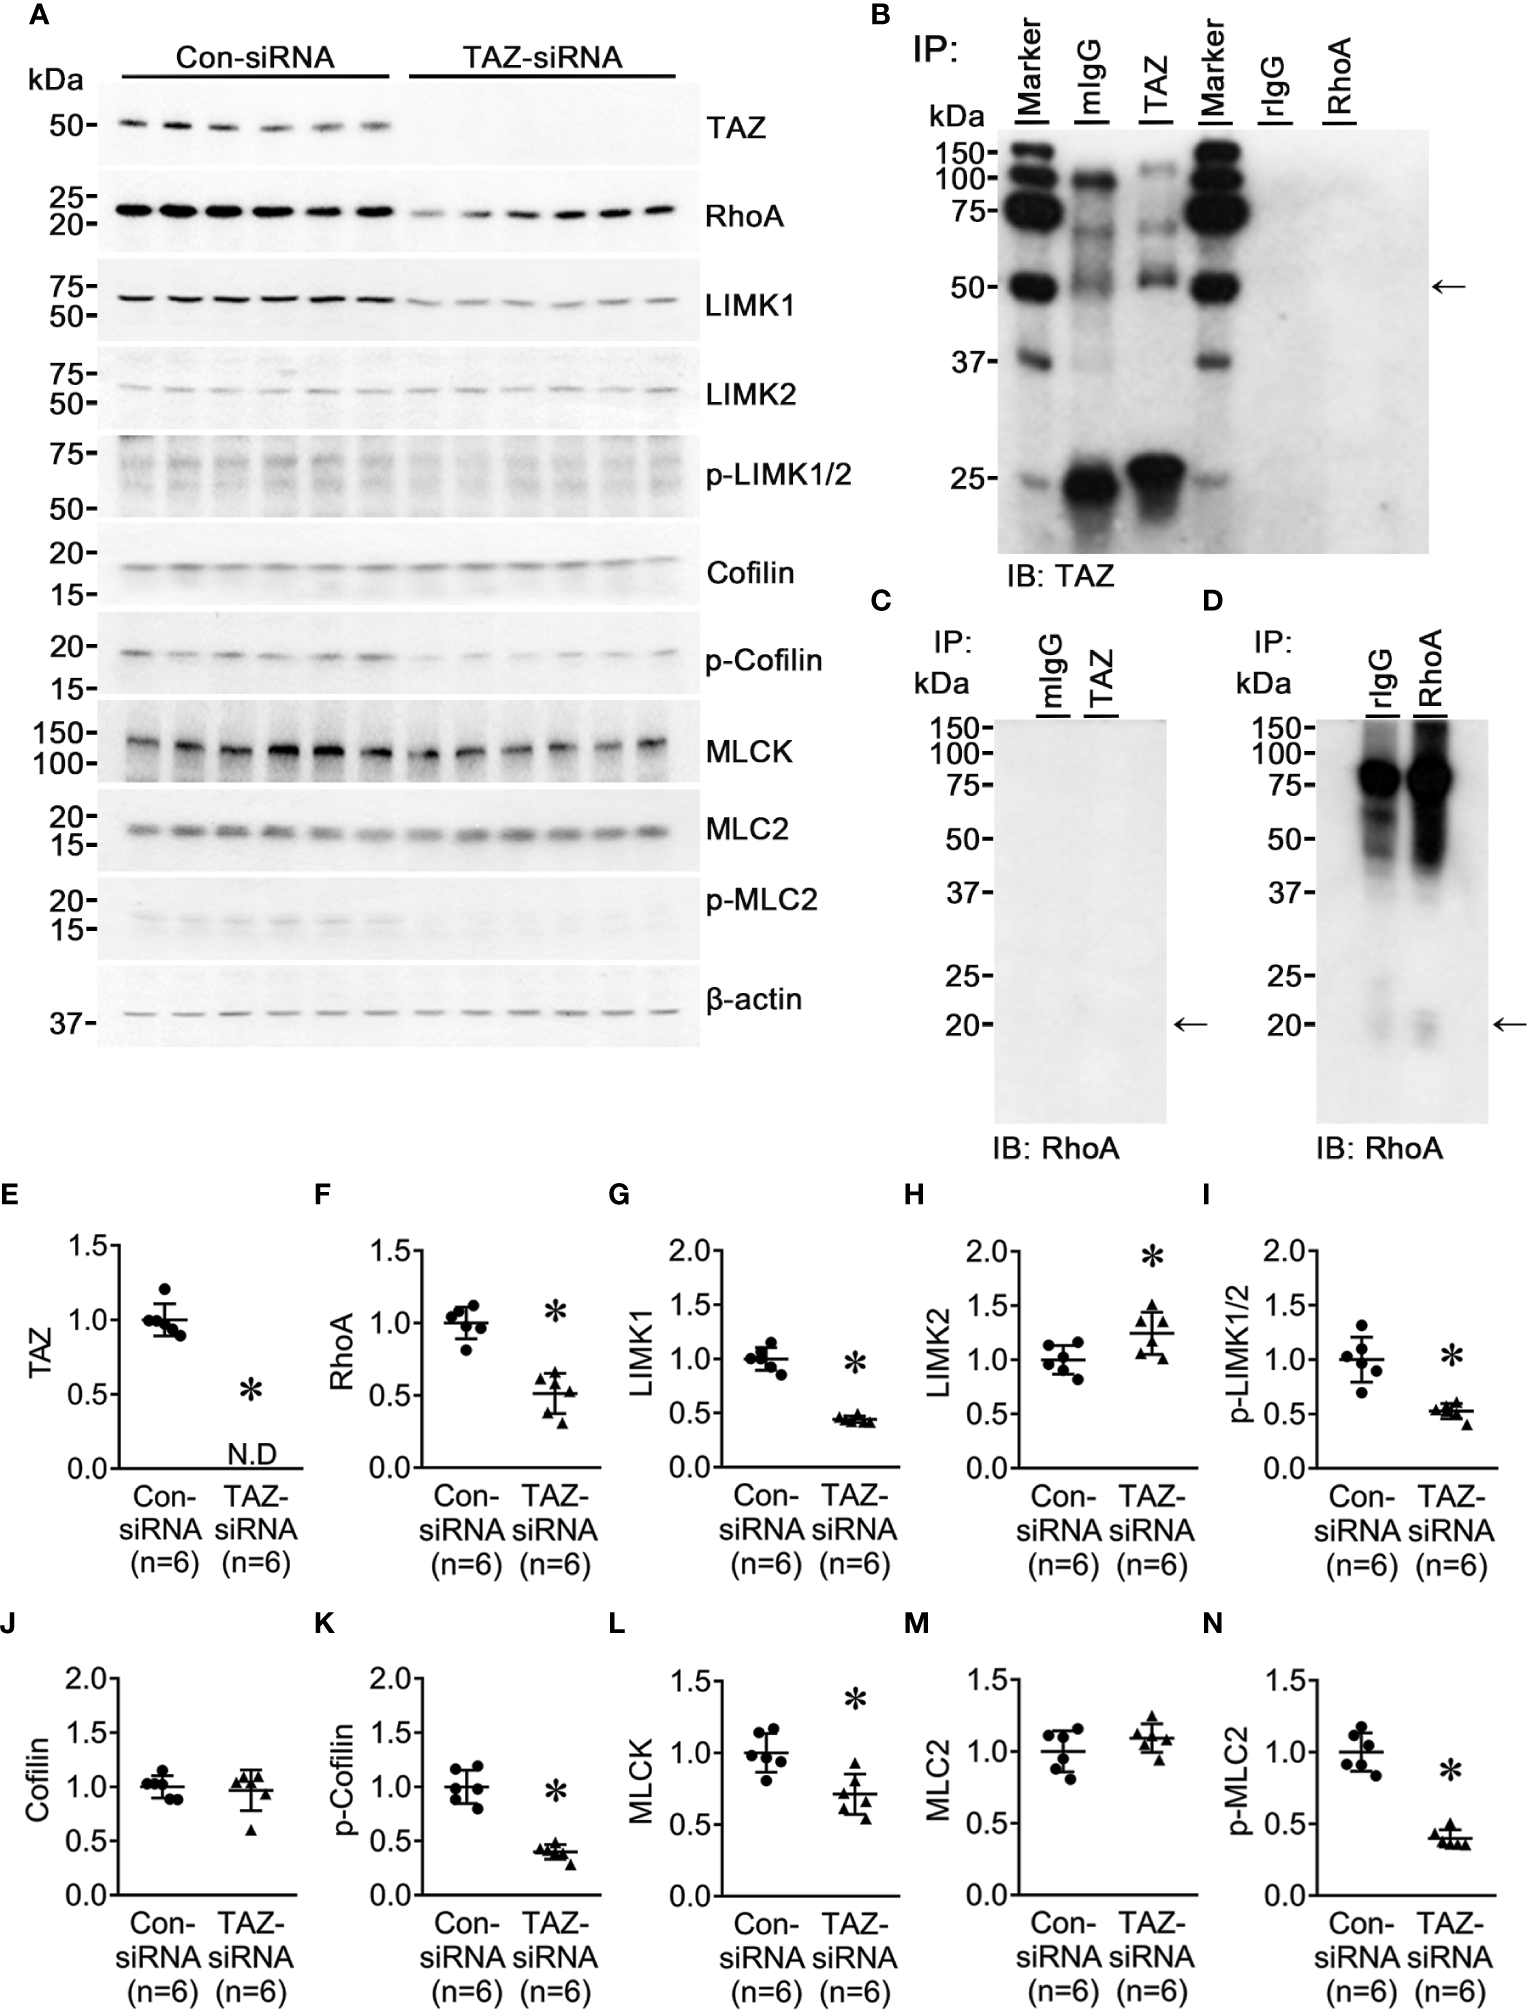
Semiquantitative immunoblotting for Rho/ROCK/LIMK and Rho/MLCK/MLC2 pathway. Changes in Rho/ROCK pathway dependent downstream protein abundance in breast cancer cells treated with control-siRNA or TAZ-siRNA. (A, E–N) Semiquantitative immunoblotting of TAZ, RhoA, LIMK1, LIMK2, p-LIMK, cofilin, p-cofilin, MLCK, MLC2, p-MLC2 and β-actin in MDA-MB-231 cells treated with control-siRNA or TAZ-siRNA. The immunoblots were reacted with antibodies against TAZ (~49 kDa), RhoA (~22 kDa), LIMK1 (~70 kDa), LIMK2 (~70 kDa), p-LIMK (~72 kDa), cofilin (~19 kDa), p-cofilin (~19 kDa), MLCK (~140 kDa), MLC2 (~18 kDa), p-MLC2 (~18 kDa), and β-actin (~42 kDa). (B–D) Co-immunoprecipitation of TAZ and RhoA. (B) Immunoblotting of TAZ in pull-down samples with anti-TAZ antibody in MDA-MB-231 cells. (C, D) Immunoblotting of RhoA in pull-down samples with anti-RhoA antibody in MDA-MB-231 cells. mIgG, pre-immune immunoglobulin G (IgG) of mouse; rIgG, pre-immune IgG of rabbit. *P < 0.05, when compared with control-siRNA. n indicates the number of cell preparation in each group.
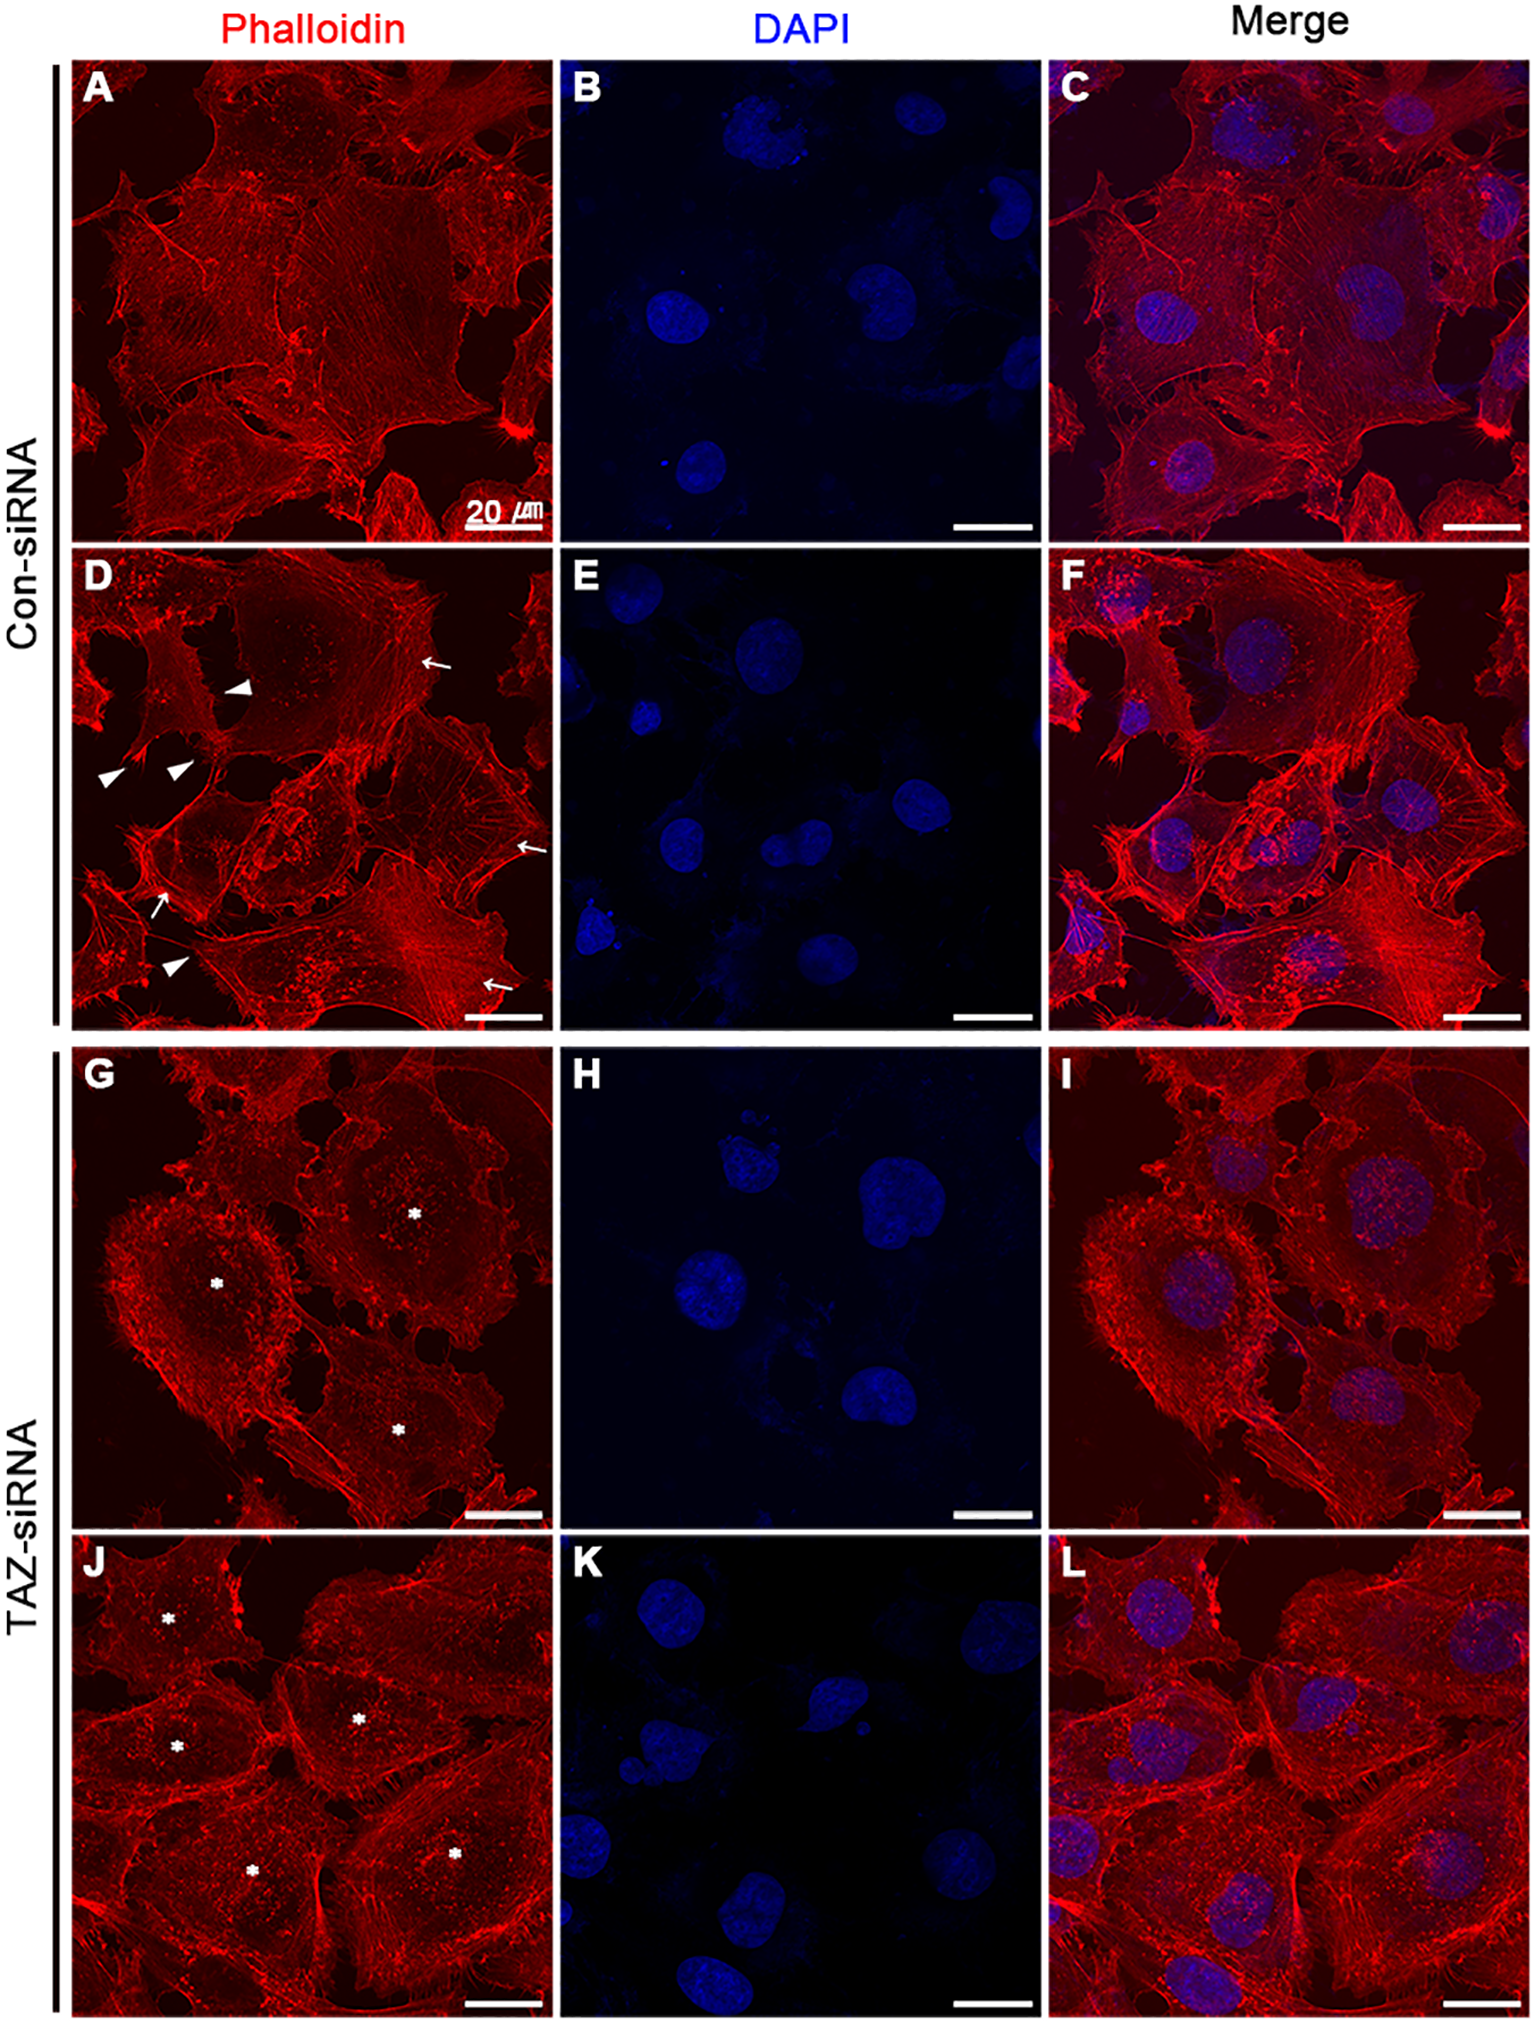
Altered stress fiber formation and expression of myosin light chain kinase in breast cancer cells with siRNA-mediated TAZ knockdown
We examined the changes in the stress fiber formation in MDA-MB-231 cells in response to TAZ knockdown. Stress fibers were stained using phalloidin, demonstrated in red (Figures 8, 9), and vinculin was immunolabeled in green as a marker of focal adhesion (arrows in Figures 8C, D). In control-siRNA-treated MDA-MB-231 cells, stress fibers were observed to be widely distributed intracellularly in both the central and peripheral regions of the cells (Figures 8A, E, 9A, C, D, F), and immunolabeling of vinculin was observed at the ends of the stress fibers (arrows in Figure 8C). Moreover, stress fibers were more abundantly expressed on the rear side of the cells (arrows in Figure 9D), and lamellipodia were predominantly detected on the front side (arrowheads in Figure 9D). On the contrary, TAZ-siRNA-treated MDA-MB-231 cells exhibited a decrease in the labeling of stress fibers, observed mainly in the central regions of the cells (asterisks in Figures 8B, 9H, K) and the immunolabeling of vinculin (focal adhesion) was mainly observed at the periphery of the cells (arrows in Figure 8D). Furthermore, the disassembly of stress fibers was observed in MDA-MB-231 cells treated with TAZ-siRNA (Figures 8B, F, 9G, I, J, L). We quantified the intensity of phalloidin (stress fiber) staining using ImageJ. The five regions of interest per cell were randomly selected and measured. Fluorescence intensity was measured in 10 cells per group, and a significant decrease in the phalloidin intensity was demonstrated in TAZ-siRNA treated MDA-MB-231 cells (68 ± 10% of control-siRNA, P < 0.05, Figure 8G).
Figure 8
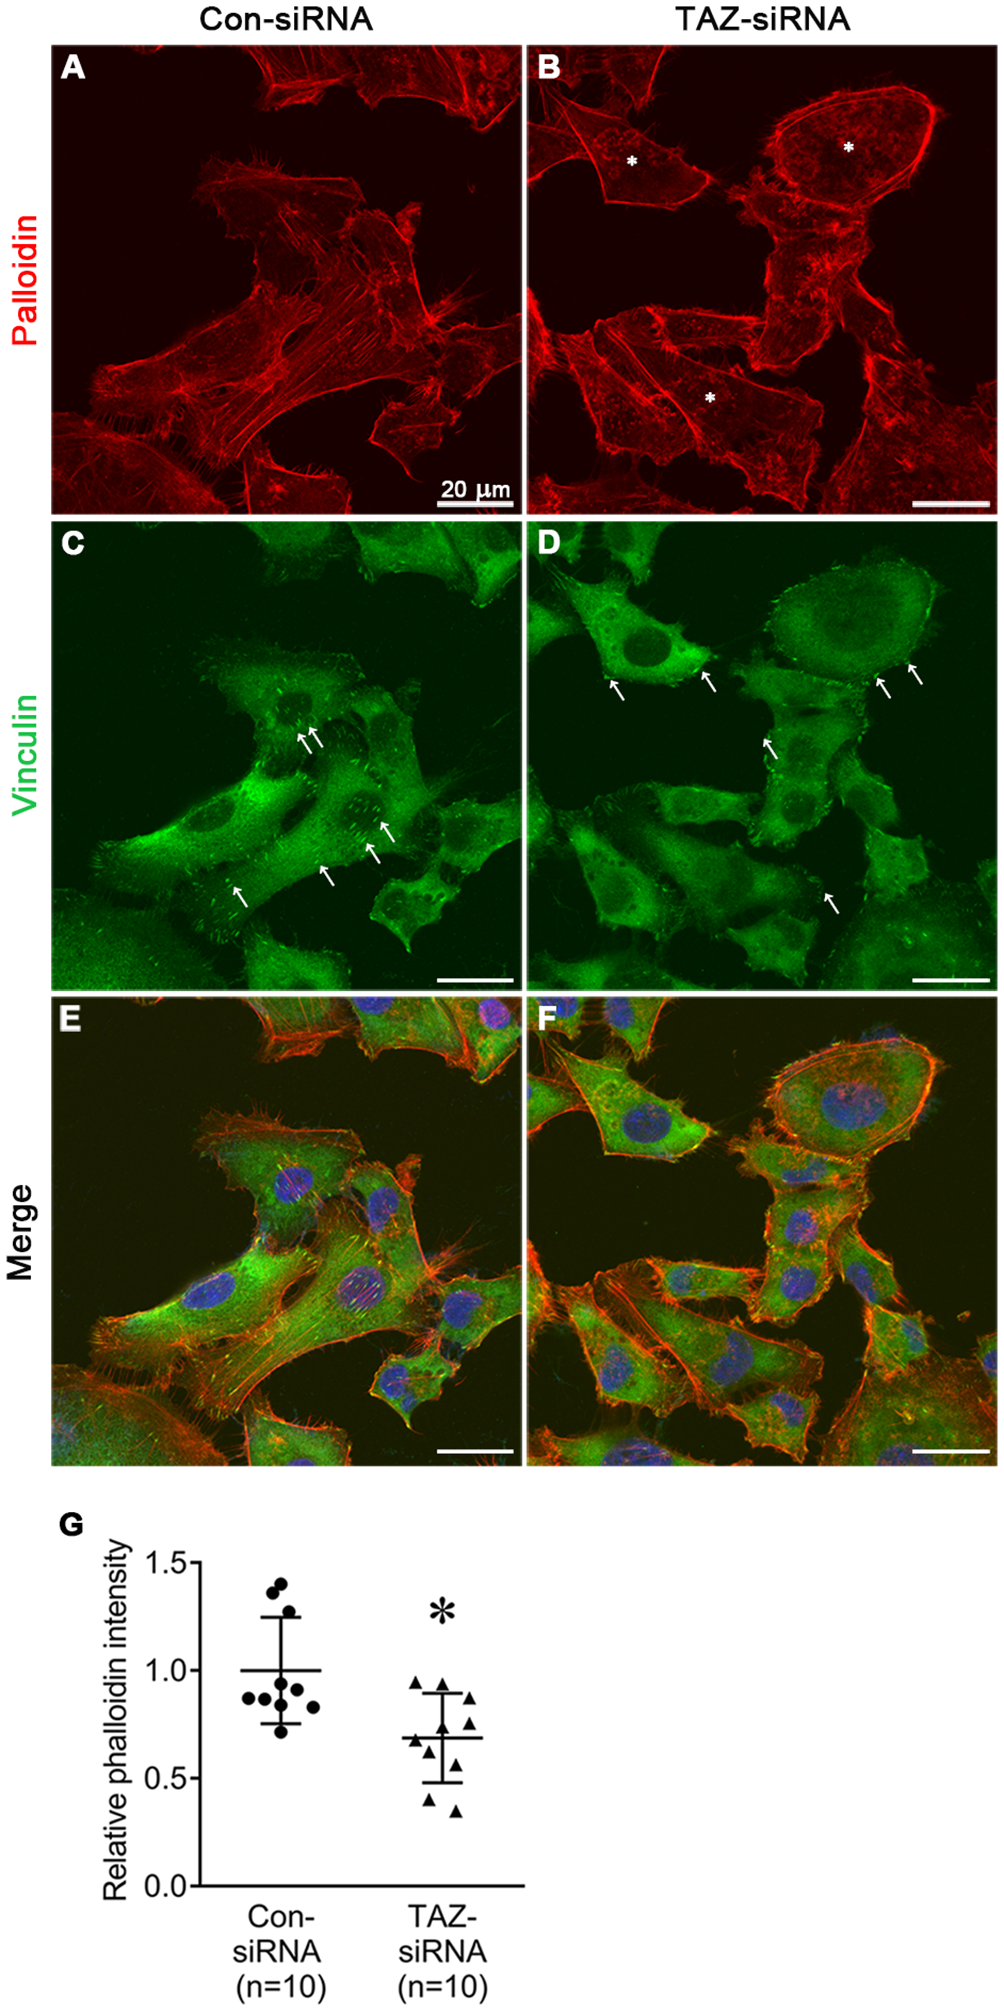
Fluorescence microscopic examination of stress fibers and immunolabeling of vinculin in MDA-MB-231 cells treated with control-siRNA (A, C, E) or TAZ-siRNA (B, D, F). Nuclei were labeled with 4’,6-Diamidino-2-Phenylindole (DAPI). Scale bars, 20 μm. (G) The quantification of phalloidin intensity. Relative phalloidin intensity was measured by averaging the fluorescence intensity of 5 randomly selected regions of interest in MDA-MB-231 cells. n indicates the number of cells in each group. *P < 0.05.
Figure 9
Fluorescence microscopic examination of stress fibers and immunolabeling of vinculin in MDA-MB-231 cells treated with control-siRNA (A–F) or TAZ-siRNA (G–L). Nuclei were labeled with 4’,6-Diamidino-2-Phenylindole (DAPI). Scale bars, 20 μm.
Discussion
The characteristics of metastatic breast cancer cells are diverse, including EMT and increased AQP5 expression (14, 36–38). In particular, the metastatic breast cancer cells in human patients display an increased level of TAZ expression (39, 40). In the present study, we demonstrated that TAZ knockdown inhibited the migration of highly invasive triple-negative breast cancer cells (MDA-MB-231) by reducing the protein abundance of RhoA and Rho-dependent kinases, particularly LIMK1 and MLCK. The downregulation of RhoA and Rho-dependent kinases in response to TAZ knockdown is likely to play a role in the reduction of stress fibers in the central region of the cells, disassembly of stress fibers, and diffuse focal adhesions throughout the cell periphery, resulting in a decrease in cell migration. Although the findings were obtained purely from invasive triple-negative breast cancer cells, the results may suggest that TAZ could be investigated as a therapeutic target for the inhibition of the migration of breast cancer cells and metastasis.
Decreased cell migration in the invasive breast cancer cells (MCF-7 and MDA-MB-231 cells) in response to TAZ knockdown
We analyzed two different invasive breast cancer cell lines (MCF-7 and MDA-MB-231 cells) with distinct morphological characteristics. Even though there was less TAZ in MCD-7 cells than in MDA-MB-231 cells, siRNA effectively reduced TAZ levels in both cell lines. Moreover, TAZ knockdown decreased cell migration in both MCF-7 and MDA-MB-231 cells. However, we conducted subsequent experiments exclusively with MDA-MB-231 cells due to the limited cell proliferation and migration observed in MCF-7 cells. Furthermore, previous studies demonstrated an association between higher levels of the TAZ protein and aggressive and invasive metastatic breast cancer cells (39, 41).
TAZ knockdown did not induce EMT in MDA-MB-231 cells
Several previous studies have demonstrated that TAZ induces EMT in various types of cancer (42–44). We examined whether TAZ knockdown affects the changes in EMT makers in MDA-MB-231 cells. As shown in Figure 2, an increase in fibronectin abundance may indicate an increase in the mesenchymal characteristics of cancer cells. On the other hand, the changes in E-cadherin, occludin, N-cadherin, and vimentin did not exhibit the typical pattern of EMT progression.
Then, we examined the effects of TGF-β treatment on cell migration under TAZ knockdown. An experiment was conducted to determine whether inducing TAZ knockdown in MDA-MB-231 cells, which already exhibit mesenchymal characteristics, could inhibit the morphological changes and cell migration induced by TGF-β treatment. Interestingly, TGF-β treatment resulted in a more pronounced reduction in the protein abundance of TAZ in the MDA-MB-231 cells with siRNA-mediated TAZ knockdown. Moreover, TGF-β treatment increased fibronectin abundance and enhanced cell migration. Furthermore, the increased fibronectin abundance induced by either TAZ knockdown or TGF-β treatment (possibly the mesenchymal characteristics of cancer cells) did not contribute to breast cancer cell migration, as TAZ knockdown decreased cell migration, while TGF-β treatment had the opposite effect despite the presence of TAZ knockdown (Figure 3). Therefore, TAZ knockdown in MDA-MB-231 cells was incapable of acquiring epithelial cell characteristics. Moreover, it did not impede TGF-β-induced cell migration, suggesting that TAZ knockdown reduces breast cancer cell migration independently of EMT.
Decrease in RhoA, phosphorylated LIMK1, and phosphorylated cofilin in response to TAZ knockdown in MDA-MB-231 cells
The NGS analysis of control-siRNA-treated and TAZ-siRNA-treated MDA-MB-231 cells showed substantial changes in the expression levels of genes encoding small GTPases, Rho-GAPs, and Rho-GEFs, all of which are involved in the organization of the actin cytoskeleton. The small GTPases RhoA and RhoC exhibited the highest levels of expression within the Rho family, as demonstrated by NGS analysis. RhoA tended to decrease with TAZ knockdown, while RhoC showed no difference. Semiquantitative immunoblotting in Figure 4 revealed a significant decrease in RhoA protein levels in TAZ-siRNA-treated MDA-MB-231 cells. We tested other small GTPases (Cdc42 and Rac1), but there were no differences in mRNA or protein levels. Rho-dependent kinase (ROCK) is a downstream effector of RhoA and RhoC, which regulates actomyosin assembly, actomyosin contractility, and reorganization of the actin cytoskeleton by regulating the phosphorylation of downstream kinases or phosphatases (45). The binding of active RhoA to ROCK initiates a phosphorylation cascade that controls the dynamics of cytoskeletal actin (46, 47). ROCK mRNA and protein levels stayed the same in MDA-MB-231 cells treated with TAZ-siRNA. However, the lower expression of RhoA may have an effect on the kinases that follow in the RhoA-dependent pathway. In particular, LIM kinase (LIMK), activated by the small GTPase Rho and its downstream protein kinase ROCK, phosphorylates cofilin, an actin-depolymerizing factor, to regulate actin cytoskeletal reorganization. (35). Notably, we demonstrated that RhoA and LIMK1 were significantly decreased by TAZ knockdown in MDA-MB-231 cells. As shown in Figure 7, the TAZ knockdown resulted in a significant decrease in the abundance of phosphorylated LIMK (LIMK1 at threonine 508 and LIMK-2 at threonine 505) at ~72 kDa, which represents an activated form of LIMK. Furthermore, in MDA-MB-231 cells treated with TAZ-siRNA, phosphorylated cofilin at serine 3 was significantly reduced, thereby enhancing cofilin-induced actin depolymerization (48). The findings indicate that TAZ knockdown reduces RhoA protein expression, which subsequently causes the downregulation of the RhoA/ROCK/LIMK1/cofilin pathway, resulting in a change in actin dynamics. In accordance with this observation, the migration of MDA-MB-231 cells was found to be diminished upon RhoA knockdown. On the other hand, the results of the immunoprecipitation assay did not provide any evidence of direct binding between TAZ and RhoA. Therefore, it is necessary for future research to investigate the underlying mechanisms by which TAZ controls the expression of RhoA and downstream kinases.
We also examined the changes in actin dynamics by phalloidin staining and immunofluorescence labeling. We observed the changes in the expression of vinculin, a highly expressed anchor protein involved in focal adhesion that interacts with F-actin and the membrane. Vinculin (Figure 8) was mainly observed at the end of stress fibers distributed in both the periphery and central region of the control-siRNA-treated MDA-MB-231 cells. On the other hand, in response to TAZ knockdown, the cells showed exclusive vinculin localization at the periphery, with no apparent stress fiber staining in the central region. These findings are consistent with actin depolymerization that occurred due to decreased phosphorylation of cofilin.
Decreased MLCK and phosphorylated MLC in response to TAZ knockdown in MDA-MB-231 cells
Rho-kinase and MLCK are known to regulate the organization and contraction of the stress fibers in the central region of the cells and the organization of focal adhesion (49–51). siRNA-mediated TAZ knockdown in MDA-MB-231 cells banished the stress fibers and focal adhesion in the central region of the cells. We looked at the Rho/ROCK/MLCK pathway, which controls the formation and contractility of central stress fibers, to see if TAZ knockdown changed the phosphorylation of MLCK and MLC. Consistently, in TAZ-siRNA-treated MDA-MB-231 cells, the protein abundance of MLCK and phosphorylated MLC2 at serine 19 was significantly decreased, but the total abundance of MLC2 was unchanged.
In summary, the findings observed in response to TAZ knockdown demonstrated that a decrease in LIMK1 and phosphorylated cofilin caused actin depolymerization, while a reduction in MLCK and phosphorylated MLC2 led to the disassembly of stress fibers and focal adhesions, ultimately resulting in a decrease in breast cancer cell migration.
Statements
Data availability statement
The dataset presented in the study can be found in online repositories (NCBI's Gene Expression Omnibus) and are accessible through GEO Series accession number GSE264547 (https://www.ncbi.nlm.nih.gov/geo/query/acc.cgi?acc=GSE264547).
Ethics statement
Ethical approval was not required for the studies on humans in accordance with the local legislation and institutional requirements because only commercially available established cell lines were used.
Author contributions
HC: Writing – review & editing, Writing – original draft, Visualization, Validation, Methodology, Investigation, Formal analysis, Data curation, Conceptualization. HJ: Writing – review & editing, Writing – original draft, Visualization, Validation, Methodology, Investigation, Formal analysis, Data curation, Conceptualization. MK: Writing – review & editing, Writing – original draft, Visualization, Validation, Methodology, Investigation, Formal analysis, Conceptualization. TK: Writing – review & editing, Writing – original draft, Visualization, Validation, Supervision, Software, Resources, Project administration, Methodology, Investigation, Funding acquisition, Formal analysis, Data curation, Conceptualization.
Funding
The author(s) declare financial support was received for the research, authorship, and/or publication of this article. This work was supported by grants from the National Research Foundation of Korea (NRF) grant funded by the Korea Government (MIST) (2021R1A5A2021614; 2023R1A2C2005570).
Conflict of interest
The authors declare that the research was conducted in the absence of any commercial or financial relationships that could be construed as a potential conflict of interest.
Publisher’s note
All claims expressed in this article are solely those of the authors and do not necessarily represent those of their affiliated organizations, or those of the publisher, the editors and the reviewers. Any product that may be evaluated in this article, or claim that may be made by its manufacturer, is not guaranteed or endorsed by the publisher.
Supplementary material
The Supplementary Material for this article can be found online at: https://www.frontiersin.org/articles/10.3389/fonc.2024.1376831/full#supplementary-material
References
1
Siegel RL Miller KD Wagle NS Jemal A . Cancer statistic. CA Cancer J Clin. (2023) 73:17–48. doi: 10.3322/caac.21763
2
O’shaughnessy J . Extending survival with chemotherapy in metastatic breast cancer. Oncologist. (2005) 10 Suppl 3:20–9. doi: 10.1634/theoncologist.10-90003-20
3
Lee YT . Breast carcinoma: pattern of metastasis at autopsy. J Surg Oncol. (1983) 23:175–80. doi: 10.1002/jso.2930230311
4
Weigelt B Peterse JL Van ‘T Veer LJ . Breast cancer metastasis: markers and models. Nat Rev Cancer. (2005) 5:591–602. doi: 10.1038/nrc1670
5
Randolph GJ Angeli V Swartz MA . Dendritic-cell trafficking to lymph nodes through lymphatic vessels. Nat Rev Immunol. (2005) 5:617–28. doi: 10.1038/nri1670
6
Nguyen DX Bos PD Massague J . Metastasis: from dissemination to organ-specific colonization. Nat Rev Cancer. (2009) 9:274–84. doi: 10.1038/nrc2622
7
Chaffer CL Weinberg RA . A perspective on cancer cell metastasis. Science. (2011) 331:1559–64. doi: 10.1126/science.1203543
8
Pantel K Speicher MR . The biology of circulating tumor cells. Oncogene. (2016) 35:1216–24. doi: 10.1038/onc.2015.192
9
Mohme M Riethdorf S Pantel K . Circulating and disseminated tumour cells - mechanisms of immune surveillance and escape. Nat Rev Clin Oncol. (2017) 14:155–67. doi: 10.1038/nrclinonc.2016.144
10
Condeelis J Singer RH Segall JE . The great escape: when cancer cells hijack the genes for chemotaxis and motility. Annu Rev Cell Dev Biol. (2005) 21:695–718. doi: 10.1146/annurev.cellbio.21.122303.120306
11
Sahai E . Mechanisms of cancer cell invasion. Curr Opin Genet Dev. (2005) 15:87–96. doi: 10.1016/j.gde.2004.12.002
12
Yamaguchi H Wyckoff J Condeelis J . Cell migration in tumors. Curr Opin Cell Biol. (2005) 17:559–64. doi: 10.1016/j.ceb.2005.08.002
13
Yamaguchi H Condeelis J . Regulation of the actin cytoskeleton in cancer cell migration and invasion. Biochim Biophys Acta. (2007) 1773:642–52. doi: 10.1016/j.bbamcr.2006.07.001
14
Jensen HH Login FH Park JY Kwon TH Nejsum LN . Immunohistochemical evalulation of activated ras and rac1 as potential downstream effectors of aquaporin-5 in breast cancer in vivo. Biochem Biophys Res Commun. (2017) 493:1210–6. doi: 10.1016/j.bbrc.2017.09.125
15
Login FH Jensen HH Pedersen GA Koffman JS Kwon TH Parsons M et al . Aquaporins differentially regulate cell-cell adhesion in mdck cells. FASEB J. (2019) 33:6980–94. doi: 10.1096/fj.201802068RR
16
Park EJ Jung HJ Choi HJ Jang HJ Park HJ Nejsum LN et al . Exosomes co-expressing aqp5-targeting mirnas and il-4 receptor-binding peptide inhibit the migration of human breast cancer cells. FASEB J. (2020) 34:3379–98. doi: 10.1096/fj.201902434R
17
Lou Y Preobrazhenska O Auf Dem Keller U Sutcliffe M Barclay L Mcdonald PC et al . Epithelial-mesenchymal transition (Emt) is not sufficient for spontaneous murine breast cancer metastasis. Dev Dyn. (2008) 237:2755–68. doi: 10.1002/dvdy.21658
18
Thiery JP Acloque H Huang RY Nieto MA . Epithelial-mesenchymal transitions in development and disease. Cell. (2009) 139:871–90. doi: 10.1016/j.cell.2009.11.007
19
Zhou BP Deng J Xia W Xu J Li YM Gunduz M et al . Dual regulation of snail by gsk-3beta-mediated phosphorylation in control of epithelial-mesenchymal transition. Nat Cell Biol. (2004) 6:931–40. doi: 10.1038/ncb1173
20
Imani S Hosseinifard H Cheng J Wei C Fu J . Prognostic value of emt-inducing transcription factors (Emt-tfs) in metastatic breast cancer: A systematic review and meta-analysis. Sci Rep. (2016) 6:28587. doi: 10.1038/srep28587
21
Erdogan B Ao M White LM Means AL Brewer BM Yang L et al . Cancer-associated fibroblasts promote directional cancer cell migration by aligning fibronectin. J Cell Biol. (2017) 216:3799–816. doi: 10.1083/jcb.201704053
22
Yu FX Guan KL . The hippo pathway: regulators and regulations. Genes Dev. (2013) 27:355–71. doi: 10.1101/gad.210773.112
23
Mo JS Park HW Guan KL . The hippo signaling pathway in stem cell biology and cancer. EMBO Rep. (2014) 15:642–56. doi: 10.15252/embr.201438638
24
Harvey KF Zhang X Thomas DM . The hippo pathway and human cancer. Nat Rev Cancer. (2013) 13:246–57. doi: 10.1038/nrc3458
25
Bos PD Zhang XH Nadal C Shu W Gomis RR Nguyen DX et al . Genes that mediate breast cancer metastasis to the brain. Nature. (2009) 459:1005–9. doi: 10.1038/nature08021
26
Wei C Wang Y Li X . The role of hippo signal pathway in breast cancer metastasis. Onco Targets Ther. (2018) 11:2185–93. doi: 10.2147/OTT
27
Calses PC Crawford JJ Lill JR Dey A . Hippo pathway in cancer: aberrant regulation and therapeutic opportunities. Trends Cancer. (2019) 5:297–307. doi: 10.1016/j.trecan.2019.04.001
28
Bartucci M Dattilo R Moriconi C Pagliuca A Mottolese M Federici G et al . Taz is required for metastatic activity and chemoresistance of breast cancer stem cells. Oncogene. (2015) 34:681–90. doi: 10.1038/onc.2014.5
29
Li HL Li QY Jin MJ Lu CF Mu ZY Xu WY et al . A review: hippo signaling pathway promotes tumor invasion and metastasis by regulating target gene expression. J Cancer Res Clin Oncol. (2021) 147:1569–85. doi: 10.1007/s00432-021-03604-8
30
Jang HJ Park HJ Choi HS Jung HJ Kwon TH . Genome-engineered mpkccdc14 cells as A new resource for studying aqp2. Int J Mol Sci. (2023) 24:1684. doi: 10.3390/ijms24021684
31
Choi HJ Jang HJ Park E Tingskov SJ Norregaard R Jung HJ et al . Sorting nexin 27 regulates the lysosomal degradation of aquaporin-2 protein in the kidney collecting duct. Cells. (2020) 9:1208. doi: 10.3390/cells9051208
32
Belinky F Nativ N Stelzer G Zimmerman S Iny Stein T Safran M et al . Pathcards: multi-source consolidation of human biological pathways. Database (Oxford). (2015) 2015. doi: 10.1093/database/bav006
33
Ridley AJ Hall A . The small gtp-binding protein rho regulates the assembly of focal adhesions and actin stress fibers in response to growth factors. Cell. (1992) 70:389–99. doi: 10.1016/0092-8674(92)90163-7
34
Sander EE Ten Klooster JP Van Delft S van der Kammen RA Collard JG . Rac downregulates rho activity: reciprocal balance between both gtpases determines cellular morphology and migratory behavior. J Cell Biol. (1999) 147:1009–22. doi: 10.1083/jcb.147.5.1009
35
Ohashi K Nagata K Maekawa M Ishizaki T Narumiya S Mizuno K . Rho-associated kinase rock activates lim-kinase 1 by phosphorylation at threonine 508 within the activation loop. J Biol Chem. (2000) 275:3577–82. doi: 10.1074/jbc.275.5.3577
36
Jung HJ Park JY Jeon HS Kwon TH . Aquaporin-5: A marker protein for proliferation and migration of human breast cancer cells. PloS One. (2011) 6:E28492. doi: 10.1371/journal.pone.0028492
37
Jensen HH Login FH Koffman JS Kwon TH Nejsum LN . The role of aquaporin-5 in cancer cell migration: A potential active participant. Int J Biochem Cell Biol. (2016) 79:271–6. doi: 10.1016/j.biocel.2016.09.005
38
Jung HJ Jang HJ Kwon TH . Aquaporins implicated in the cell proliferation and the signaling pathways of cell stemness. Biochimie. (2021) 188:52–60. doi: 10.1016/j.biochi.2021.04.006
39
Chan SW Lim CJ Guo K Ng CP Lee I Hunziker W et al . A role for taz in migration, invasion, and tumorigenesis of breast cancer cells. Cancer Res. (2008) 68:2592–8. doi: 10.1158/0008-5472.CAN-07-2696
40
Oku Y Nishiya N Shito T Yamamoto R Yamamoto Y Oyama C et al . Small molecules inhibiting the nuclear localization of yap/taz for chemotherapeutics and chemosensitizers against breast cancers. FEBS Open Bio. (2015) 5:542–9. doi: 10.1016/j.fob.2015.06.007
41
Diaz-Martin J Lopez-Garcia MA Romero-Perez L Atienza-Amores MR Pecero ML Castilla MA et al . Nuclear taz expression associates with the triple-negative phenotype in breast cancer. Endocr Relat Cancer. (2015) 22:443–54. doi: 10.1530/ERC-14-0456
42
Zhang H Liu CY Zha ZY Zhao B Yao J Zhao S et al . Tead transcription factors mediate the function of taz in cell growth and epithelial-mesenchymal transition. J Biol Chem. (2009) 284:13355–62. doi: 10.1074/jbc.M900843200
43
Xie D Cui J Xia T Jia Z Wang L Wei W et al . Hippo transducer taz promotes epithelial mesenchymal transition and supports pancreatic cancer progression. Oncotarget. (2015) 6:35949. doi: 10.18632/oncotarget.v6i34
44
Chen G Xie J Huang P Yang Z . Overexpression of taz promotes cell proliferation, migration and epithelial-mesenchymal transition in ovarian cancer. Oncol Lett. (2016) 12:1821–5. doi: 10.3892/ol.2016.4829
45
Amano M Nakayama M Kaibuchi K . Rho-kinase/rock: A key regulator of the cytoskeleton and cell polarity. Cytoskeleton (Hoboken). (2010) 67:545–54. doi: 10.1002/cm.20472
46
Bhadriraju K Yang M Alom Ruiz S Pirone D Tan J Chen CS . Activation of rock by rhoa is regulated by cell adhesion, shape, and cytoskeletal tension. Exp Cell Res. (2007) 313:3616–23. doi: 10.1016/j.yexcr.2007.07.002
47
Hartmann S Ridley AJ Lutz S . The function of rho-associated kinases rock1 and rock2 in the pathogenesis of cardiovascular disease. Front Pharmacol. (2015) 6:276. doi: 10.3389/fphar.2015.00276
48
Bamburg JR Mcgough A Ono S . Putting A new twist on actin: adf/cofilins modulate actin dynamics. Trends Cell Biol. (1999) 9:364–70. doi: 10.1016/S0962-8924(99)01619-0
49
Katoh K Kano Y Amano M Kaibuchi K Fujiwara K . Stress fiber organization regulated by mlck and rho-kinase in cultured human fibroblasts. Am J Physiol Cell Physiol. (2001) 280:C1669–79. doi: 10.1152/ajpcell.2001.280.6.C1669
50
Katoh K Kano Y Ookawara S . Rho-kinase dependent organization of stress fibers and focal adhesions in cultured fibroblasts. Genes Cells. (2007) 12:623–38. doi: 10.1111/j.1365-2443.2007.01073.x
51
Katoh K Kano Y Noda Y . Rho-associated kinase-dependent contraction of stress fibres and the organization of focal adhesions. J R Soc Interface. (2011) 8:305–11. doi: 10.1098/rsif.2010.0419
Summary
Keywords
actin, breast cancer, cell migration, small GTPase, TAZ
Citation
Choi HS, Jang H-J, Kristensen MK and Kwon T-H (2024) TAZ is involved in breast cancer cell migration via regulating actin dynamics. Front. Oncol. 14:1376831. doi: 10.3389/fonc.2024.1376831
Received
26 January 2024
Accepted
11 April 2024
Published
07 May 2024
Volume
14 - 2024
Edited by
Ramiro Iglesias-Bartolome, National Cancer Institute (NIH), United States
Reviewed by
Tapasree Roy Sarkar, Texas A and M University, United States
Kuniaki Sato, University of California, San Diego, United States
Updates
Copyright
© 2024 Choi, Jang, Kristensen and Kwon.
This is an open-access article distributed under the terms of the Creative Commons Attribution License (CC BY). The use, distribution or reproduction in other forums is permitted, provided the original author(s) and the copyright owner(s) are credited and that the original publication in this journal is cited, in accordance with accepted academic practice. No use, distribution or reproduction is permitted which does not comply with these terms.
*Correspondence: Tae-Hwan Kwon, thkwon@knu.ac.kr
Disclaimer
All claims expressed in this article are solely those of the authors and do not necessarily represent those of their affiliated organizations, or those of the publisher, the editors and the reviewers. Any product that may be evaluated in this article or claim that may be made by its manufacturer is not guaranteed or endorsed by the publisher.