Abstract
Objectives:
The aim of this study was to systematically review the studies on radiomics models in distinguishing between lung adenocarcinoma (LUAD) and lung squamous cell carcinoma (LUSC) and evaluate the classification performance of radiomics models using images from various imaging techniques.
Materials and methods:
PubMed, Embase and Web of Science Core Collection were utilized to search for radiomics studies that differentiate between LUAD and LUSC. The assessment of the quality of studies included utilized the improved Quality Assessment of Diagnostic Accuracy Studies (QUADAS-2) and Radiomics Quality Score (RQS). Meta-analysis was conducted to assess the classification performance of radiomics models using various imaging techniques.
Results:
The qualitative analysis included 40 studies, while the quantitative synthesis included 21 studies. Median RQS for 40 studies was 12 (range -5~19). Sixteen studies were deemed to have a low risk of bias and low concerns regarding applicability. The radiomics model based on CT images had a pooled sensitivity of 0.78 (95%CI: 0.71~0.83), specificity of 0.85 (95%CI:0.73~0.92), and the area under summary receiver operating characteristic curve (SROC-AUC) of 0.86 (95%CI:0.82~0.89). As for PET images, the pooled sensitivity was 0.80 (95%CI: 0.61~0.91), specificity was 0.77 (95%CI: 0.60~0.88), and the SROC-AUC was 0.85 (95%CI: 0.82~0.88). PET/CT images had a pooled sensitivity of 0.87 (95%CI: 0.72~0.94), specificity of 0.88 (95%CI: 0.80~0.93), and an SROC-AUC of 0.93 (95%CI: 0.91~0.95). MRI images had a pooled sensitivity of 0.73 (95%CI: 0.61~0.82), specificity of 0.80 (95%CI: 0.65~0.90), and an SROC-AUC of 0.79 (95%CI: 0.75~0.82).
Conclusion:
Radiomics models demonstrate potential in distinguishing between LUAD and LUSC. Nevertheless, it is crucial to conduct a well-designed and powered prospective radiomics studies to establish their credibility in clinical application.
Systematic review registration:
https://www.crd.york.ac.uk/PROSPERO/display_record.php?RecordID=412851, identifier CRD42023412851.
Introduction
According to the GLOBOCAN estimates of cancer incidence and mortality, lung cancer is the second most common cancer and has the highest mortality rate among all types of cancer (1). Non-small cell lung cancer (NSCLC) is the predominant subtype, making up approximately 85% of all lung cancer cases (2). Approximately 80% of NSCLC are attributed to lung adenocarcinoma (LUAD) and lung squamous cell carcinoma (LUSC), which are the primary pathological subtypes (3). The variations in histological and biological features between LUAD and LUSC lead to notable distinctions in their treatment plan, prognosis, and rates of relapse (4–6). For example, targeted therapy is more beneficial for LUAD, while LUSC is more susceptible to chemotherapy (2). Precise identification of pathological types of NSCLC can help clinicians take appropriate treatment in time to improve clinical outcomes. The gold standards for classifying LUAD and LUSC are still pathological diagnosis made from biopsy or surgical resection lesions. However, this method is invasive, may be accompanied by potential complications, and is not appropriate to perform in any cases. Additionally, it may not always be feasible to ascertain the histological subtype of small biopsies or cytology specimens obtained during diagnostic procedures. There is an urgent need for a precise and non-intrusive categorization of NSCLC prior to treatment.
Computed tomography (CT) is often the first choice of modality for the diagnosis of lung cancer. The patients with possible lung cancer are then offered positron emission tomography/computed tomography (PEC/CT) for staging. Magnetic resonance imaging (MRI) has aroused interest in lung cancer diagnosis due to its ionizing radiation-free, superior soft-tissue contrast, and unique morpho-functional imaging capacities (7). Sometimes, the diagnosis of lung cancer involves a combination of CT, PET/CT, and MRI (8). However, it poses a significant difficulty for medical professionals to visually anticipate the histological classification of NSCLC solely based on images, regardless of the modality, let alone to predict eligibility for personalized treatments, e.g. targeted therapies, and individual outcome. Radiomics, also known as a virtual biopsy, utilizes an extensive range of imaging characteristics to measure phenotypical variances from medical images and reveal additional concealed information in contrast to regular features (9). The radiomics method has been used for differential diagnosis, prognosis prediction, and treatment outcome prediction (10–12). Radiomics features can also be correlated with genetic mutations or alterations to help personalize the management of diseases (13).
The aim of this study was to examine the studies utilizing radiomics to differentiate between LUAD and LUSC and evaluate the performance of radiomics models in classifying histologic subtypes using images from various imaging techniques.
Materials and methods
The study protocol was registered on the Prospective Register of Systematic Reviews with the registration number CRD42023412851. This systematic review and meta-analysis were conducted according to the PRISMA guidelines (14). The PRISMA checklist is shown in Supplementary Table S1.
Search strategy
PubMed, Embase and Web of Science Core Collection were queried to identify relevant studies published until July 17, 2023, utilizing terms such as radiomics, lung adenocarcinoma, lung squamous cell cancer with Boolean logic operation. The search details were listed in Supplementary Table S2. The reference lists of included studies and relevant reviews were manually examined to identify any potential studies that may have been overlooked. There was no language limit.
Study selection
We included studies that met the following criteria: (1) radiomics-based model for LUAD and LUSC classification; (2) radiomics features extracted from pre-treatment lung imaging irrespective of the modality of imaging; (3) patients were pathologically confirmed as LUAD or LUSC.
We excluded (1) articles that were not original full-text, such as reviews, letters, or commentaries, as well as conference abstract; (2) studies that did not provide information on LUAD and LUSC classification; (3) studies that used features other than radiomics to differentiate between LUAD and LUSC; (4) studies that used a sample that had already been used in another study; (5) studies that lacked sufficient information to assess their quality.
Two reviewers (LS, with 6 years of experience in chest image analysis, AND JZ, a broad-certified radiologist with 19 years of experience) individually examined tiles, abstracts, and assessed the full texts to determine eligibility. The disagreements were resolved by consensus.
Date extraction
Basic information of each study including the surname of the first author and the publication year were extracted. The study’s characteristics such as sample size and study design were provided. The index test information consisted of the imaging modality used, segmentation method, software used for segmentation and radiomics feature extraction, the number of radiomics features extracted, feature selection method, classification model, and any non-radiomics features included in the model. Furthermore, the outcomes encompassed true positive, false positive, false negative and true negative, along with any other statistical data that might be used for calculation. If multiple classification objectives were presented in a study, only the information differentiating LUAD from LUSC based on radiomics features was extracted. If a study where multiple radiomics models were mentioned, the model with the highest area under the curve (AUC) was selected.
Data extraction was implemented independently by two reviewers (LS, ZW with 4 years of experience in chest image analysis). The disagreements were resolved by discussion.
Quality assessment
The quality of the included studies was evaluated using the Improved Quality Assessment of Diagnostic Accuracy Studies (QUADAS-2) and Radiomics Quality Score (RQS). The purpose of QUADAS-2 is to evaluate the quality of primary diagnostic studies, which includes 4 key domains: patient selection, index test, reference standard, and flow and timing (15). The results of QUADAS-2 were recorded using Revman 5.4. The signaling questions of the 4 key domains were modified to tailor to our study (16). If all signaling questions of a domain were answered “yes”, the domain was considered at low risk of bias.
RQS, consisting of 16 items, was suggested as a means to enhance the radiomics workflow and has been extensively employed in evaluating the methodological quality of radiomics studies in systematic review (9). After evaluating the studies based on each item, a total score will be calculated for each study and displayed on a scale ranging from -8 to 36, which can be converted into a percentage. Scores below 0 will be considered as 0, while a score of 36 will be equivalent to 100%.
The quality of the included studies was evaluated by two separate reviewers (LS and JZ). Quality discrepancies were resolved through reassessment and discussion.
Statistical analysis
The agreement between two reviewers on each item of RQS and each signaling question of QUADAS-2 was by expressed by a modified Fleiss kappa statistic (17). The inter-rater agreement of total RQS was measured using the interclass correlation coefficient (ICC) (18). R (version 4.2.2) was utilized for the computation. A significance level of less than 0.05 was deemed statistically significant.
Studies were pooled to estimate sensitivity and specificity along with 95% confidence intervals (CIs) using random-effect model. To reflect the synthesized diagnostic accuracy, the summary receiver operating characteristic (SROC) curve was constructed and the AUC was calculated. The chi-squared test was utilized to analyze the statistical heterogeneity among studies and the results were presented as the I2 statistic. Significant heterogeneity was observed when P<0.1 and I2>50%. Subgroup analysis was performed to detect the cause of heterogeneity. To evaluate the model’s stability, sensitivity analysis was conducted by plotting measures of goodness-of-fit, bivariate normality, influence analysis and outlier detection. An investigation of publication bias was conducted using Deeks’ funnel plot, and a P-value was computed using Deeks’ asymmetry test. Two-tailed P<0.05 was considered statistically significant.
Results
Study selection
The initial search and duplicate removal yielded 1860 unique records. After reading titles and abstracts, 1743 were eliminated. The remaining 117 full-texts were screened for eligibility. The number of records and reasons for removing are listed in Figure 1. Finally, 40 records were included in this systematic review, out of which 21 contained enough data to generate the diagnostic confusion matrix and were subsequently included in the meta-analysis. Neither their reference lists nor relevant reviews provided additional eligible studies.
Figure 1

PRISMA flowchart of study selection.
Study characteristics
The characteristics of studies included in this review were listed in Table 1 (19–58). Studies were published between 2011 and 2023. All but one of the included studies enrolled patients retrospectively. The range of patients in the studies that were included varied from 30 to 1419. The imaging modalities used included CT, PET/CT, MRI and PET/MRI. Two studies (51, 58) constructed radiomics models based on images from two or more imaging modalities. Twenty-five studies segmented regions of interests manually, 4 automatically, and 11 semi-automatically. Most studies segmented the regions of tumors only, while two studies (35, 41) also segmented the peritumoral regions of interests. ITK-SNAP (8/40) was the most used segmentation software, next the LIFEx (3/40). Matlab (8/40) was used frequently to extract radiomics features, followed by pyradiomics (7/40). The extracted features included first-, second-, and higher-order features, along with shape features. Logistic regression (11/40) and SVM (10/40) were the most two commonly used classifiers. Sixteen studies included non-radiomics features in multivariable models such as gender, tumor location, and smoking status.
Table 1
| Study ID | Patients (LUAD) | Imaging modality | Study design | Segmentation method | Segmentation software | Radiomics feature extraction algorithm or software | No. radiomics features extracted | Radiomics features | Radiomics feature selection methods |
Classification model | Non-radiomics features in model |
|---|---|---|---|---|---|---|---|---|---|---|---|
| Basu 2011 (19) | 74 (38) | CT | R | A | Lung Tumor Analysis software suite |
Lung Tumor Analysis software suite |
317 | Texture, morphological, geometric, intensity | – | J48 | – |
| Wu 2016 (20) | 350 (214) | CT | R | M | – | Matlab | 440 | Intensity, shape, texture | Correlation analysis, univariate analysis, ReliefF | Naive Bayesian | – |
| Yu 2017 (21) | 434(324) | CT | R | A | Toboggan Based Growing Automatic Segmentation |
– | 52 | First-, second-, high-order | Iterative forward including and backward elimination | RUSBoost | – |
| Haga 2018 (22) | 40(21) | CT | R | S | Pinnacle3 v9.10 | Matlab | 476 | Shape, global, GLCM, GLRLM, GLSZM, NGTDM, wavelet filter | Random permutation test, interobserver variation analysis, correlation analysis | Naive Bayesian | – |
| Sandino 2018 (23) | 40(20) | CT | R | M | – | – | – | Texture | – | SVM | – |
| Tsubakimoto 2018 (24) | 43(25) | CT | P | S | Synapse Vincent | JMP Pro | – | Histogram | – | LR | SUVmax(RG) |
| Zhu 2018 (25) | 129(76) | CT | R | M | ITK-SNAP | Matlab | 485 | Intensity, shape and size, texture, and wavelet filter | LASSO | LASSO | – |
| Bashir 2019 (26) | 206(129) | CT | R | M | ITK-SNAP | Matlab | 756 | Geometric, first-, second-, higher-order, model-based, wavelet filter | Pairwise correlation | RF | Air bronchogram, ground-glass component, cavitation |
| Digumarthy 2019 (27) | 94(69) | CT | R | S | TexRAD | CTTA software | 11 | Pearson correlation analysis | LR | Smoking, longest diameter, longest perpendicular diameter | |
| E 2019 (28) | 181(88) | CT | R | S | – | Matlab | 1695 | Shape, size, boundary sharpness, texture | CCC, hierarchical clustering, mRMR, incremental forward search | SVM | – |
| Liu 2019 (29) | 87(47) | CT | R | M | Digital biopsy | MaZda | 261 | Histogram, GLCM, RLM, gradient, AR |
Fisher Score | SVM | Location |
| Yamada 2019 (30) | 170(82) | CT | R | M | – | – | 486 | Histogram, texture, wavelet fliter | LASSO | SVM | – |
| Alvarez-Jimenez 2020 (31) | 101(49) | CT | R | M | – | – | 120 | Haralick texture, statastics | Spearman’s rank correlation | SVM | – |
| Brunese 2020 (32) | 130(98) | CT | R | M | – | – | 14 | shape | – | Neural Net | – |
| Han 2020 (33) | 70(41) | CT | R | M | CTKinetics APP | CTKinetics APP | 42 | Histogram, GLCM, GLRLM | t-test, wilcox test, spearman correlation analysis | LR | – |
| Tomori 2020 (34) | 40(22) | CT | R | M | LIFEx | LIFEx | 42 | Histogram, shape, GLCM, GLRLM, NGLDM, GLZLM | Mann-Whitney U test | LR | SUVmax |
| Vuong 2020 (35) | 105(63) | CT | R | M | MIM VISTA | Z-Rad | 154 | Intensity, texture | ICC, PCA, univariate logistic regression | LR | – |
| Chanuzwa 2021 (36) | 272(185) | CT | R | A | – | CNN | – | – | – | CNN | – |
| Li 2021 (37) | 121(55) | CECT | R | M | ITK-SNAP | PyRadiomics | 107 | First-order, shape, GLDM, GLSZM, GLRLM, GLCM, NGTDM | LASSO | FNN | – |
| Liu 2021 (38) | 126(72) | CT | R | S | ITK-SNAP | Pyradiomics | 107 | Shape, first-order, GLDM, GLRLM, GLSZM, GLCM, NGTDM | Fisher score | RF | – |
| Marentakis 2021 (39) | 102(48) | CT | R | M | – | – | 529 | First-order, shape, texture, wavelet filter | – | KNN | – |
| Chen 2022 (40) | 129(87) | CT | R | S | ITK-SNAP | A.K. Software | 107 | First-order, shape, texture | ICC, LASSO | LR | Gender, distant metastasis, NICVP |
| Tang 2022 (1) (41) | 105(58) | CT | R | M | Custom-developed package | PyRadiomics | 1023 | First-, higher-order, GLCM, GLRLM, NGTDM, GLSZM, GLDM | t-test, SVM-RFE | Ensemble classifier | – |
| Chen 2023 (42) | 324(157) | CT | R | M | – | PyRadiomics | 1158 | First-order, shape, texture, transform-based | L2,1-norm minimization | SVM | – |
| Song 2023 (43) | 868(600) | CT | R | M | ITK-SNAP | PyRadiomics | 1409 | Shape, intensity, texture, higher-order | L 2,1-norm minimization | Bagging-AdaBoost-SVM | – |
| Ha 2014 (44) | 30(17) | PET/CT | R | M | MaZda | MaZda | >200 | Texture | Fisher coefficient, minimization of both classification error probability and average correlation, mutual information |
LDA | – |
| Ma 2018 (45) | 299(125) | PET/CT | R | M | – | Matlab | – | Texture | – | SVM | Color features |
| Hyun 2019 (46) | 396(210) | PET/CT | R | M | – | LIFEx | 40 | First-order, GLCM, NGLDM, GLRLM, GLZLM | Gini coefficient | LR | Gender, SUVmax, total lesion glycolysis, age |
| Sha 2019 (47) | 100(61) | PET/CT | R | M | MIM Maestro | Chang-Gung Image Texture Analysis | 107 | Texture, shape | LASSO | LR | Smoking |
| Ayyildiz 2020 (48) | 93(39) | PET/CT | R | A | Random walk | Matlab | 39 | GLCM, GLRLM, GLSZM, NGTDM | CFS subset evaluator | Ensemble classifier | – |
| Han 2021 (49) | 1419(867) | PET/CT | R | S | MATLAB | PyRadiomics | 688 | First-order, GLCM, GLRLM, GLSZM, GLDM, wavelet filter | L 2,1 norm regularization | LDA | – |
| Ji 2021 (50) | 416 | PET/CT | R | S | Chang-Gung Image Texture Analysis | Chang-Gung Image Texture Analysis | 54 | Texture | LASSO | LR | Location |
| Ren 2021 (51) | 315(193) | PET/CT | R | M | Inveon Research Workplace | Chang-Gung Image Texture Analysis |
212 | GLCM, GLRM, GLNIDM, GLSZM, TFC, TFCCM, NGLD | Univariate analysis, LASSO | LASSO | Gender, size, SCCA, CYFRA21.1 |
| Shen 2021 (52) | 250(150) | PET/CT | R | S | ITK-SNAP | PyRadiomics | 385 | First-order, shape, GLRLM, GLSZM, GLDM, GLCM, NGTDM, CoLIAGe features | Spearman correlation analysis, chi-square test, SVM-RFE | SVM-RBF | Gender |
| Zhou 2021 (53) | 452(329) | PET/CT | R | S | LIFEx | LIFEx | 48(PET) 41(CT) |
First-, second-, higher order | GBDT | GBDT(PET) RF(CT) |
– |
| Zhao 2022 (54) | 120(62) | PET/CT | R | S | LIFEx | LIFEx | 91 | First-, second-order, conventional indices | ICC, Boruta algorithm | SVM | Gender, smoking, CEA, SCCA |
| Tang 2020 (55) | 148(80) | MRI | R | M | Custom-developed package. | Matlab | 1404 | Histogram, CM, RLM, NGTDM, GLSZM | t-test, SVM-RFE | LR | Age, smoking, location, LD, LPD |
| Yang 2023 (56) | 71(46) | MRI | R | M | 3D Slicer | SlicerRadiomics | – | Shape, first-, second-order, wavelet filters | LASSO | LR | Smoking |
| Bebas 2021 (57) | 44(24) | PET/MRI | R | M | – | QMazda | 303 | First-order, GLCM, GLRLM, AR, GMF, HOG, LBP, Gabor, wavelet | t-test, Mann-Whitney U test | SVM | – |
| Tang 2022 (2) (58) | 80 (47) | PET/MRI, CT | R | M | ITK-SNAP | uAI Research Portal | 2264 | First-order, GLRLM, GLSZM, NGTDM, GLCM, GLDM | F test and LASSO | Gaussian process | Position, TLG, volume |
Characteristic of included studies.
LUAD, lung adenocarcinoma; R, retrospective; P, prospective; S, semi-automatic; M, manual; A, automatic; GLCM, gray level co-occurrence matrix; GLRLM, gray level run length matrix; GLSZM, gray level size zone matrix; NGTDM, neighboring gray tone difference matrix; NGLDM, neighborhood gray-level different matrix; GLZLM, gray-level zone length matrix; RLM, run-length matrix; NGLD, neighboring gray level dependence; TFC, texture feature coding; TFCCM, texture feature coding co-occurrence matrix; AR, autoregressive model; CM, co-occurrence matrices; GMF, gradient map features; LBP, local binary patterns; HOG, histogram of oriented gradients; LASSO, least absolute shrinkage and selection operator; CCC, concordance correlation coefficient; mRMR, max-relevance and min-redundancy; RFE, recursive feature elimination; ICC, intraclass correlation coefficient; PCA, principal component analysis; GBDT, gradient boosting decision tree; LDA, linear discriminant analysis; SVM, support vector machine; LR, logistic regression; RF, random forest; CNN, convolutional neural network; QDA, quadratic discriminant analysis; RBF, radial basis function; TLG, total lesion glycolysis; NIC, normalized iodine concentration; VP, venous phase; FNN, feedforward neural network; CEA, carcinoembryonic antigen; SCCA, squamous cell carcinoma antigen.
Study quality
The summarized QUADAS-2 results are showed in Figure 2. In the domain of patient selection, 2 studies did not provide the information of patient, 5 did not randomly or consecutively enrolled patients, and the exclusion criteria in 7 studies were inappropriate. With regards to the domain of index test, 4 studies did not describe the imaging acquisition well, 6 did not describe the segmentation methods in detail, 6 did not describe the feature extraction software. Independent validation was missed in 17 studies. All included studies used the reference standard which could correctly classify between LUAD and LUSC. The interval between imaging and reference standards was not reported in 5 studies. The high concern of applicability was observed in the aspects of index test (12/40) and patient selection (7/40). The answers to 9 signaling question of included studies are showed in Supplementary Table S3. The absolute agreement of 9 signaling questions ranged from 86.3% to 100%.
Figure 2
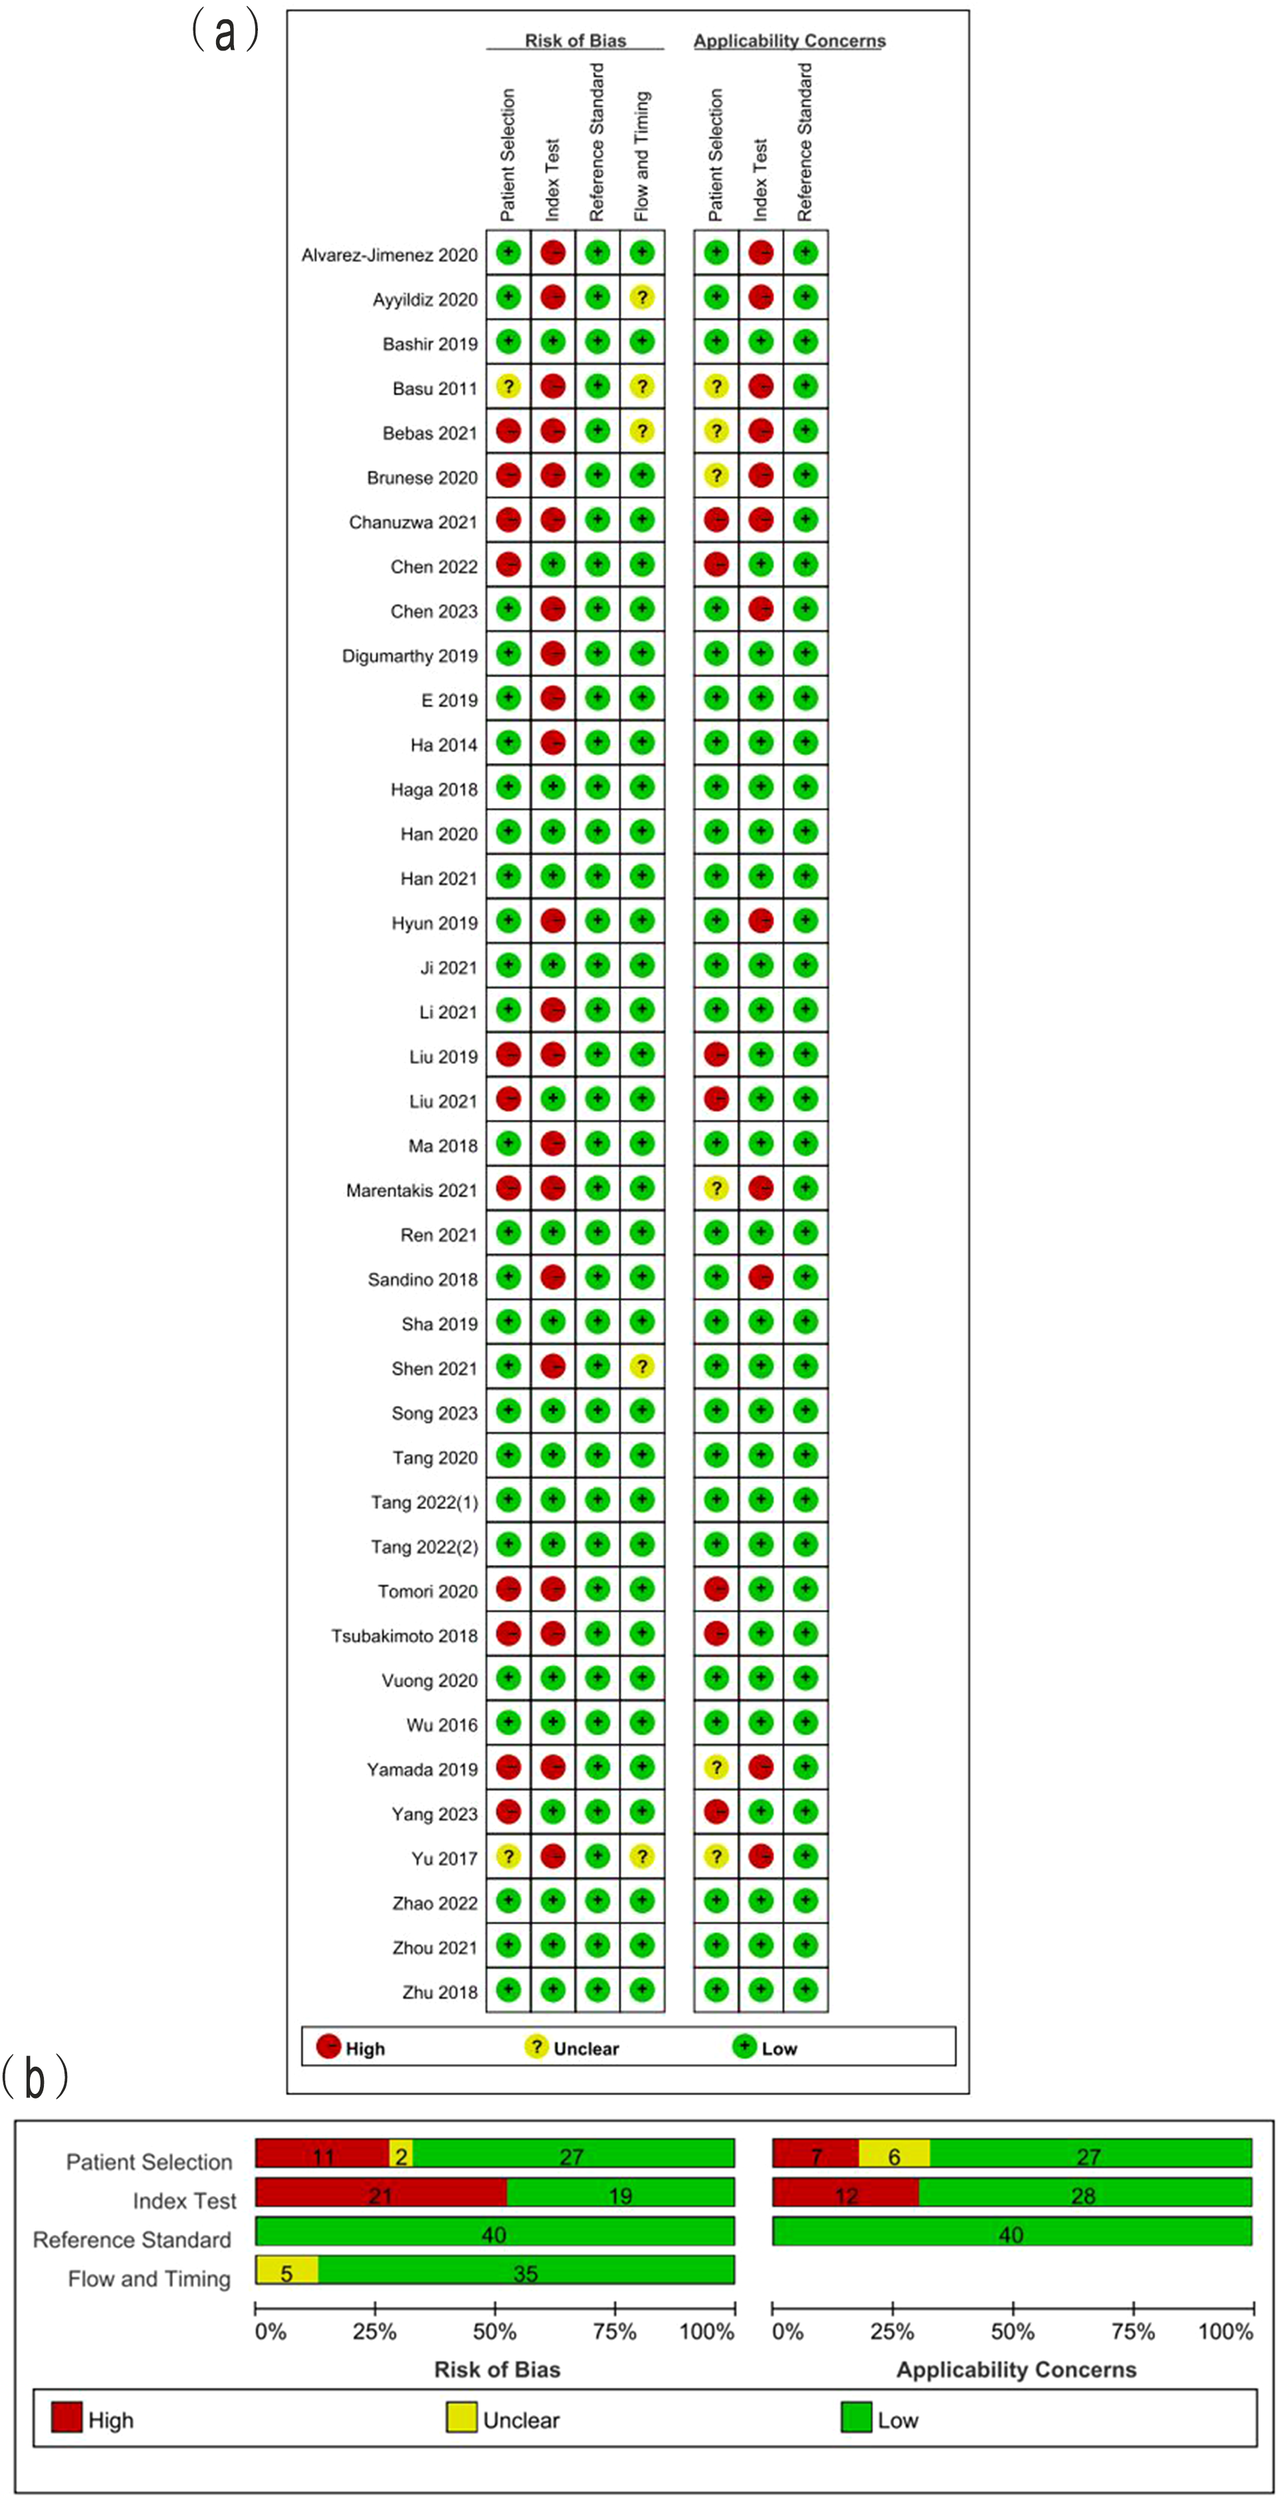
(A) Methodological quality assessment of individual studies and (B) summary of the methodological quality of included studies.
The total RQS of included studies ranged from -5 to 19, with median of 12 (Table 2). The median RQS proportion was 33.3%, with a maximum of 52.8%. The RQS guideline did not define low or high quality clearly. However, 17 studies scored less than 30%. No studies included in the analysis performed multiple segmentation or cost-effective analysis. Feature reduction was conducted in 90% studies prior to modeling. More than half of the studies (23/40) used independent validation sets. Only 6 studies reported calibration statistics. Six studies reported the potential clinical utility. Twenty-nine studies published neither code nor data. The scores for each item and total scores of each study are presented in Table 2. The Fleiss kappa statics varied from 84.4% to 100% for each item and ICC of 98.1% (95%CI: 96.4%~99.0%) for the overall RQS showed a satisfactory level of agreement between the two reviewers, as shown in Table 2.
Table 2
| StudyID | Image protocol (0/1/2) |
Multiple segmentations (0/1) |
Inter-scanner differences (0/1) |
Imaging multiple times (0/1) |
Feature reduction (-3/3) |
Non- radiomic feature (0/1) |
Biological correlates (0/1) |
Cut-offs (0/1) |
Discrimination (0/1/2) |
Calibration (0/1/2) |
Prospective (0/7) |
Validation (-5/2/3/4/5) |
gold standard (0/2) |
Clinical utility (0/2) |
Cost (0/1) |
Open science (0/1/2/3/4) |
RQS (total) (-8~36) |
RQS (%) (0~100%) |
|---|---|---|---|---|---|---|---|---|---|---|---|---|---|---|---|---|---|---|
| Basu 2011 (19) | 0 | 1 | 0 | 0 | -3 | 0 | 0 | 0 | 0 | 0 | 0 | -5 | 2 | 0 | 0 | 0 | -5 | 0 |
| Wu 2016 (20) | 1 | 1 | 0 | 0 | 3 | 0 | 0 | 1 | 2 | 0 | 0 | 3 | 2 | 0 | 0 | 3 | 16 | 44.4 |
| Yu 2017 (21) | 1 | 1 | 0 | 0 | 3 | 0 | 0 | 0 | 2 | 0 | 0 | -5 | 2 | 0 | 0 | 0 | 4 | 11.1 |
| Haga 2018 (22) | 1 | 1 | 1 | 0 | 3 | 0 | 0 | 0 | 2 | 0 | 0 | 2 | 2 | 0 | 0 | 0 | 12 | 33.3 |
| Sandino 2018 (23) | 1 | 1 | 0 | 0 | -3 | 0 | 0 | 0 | 2 | 0 | 0 | -5 | 2 | 0 | 0 | 1 | -1 | 0 |
| Tsubakimoto 2018 (24) | 1 | 0 | 1 | 0 | 3 | 1 | 1 | 1 | 2 | 0 | 7 | -5 | 2 | 0 | 0 | 0 | 14 | 38.9 |
| Zhu 2018 (25) | 1 | 1 | 0 | 0 | 3 | 0 | 1 | 0 | 2 | 0 | 0 | 2 | 2 | 0 | 0 | 0 | 12 | 33.3 |
| Bashir 2019 (26) | 1 | 1 | 0 | 0 | 3 | 1 | 1 | 0 | 2 | 0 | 0 | 3 | 2 | 0 | 0 | 0 | 14 | 38.9 |
| Digumarthy 2019 (27) | 1 | 0 | 0 | 0 | 3 | 1 | 1 | 0 | 2 | 0 | 0 | -5 | 2 | 0 | 0 | 0 | 5 | 13.9 |
| E 2019 (28) | 1 | 0 | 0 | 0 | 3 | 0 | 1 | 0 | 2 | 0 | 0 | -5 | 2 | 0 | 0 | 0 | 4 | 11.1 |
| Liu 2019 (29) | 1 | 0 | 1 | 0 | 3 | 1 | 1 | 0 | 2 | 0 | 0 | -5 | 2 | 0 | 0 | 0 | 6 | 16.7 |
| Yamada 2019 (30) | 1 | 1 | 0 | 0 | 3 | 0 | 0 | 0 | 2 | 0 | 0 | -5 | 2 | 0 | 0 | 1 | 5 | 13.9 |
| Alvarez-Jimenez 2020 (31) | 1 | 1 | 0 | 0 | 3 | 0 | 0 | 0 | 2 | 0 | 0 | -5 | 2 | 0 | 0 | 1 | 5 | 13.9 |
| Brunese 2020 (32) | 1 | 1 | 0 | 0 | -3 | 0 | 0 | 0 | 2 | 0 | 0 | -5 | 2 | 0 | 0 | 1 | -1 | 0 |
| Han 2020 (33) | 1 | 0 | 1 | 0 | 3 | 0 | 1 | 1 | 2 | 0 | 0 | 2 | 2 | 0 | 0 | 0 | 13 | 36.1 |
| Tomori 2020 (34) | 1 | 1 | 1 | 0 | 3 | 1 | 1 | 1 | 2 | 0 | 0 | -5 | 2 | 0 | 0 | 0 | 8 | 22.2 |
| Vuong 2020 (35) | 1 | 0 | 0 | 0 | 3 | 0 | 1 | 0 | 2 | 0 | 0 | 3 | 2 | 0 | 0 | 0 | 12 | 33.3 |
| Chanuzwa 2021 (36) | 0 | 1 | 0 | 0 | -3 | 0 | 0 | 0 | 2 | 0 | 0 | 3 | 2 | 0 | 0 | 0 | 5 | 13.9 |
| Li 2021 (37) | 1 | 1 | 0 | 0 | 3 | 0 | 0 | 0 | 2 | 0 | 0 | -5 | 2 | 0 | 0 | 0 | 4 | 11.1 |
| Liu 2021 (38) | 1 | 1 | 1 | 0 | 3 | 0 | 0 | 0 | 2 | 0 | 0 | 2 | 2 | 0 | 0 | 0 | 12 | 33.3 |
| Marentakis 2021 (39) | 1 | 1 | 0 | 0 | 3 | 0 | 0 | 0 | 2 | 0 | 0 | 2 | 2 | 0 | 0 | 1 | 12 | 33.3 |
| Chen 2022 (40) | 1 | 0 | 1 | 0 | 3 | 1 | 1 | 0 | 2 | 2 | 0 | 2 | 2 | 2 | 0 | 0 | 17 | 47.2 |
| Tang 2022 (1) (41) | 1 | 1 | 1 | 0 | 3 | 0 | 0 | 0 | 2 | 0 | 0 | 2 | 2 | 0 | 0 | 1 | 13 | 36.1 |
| Chen 2023 (42) | 1 | 1 | 0 | 0 | 3 | 0 | 0 | 0 | 2 | 0 | 0 | 2 | 2 | 0 | 0 | 1 | 12 | 33.3 |
| Song 2023 (43) | 1 | 1 | 0 | 0 | 3 | 0 | 1 | 0 | 2 | 0 | 0 | 4 | 2 | 0 | 0 | 1 | 15 | 41.7 |
| Ha 2014 (44) | 1 | 0 | 1 | 0 | 3 | 0 | 1 | 0 | 0 | 0 | 0 | -5 | 2 | 0 | 0 | 1 | 4 | 11.1 |
| Ma 2018 (45) | 1 | 0 | 0 | 0 | 3 | 1 | 1 | 1 | 2 | 0 | 0 | -5 | 2 | 0 | 0 | 0 | 6 | 16.7 |
| Hyun 2019 (46) | 1 | 0 | 1 | 0 | 3 | 1 | 1 | 0 | 2 | 0 | 0 | 2 | 2 | 0 | 0 | 0 | 13 | 36.1 |
| Sha 2019 (47) | 1 | 1 | 1 | 0 | 3 | 1 | 0 | 0 | 2 | 0 | 0 | 2 | 2 | 0 | 0 | 1 | 14 | 38.9 |
| Ayyildiz 2020 (48) | 0 | 0 | 1 | 0 | 3 | 0 | 0 | 0 | 2 | 0 | 0 | -5 | 2 | 0 | 0 | 0 | 3 | 8.3 |
| Han 2021 (49) | 1 | 0 | 1 | 0 | 3 | 0 | 0 | 0 | 2 | 0 | 0 | 2 | 2 | 0 | 0 | 0 | 11 | 30.6 |
| Ji 2021 (50) | 1 | 0 | 1 | 0 | 3 | 1 | 1 | 0 | 2 | 2 | 0 | 2 | 2 | 2 | 0 | 0 | 17 | 47.2 |
| Ren 2021 (51) | 1 | 1 | 1 | 0 | 3 | 1 | 1 | 0 | 2 | 1 | 0 | 2 | 2 | 2 | 0 | 0 | 17 | 47.2 |
| Shen 2021 (52) | 1 | 0 | 1 | 0 | 3 | 1 | 1 | 0 | 2 | 0 | 0 | -5 | 2 | 0 | 0 | 0 | 6 | 16.7 |
| Zhou 2021 (53) | 1 | 0 | 1 | 0 | 3 | 0 | 0 | 0 | 2 | 0 | 0 | 2 | 2 | 0 | 0 | 0 | 11 | 30.6 |
| Zhao 2022 (54) | 1 | 1 | 1 | 0 | 3 | 1 | 0 | 0 | 2 | 0 | 0 | 2 | 2 | 0 | 0 | 0 | 13 | 36.1 |
| Tang 2020 (55) | 1 | 1 | 1 | 0 | 3 | 1 | 1 | 1 | 2 | 2 | 0 | 2 | 2 | 2 | 0 | 0 | 19 | 52.8 |
| Yang 2023 (56) | 1 | 1 | 0 | 0 | 3 | 1 | 1 | 0 | 2 | 1 | 0 | 2 | 2 | 2 | 0 | 0 | 16 | 44.4 |
| Bebas 2021 (57) | 0 | 0 | 0 | 0 | 3 | 0 | 0 | 0 | 0 | 0 | 0 | -5 | 2 | 0 | 0 | 0 | 0 | 0 |
| Tang 2022 (2) (58) | 1 | 1 | 1 | 0 | 3 | 1 | 1 | 0 | 2 | 1 | 0 | 2 | 2 | 2 | 0 | 0 | 17 | 47.2 |
| Inter-rater agreement (%) |
87.5 | 84.8 | 95.0 | 100.0 | 100.0 | 100.0 | 95.0 | 100.0 | 100.0 | 90.6 | 100.0 | 93.1 | 100.0 | 100.0 | 100.0 | 84.4 | 98.1 | 98.0 |
RQS of included studies.
Diagnostic efficacy
The pooled analysis was performed according to radiomics studies based on various imaging techniques (Supplementary Table S4). Analysis could not be performed on only one study that utilized PET/MRI images. Table 3 and Figures 3–6 presented the combined sensitivity, specificity, and SROC-AUC for CT images, PET images, PET-CT images and MRI images. The radiomics model utilizing PET-CT images exhibited the greatest combined effects magnitudes, with a sensitivity of 0.87(95%CI: 0.72~0.94), specificity of 0.88(95%CI: 0.80~0.93) and SROC-AUC of 0.93(95%CI: 0.91~0.95), correspondingly. The radiomics model, which utilized CT and PET images, demonstrated favorable diagnostic performance with an SROC-AUC of 0.86 (95%CI: 0.82~0.89) and 0.85(95%CI: 0.82~0.88). Additionally, it exhibited moderate performance when applied to MRI images, achieving an SROC-AUC of 0.79 (95%CI: 0.75~0.82).
Table 3
| Imaging modality | No. of study | Sensitivity (95%CI) | Specificity (95%CI) | SROC-AUC (95%CI) |
|---|---|---|---|---|
| CT | 11 | 0.78(0.71~0.83) | 0.85(0.73~0.92) | 0.86(0.82~0.89) |
| 5 (With non-radiomics features) | 0.82(0.73~0.88) | 0.95(0.67~0.99) | 0.89(0.86~0.91) | |
| 6 (Without non-radiomics features) | 0.76(0.66~0.84) | 0.77(0.66~0.85) | 0.83(0.80~0.86) | |
| 9(Two outlier studies excluded) | 0.81(0.75~0.85) | 0.87(0.78~0.93) | 0.87(0.84~0.90) | |
| PET | 5 | 0.80(0.61~0.91) | 0.77(0.60~0.88) | 0.85(0.82~0.88) |
| PET/CT | 6 | 0.87(0.72~0.94) | 0.88(0.80~0.93) | 0.93(0.91~0.95) |
| 5(One outlier study excluded) | 0.82(0.78~0.85) | 0.86(0.79~0.91) | 0.86(0.83~0.89) | |
| MRI | 4 | 0.73(0.61~0.82) | 0.80(0.65~0.90) | 0.79(0.75~0.82) |
| PET/MRI | 1 | 0.80 | 0.67 |
The meta-analysis results.
Figure 3
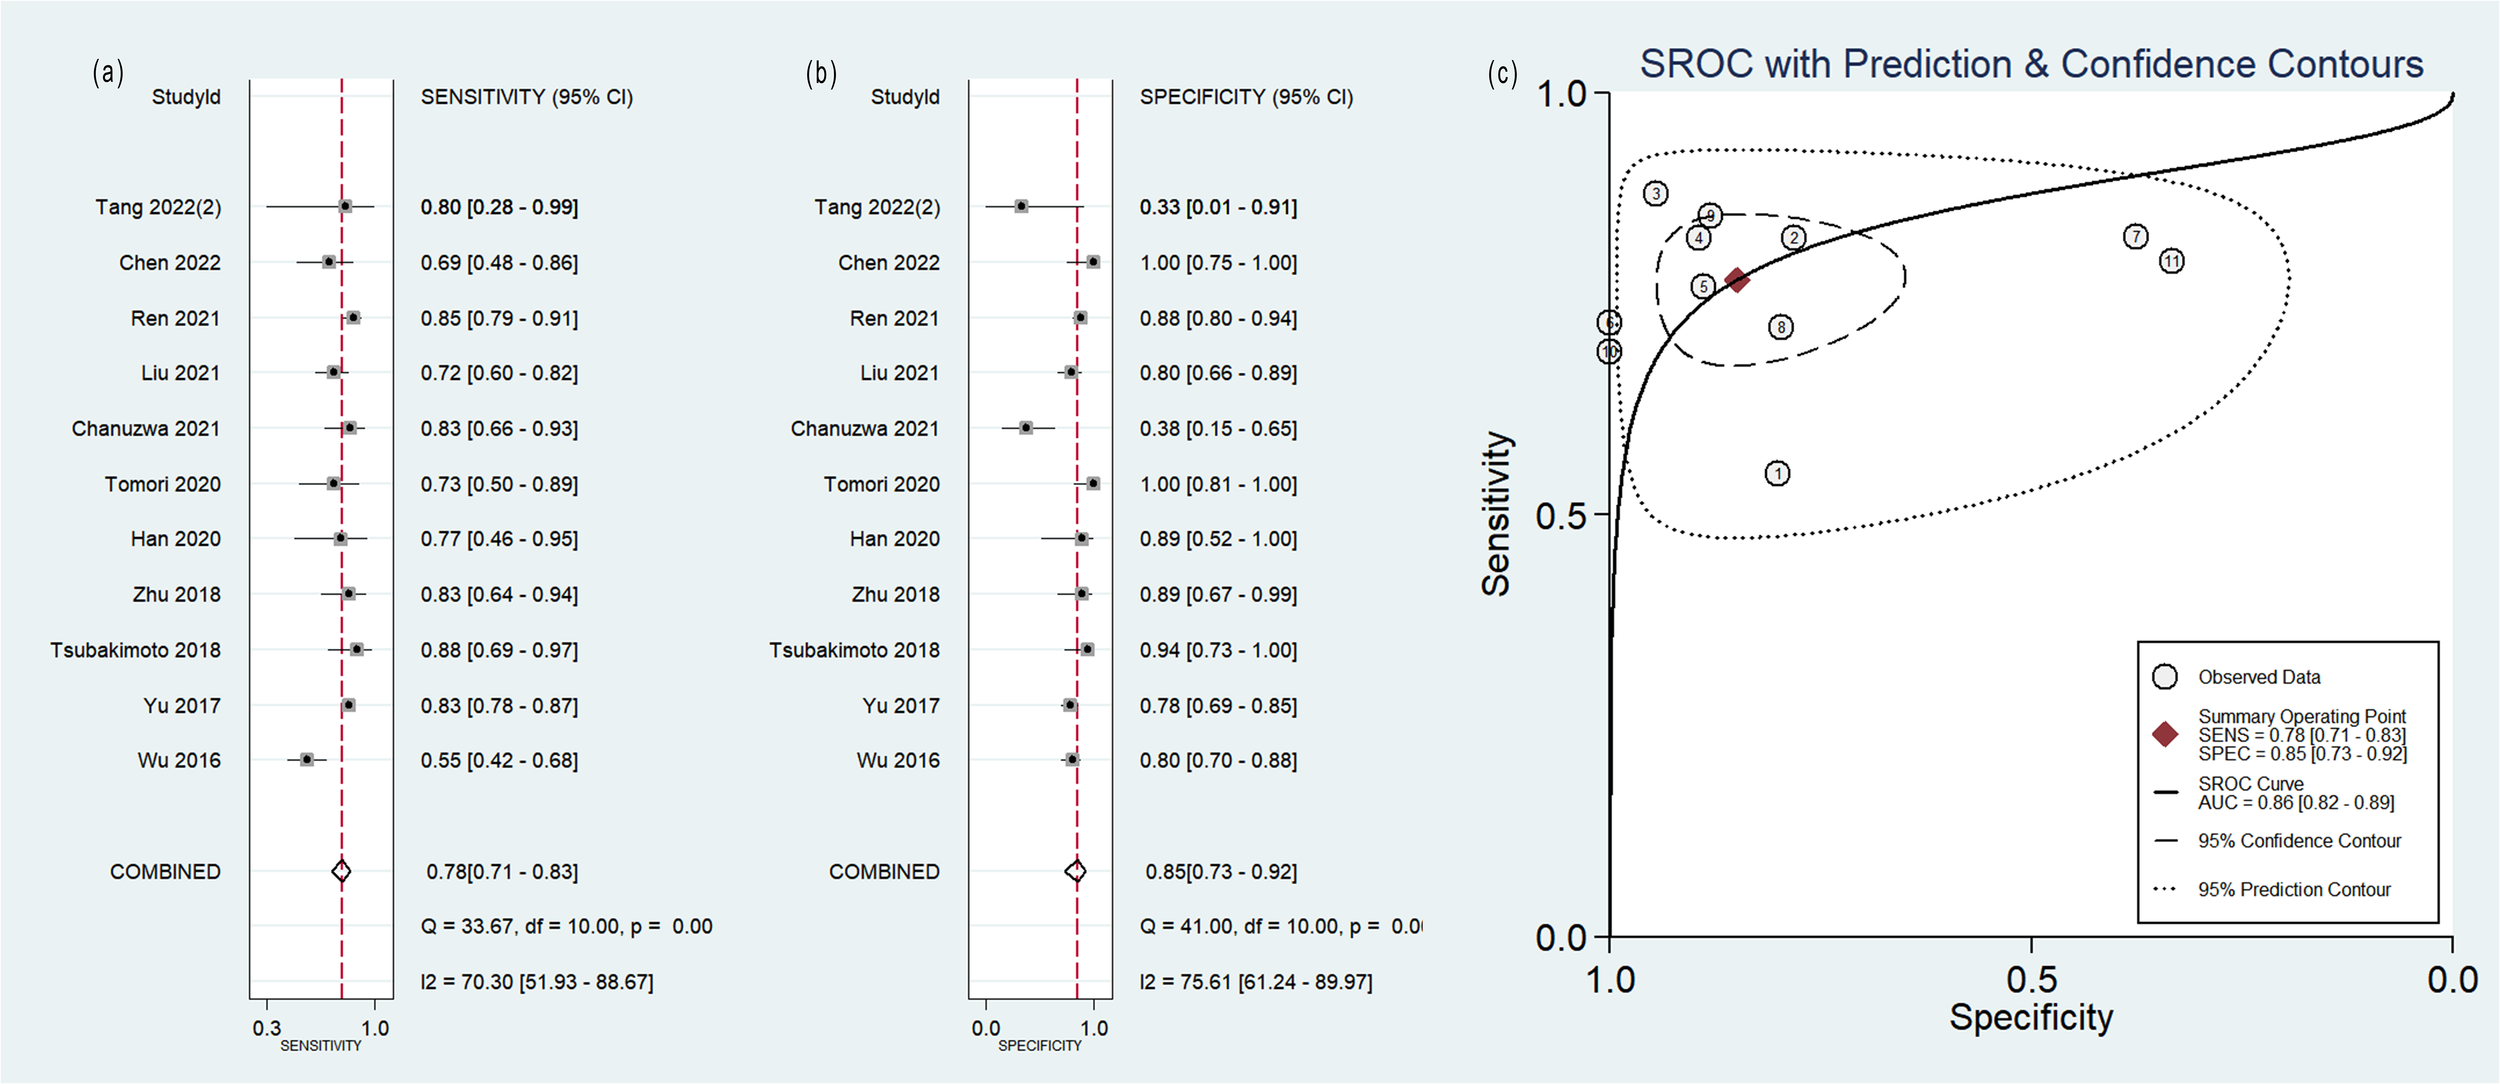
Forest plot of the pooled (A) sensitivity, (B) specificity, and (C) SROC curve for radiomics model based on CT images in distinguishing between lung adenocarcinoma and lung squamous cell carcinoma.
Figure 4
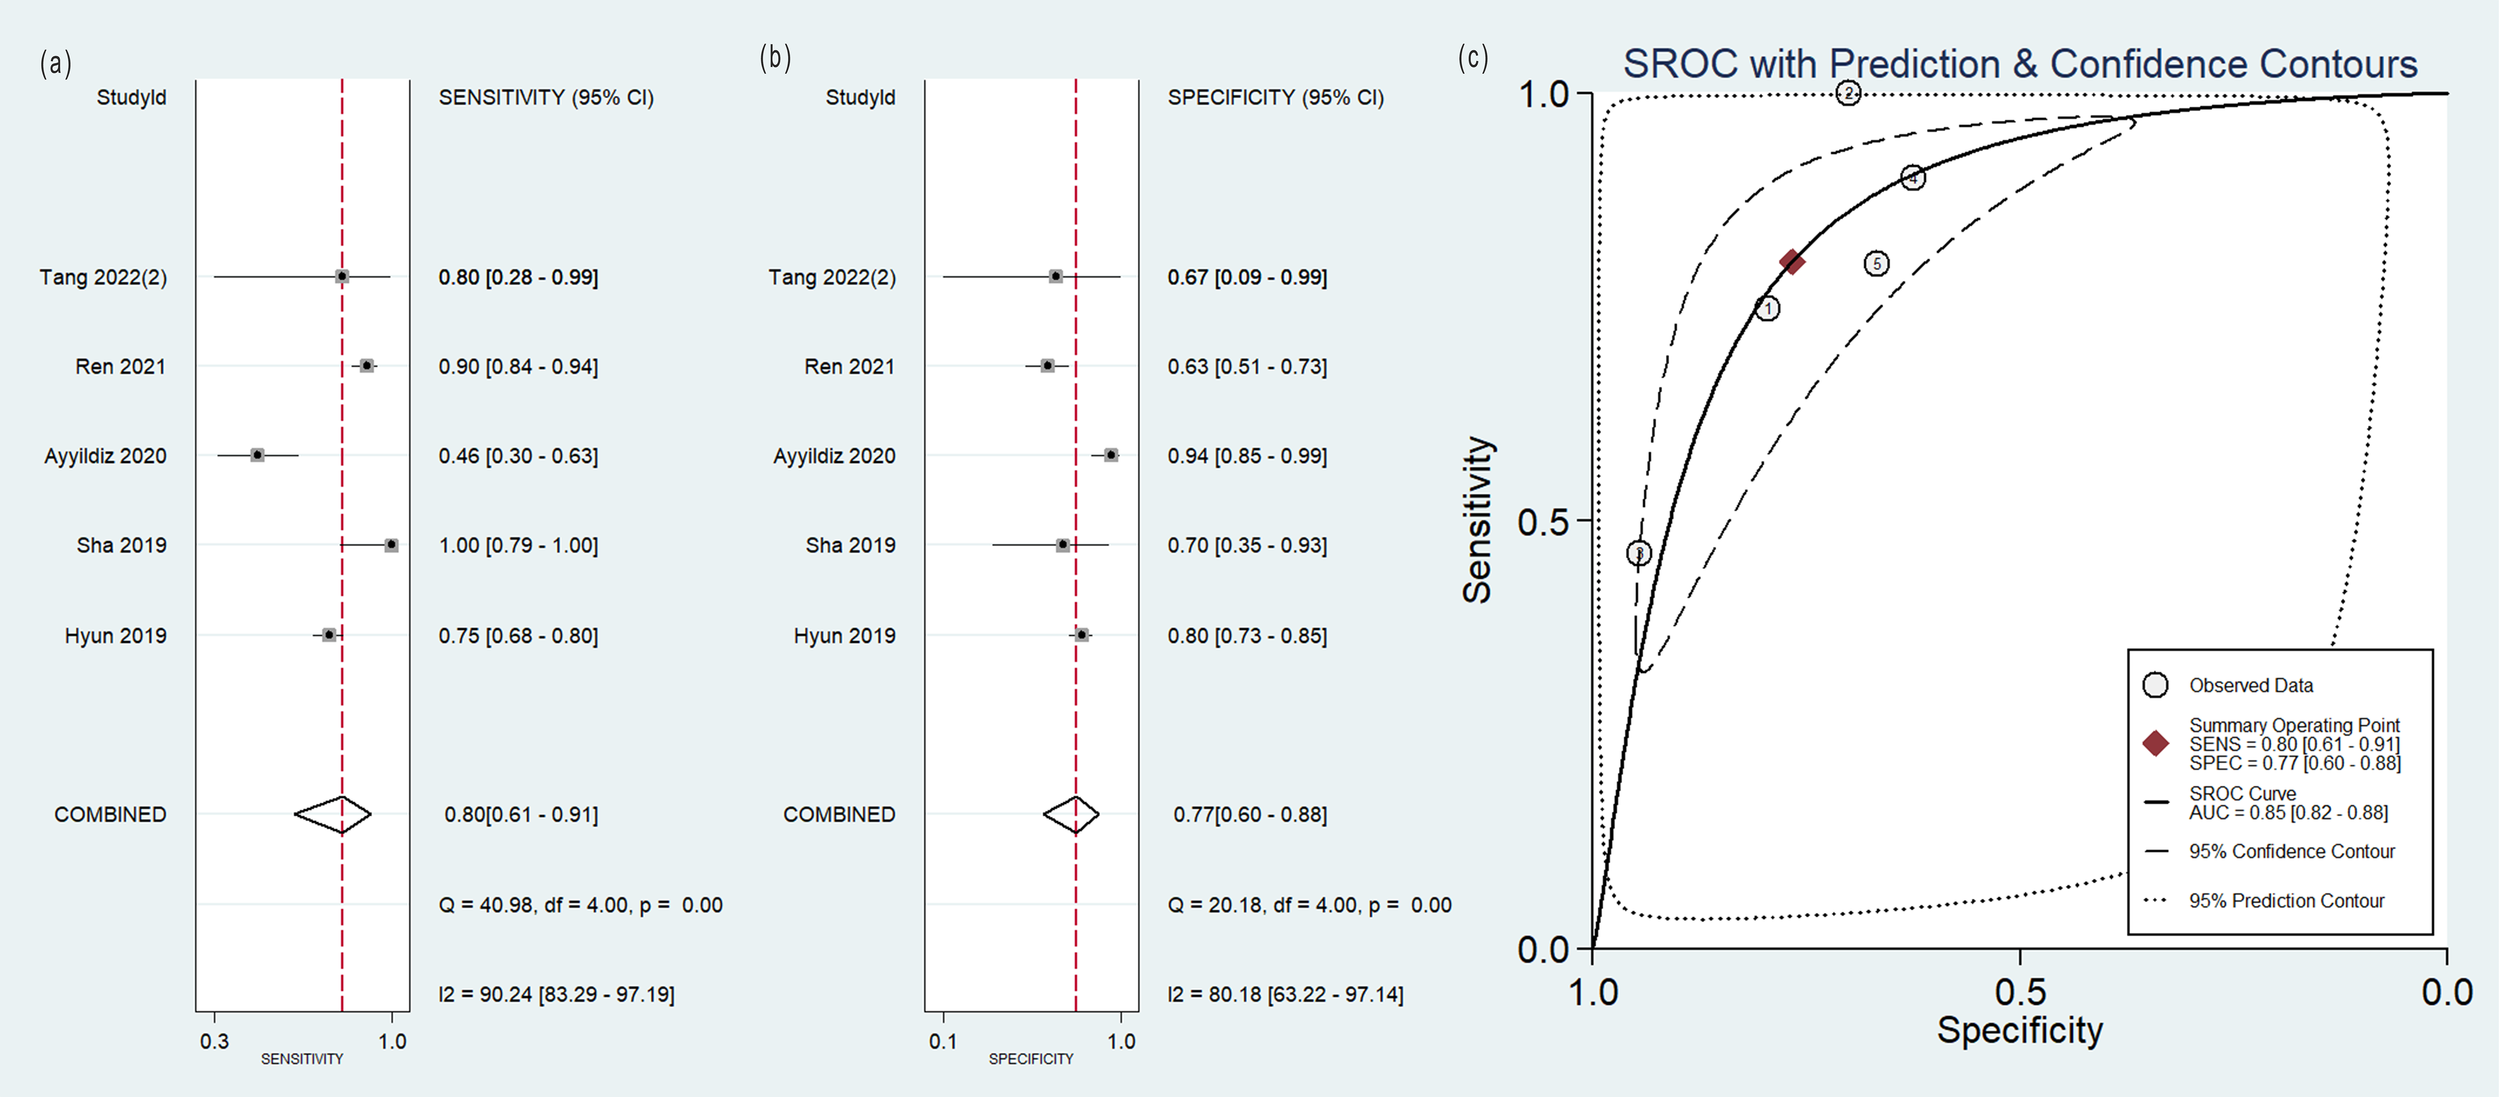
Forest plot of the pooled (A) sensitivity, (B) specificity, and (C) SROC curve for radiomics model based on PET images in distinguishing between lung adenocarcinoma and lung squamous cell carcinoma.
Figure 5
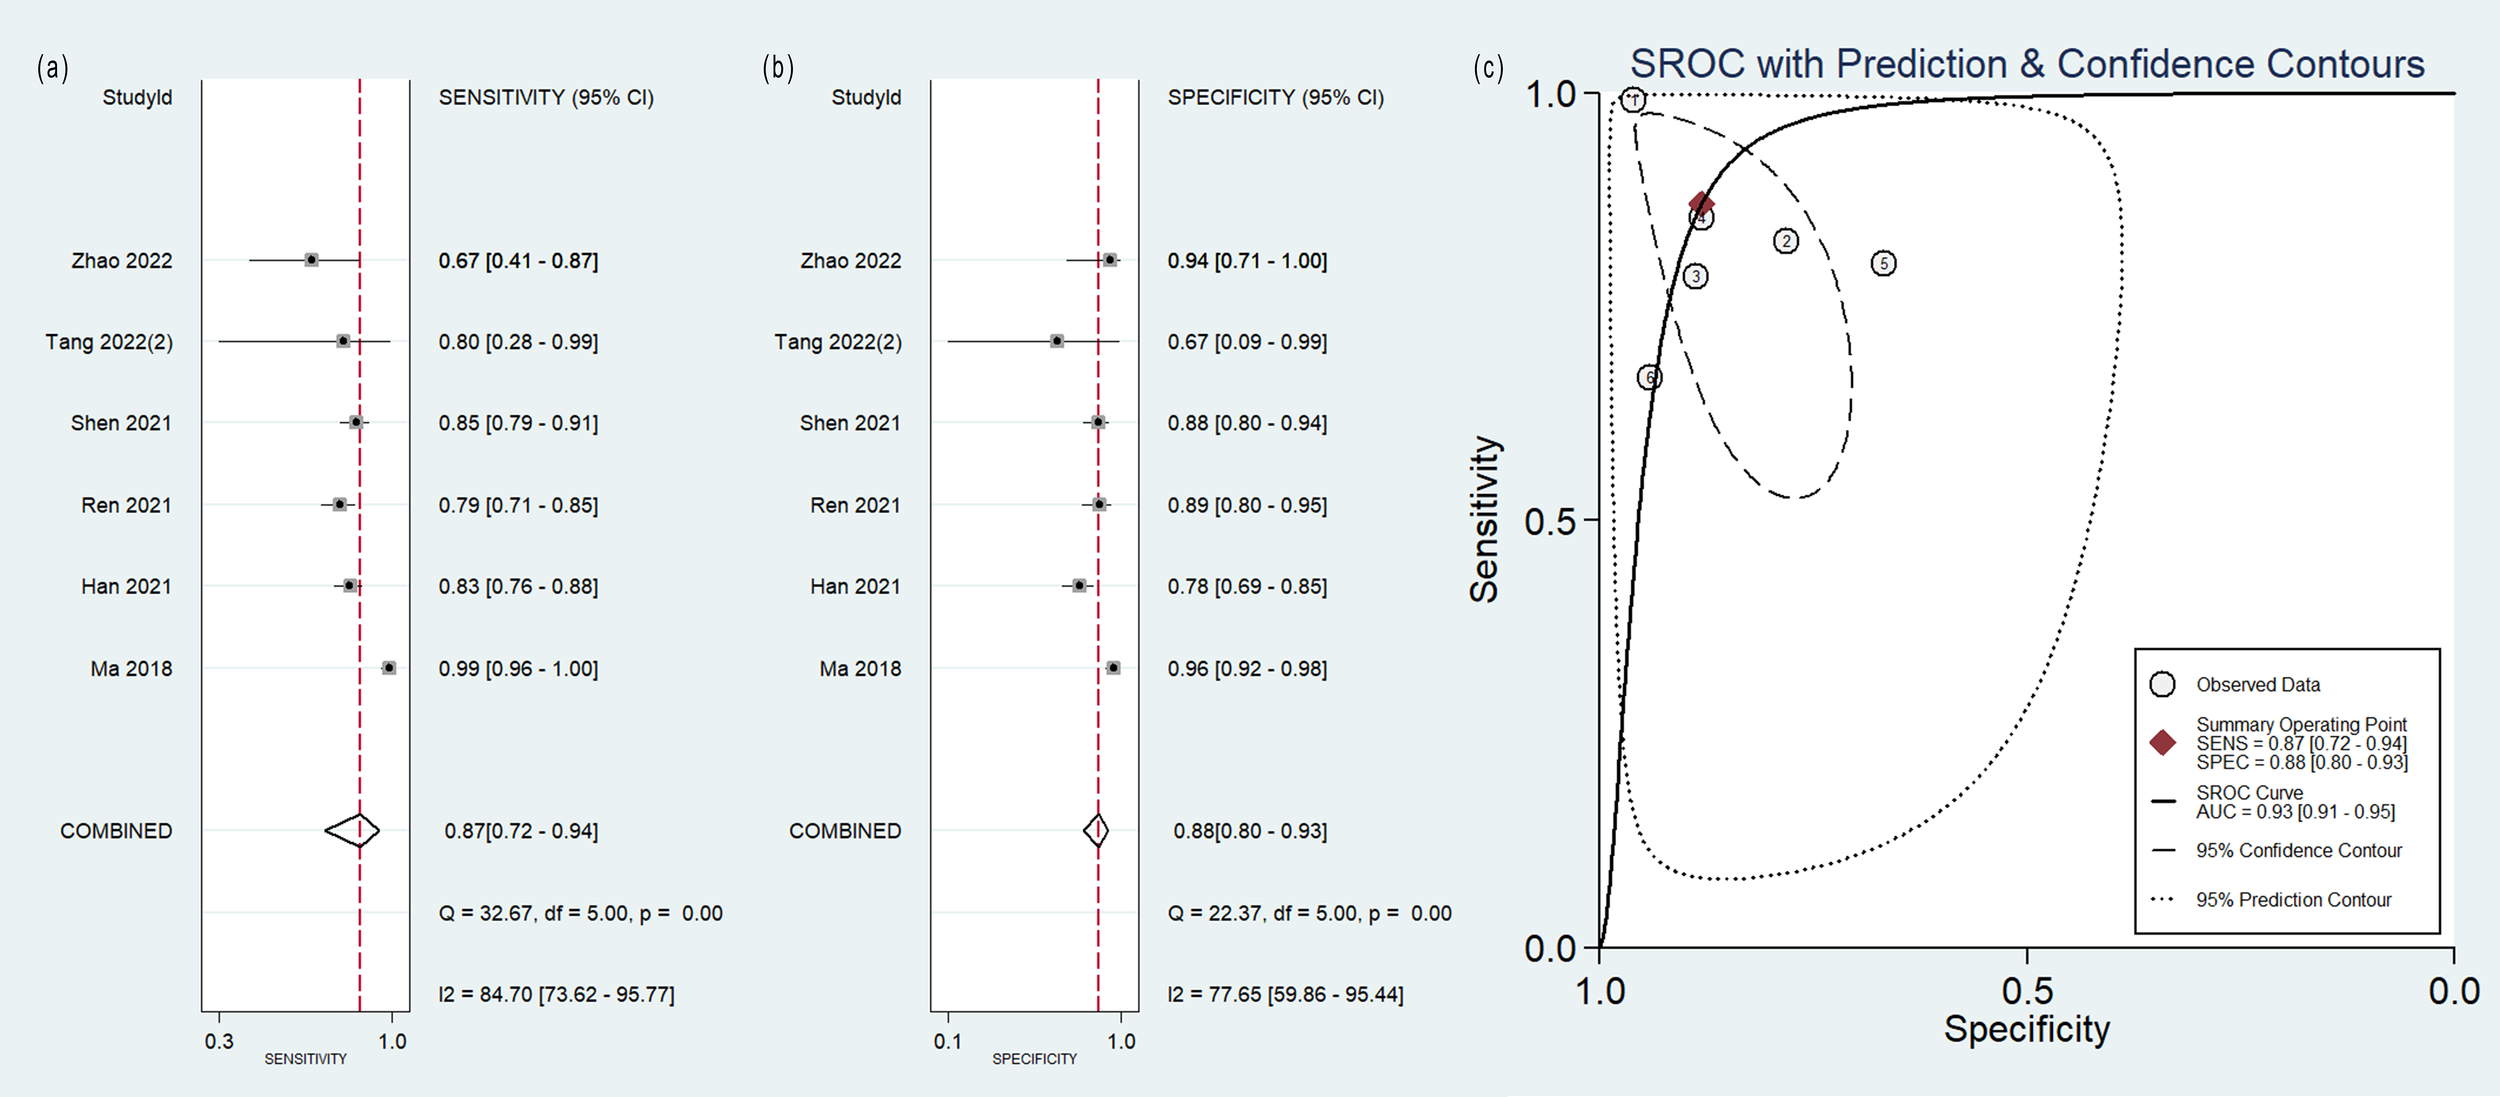
Forest plot of the pooled (A) sensitivity, (B) specificity, and (C) SROC curve for radiomics model based on PET-CT images in distinguishing between lung adenocarcinoma and lung squamous cell carcinoma.
Figure 6
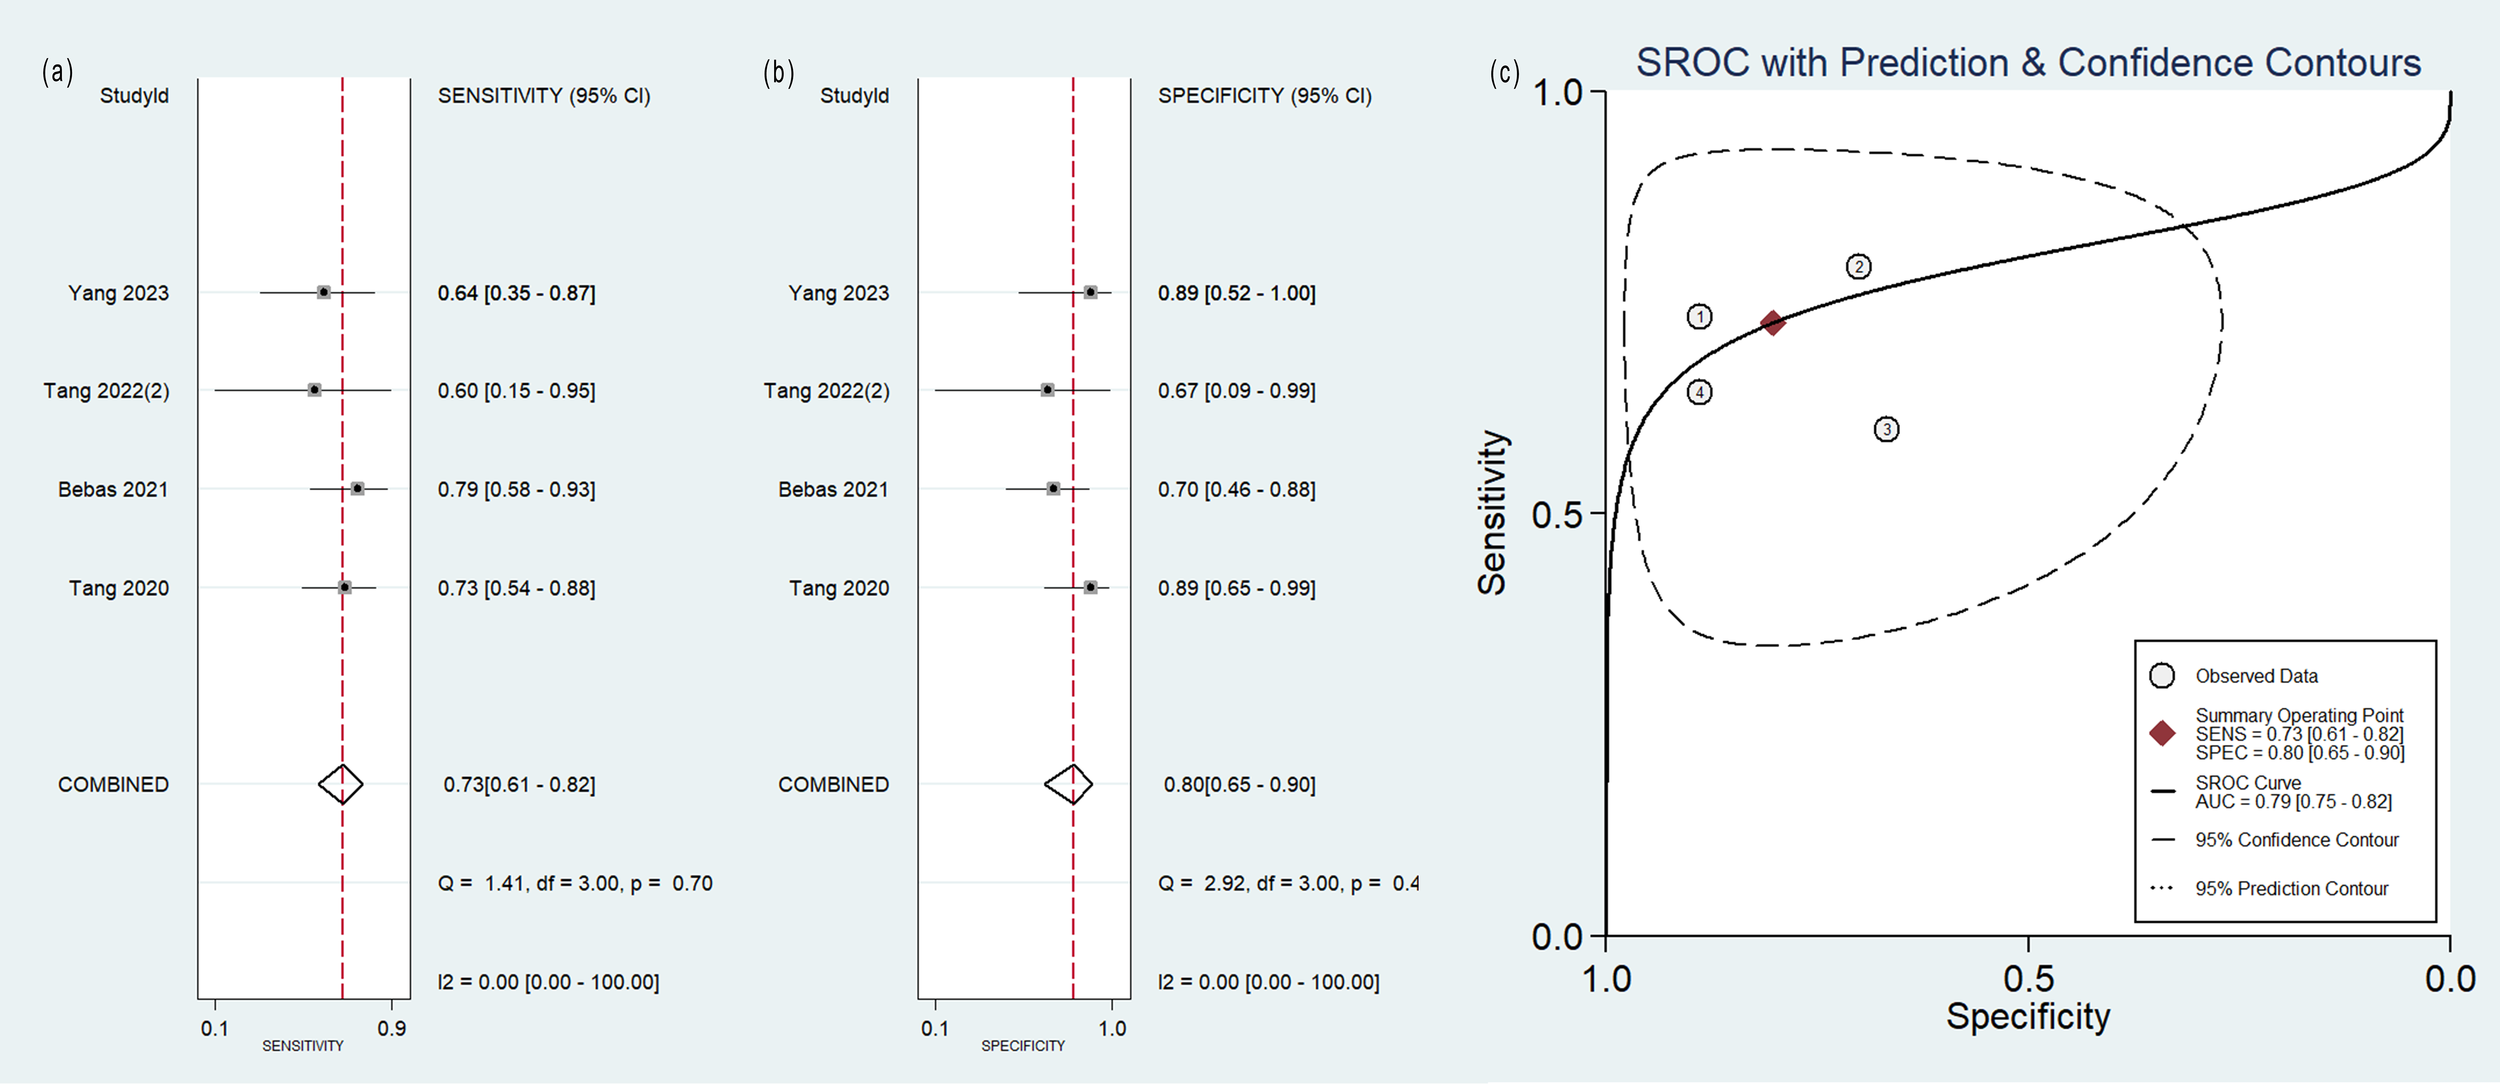
Forest plot of the pooled (A) sensitivity, (B) specificity, and (C) SROC curve for radiomics model based on MRI images in distinguishing between lung adenocarcinoma and lung squamous cell carcinoma.
No heterogeneity was observed among the 4 studies that utilized MRI radiomics features, as indicated by I2 value of 0% for the combined sensitivity and specificity (Figure 6). With regard to the pooled analysis based on other imaging modalities, there was substantial heterogeneity among studies with I2>50% (Figures 3-5).
Out of the 11 studies that developed radiomics models using CT images, 5 studies incorporated non-radiomics features in their models, resulting in higher sensitivity (0.82 compared to 0.76), specificity (0.95 compared to 0.77) and SROC-AUC (0.89 compared to 0.83) (Table 3, Supplementary Figure S1) than the 6 studies did not include non-radiomics features (Table 3, Supplementary Figure S2).
Sensitivity analysis
The sensitivity analysis showed two studies had impact on the pooled results of radiomics studies utilizing CT images (Figure 7). After removing the two studies (20, 36), the combined sensitivity, specificity, and SROC-AUC were 0.81(95%CI: 0.75~0.85), 0.87(95%CI: 0.78~0.93), and 0.87(95%CI: 0.84~0.90), correspondingly (Table 3, Supplementary Figure S3).
Figure 7
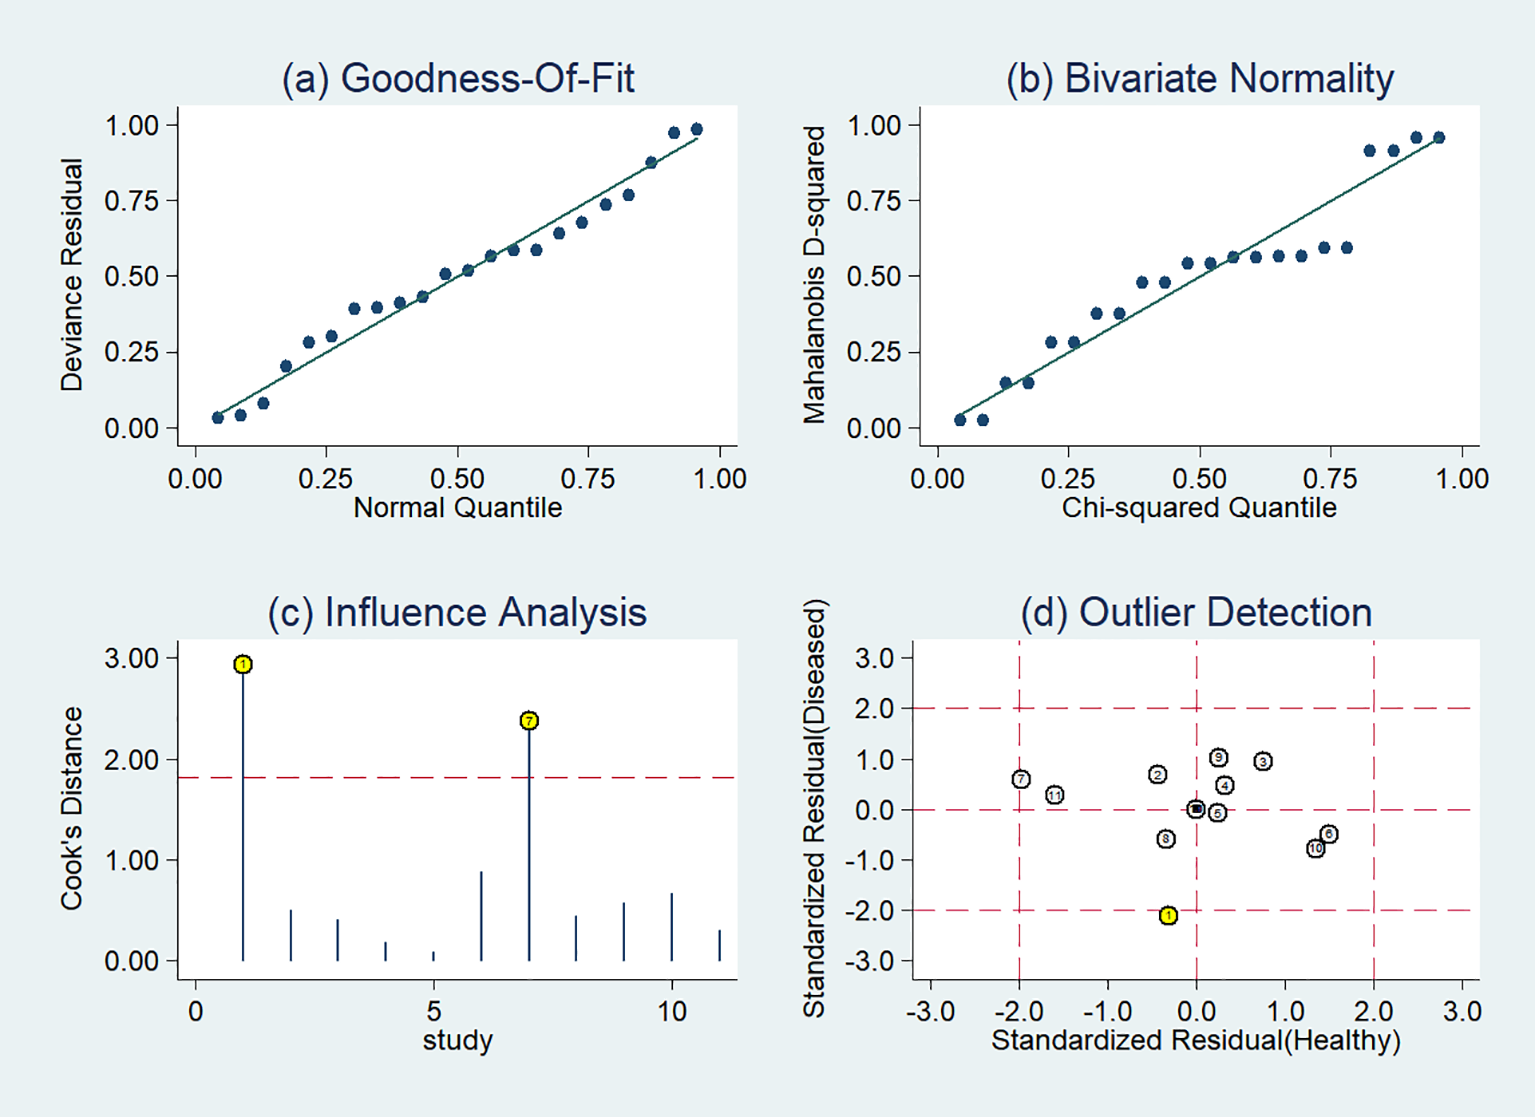
Sensitivity analysis of the included studies developing radiomics models in distinguishing between lung adenocarcinoma and lung squamous cell carcinoma utilizing CT images: (A) goodness of fit, (B) bivariate normality, (C) influence analysis, (D) outlier detection.
The sensitivity analysis detected one outlier study (45) with the highest diagnostic performance (sensitivity of 0.99 and specificity of 0.96) among the included studies based on PET-CT images (Figure 8). By omitting the study, the combined sensitivity, specificity, and SROC-AUC were 0.82(95%CI: 0.78~0.85), 0.86(95%CI: 0.79~0.91) and 0.86(95%CI: 0.83~0.89), respectively (Table 3, Supplementary Figure S4). The study also influenced the heterogeneity. When it was removed, the heterogeneity indicator I2 of sensitivity, and specificity, decreased from 84.7% to 21.2%, 77.6% to 46.1%, respectively.
Figure 8
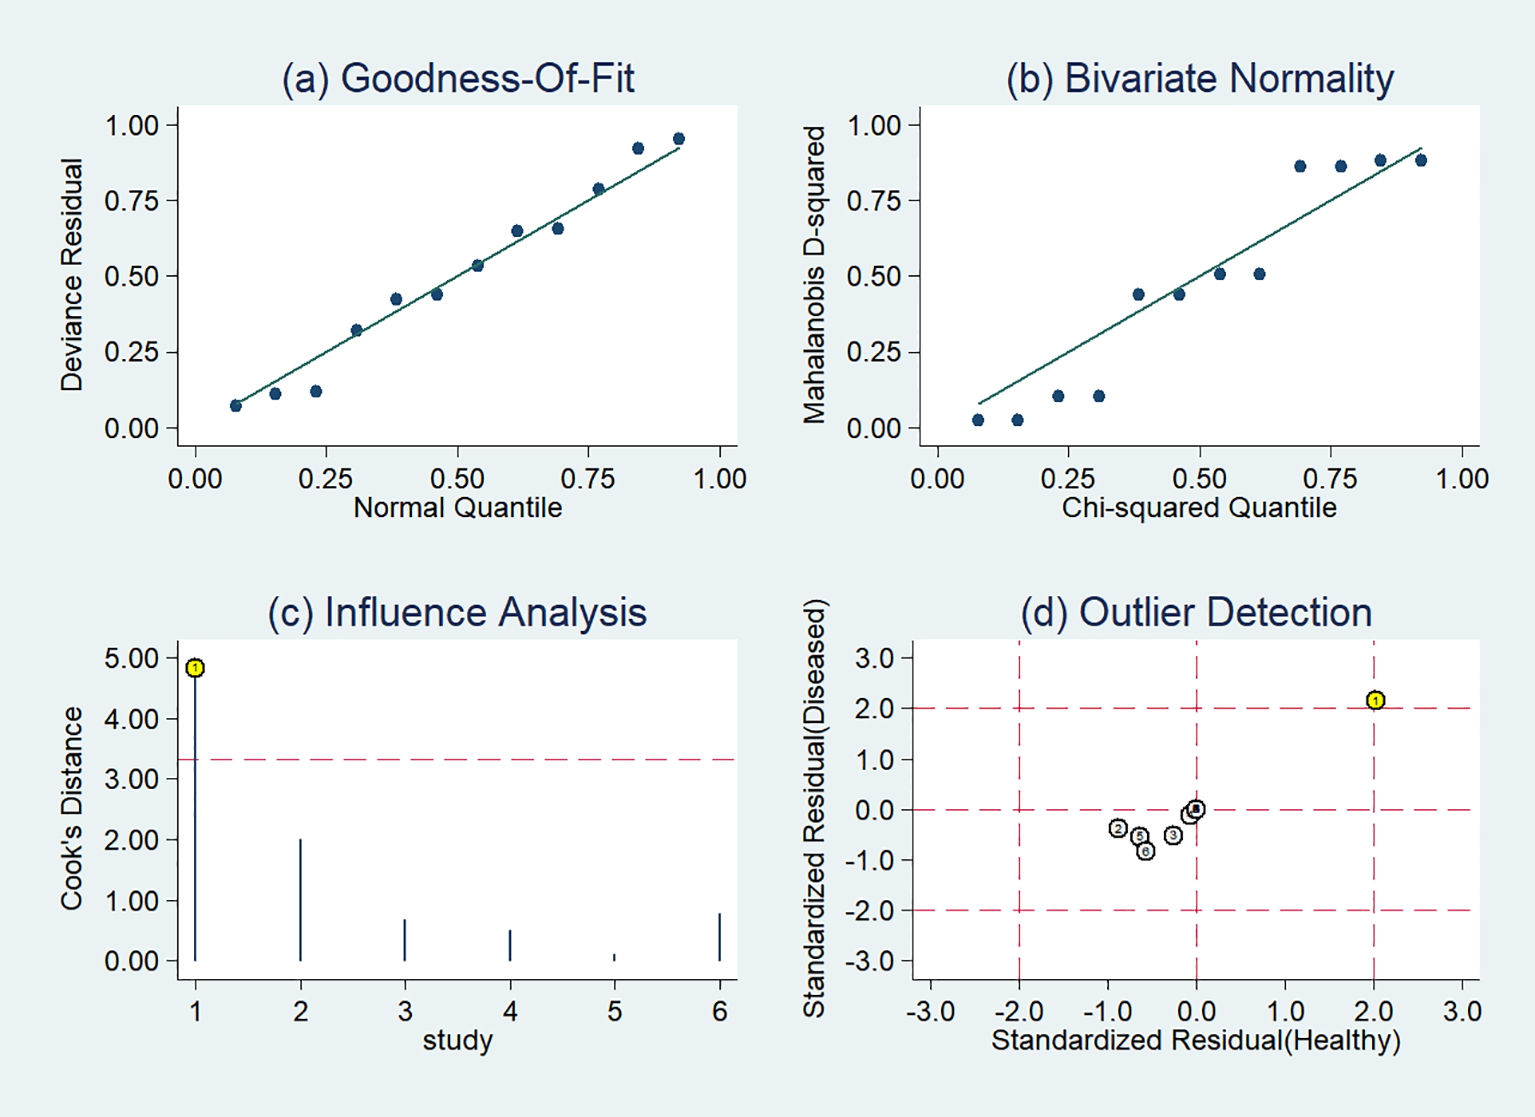
Sensitivity analysis of the included studies developing radiomics models in distinguishing between lung adenocarcinoma and lung squamous cell carcinoma utilizing PET-CT images: (A) goodness of fit, (B) bivariate normality, (C) influence analysis, (D) outlier detection.
The sensitivity analysis of pooled analysis based on PET images (Supplementary Figure S5) and MRI images (Supplementary Figure S6) did not find any studies impacting the pooled results.
Publication bias
Figure 9 displays Deeks’ funnel plot and the result of Deeks’ asymmetry test, which showcases the publication bias of the studies that developed radiomics classification models based on CT images. The figure did not exhibit evident asymmetry with P value of 0.83. The assessment of publication bias was not conducted for other subgroups due to the limited number of studies, which could result in an inconclusive funnel plot (59).
Figure 9
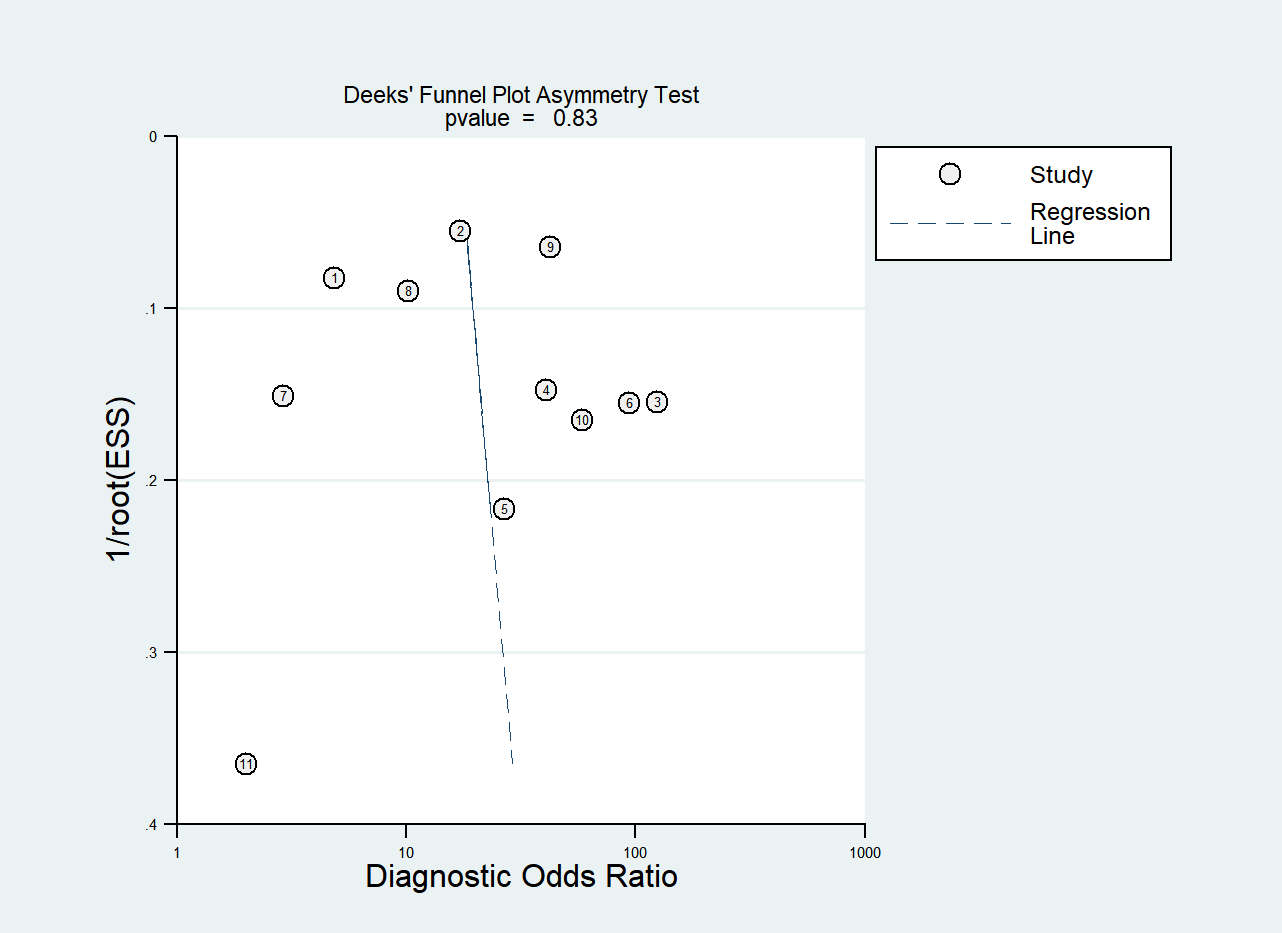
Deek’s funnel plot for radiomics studies based on CT images in distinguishing between lung adenocarcinoma and lung squamous cell carcinoma.
Discussion
Radiomics has the potential to offer noninvasive diagnostic data on lesions using medical images enhancing the early identification of lung cancer histological subtype in certain patients who are ineligible for biopsy or surgical procedures. The meta-analysis findings indicated that the radiomics approach proved to be effective in the classification of LUAD and LUSC.
Radiomics has been used for more than a decade, but the clinical application suffers from numerous limitations. RQS was proposed to establish a standardized guideline for radiomics in 2017. The overall quality of studies included in this systematic review was undesirable. All but only one study was retrospectively designed which limited the generalizability of the classification model. The lack of code and data hindered the ability to replicate findings in future studies. Discrimination and calibration are the most commonly used metrics when evaluating the predictive models. Nevertheless, the calibration metric was disregarded in 85% the studies that were included. The percentage of RQS of 17 studies was lower than 30%, mainly due to the lack of model validation, whether internally or externally. Cost-effectiveness is a vital factor in incorporating a technique into everyday clinical practice (60), but the cost-effectiveness analyses were missed in all included studies.
The results of quality assessment according to improved QUADAS-2 showed that the high risk of bias was found in patient selection and index test, while the unclear risk of bias was found in flow and timing. For instance, some studies (29, 38, 40) excluded the small lesions for texture analysis, leading to the high risk of bias in the domain of patient selection. As a result of the growing utilization of lung cancer screenings, there is a higher probability of early detection for small lesions. Sixteen studies were deemed to have a low risk of bias in the four domain and low concerns regarding applicability. These studies also exhibited the percentage of RQS exceeding 30%. The agreement analysis findings for RQS and QUADAS-2 demonstrated the dependability of the quality assessment outcomes of the included studies.
CT is the most commonly used examination of the chest. In the present study, 65% (26/40) radiomics studies were based on CT images and 27.5% (11/40) with sufficient data were included in the meta-analysis. The results of the sensitivity analysis indicated the robustness of the diagnostic performance of radiomics model based on CT images, with sensitivity ranging from 0.81 to 0.78, specificity from 0.87 to 0.85, and SROC-AUC from 0.87 to 0.86, after the removal of two outlier studies. In subgroup analysis, the radiomics models incorporating non-radiomics features exhibited superior performance compared to those that did not include them. Non-radiomics features such as clinical, genetic and metabolic data can assist the histological classification of the lesions. However, the heterogeneity remained significant. Non-radiomics features could not explain the heterogeneity.
The pooled diagnostic effect sizes of radiomics models were the best based on PET-CT images. That PET-CT modality provided the anatomical and metabolic information of the tumors might be the reason. When the outlier study was omitted, the SROC-AUC of models based on PET-CT images was decreased from 0.93 to 0.86, which was equivalent to that of CT. Meanwhile, the heterogeneity among studies decreased significantly, which indicated the omitted study might be one of the sources of heterogeneity. The model in the omitted study with the highest sensitivity and specificity included radiomics features and color features. While the classification model of other studies in this meta-analysis did not incorporate color features, previous studies indicated that color features, in addition to texture, could be a valuable image characteristic (61, 62).
The models relying on MRI images exhibited lower classification performance compared to other models, achieving an SROC-AUC of 0.79. MRI is not a routine examination for lung cancer. Compared with CT, MRI has poorer spatial resolution, requires longer examination time and is more expensive. Nevertheless, MRI outperforms CT in cases where the lesion is located at the center or at the base/apex of the lung (56).
Despite being the initial endeavor to examine the classification performance of radiomics in distinguishing LUAD and LUSC through a systematic review of previous studies, there are still some limitations. Firstly, insufficient studies based on PET images, PET-CT images, and MRI images were included in the meta-analysis, which hindered the exploration of heterogeneity through meta-regression and subgroup analysis. In the radiomics studies based on CT images, the subgroup analysis was conducted. However, the grouped sample size might be insufficient to perform additional subgroup analyses, such as modeling method and segmentation method. Second, the heterogeneity of studies incorporated in the quantitative synthesis could arise from several aspects, including the types of scanner machines, segmentation techniques, radiomics feature extraction methods, and modeling methods. The presence of heterogeneity might decrease the dependability of our findings. As the number of studies increase, scientific data aggregation will be possible in the future. Third, other tools such as Checklist for Artificial intelligence in Medical Imaging (CLAIM) (63) and Prediction model Risk Of Bias ASsessment Tool (PROBAST) (64) can also be utilized to investigate the methodologic quality of the studies included. RQS and QUADAS-2 have limitations. Still, they are more suitable for the methodologic assessment of radiomics studies. In turn, the quality of radiomics studies can be improved if these methodological assessment tools are taken into account at the stage of study design.
To sum up, radiomics models hold potential for distinguishing between LUAD and LUSC. Nevertheless, it is crucial to conduct well-designed and powered prospective radiomics studies in order to establish their credibility in clinical application.
Statements
Data availability statement
The datasets presented in this study can be found in online repositories. The names of the repository/repositories and accession number(s) can be found in the article/Supplementary Material.
Author contributions
LS: Conceptualization, Data curation, Formal analysis, Funding acquisition, Investigation, Methodology, Validation, Writing – original draft. JZ: Data curation, Investigation, Validation, Writing – original draft. ZW: Formal analysis, Investigation, Software, Writing – original draft. HW: Funding acquisition, Investigation, Methodology, Supervision, Validation, Writing – review & editing. MS: Conceptualization, Investigation, Supervision, Writing – review & editing.
Funding
The author(s) declare financial support was received for the research, authorship, and/or publication of this article. This work was supported by Engineering Research Center of Integration and Application of Digital Learning Technology, Ministry of Education of the People’s Republic of China (No.1311016) and Research Fund of Nantong University Medical School (No.TDYX2022010).
Conflict of interest
The authors declare that the research was conducted in the absence of any commercial or financial relationships that could be construed as a potential conflict of interest.
Publisher’s note
All claims expressed in this article are solely those of the authors and do not necessarily represent those of their affiliated organizations, or those of the publisher, the editors and the reviewers. Any product that may be evaluated in this article, or claim that may be made by its manufacturer, is not guaranteed or endorsed by the publisher.
Supplementary material
The Supplementary Material for this article can be found online at: https://www.frontiersin.org/articles/10.3389/fonc.2024.1381217/full#supplementary-material
Supplementary Figure 1Forest plots of the pooled (A) sensitivity, (B) specificity, and (c) SROC curve for CT-based radiomics with non-radiomics features in model in distinguishing between lung adenocarcinoma and lung squamous cell carcinoma.
Supplementary Figure 2Forest plots of the pooled (A) sensitivity, (B) specificity, and (C) SROC curve for CT-based radiomics without non-radiomics features in model in distinguishing between lung adenocarcinoma and lung squamous cell carcinoma.
Supplementary Figure 3Forest plots of the pooled (A) sensitivity, (B) specificity, and (C) SROC curve for CT-based radiomics models in distinguishing between lung adenocarcinoma and lung squamous cell carcinoma excluding two outlier studies.
Supplementary Figure 4Forest plots of the pooled (A) sensitivity, (B) specificity, and (C) SROC curve for PET-CT-based radiomics models in distinguishing between lung adenocarcinoma and lung squamous cell carcinoma excluding one outlier study.
Supplementary Figure 5Sensitivity analysis of the included studies developing radiomics models in distinguishing between lung adenocarcinoma and lung squamous cell carcinoma utilizing PET images: (A) goodness of fit, (B) bivariate normality, (C) influence analysis, and (D) outlier detection.
Supplementary Figure 6Sensitivity analysis of the included studies developing radiomics models in distinguishing between lung adenocarcinoma and lung squamous cell carcinoma utilizing MRI images: (A) goodness of fit, (B) bivariate normality, (C) influence analysis, and (D) outlier detection.
References
1
Sung H Ferlay J Siegel RL Laversanne M Soerjomataram I Jemal A et al . Global cancer statistics 2020: GLOBOCAN estimates of incidence and mortality worldwide for 36 cancers in 185 countries. Ca Cancer J Clin. (2021) 71:209–49. doi: 10.3322/caac.21660
2
Relli V Trerotola M Guerra E Alberti S . Abandoning the notion of non-small cell lung cancer. Trends Mol Med. (2019) 25:585–94. doi: 10.1016/j.molmed.2019.04.012
3
Herbst RS Morgensztern D Boshoff C . The biology and management of non-small cell lung cancer. Nature. (2018) 553:446–54. doi: 10.1038/nature25183
4
Fukui T Taniguchi T Kawaguchi K Fukumoto K Nakamura S Sakao Y et al . Comparisons of the clinicopathological features and survival outcomes between lung cancer patients with adenocarcinoma and squamous cell carcinoma. Gen Thorac Cardiovasc Surg. (2015) 63:507–13. doi: 10.1007/s11748-015-0564-5
5
Wang BY Huang JY Chen HC Lin CH Lin SH Hung WH et al . The comparison between adenocarcinoma and squamous cell carcinoma in lung cancer patients. J Cancer Res Clin Oncol. (2020) 146:43–52. doi: 10.1007/s00432-019-03079-8
6
Kita N Tomita N Takaoka T Sudo S Tsuzuki Y Okazaki D et al . Comparison of recurrence patterns between adenocarcinoma and squamous cell carcinoma after stereotactic body radiotherapy for early-stage lung cancer. Cancers (Basel). (2023) 15:887. doi: 10.3390/cancers15030887
7
Bortolotto C Pinto A Brero F Messana G Cabini RF Postuma I et al . CT and MRI radiomic features of lung cancer (NSCLC): comparison and software consistency. Eur Radiol Exp. (2024) 8:71. doi: 10.1186/s41747-024-00468-8
8
Owens C Hindocha S Lee R Millard T Sharma B . The lung cancers: staging and response, CT, 18F-FDG PET/CT, MRI, DWI: review and new perspectives. Br J Radiol. (2023) 96:20220339. doi: 10.1259/bjr.20220339
9
Lambin P Leijenaar RTH Deist TM Peerlings J de Jong EEC van Timmeren J et al . Radiomics: the bridge between medical imaging and personalized medicine. Nat Rev Clin Oncol. (2017) 14:749–62. doi: 10.1038/nrclinonc.2017.141
10
Cao Y Zhong X Diao W Mu J Cheng Y Jia Z . Radiomics in differentiated thyroid cancer and nodules: explorations, application, and limitations. Cancers (Basel). (2021) 13:2436. doi: 10.3390/cancers13102436
11
Tortora M Gemini L Scaravilli A Ugga L Ponsiglione A Stanzione A et al . Radiomics applications in head and neck tumor imaging: A narrative review. Cancers (Basel). (2023) 15:1174. doi: 10.3390/cancers15041174
12
Jiang Y Chen C Xie J Wang W Zha X Lv W et al . Radiomics signature of computed tomography imaging for prediction of survival and chemotherapeutic benefits in gastric cancer. EBioMedicine. (2018) 36:171–82. doi: 10.1016/j.ebiom.2018.09.007
13
Quraishi MI . Radiomics-guided precision medicine approaches for colorectal cancer. Front Oncol. (2022) 12:872656. doi: 10.3389/fonc.2022.872656
14
Page MJ McKenzie JE Bossuyt PM Boutron I Hoffmann TC Mulrow CD et al . The PRISMA 2020 statement: an updated guideline for reporting systematic reviews. Bmj. (2021) 372:n71. doi: 10.1136/bmj.n71
15
Whiting PF Rutjes AW Westwood ME Mallett S Deeks JJ Reitsma JB et al . QUADAS-2: a revised tool for the quality assessment of diagnostic accuracy studies. Ann Intern Med. (2011) 155:529–36. doi: 10.7326/0003-4819-155-8-201110180-00009
16
Zhong J Hu Y Xing Y Ge X Ding D Zhang H et al . A systematic review of radiomics in pancreatitis: applying the evidence level rating tool for promoting clinical transferability. Insights Imaging. (2022) 13:139. doi: 10.1186/s13244-022-01279-4
17
Marasini D Quatto P Ripamonti E . Assessing the inter-rater agreement for ordinal data through weighted indexes. Stat Methods Med Res. (2016) 25:2611–33. doi: 10.1177/0962280214529560
18
Koo TK Li MY . A guideline of selecting and reporting intraclass correlation coefficients for reliability research. J Chiropr Med. (2016) 15:155–63. doi: 10.1016/j.jcm.2016.02.012
19
Basu S Hall LO Goldgof DB Gu YH Kumar V Choi J et al . Developing a classifier model for lung tumors in ct-scan images. in: 2011 IEEE International conference on systems, man, and cybernetics. Piscataway, NJ: IEEE (2011): 1306–12. doi: 10.1109/ICSMC.2011.6083840
20
Wu W Parmar C Grossmann P Quackenbush J Lambin P Bussink J et al . Exploratory study to identify radiomics classifiers for lung cancer histology. Front Oncol. (2016) 6:71. doi: 10.3389/fonc.2016.00071
21
Yu DD Zang YL Dong D Zhou M Gevaert O Fang MJ et al . Developing a radiomics framework for classifying non-small cell lung carcinoma subtypes. Med Imaging 2017: Computer Aided Diagnosis (2017), 10134:1013426. doi: 10.1117/12.2253923
22
Haga A Takahashi W Aoki S Nawa K Yamashita H Abe O et al . Classification of early stage non-small cell lung cancers on computed tomographic images into histological types using radiomic features: interobserver delineation variability analysis. Radiol Phys Technol. (2018) 11:27–35. doi: 10.1007/s12194-017-0433-2
23
Sandino AA Jimenez CA Romero E . Extracting multiscale patterns for classification of non-small cell lung cancer in CT images. in Proceedings of the spie - 14th international symposium on medical information processing and analysis. (2018) 10975:109750F. doi: 10.1117/12.2513347
24
Tsubakimoto M Yamashiro T Tamashiro Y Murayama S . Quantitative CT density histogram values and standardized uptake values of FDG-PET/CT with respiratory gating can distinguish solid adenocarcinomas from squamous cell carcinomas of the lung. Eur J Radiol. (2018) 100:108–15. doi: 10.1016/j.ejrad.2018.01.021
25
Zhu X Dong D Chen Z Fang M Zhang L Song J et al . Radiomic signature as a diagnostic factor for histologic subtype classification of non-small cell lung cancer. Eur Radiol. (2018) 28:2772–8. doi: 10.1007/s00330-017-5221-1
26
Bashir U Kawa B Siddique M Mak SM Nair A McLean E et al . Non-invasive classification of non-small cell lung cancer: A comparison between random forest models utilising radiomic and semantic features. Br J Radiol. (2019) 92:20190159. doi: 10.1259/bjr.20190159
27
Digumarthy SR Padole AM Gullo RL Sequist LV Kalra MK . Can CT radiomic analysis in NSCLC predict histology and EGFR mutation status? Med (Baltimore). (2019) 98:e13963. doi: 10.1097/MD.0000000000013963
28
E L Lu L Li L Yang H Schwartz LH Zhao B . Radiomics for classification of lung cancer histological subtypes based on nonenhanced computed tomography. Acad Radiol. (2019) 26:1245–52. doi: 10.1016/j.acra.2018.10.013
29
Liu H Jing B Han W Long Z Mo X Li H . A comparative texture analysis based on NECT and CECT images to differentiate lung adenocarcinoma from squamous cell carcinoma. J Med Syst. (2019) 43:59. doi: 10.1007/s10916-019-1175-y
30
Yamada M Arimura H Ninomiya K Soufi M . Automated classification of histological subtypes of NSCLC using support vector machines with radiomic features. in Proceedings of the spie - international forum on medical imaging in asia 2019. (2019) 11050:110500P. doi: 10.1117/12.2521511
31
Alvarez-Jimenez C Sandino AA Prasanna P Gupta A Viswanath SE Romero E . Identifying cross-scale associations between radiomic and pathomic signatures of non-small cell lung cancer subtypes: Preliminary results. Cancers. (2020) 12:3663. doi: 10.3390/cancers12123663
32
Brunese L Mercaldo F Reginelli A Santone A . Lung cancer detection and characterisation through genomic and radiomic biomarkers. in: 2020 International joint conference on neural networks. Piscataway, NJ: IEEE (2020), 4408–15. doi: 10.1109/ijcnn48605.2020.9206797
33
Han R Arjal R Dong J Jiang H Liu H Zhang D et al . Three dimensional texture analysis of noncontrast chest CT in differentiating solitary solid lung squamous cell carcinoma from adenocarcinoma and correlation to immunohistochemical markers. Thorac Cancer. (2020) 11:3099–106. doi: 10.1111/1759-7714.13592
34
Tomori Y Yamashiro T Tomita H Tsubakimoto M Ishigami K Atsumi E et al . CT radiomics analysis of lung cancers: Differentiation of squamous cell carcinoma from adenocarcinoma, a correlative study with FDG uptake. Eur J Radiol. (2020) 128:109032. doi: 10.1016/j.ejrad.2020.109032
35
Vuong D Tanadini-Lang S Wu Z Marks R Unkelbach J Hillinger S et al . Radiomics feature activation maps as a new tool for signature interpretability. Front Oncol. (2020) 10:578895. doi: 10.3389/fonc.2020.578895
36
Chaunzwa TL Hosny A Xu Y Shafer A Diao N Lanuti M et al . Deep learning classification of lung cancer histology using CT images. Sci Rep. (2021) 11:5471. doi: 10.1038/s41598-021-84630-x
37
Li H Gao L Ma H Arefan D He J Wang J et al . Radiomics-based features for prediction of histological subtypes in central lung cancer. Front Oncol. (2021) 11:658887. doi: 10.3389/fonc.2021.658887
38
Liu H Jiao Z Han W Jing B . Identifying the histologic subtypes of non-small cell lung cancer with computed tomography imaging: A comparative study of capsule net, convolutional neural network, and radiomics. Quant Imaging Med Surg. (2021) 11:2756–65. doi: 10.21037/qims-20-734
39
Marentakis P Karaiskos P Kouloulias V Kelekis N Argentos S Oikonomopoulos N et al . Lung cancer histology classification from CT images based on radiomics and deep learning models. Med Biol Eng Comput. (2021) 59:215–26. doi: 10.1007/s11517-020-02302-w
40
Chen Z Yi L Peng Z Zhou J Zhang Z Tao Y et al . Development and validation of a radiomic nomogram based on pretherapy dual-energy CT for distinguishing adenocarcinoma from squamous cell carcinoma of the lung. Front Oncol. (2022) 12:949111. doi: 10.3389/fonc.2022.949111
41
Tang X Huang H Du P Wang L Yin H Xu X . Intratumoral and peritumoral CT-based radiomics strategy reveals distinct subtypes of non-small-cell lung cancer. J Cancer Res Clin Oncol. (2022) 148:2247–60. doi: 10.1007/s00432-022-04015-z
42
Chen K Wang MN Song ZJ . Multi-task learning-based histologic subtype classification of non-small cell lung cancer. Radiol Med. (2023) 128:537–43. doi: 10.1007/s11547-023-01621-w
43
Song F Song X Feng Y Fan G Sun Y Zhang P et al . Radiomics feature analysis and model research for predicting histopathological subtypes of non-small cell lung cancer on CT images: A multi-dataset study. Med Phys. (2023) 50:4351–65. doi: 10.1002/mp.16233
44
Ha S Choi H Cheon GJ Kang KW Chung JK Kim EE et al . Autoclustering of non-small cell lung carcinoma subtypes on 18F-FDG PET using texture analysis: A preliminary result. Nucl Med Mol Imaging. (2014) 48:278–86. doi: 10.1007/s13139-014-0283-3
45
Ma Y Feng W Wu Z Liu M Zhang F Liang Z et al . Intra-tumoural heterogeneity characterization through texture and colour analysis for differentiation of non-small cell lung carcinoma subtypes. Phys Med Biol. (2018) 63:165018. doi: 10.1088/1361-6560/aad648
46
Hyun SH Ahn MS Koh YW Lee SJ . A machine-learning approach using PET-based radiomics to predict the histological subtypes of lung cancer. Clin Nucl Med. (2019) 44:956–60. doi: 10.1097/RLU.0000000000002810
47
Sha X Gong G Qiu Q Duan J Li D Yin Y . Identifying pathological subtypes of non-small-cell lung cancer by using the radiomic features of 18F-fluorodeoxyglucose positron emission computed tomography. Trans Cancer Res. (2019) 8:1741–9. doi: 10.21037/tcr.2019.08.20
48
Ayyildiz O Aydin Z Yilmaz B Karacavus S Senkaya K Icer S et al . Lung cancer subtype differentiation from positron emission tomography images. Turkish J Electrical Eng Comput Sci. (2020) 28:262–74. doi: 10.3906/elk-1810-154
49
Han Y Ma Y Wu Z Zhang F Zheng D Liu X et al . Histologic subtype classification of non-small cell lung cancer using PET/CT images. Eur J Nucl Med Mol Imaging. (2021) 48:350–60. doi: 10.1007/s00259-020-04771-5
50
Ji Y Qiu Q Fu J Cui K Chen X Xing L et al . Stage-specific PET radiomic prediction model for the histological subtype classification of non-small-cell lung cancer. Cancer Manage Res. (2021) 13:307–17. doi: 10.2147/CMAR.S287128
51
Ren C Zhang J Qi M Zhang J Zhang Y Song S et al . Machine learning based on clinico-biological features integrated 18F-FDG PET/CT radiomics for distinguishing squamous cell carcinoma from adenocarcinoma of lung. Eur J Nucl Med Mol Imaging. (2021) 48:1538–49. doi: 10.1007/s00259-020-05065-6
52
Shen H Chen L Liu K Zhao K Li J Yu L et al . A subregion-based positron emission tomography/computed tomography (PET/CT) radiomics model for the classification of non-small cell lung cancer histopathological subtypes. Quant Imaging Med Surg. (2021) 11:2918–32. doi: 10.21037/qims-20-1182
53
Zhou Y Ma XL Zhang T Wang J Zhang T Tian R . Use of radiomics based on 18F-FDG PET/CT and machine learning methods to aid clinical decision-making in the classification of solitary pulmonary lesions: an innovative approach. Eur J Nucl Med Mol Imaging. (2021) 48:2904–13. doi: 10.1007/s00259-021-05220-7
54
Zhao H Su Y Wang M Lyu Z Xu P Jiao Y et al . The machine learning model for distinguishing pathological subtypes of non-small cell lung cancer. Front Oncol. (2022) 12:875761. doi: 10.3389/fonc.2022.875761
55
Tang X Xu X Han Z Bai G Wang H Liu Y et al . Elaboration of a multimodal MRI-based radiomics signature for the preoperative prediction of the histological subtype in patients with non-small-cell lung cancer. Biomed Eng Online. (2020) 19:5. doi: 10.1186/s12938-019-0744-0
56
Yang M Shi L Huang T Li G Shao H Shen Y et al . Value of contrast-enhanced magnetic resonance imaging-T2WI-based radiomic features in distinguishing lung adenocarcinoma from lung squamous cell carcinoma with solid components >8 mm. J Thorac Dis. (2023) 15:635–48. doi: 10.21037/jtd-23-142
57
Bębas E Borowska M Derlatka M Oczeretko E Hładuński M Szumowski P et al . Machine-learning-based classification of the histological subtype of non-small-cell lung cancer using MRI texture analysis. Biomed Signal Process Control. (2021) 66:102446. doi: 10.1016/j.bspc.2021.102446
58
Tang X Wu J Liang J Yuan C Shi F Ding Z . The value of combined PET/MRI, CT and clinical metabolic parameters in differentiating lung adenocarcinoma from squamous cell carcinoma. Front Oncol. (2022) 12:991102. doi: 10.3389/fonc.2022.991102
59
Terrin N Schmid CH Lau J . In an empirical evaluation of the funnel plot, researchers could not visually identify publication bias. J Clin Epidemiol. (2005) 58:894–901. doi: 10.1016/j.jclinepi.2005.01.006
60
Sanders GD Neumann PJ Basu A Brock DW Feeny D Krahn M et al . Recommendations for conduct, methodological practices, and reporting of cost-effectiveness analyses: second panel on cost-effectiveness in health and medicine. Jama. (2016) 316:1093–103. doi: 10.1001/jama.2016.12195
61
van der Sommen F Zinger S Curvers WL Bisschops R Pech O Weusten BL et al . Computer-aided detection of early neoplastic lesions in Barrett's esophagus. Endoscopy. (2016) 48:617–24. doi: 10.1055/s-0042-105284
62
Suman S Hussin FAB Malik AS Pogorelov K Goh KL . Detection and classification of bleeding region in WCE images using color feature. in: Proceedings of the 15th international workshop on content-based multimedia indexing. association for computing machinery. New York, NY, USA (2017). doi: 10.1145/3095713.3095731
63
Mongan J Moy L Kahn CE Jr. Checklist for artificial intelligence in medical imaging (CLAIM): A guide for authors and reviewers. Radiol Artif Intell. (2020) 2:e200029. doi: 10.1148/ryai.2020200029
64
Moons KGM Wolff RF Riley RD Whiting PF Westwood M Collins GS et al . PROBAST: A tool to assess risk of bias and applicability of prediction model studies: explanation and elaboration. Ann Intern Med. (2019) 170:W1–w33. doi: 10.7326/M18-1377
Summary
Keywords
radiomics, lung adenocarcinoma, lung squamous cell carcinoma, texture analysis, computed tomography, positron emission tomography, magnetic resonance imaging
Citation
Shi L, Zhao J, Wei Z, Wu H and Sheng M (2024) Radiomics in distinguishing between lung adenocarcinoma and lung squamous cell carcinoma: a systematic review and meta-analysis. Front. Oncol. 14:1381217. doi: 10.3389/fonc.2024.1381217
Received
09 February 2024
Accepted
05 September 2024
Published
24 September 2024
Volume
14 - 2024
Edited by
Salvatore Claudio Fanni, University of Pisa, Italy
Reviewed by
Lorenzo Faggioni, University of Pisa, Italy
Lorenzo Tumminello, University of Pisa, in collaboration with reviewer LF
Yuwei Zhou, University of Rochester Medical Center, United States
Updates
Copyright
© 2024 Shi, Zhao, Wei, Wu and Sheng.
This is an open-access article distributed under the terms of the Creative Commons Attribution License (CC BY). The use, distribution or reproduction in other forums is permitted, provided the original author(s) and the copyright owner(s) are credited and that the original publication in this journal is cited, in accordance with accepted academic practice. No use, distribution or reproduction is permitted which does not comply with these terms.
*Correspondence: Huiqun Wu, huiqun2001@gmail.com; Meihong Sheng, 5300198@ntu.edu.cn
†These authors have contributed equally to this work
Disclaimer
All claims expressed in this article are solely those of the authors and do not necessarily represent those of their affiliated organizations, or those of the publisher, the editors and the reviewers. Any product that may be evaluated in this article or claim that may be made by its manufacturer is not guaranteed or endorsed by the publisher.