 P. Connor Johnson1†Abigail Bailey2†Qiufei Ma3†Neil Milloy2†
 Jake Butcher2*†Isaac Sanderson2†Sarah Weatherby2†Rachael Meadows2†Ruben G. W. Quek3†
- 1Cancer Center, Massachusetts General Hospital, Boston, MA, United States
- 2Adelphi Real World, Bollington, United Kingdom
- 3Health Economics and Outcomes Research, Regeneron Pharmaceuticals Inc., Tarrytown, NY, United States
Background: Real-world health-related quality of life (HRQoL) data in patients with diffuse large B-cell lymphoma (DLBCL) are scarce. This study is to compare patient-reported outcomes in patients with DLBCL across therapy lines and countries.
Methods: Data were derived from the Adelphi DLBCL Disease Specific Programme™ from January 2021 to May 2021, a survey of physicians and their DLBCL patients in France, Germany, Italy, Spain, United Kingdom (UK), and the United States (US).
Results: Overall, analysis was conducted on 441 patients with DLBCL across Europe and the US (mean age 64.6 years, 64% male); 68% had an Ann Arbor stage III and 69% had an Eastern Cooperative Oncology Group Performance Status of 0 to 1. The mean overall GHS/QoL was 54.1; patients on their 3L+ therapy had a lower mean GHS/QoL compared with patients on 1L/2L (P = 0.0033). Further to this, mean EQ-5D-5L utility score was reduced from 0.73 for patients on 1L therapy to 0.66 for patients on 3L+ therapies (P = 0.0149). Mean percentages of impairment while working and overall work impairment were lower for patients receiving 3L+ therapy (12.5% and 17.7%; respectively) than those on 1L therapy (35.6% and 33.8%; respectively). When comparing region, patients in the US had significantly better scores for all functioning and symptomatic scales (per EORTC QLQ-C30) and work impairment (per WPAI) vs. patients with DLBCL in Europe. WPAI scores indicate that the overall activity impairment in the US was 36.6% and in Europe ranged from 42.4% in the UK to 54.9% in Germany. Mean EQ-5D-5L utility score for the US was 0.80, compared to 0.60 – 0.80 across the countries in Europe. Regression analysis showed patients who relapsed after more than one year of treatment were associated with better patient reported outcomes than those who relapse after less than one year.
Conclusion: Patient-reported outcomes of DLBCL patients remain poor and patients continue to experience considerable morbidity.
Lay abstract
There is little information about the effects of diffuse large B-cell lymphoma (DLBCL) and treatments on quality of life (QoL) as assessed by patients. Information from patients taken from a large real-world survey of physicians and their DLBCL patients in France, Germany, Italy, Spain, UK, and the US showed that the QoL of patients worsened in later lines of treatment, after responding poorly to the previous treatment; symptoms also increased. QoL, including ability to work, was considerably better for patients in the US than in Europe, and for patients who deteriorated in health after a period of improvement after one year on treatment than patients who relapsed before one year. DLBCL patients, especially those on their third (or more) therapy, live with considerable morbidity despite receiving treatment.
1 Introduction
Non-Hodgkin lymphoma (NHL) is ranked as the fifth to ninth common cancer among most countries globally (1) and the seventh most common cancer in the United States (US) alone, while accounting for the sixth highest mortality among cancers in the US (2). The most common NHL subtype is diffuse large B-cell lymphoma (DLBCL) that accounts for 30%–58% of total NHL (3). DLBCL has a variable prognosis, depending on age, stage, extra-nodal sites, serum lactate dehydrogenase level, performance status and response to therapy (3).
A common first-line treatment is multiagent chemo-immunotherapy, which is potentially curative (3) but carries a significant risk of toxicities and healthcare utilization (4–6). Response to initial therapy is inadequate in 30–40% of patients (7). Treatments in the relapsed/refractory setting include chimeric antigen receptor T-cell (CAR-T) therapy and salvage chemotherapy followed by autologous stem cell transplant (ASCT) (4). Both therapies are intensive treatments with potentially significant toxicities. CAR-T therapy carries risk of cytokine release syndrome and neurologic toxicity (8) and ASCT involves intensive multiagent chemotherapy and multiweek hospitalization. Moreover, many patients either are not eligible for or do not respond to these therapies, and ultimately progress and die of their disease (9–13).
Significant differences have been noted between countries in the incidence and mortality of NHL (14), but little data currently exists on how the patient experience differs between different countries. Given the differences in healthcare systems and guidelines between different countries, patients may experience their disease in significantly different ways and may have different outcomes.
Evaluation of patient-reported outcomes (PRO) contributes to more informed and individualized treatment decisions in daily clinical practice and more accurate data on the disease impact experienced by the patient (15). Routine patient-reported symptom monitoring in adults with metastatic solid tumors has been associated with improved QoL and survival (16). However, there is both a paucity of real-world PRO data in DLBCL to facilitate patient evaluation (17), in spite of the toxicities associated with available therapies and associated potential for impaired quality of life (QoL). Notably, despite there being several novel therapies in development or in late-stage clinical testing, there is a lack of comprehensive PRO data that could help clinicians understand where unmet needs exist and guide treatment discussions.
To address this lack of data, this analysis of data from a multinational real-world clinical population aimed to explore the impact of DLBCL on patient QoL across the US and five European countries, in order to investigate the line of treatment effects and potential differences across countries.
2 Materials and methods
2.1 Survey design
Real-world data was drawn from the Adelphi DLBCL Disease Specific Programme (DSP)™ database, a multinational, cross-sectional survey with elements of retrospective data analysis of physicians and their adult patients conducted in the US and five European countries (France, Germany, Italy, Spain, and the UK), conducted between January 2021 and May 2021. The survey was comprised of an online physician survey, and online medical record data abstraction patient record form completed by physicians, and a voluntary patient self-completion form. Physicians and their patients were recruited from a geographically diverse sample on a voluntary basis. The DSP methodology has been previously published and validated (18–22) and surveys have been implemented globally across many different disease areas.
Physicians involved with the management and treatment of patients with DLBCL were requested to complete surveys on up to six consecutive consulting patients with DLBCL who met the patient eligibility criteria. The six patients included one patient on first-line therapy (1L), three patients on second-line therapy (2L), and two patients on third-line therapy and beyond (3L+) or receiving best supportive care following 2L therapy.
Physicians could only report data they had on hand at the time of the consultation, thus representing the available evidence they have when making routine clinical treatment and other management decisions. Data included patient demographics and clinical characteristics, treatment patterns, and clinical outcomes.
2.1.1 Physicians
Physicians were eligible to participate in this survey if they were medical oncologists, hematologists or hem-oncologists. Physicians had to be personally responsible for treatment decisions and management of patients with DLBCL and make treatment decisions for at least four patients with DLBCL in a typical month.
2.1.2 Patients
Patients were recruited on a voluntary basis by their physicians. Patients were eligible for inclusion if they were over the age of 18 years at the time of data collection, had a physician-confirmed diagnosis of DLBCL, and were receiving active drug treatment for DLBCL at time of data collection or receiving best supportive care after completing 2L drug treatment. Patients were excluded if they were participating in a clinical trial. Steroid monotherapy was not considered to be an active drug treatment.
Patients were invited to complete a patient self-completion form detailing their perspective on patient demographics, current condition, patient reported outcomes, symptoms and perceptions regarding treatment. To reflect the burden of DLBCL, the patient-reported form also included questions on the emotional and physical impact of DLBCL using the EuroQol EQ-5D questionnaire (EQ-5D-5L) (1). Disease specific QoL was assessed using the EORTC QLQ-C30 questionnaire (23–26). Patient impairment was assessed by asking patients to assess the impact of DLBCL on their work and general activity with the Work Productivity and Activity Impairment questionnaire (WPAI) (27).
2.2 Survey measures
The EORTC QLQ-C30 questionnaire comprises a global health status (GHS)/HRQoL scale, five functional scales (physical, role, emotional, cognitive, and social functioning), eight symptom scales (fatigue, nausea/vomiting, pain, dyspnea, insomnia, appetite loss, constipation, and diarrhea) and a financial difficulties scale. Scale scores are linearly converted to range from 0 to 100. For the functioning and GHS/HRQoL scales, higher scores indicate better functioning; for the symptom and financial difficulties scales, higher scores indicate worse symptom burden and greater financial difficulties, respectively (24, 25).
The EQ-5D-5L (1) comprises five dimensions, including mobility, self-care, usual activities, pain/discomfort, and anxiety/depression, to assess health status and produce a utility score. The EQ-5D-5L utility score and domain scores range from -0.281 to 1.00, where higher scores indicate better QoL, and a score less than 0 indicates a QoL worse than death. The EQ visual analogue score (VAS) ranges from 0 (worst health imaginable) to 100 (best health imaginable) (1, 28). The 3L Crosswalk method was used to score the EQ-5D-5L, as this is the method recommended in the UK (29). To enable comparisons across countries, all patients were scored using this method irrespective of which country they were from.
The WPAI is a questionnaire for assessing work and activity impairments of patients. In this study, a specific health problems version of the WPAI was used to measure the specific impact of the patient’s DLBCL (27, 30). The WPAI questionnaire comprises four dimensions. Absenteeism is evaluated as percentage of work time missed due to DLBCL, with a higher percentage indicating more work time missed. Presenteeism is evaluated as percentage impairment while working due to DLBCL, with a higher percentage indicating more impairment at work due to DLBCL. Work productivity loss is evaluated as overall work impairment due to DLBCL, with a higher percentage indicating more impairment and work time missed to DLBCL. These were answered by all patients in part-time or full-time employment. The section of the WPAI on activity impairment (overall activity impairment due to DLBCL – a higher percentage indicating higher impairment carrying out normal daily activities excluding employment) was answered by patients regardless of employment status (27).
PRO outcomes were compared to an NHL reference population to better understand the impact of DLBCL relative to NHL patient populations. The reference population consists of 267 patients with NHL, of which the most common subtype of disease is DLBCL (31).
2.3 Statistical analysis
Descriptive analyses were derived using the software package IBM SPSS Data Collection Survey Reporter Version 7, while all inferential analyses were conducted using Stata v17 (32). Continuous variables were described as means and standard deviations (SD) and categorical variables were described as numbers and percentages.
Data were analyzed by country (France, Germany, Italy, Spain, UK, US) and region (Europe, US). Missing data were not imputed; therefore, the base of patients for analysis could vary from variable to variable and was reported separately for each analysis.
Validated NHL reference scores (25), which summarize patient burden for patients with NHL, were compared against the DSP patient EORTC QLQ-C30 scores using a t-test. DSP patient EQ-5D utility and EQ VAS scores were evaluated using minimally important differences (MID) assessed for patients with cancer, including lymphoma (33). The MID was 0.08 for EQ-5D UK-index scores, and 7 for EQ VAS scores.
We performed descriptive and bivariate analyses to compare PROs (EORTC QLQ-C30, EQ-5D-5L, and WPAI) across line of therapy (1L vs. 2L vs. 3L+, and 1L/2L vs. 3L+). ANOVA tests were performed to assess for differences in means between lines of therapy (1L vs. 2L vs. 3L+). Where significant differences were found, t-tests were performed to assess if differences were attributable to earlier lines compared with later lines of therapy (1L/2L vs. 3L+). Chi square tests were conducted to compare the differences in proportion of adverse events, across line of therapy (1L vs. 2L vs. 3L+). No adjustments for multiplicity were conducted.
Linear regressions were performed to assess the impact of covariates on EORTC QLQ-C30, EQ-5D-5L utility, EQ VAS, and WPAI scores. Based on their known association with outcomes in DLBCL, chosen covariates in this regression were lines of therapy (1L/2L vs. 3L+) (34), time to relapse (35), International Prognostic Index score (IPI; 0–4) (36), double exposure (has received a CD20 antibody and an alkylating agent) (37), receiving an ASCT (34), CAR-T cell therapy (38, 39) and disease state (double hit, double expressor, none of these) (40). Double hit/expressor (translocation of MYC with BCL-2 or BCL-6 rearrangement/overexpression of MYC, BCL-2 or BCL-6) and triple hit/expressor (translocation of MYC with BCL-2 and BCL-6 rearrangement/overexpression of MYC, BCL-2 and BCL-6) were all captured as individual items in the survey and grouped accordingly owing to similarities in genetic profile. Consequently, reference to the term double hit/expressor throughout the manuscript also includes triple hit/exposure definitions. The only continuous covariate in the regression models was time to relapse; the remaining covariates in the regression were all categorical. For these analyses, a p-value of <0.05 was considered statistically significant.
2.4 Ethics
This analysis used data that already exist in a secondary electronic database. Physician and patient data were pseudo-anonymized. A code was assigned when data were collected. Upon receipt by Adelphi Real World, data were pseudo-anonymized again to mitigate against tracing them back to the individual. Data were aggregated before being shared with the subscriber and/or for publication. The identity of the physicians was blinded, and no patient identifiers were collected. The study protocol was approved by the Western Institutional Review Board (Reference: AG-8980). Data were collected according to the European Pharmaceutical Marketing Research Association (EphMRA) guidelines and as such did not require Institutional Review Board/Independent Ethics Committee approval (41). Before participating, patients who provided data directly gave written informed consent using a tick box, which stated they had read and understood the conditions of the patient self-completion form; and did not provide any self-identifying data. Patient-reported forms were completed by the patient independently from their physician and returned in a sealed envelope ensuring the patient’s responses were kept confidential and ensuring future physician-patient interactions were not influenced from their physician. There was no restriction with regards to treatment received.
The DSP was performed in full accordance with relevant legislation at the time of data collection, including the Health Information Technology for Economic and Clinical Health Act legislation (42).
3 Results
All results discussed below regarding disease and symptom burden and adverse events are statistically significant (p<0.05), unless stated otherwise.
3.1 Physician and patient sample populations
A total of 239 oncologists/hematologists/hem-oncologists were recruited. Physicians completed a patient record form for a total of 1,418 eligible patients, from France, Germany, Italy, Spain, the UK, and the US. Of these patients, a total of 441 patients completed a patient self-completion form, equivalent to a 31% response rate (Table 1).
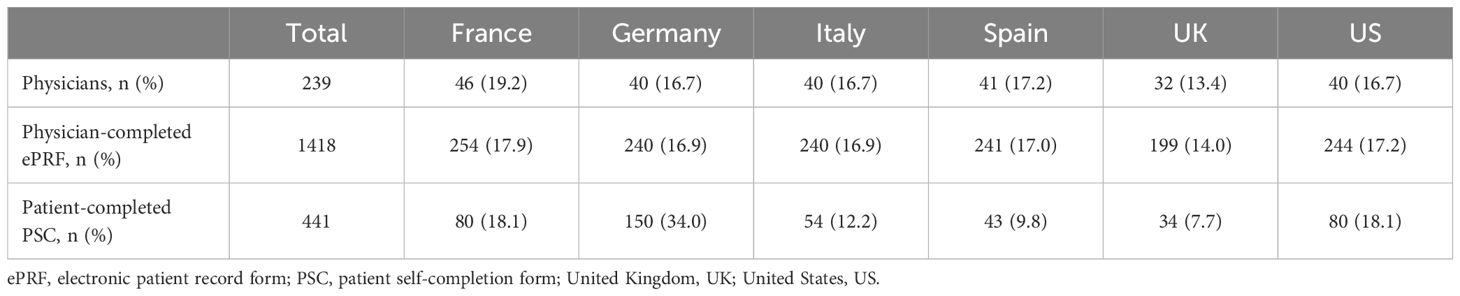
Table 1 Physician and patient sample populations.
3.2 Patient demographics and clinical characteristics
Of the 441 patients with DLBCL that completed PSCs, the mean (SD) age was 64.6 (12.0) years, 64% were male, and 19% were working full/part-time at data collection (Table 2). Patients age ranged from mean (SD) 68.0 (11.3) in France, to 60.4 (12.2) in the UK; while the mean age in the US was 62.6 years. The percentage of males in the sample was 71% in the UK, and 56% in the US. Less than one-third of European patients were working full/part-time (range: 5% Spain; 31% Italy) and ≥93% had public healthcare insurance (excluding France: a mix of public/private healthcare 61%); whereas in the US, 39% were working full/part-time and 80% had private healthcare insurance.
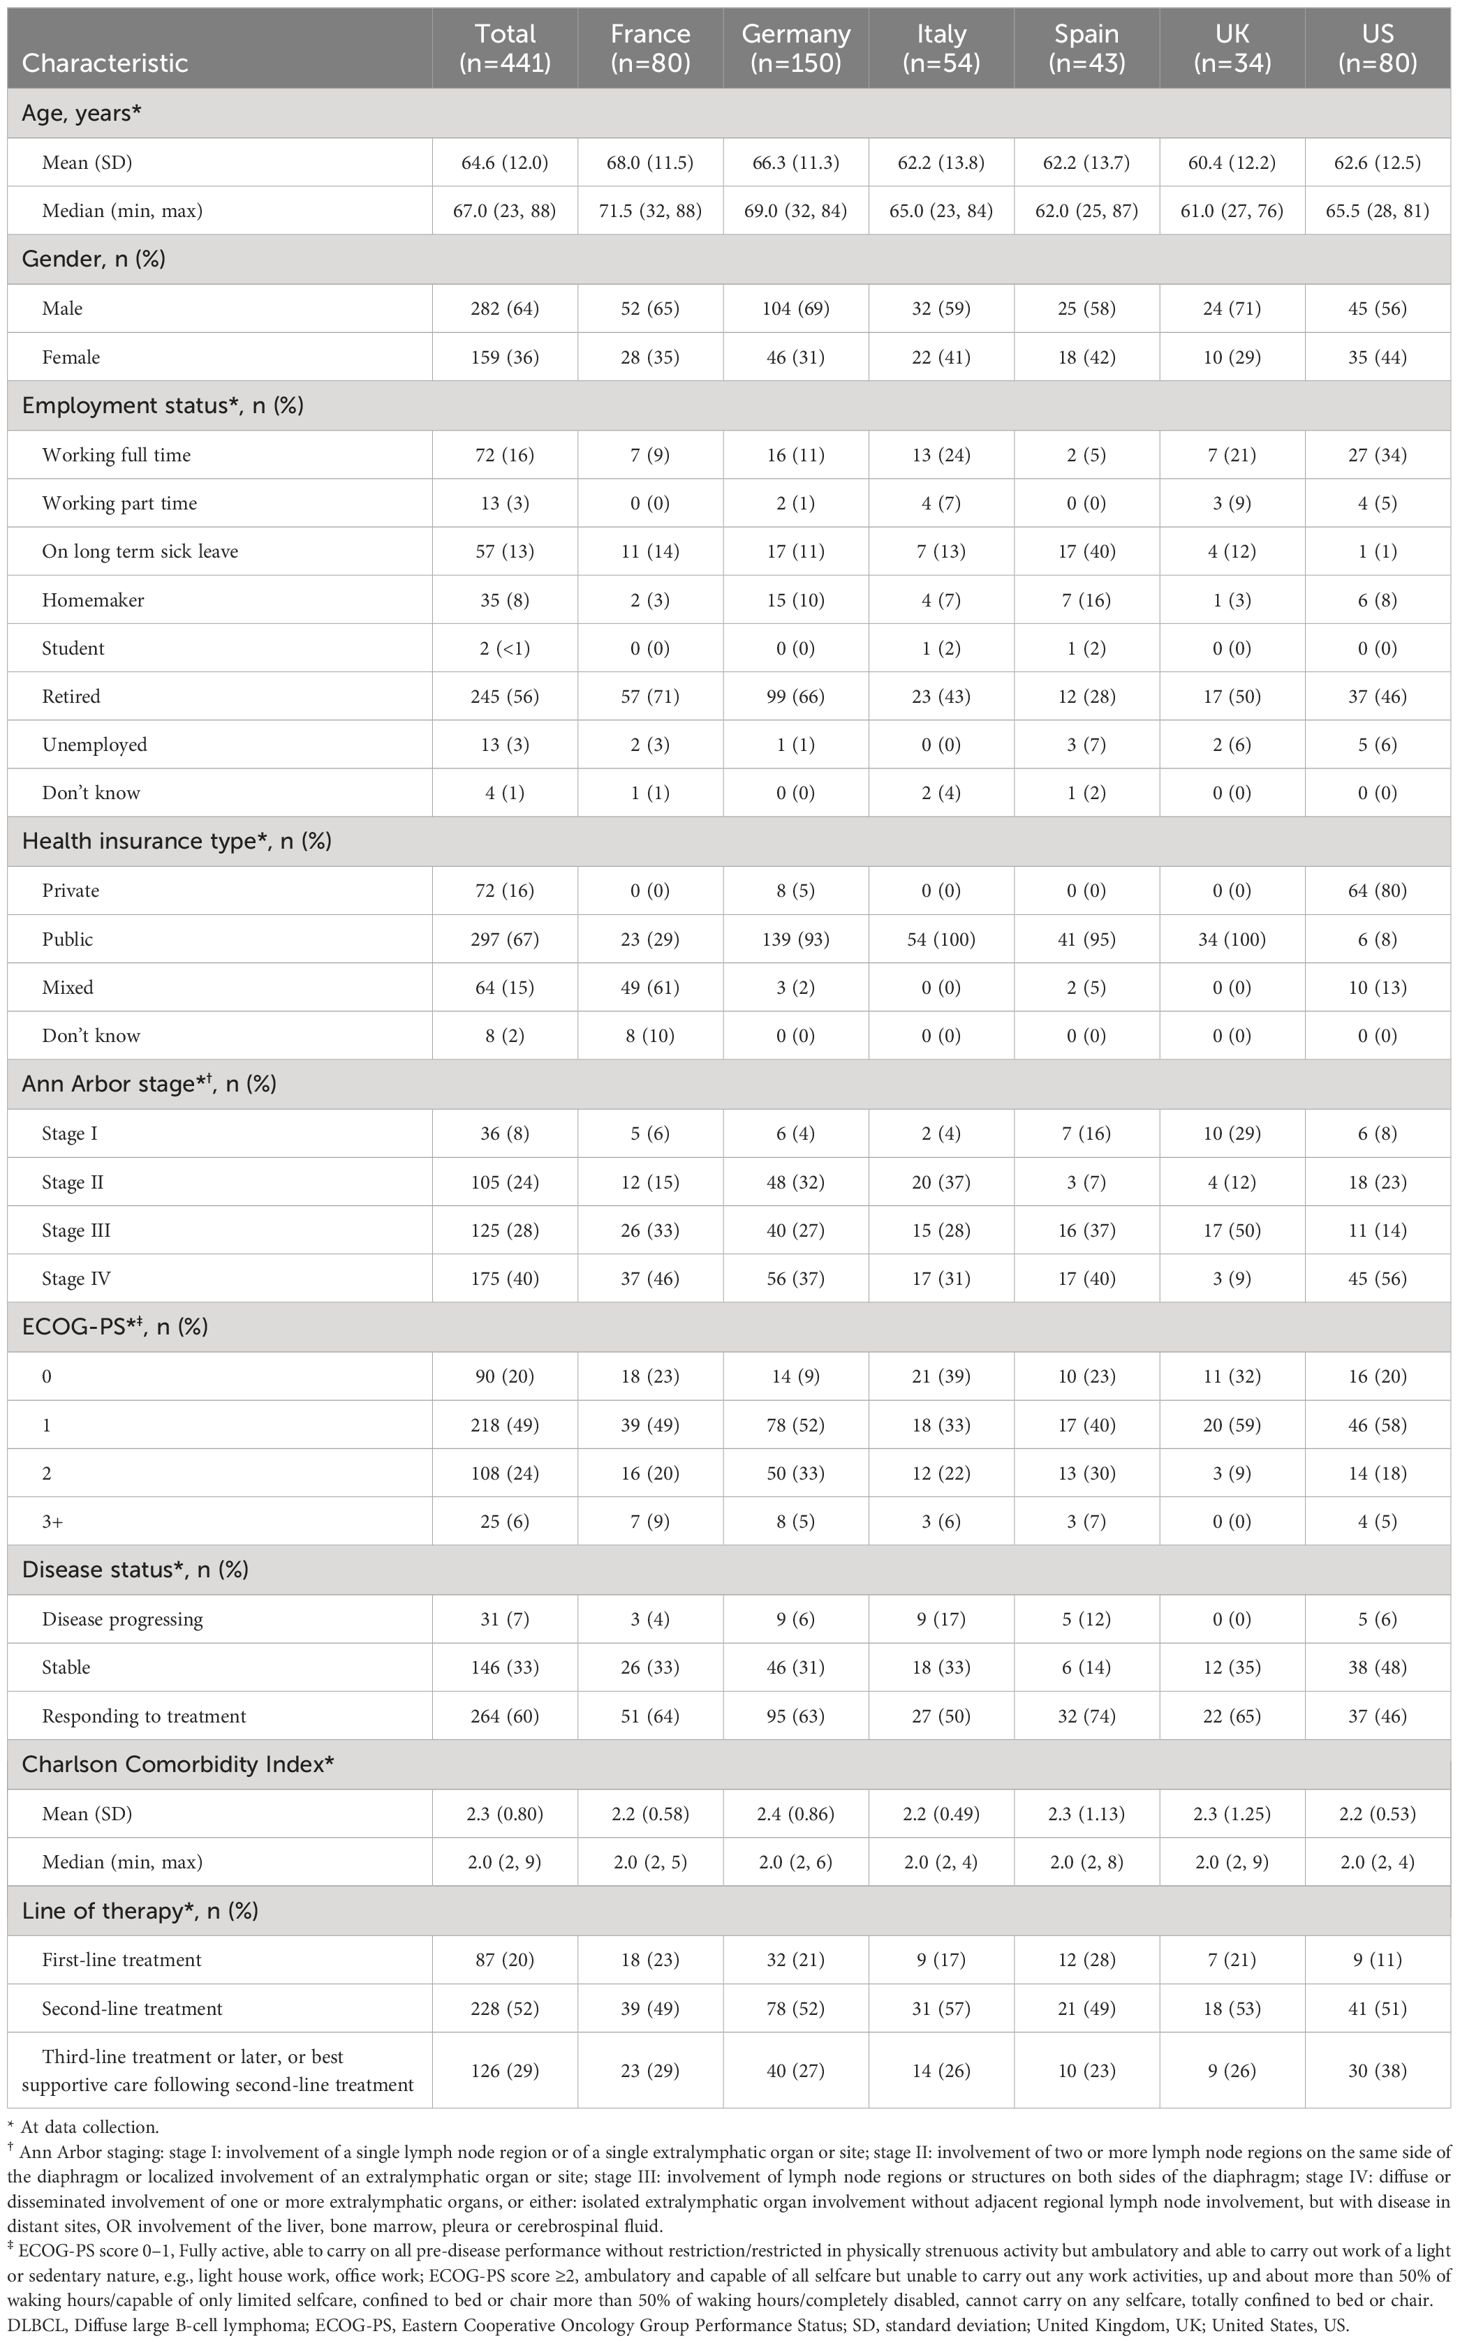
Table 2 Demographics and clinical characteristics of patients with DLBCL.
Two-thirds (68%) of patients had Ann Arbor stage III (28%) or stage IV (40%) disease and 20%, 49% and 24% of patients had an Eastern Cooperative Oncology Group Performance Status (ECOG-PS) score of 0, 1 and 2, respectively. In Europe, a variable proportion of patients had ECOG-PS scores of 0 (range: 9% Germany; 32% UK) and 2 (range: 9% UK; 33%, Germany) compared with US patients (range: 20% and 18%, respectively). Patients each had a mean Charlson comorbidity index (SD) of 2.3 (0.8). The proportion of patients with Ann Arbor stage III disease in Europe ranged from 27% in Germany to 50% in the UK and was 14% in the US. Ann Arbor stage IV disease in Europe ranged from 9% in the UK to 46% in France, and 56% in the US.
At data collection, 60% of patients were responding to treatment, 33% of patients had stable disease, and 7% had disease progression. In total the majority of all patients (52%) were receiving 2L therapy. Response to treatment was found in a greater proportion of patients in Europe (range: 50% Italy; 74% Spain) than in the US (46%). Reports of stable disease were ≤35% in Europe and 48% in the US, and disease progression was variable in Europe (range: 0% UK; 17% Italy) vs US (6%). Compared with European patients, a greater proportion of US patients were receiving 3L+ treatment (US 38%; Europe range: 23% Spain; 29% France) and correspondingly, smaller proportion were receiving 1L (11% US; Europe range: 17% Italy; 28% Spain).
3.3 Disease burden and PROs
3.3.1 EORTC DLBCL DSP vs NHL reference value mean scores for all lines of therapy combined
Mean EORTC QLQ-C30 functioning scale scores of the DSP DLBCL population were higher when compared with NHL reference values with regards to role functioning (61.7 vs. 57.3), cognitive functioning, and social functioning (64.4 vs. 60.4) (Table 3). Mean EORTC QLQ-C30 symptom scale scores were higher (i.e., worse) than NHL reference values with regard to nausea and vomiting (20.0 vs. 10.0), pain (27.3 vs. 24.5), dyspnea (25.3 vs. 16.9), appetite loss (35.3 vs. 19.9), and diarrhea (12.3 vs. 9.5).
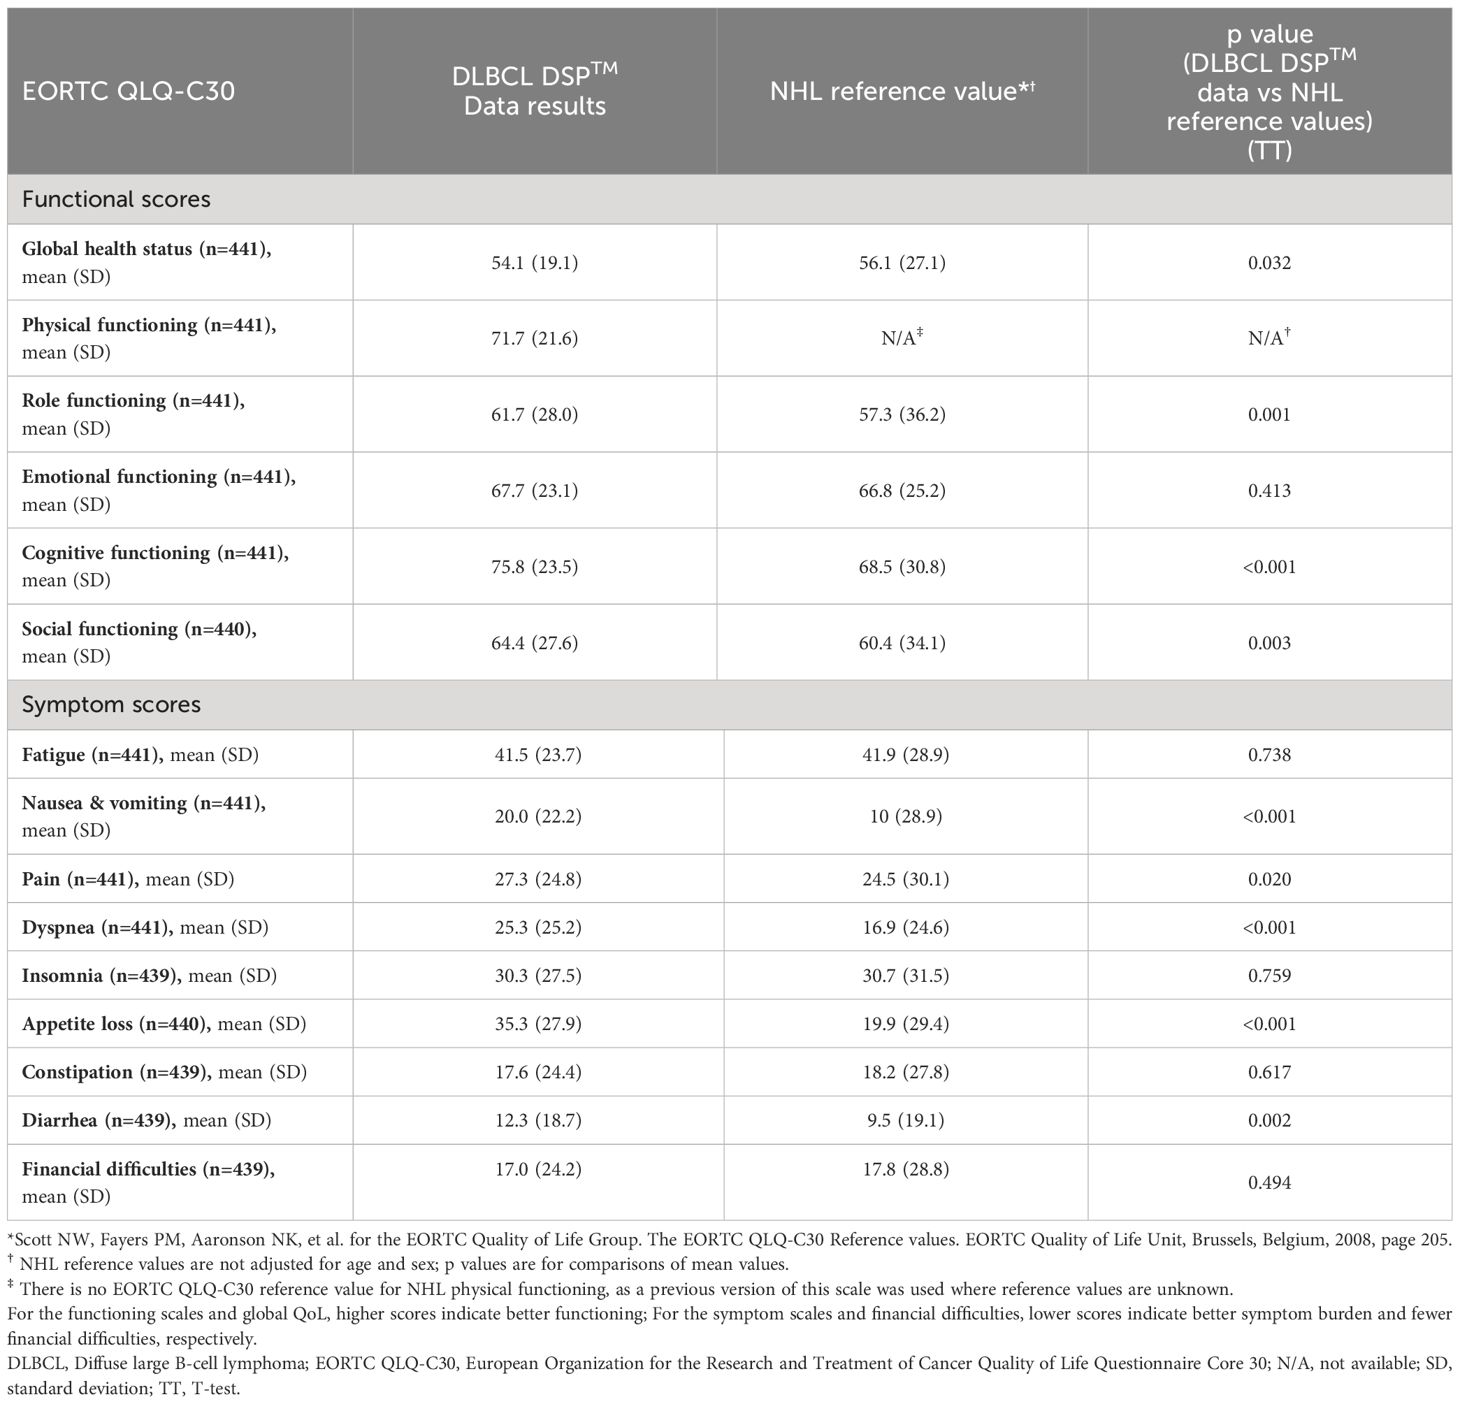
Table 3 Bivariate analysis comparing EORTC QLQ-C30 scores for patients with DLBCL vs NHL reference values*†.
Compared with NHL reference values, analysis by region showed that patients in the US had higher scores for EORTC QLQ-C30 functioning scales and lower scores for both symptom scales and financial difficulties (Table 4), while European countries scored lower for EORTC QLQ-C30 functioning scales except cognitive functioning and symptom scales. Scores for financial difficulties were lower in France and Germany, and higher in Spain and the UK compared with NHL reference values.
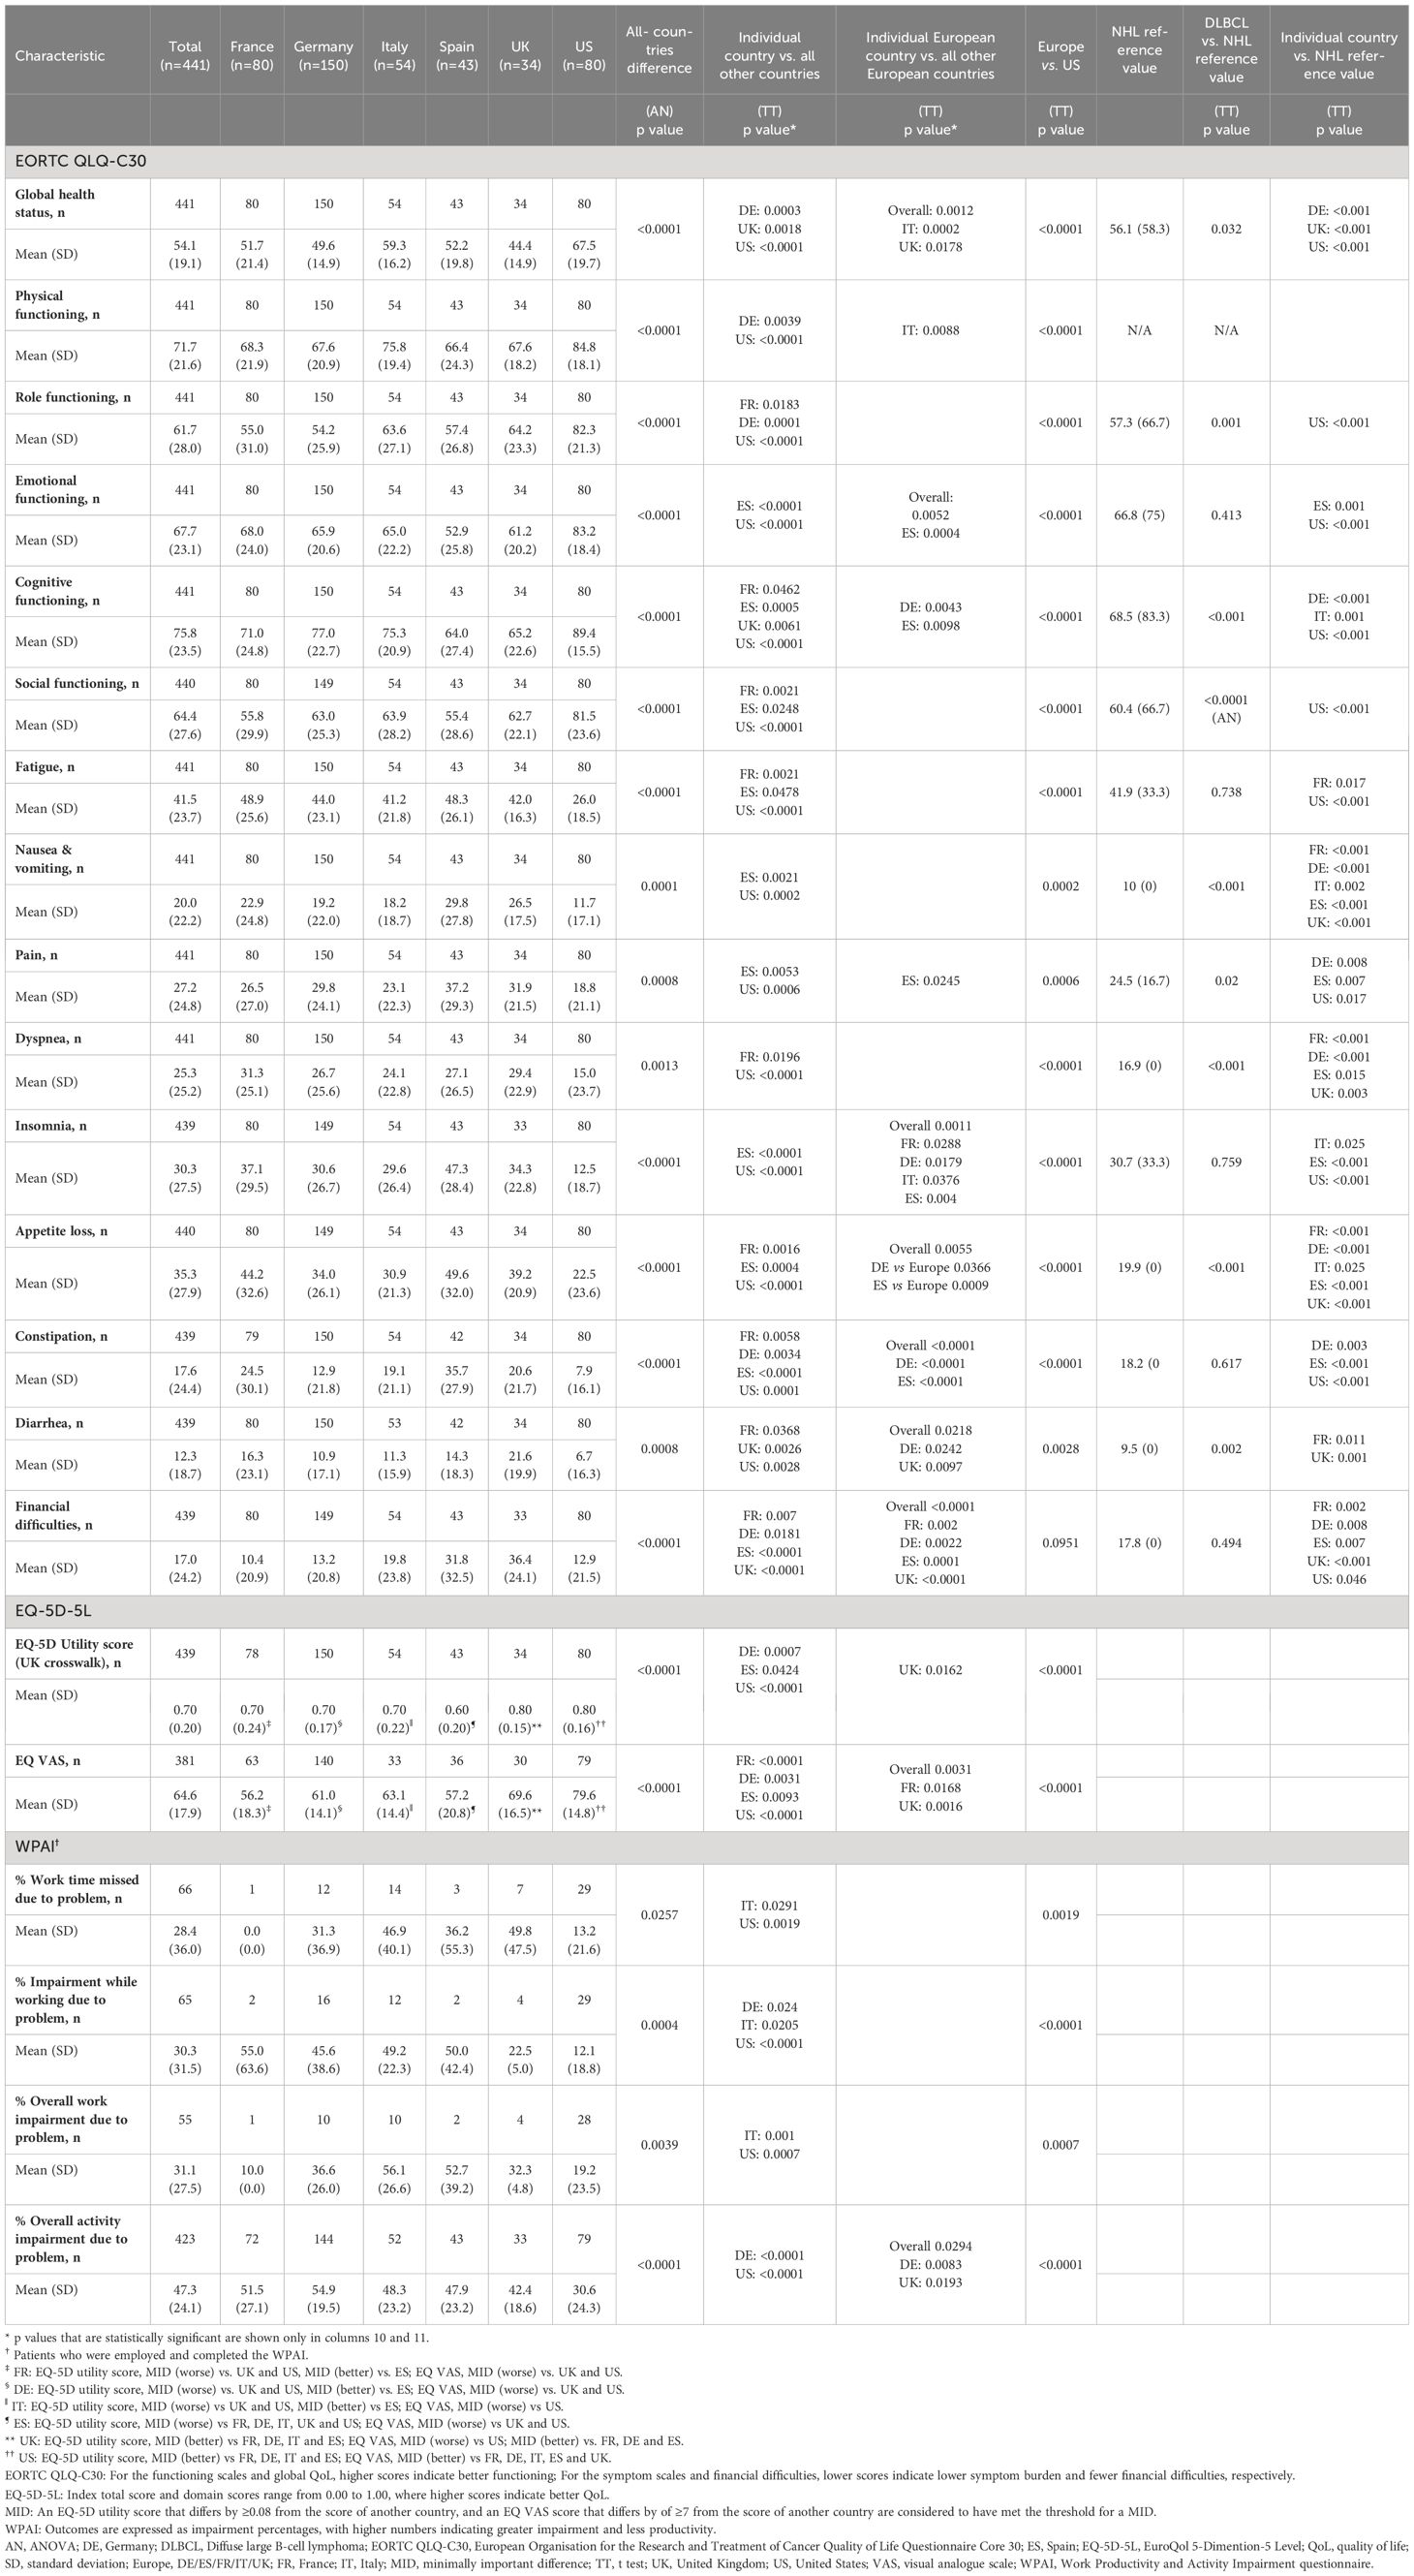
Table 4 Disease burden of patients with DLBCL, by country: bivariate analysis.
3.3.2 EORTC DLBCL DSP mean scores across lines of therapy
Relative to patients on 1L therapy, mean EORTC QLQ-C30 GHS/HRQoL (56.7 to 49.9), physical functioning (76.6 to 64.0), role functioning (62.8 to 55.3), cognitive functioning (76.3 to 70.9) and social functioning (64.6 to 58.6) scale scores were lower in patients on 3L+ therapy (Table 5). Only the emotional functioning score only did not significantly change when compared across all therapy lines, patients on 3L+ treatment scored lower in fatigue (40.4 to 47.1), dyspnea (22.2 to 33.9) and diarrhea (8.1 to 15.1) scales than patients on 1L treatment; differences across all therapy lines and between 1L/2L and 3L+ therapies were found for these three symptoms. Nausea and vomiting, pain, and financial difficulties also differed when scores were compared across all therapy lines, with worse scores observed in 3L+.
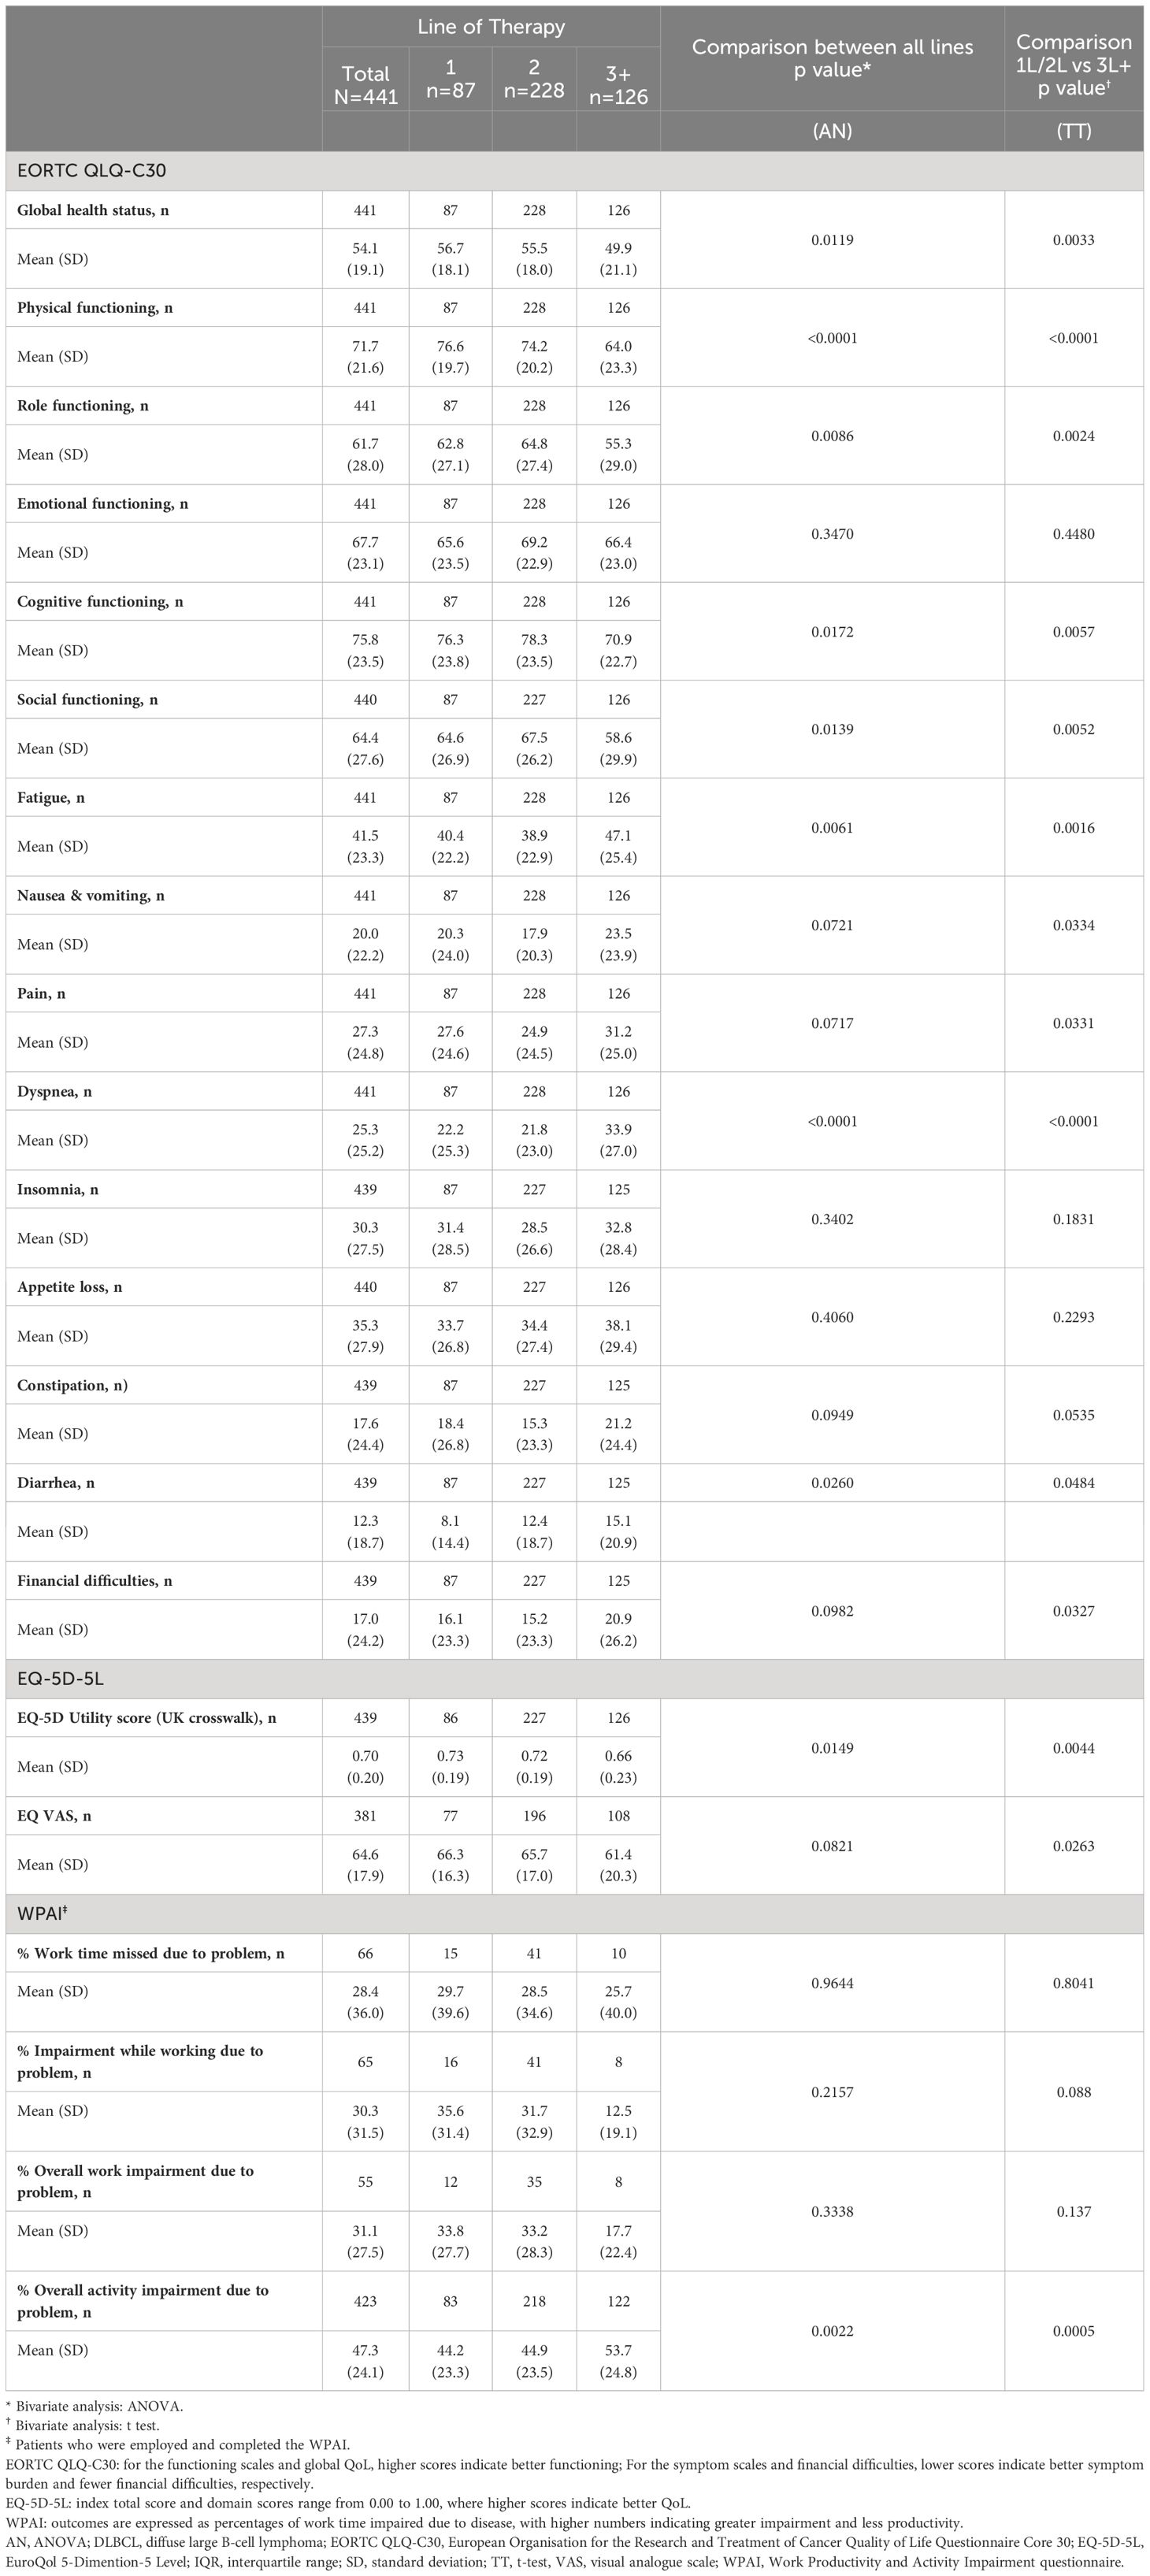
Table 5 Disease burden of patients with DLBCL, by line of therapy: bivariate analysis.
3.3.3 EORTC DLBCL DSP mean scores across country
The mean (SD) GHS/HRQoL score in the US was 67.5 (19.7) and in Europe ranged from 44.4 (14.9) in the UK to 59.3 (16.2) in Italy (Table 4). Analysis by region showed that DLBCL patients in the US had higher scores for all EORTC QLQ-C30 functioning scales and lower scores for all symptom scales than patients in European countries. The exception was for ‘financial difficulties’ where France had the lowest score of 10.4 (20.9). In Europe, functioning tended to be lowest and symptom scale scores tended to be highest for patients in Spain, whereas the opposite was true for patients in Italy. This differed significantly from the other European countries.
3.3.4 EQ-5D-5L and EQ VAS scores across lines of therapy
The mean (SD) EQ-5D-5L utility score (UK crosswalk) was 0.70 (0.20) and was reduced from 0.73 (0.19) for patients on 1L therapy to 0.66 (0.23) for patients on 3L+ (Table 5). The reductions from 1L to 3L+ in EQ-5D utility scores were reduced when comparing all three lines of therapy (1L vs. 2L vs. 3L) and between lines of therapy. Overall, mean (SD) EQ VAS score was 64.6 (17.9) and was lower in patients on 3L+ compared to patients on 1L therapy (66.3 [16.3] vs 61.4 [20.3], respectively), with the difference between 1L/2L and 3L+ being significant.
The mean (SD) EQ-5D utility score for patients in the US was 0.80 (0.16) and in Europe ranged from 0.60 (0.20) in Spain to 0.80 (0.15) in the UK (Table 4). Mean (SD) VAS score for patients in the US was 79.6 (14.8) and in Europe ranged from 56.2 (18.3) in France to 69.6 (16.5) in the UK (Table 4). Mean EQ-5D utility and VAS scores were higher for US patients compared to European patients. Mean EQ-5D utility and VAS scores were also higher for patients in the UK compared to the other European countries.
3.3.5 EQ-5D-5L and EQ VAS scores DLBCL DSP vs MID values
The UK had significantly higher EQ-5D utility scores, greater than established MIDs, than each of the other European countries, and higher EQ VAS scores for the UK than France, Germany and Spain, but lower scores than US. France, Germany and Italy each had lower EQ-5D utility scores than with the UK and US but higher than with Spain, and lower EQ VAS scores compared than the US. Spanish patients recorded lower EQ-5D utility scores than with all other European countries and the US, and lower EQ VAS scores than the UK and US.
3.3.6 WPAI scores across lines of therapy and country
Results from the WPAI assessments are presented in Table 5. Sample sizes were low (n ≤ 10) for work scores of patients on 3L+. The mean (SD) percent work time missed due to DLBCL was 28.4% (36.0%). The mean (SD) percentage impairment while working due to DLBCL was 30.3% (31.5%) and mean (SD) percentage overall work impairment due to DLBCL was 31.1% (27.5%). For patients on 3L+ therapy, mean (SD) percentages of impairment while working and overall work impairment were lower, 12.5% (19.1%) and 17.7% (22.4%), respectively, compared with 1L therapy (35.6% [31.4%] and 33.8% [27.7%]). The differences across therapy lines and between 1L + 2L and 3L+ therapies were not statistically significant. Patients had a mean (SD) percentage overall activity impairment due to DLBCL of 47.3% (24.1%), which increased from 1L (44.2%) to 3L+ (53.7%).
Generally, base numbers of patients in each European country were too low for meaningful comparison of productivity assessment. The percentages (SD) work time missed, impairment while working, and overall work impairment due to DLBCL were 13.2% (21.6%), 12.1% (18.8%), and 19.2% (23.5%) in the US vs. 31.3% (36.9%), 45.6% (38.6%), and 36.6% (26.0%) in Germany (n=10–16). The percentage (SD) overall activity impairment due to DLBCL for patients in the US was 30.6% (24.3%) and in Europe ranged from 42.4% (18.6%) in the UK to 54.9% (19.5%) in Germany (Table 4). Scores indicated that patients in Europe were more impaired in their work and activity than in the US. Activity impairment scores also indicated that UK patients were less impaired and German patients were more impaired than patients in the other European countries.
3.4 Factors associated with PROs/HRQoL
Factors found to be associated with PROs/HRQoL for patients with DLBCL by linear regression are shown in Table 6. Across all EORTC QLQ-C30 functional scales (excluding physical functioning) and EQ-5D scales, only patients who relapsed after one year on therapy had a positive co-efficient, suggesting a better QoL than patients who relapsed before one year. All other factors associated with PROs/HRQoL had a negative co-efficient, including an IPI score of three or four, DLBCL subtype (‘double hit/expressors’), those who received prior ASCT, and those who received prior CAR-T cell therapy, suggesting a worse QoL.
Table 6b. Symptom factors associated with QoL for patients with DLBCL (statistically significant factors for PRO scores).
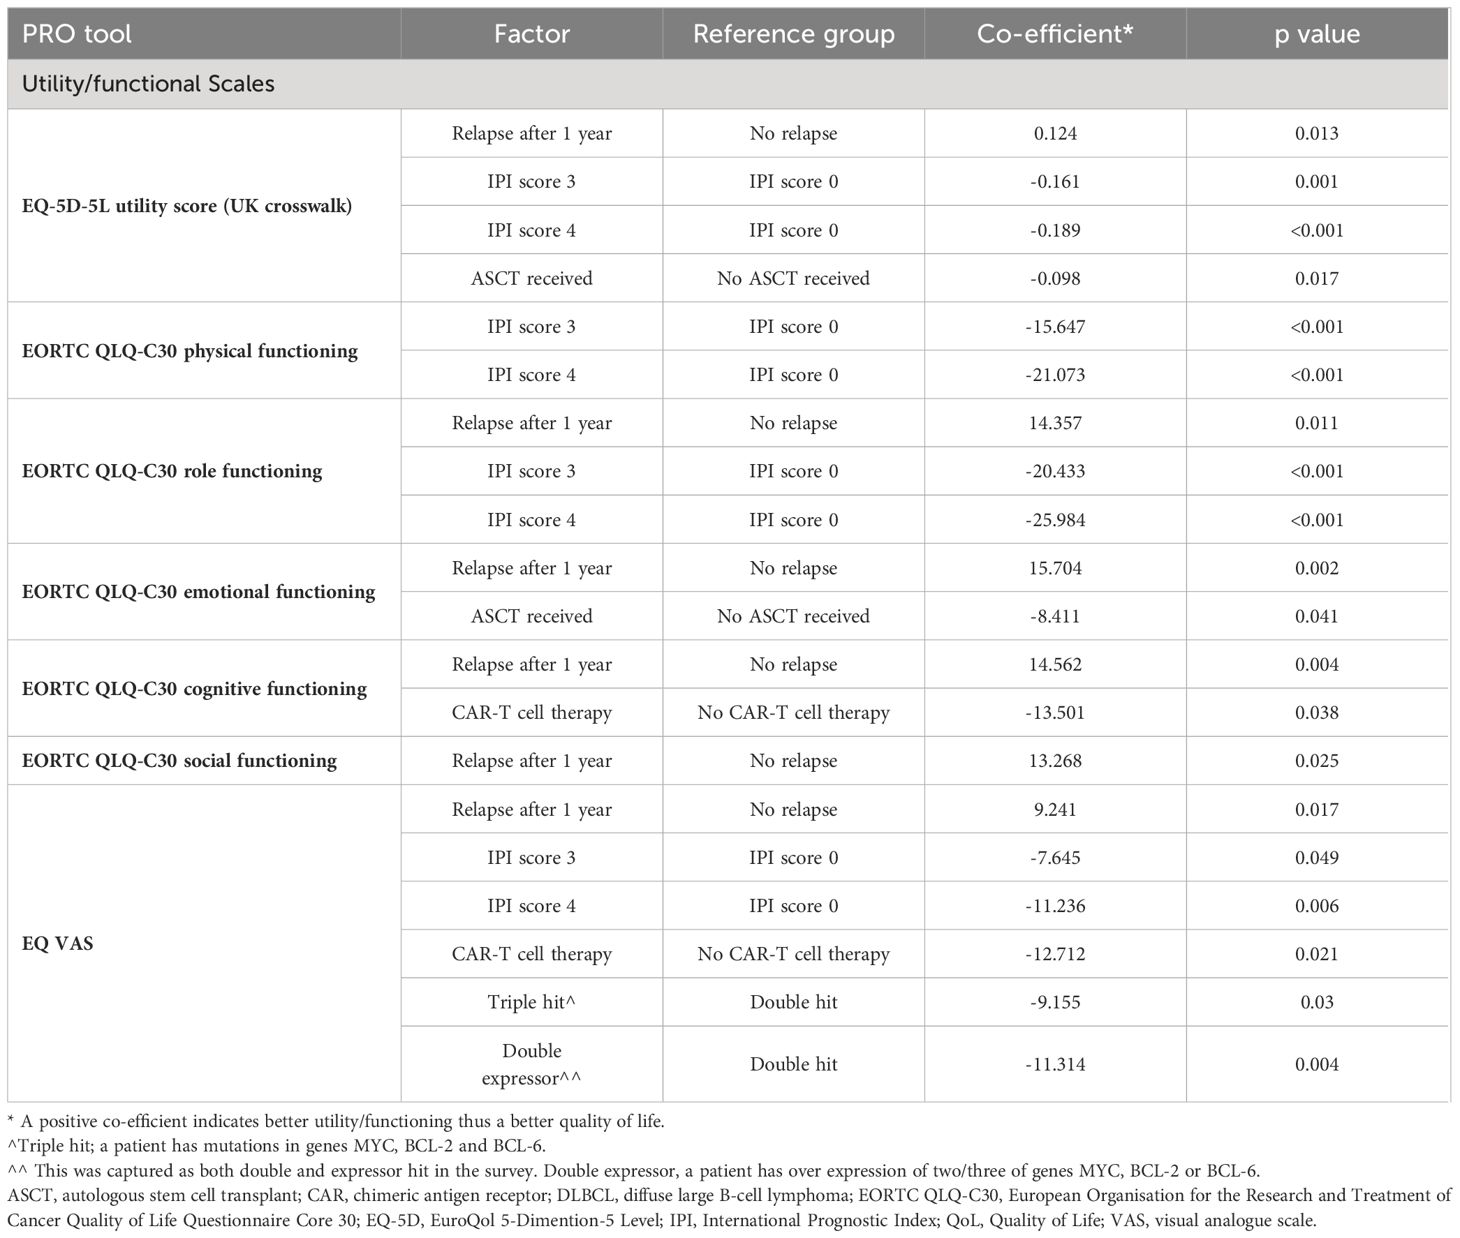
Table 6 A Utility/functioning factors associated with QoL for patients with DLBCL (statistically significant factors for PRO scores).
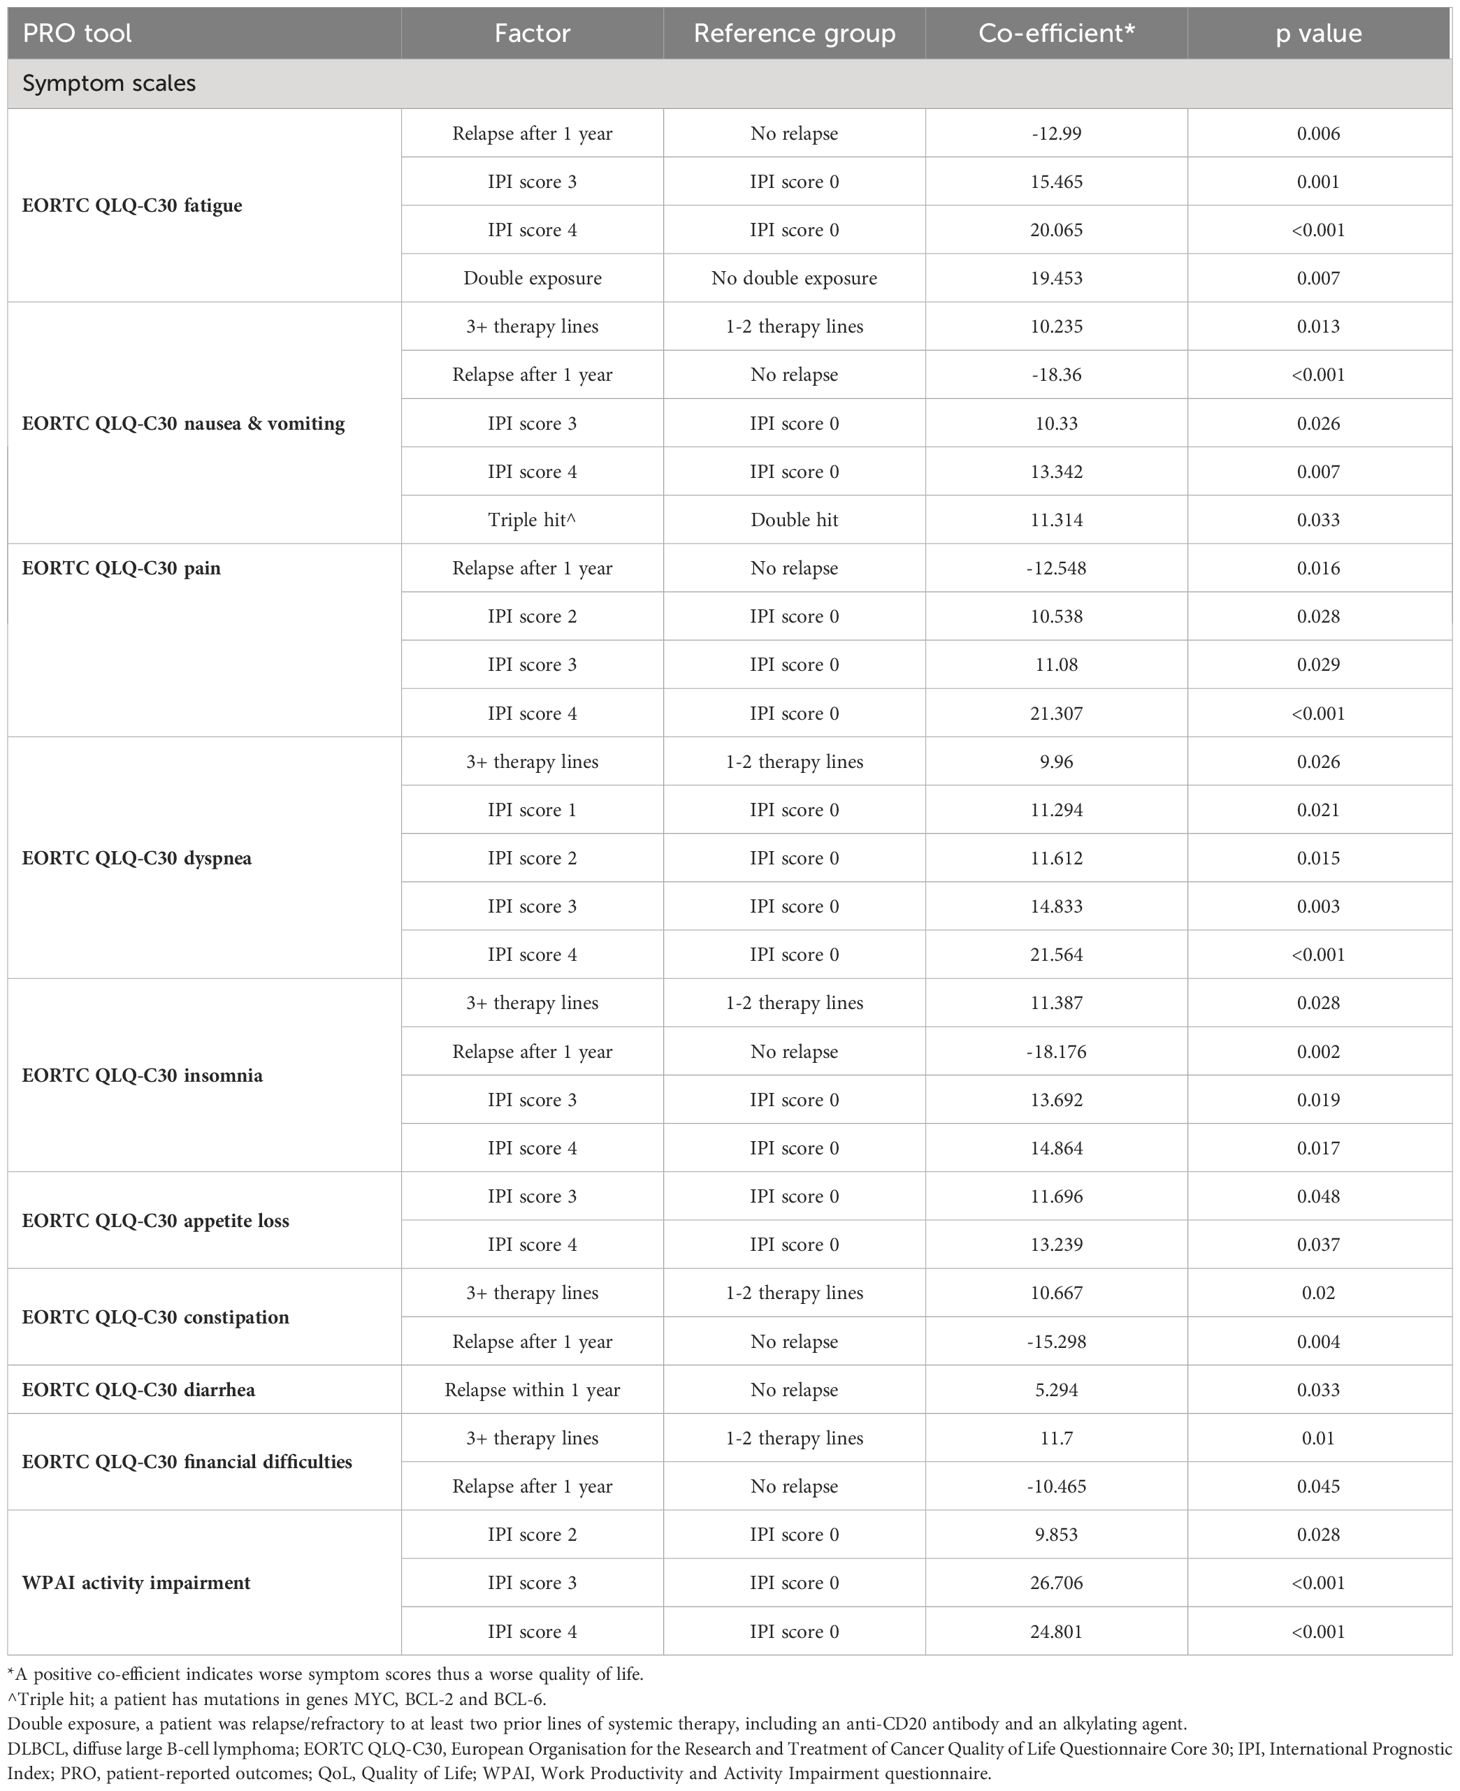
Table 6 B Symptom factors associated with QoL for patients with DLBCL (statistically significant factors for PRO scores).
Similarly, across the majority of EORTC QLQ-C30 symptom scales, only patients who relapsed after one year on therapy had a negative co-efficient, suggesting a better QoL than patients who relapsed before one year. All other factors associated with PROs/HRQoL had a positive co-efficient, including an IPI of 2, 3 or 4, DLBCL subtype (‘double hit’ lymphoma), patients on 3L+ therapy, and patients who were R/R on at least two prior lines of systemic therapy, one exception was diarrhea in patients who relapsed after one year on therapy. These patients had a positive coefficient, suggesting worse HRQoL.
3.5 Physician- and patient-reported symptom burden
Broadly speaking, physician and patient reports were consistent when reporting symptoms experienced. Overall, physicians reported that 89% of patients experienced symptoms compared with 92% of patients who reported experiencing symptoms associated with DLBCL (Table 7). Physicians (for n=441 patients) reported that the most common symptoms experienced by patients with DLBCL were fatigue (53%), loss of appetite (35%), and painless swelling in neck/armpit/stomach/groin (33%). The proportion of matched patients (n=441) reporting that they experienced fatigue was 50%, loss of appetite was 47%, painless swelling in the neck/armpit/stomach/groin was 28%, and shortness of breath was 28%. Physician and patient reports of abdominal pain (17% and 16% respectively), high temperature and fever (7% and 8% respectively) and night sweats (22% and 23% respectively) further describe the consistency across physician- and patient-reported symptoms (Figure 1).
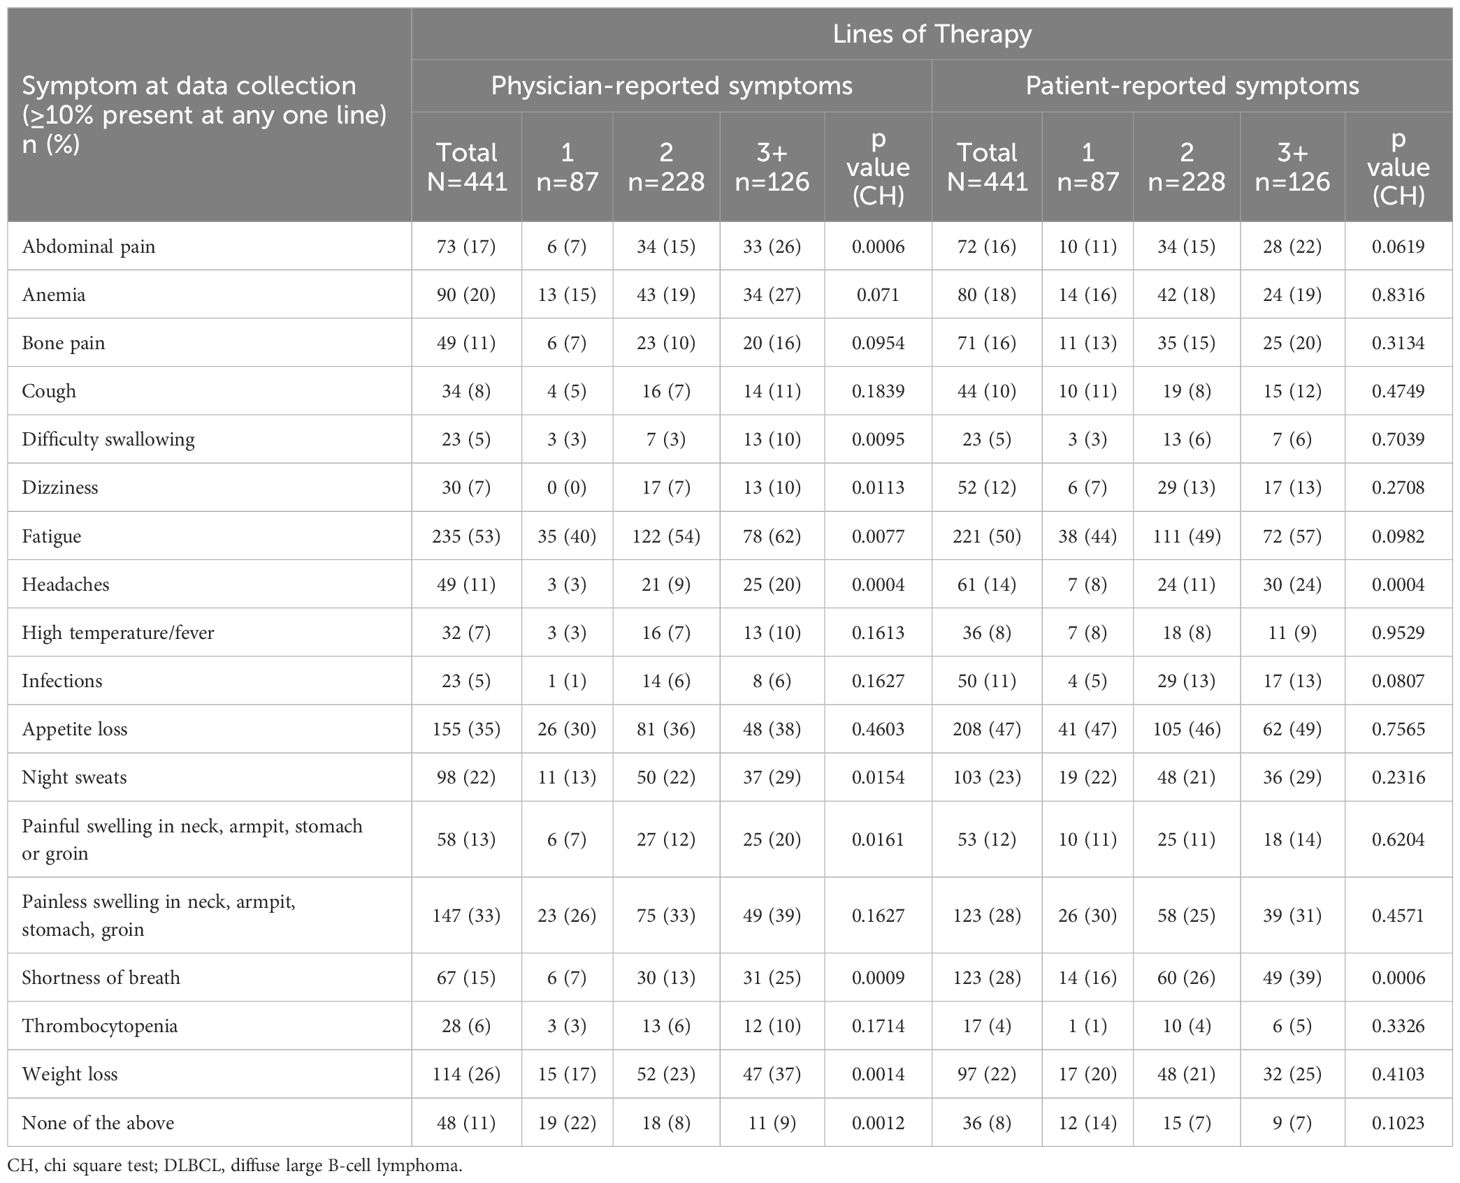
Table 7 Symptom burden of patients with DLBCL, by line of therapy.
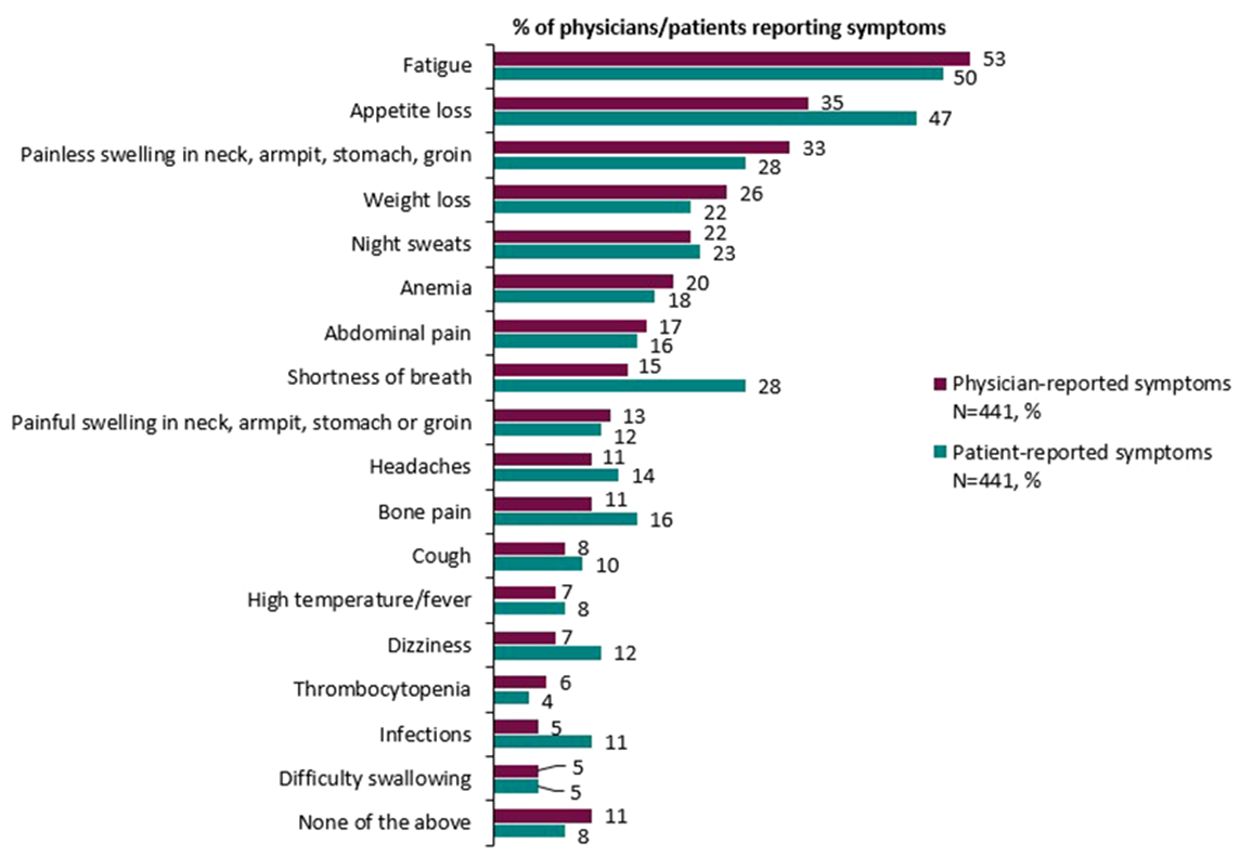
Figure 1 Overall physician- and patient-reported symptoms experienced by patients with DLBCL.
Generally, the proportion of patients reporting symptoms was higher at later treatment lines, although the magnitude of differences varied considerably. The proportion of physicians reporting patients with symptoms across therapy lines tended to be greater than the proportion of patients self-reporting symptoms. The proportion of physicians reporting that patients experienced fatigue was 40% in patients on 1L therapy compared with 62% of patients on 3L+ therapy, and the proportion of patients self-reporting fatigue non-significantly increased from 44% to 57%, respectively. The proportion of physicians reporting patients with shortness of breath increased from 7% to 25%; and the proportion of patients self-reporting this symptom increased from 16% to 39%. The proportion of physicians reporting patients with weight loss increased from 17% to 37%. There was no significant difference across treatment lines in the proportion of physicians or patients that reported appetite loss and painless swelling in the neck/armpit/stomach/groin.
3.6 Adverse events
Adverse events were physician-reported for 133 (30.2%) patients; the proportions of physicians reporting patients with fatigue was 74%, anemia 49%, appetite loss 44%, and nausea was 42% (Table 8). For those patients on 3L+ therapy, physicians reported 81%, 61%, 42% and 52% experienced fatigue, anemia, appetite loss, and nausea, respectively. Physicians reported over one-quarter of patients experiencing aches/pains, hair loss, and/or weight loss. Cytokine release syndrome was reported for 2% of patients (0%, 1%, and 6% of patients on 1L, 2L, and 3L+ therapy). Physicians reported similar proportions of patients experiencing adverse effects across therapy lines, excluding nerve damage/neuropathy that was reported for 3% of patients (0%, 1%, and 10% of patients on 1L, 2L, and 3L+ therapy). The proportion of adverse events between patients on different lines of therapy were not found to be statistically significant in any case.
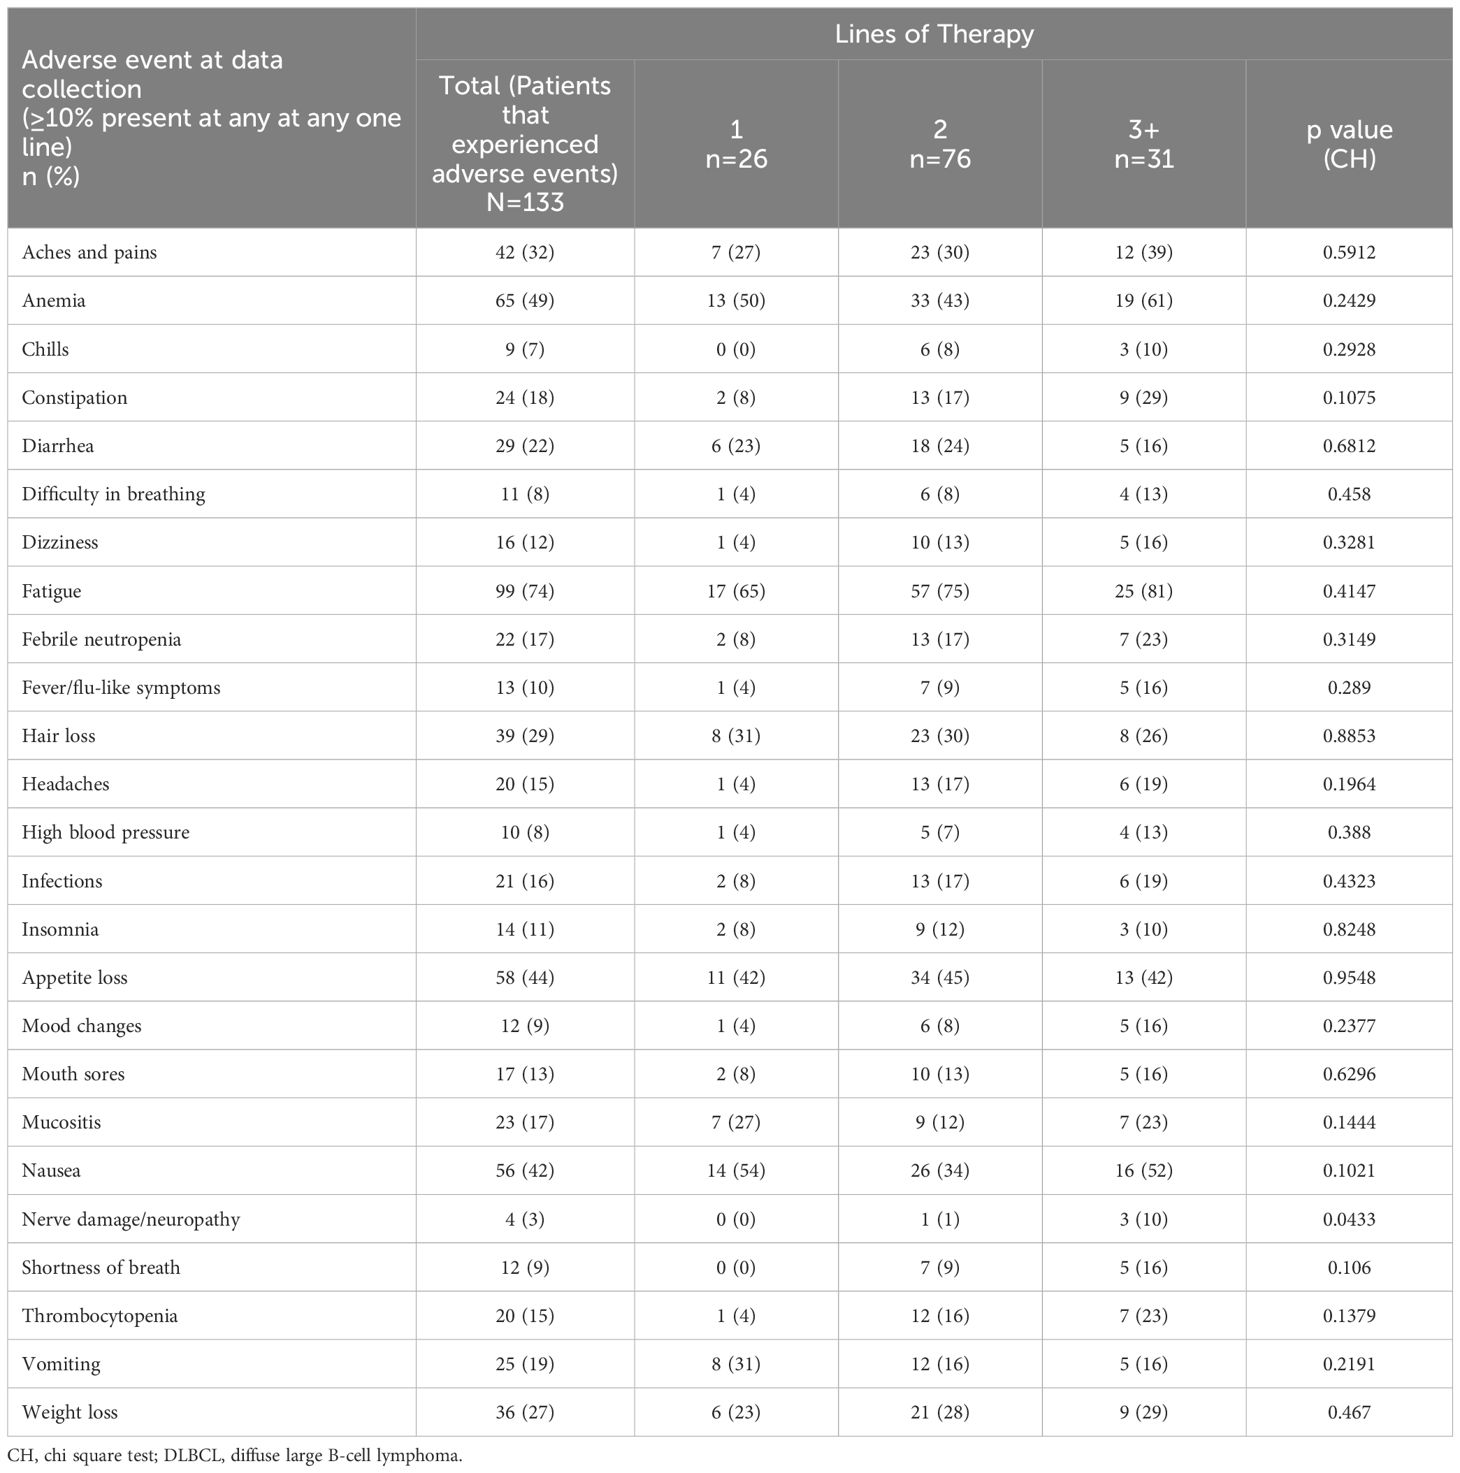
Table 8 Adverse events experienced by patients with DLBCL, by line of therapy.
4 Discussion
This real-world analysis provides a multinational survey of disease burden and PRO data from patients with DLBCL receiving 1L, 2L and 3L+ therapies. Patients with DLBCL generally presented with impairments in functioning and experienced a high symptom burden across all lines of therapy, while disease burden was significantly worse when compared with an NHL reference population with regards to PROs and symptoms. In addition, GHS/HRQoL was also worse for patients with DLBCL on 3L+ therapy than those on earlier lines of therapy, and patients on later lines of therapy experienced worse HRQoL in most functioning and symptom domains such as fatigue, dyspnea and diarrhea. These findings highlight the symptom burden and impairment in HRQoL experienced by patients with DLBCL, particularly in the 3L+ setting and highlight the unmet need for novel treatment options and better supportive care interventions to improve or slow the deterioration of GHS/HRQoL.
This analysis demonstrated that the HRQoL of patients with DLBCL varied compared to NHL reference values. GHS/HRQoL was worse for the DLBCL population but role, cognitive and social functioning were better than for the NHL reference population. Importantly, the DLBCL population experienced worse nausea and vomiting, pain, dyspnea, appetite loss, and diarrhea when compared with the NHL reference population. The findings from our DLBCL survey demonstrated that patients with DLBCL experienced worse GHS/HRQoL and a higher burden of certain symptoms than the NHL reference population, which is particularly salient given prior work demonstrating worse burden than individuals without NHL (25). A review of studies of HRQoL in patients with NHL found that the domains of HRQoL were negatively affected to varying extents in NHL survivors compared with normative populations, but the clinically important differences (according to study-defined changes in scores) for patients were physical functioning, vitality, appetite loss, and financial problems (43). Clinically important differences in GHS/HRQoL, role-physical functioning, and social functioning were infrequently reported to begin with, and have further decreased over time (43). Patients with NHL had clinically worse scores on EORTC QLQ-C30 GHS/HRQoL, physical, role, and social function, and more appetite loss before treatment compared with the age- and sex-matched normative population (44). More recently, data from the RT3 (Real-Time Tailored Therapy) study of DLBCL patients 2 years post-diagnosis found that patients had a similar overall EORTC QLQ-C30 GHS/QoL score but scores on physical, role, cognitive, and social functioning, as well as symptom scores of fatigue and dyspnea were marginally worse, within the limits of clinically important differences, compared with a French normative population (45). Since the data in this study was collected in 2021, differences in HRQoL of patients with DLBCL and the NHL reference values may be attributed to changes in treatment and its impact to HRQoL since 2008 when the NHL reference values were published. Another factor that may attribute to the differences between the two populations is that the present study looked solely into the HRQoL of patients with DLBCL, whereas the NHL reference values are based on patients with NHL. The reference values also do not specify what subtypes of NHL are included within their results. Further research should look to establish HRQoL of patients with DLBCL specifically.
To our knowledge, no previous real-world studies have investigated PROs in patients with DLBCL and made comparisons between Europe and the US. PRO measures of functioning, symptoms, work productivity and activity were better for patients in the US than for those in the individual European countries and for all European countries sampled. PROs varied across Europe, with better functioning generally experienced by those in Italy and the UK, and fewer symptoms experienced by patients in Germany. EQ-5D between-country comparisons using MIDs suggested an overall better health state for patients in the UK but worse health state for those in Spain compared with other European countries. These findings are likely due in part to the different healthcare systems operating within each country, which is reflected in the patients’ health insurance type, with healthcare being mainly private in the US, public in the UK, and mainly public in Germany, Italy and Spain (France is often a mix of public/private healthcare). These different healthcare systems may result in different treatment quality and varying degrees of inequity in patient access to treatment. Moreover, aside from differing healthcare systems, each country has individual practices and cultures that may lead to differences in patients’ QoL (46). The present study demonstrates the need to assess HRQoL in country-specific studies as well as internationally.
Similarly, to our knowledge there are no real-world studies investigating the PROs of patients with DLBCL across lines of therapy. The burden of DLBCL varied across lines of therapy, with patients on 3L+ therapy showing the greatest impairment in functioning, especially in the domains of physical, role, cognitive and social functioning. While symptom burden was high across all therapy lines, fatigue and appetite loss were reported as both symptoms and adverse events for high proportions of patients, both of which can result from the disease and its treatment (47–50). Prior work in patients with relapsed/refractory DLBCL noted impairments in HRQoL at diagnosis and after all treatments (17), with decreases in HRQoL (including on the EORTC QLQ-C30) and health utility while on first and later lines of therapy (51). Our analysis demonstrated that patients with DLBCL and receiving 3L+ therapy have a particularly high symptom burden and low QoL, underscoring an unmet need to develop novel treatments and interventions to improve the QoL/symptom burden for these patients.
Similarly, we found high rates of impairment in patient’s ability to work and overall activity using the WPAI. However, there were no statistically significant differences in work impairment across all lines and between initial and later lines of therapy, likely due to low patient numbers particularly in 1L and 3L+ therapy groups. Nonetheless, work impairment was significantly worse in European patients than in US patients. Few patients in our DLBCL population continued to work, likely because the majority had stage III/IV disease, and because they were of retirement age. Prior research examining work impairment is limited, however, the present study shows a substantial impact of DLBCL on patients’ ability to work.
We also identified several factors that were associated with worse HRQoL for patients with DLBCL, including an IPI score of two, three or four, prior ASCT, prior CAR-T cell therapy, refractoriness to at least two prior lines of systemic therapy, double exposure and double hit/expressor lymphoma. Only after one year of therapy was associated with better HRQoL, as opposed to relapsing within one year of therapy. Patients’ risk according to their IPI score played a considerable role in influencing HRQoL across the majority of functioning and symptom domains. Patients who did not relapse within a year on therapy may have more indolent disease, resulting in a lower symptom burden and therefore better HRQoL. These findings, which highlight patient factors associated with a high risk for impaired HRQoL, could help clinicians and researchers to identify patients who may benefit most from interventions and therapies aimed at improving HRQoL.
This study had several strengths. Importantly, the DSP has been published and validated in multiple separate therapy/disease areas, and matched responses provide evidence from physician and patient perspectives. By using local fieldwork agencies to advise on implementation and pilot materials, the methodology acknowledges potential cultural differences in DLBCL management, preventing obscuring of these unique perspectives in global data analysis. In addition, the DSP’s non-aligned non-interventional nature prevents placebo bias and promotes natural behavior from a large representative physician and patient sample in a real-world setting. While recall bias is a common limitation of surveys, the data were collected at the time of each patient’s appointment and physicians had access to patient medical records for extraction of historical data, potentially reducing this likelihood (52).
As with any study, this research is not without its limitations. Limitations of DSP surveys have also been previously described in other real-world studies employing DSP data (20, 53, 54).
To reduce selection bias, participation to complete the survey was voluntary, and this was the next “n” consulting DLBCL patients who met the inclusion criteria; therefore recruits may not be truly representative of the overall DLBCL population. Patient questionnaires were voluntary, and therefore patient-reported data was not available for all the patients that the physicians reported on.
Whilst our regression modelling included many covariates linked to outcomes in patients with DLBCL, we were unable to control for all possible influences such as systemic treatment received at 1L. This analysis was of data collected during the COVID-19 pandemic. QoL, particularly psychosocial well-being, was affected by the COVID-19 pandemic (55, 56) and could have influenced our findings. Moreover, missing data were not imputed, therefor the base of patients for analysis could vary between variables.
Despite such limitations, this study documents the QoL and work productivity of DLBCL patients and continues to advance the work to improve the QoL of this underserved population. Future analysis should look to compare patients with prognostic factors to those without, as to aid the discussion around the severity of disease burden in patients with DLBCL.
Despite new treatments, overall patient-reported outcomes of patients with DLBCL, particularly those who have relapsed/refractory disease and are on 3L+ therapies, still remains poor and patients continue to live with considerable morbidity. Outcomes varied significantly between countries, highlighting a need to ensure uniformity of treatment and equity of access. Our data highlights an unmet need for novel therapies and interventions to help minimize or slow the deterioration of HRQoL for patients with DLBCL.
Data availability statement
All data that support the findings of this study are the intellectual property of Adelphi Real World and so are not publicly available. Data are however available upon reasonable request and with permission of Adelphi Real World (contact amFrZS5idXRjaGVyQGFkZWxwaGlncm91cC5jb20=).
Ethics statement
The studies involving humans were approved by Western Institutional Review Board. The studies were conducted in accordance with the local legislation and institutional requirements. The participants provided their written informed consent to participate in this study.
Author contributions
PJ: Supervision, Writing – review & editing. AB: Writing – original draft, Visualization, Validation, Methodology, Data curation, Writing – review & editing. QM: Funding acquisition, Writing – review & editing. NM: Writing – original draft, Visualization, Validation, Methodology, Data curation, Writing – review & editing. JB: Validation, Writing – review & editing, Writing – original draft, Visualization, Methodology, Data curation. IS: Writing – review & editing, Writing – original draft, Visualization, Validation, Methodology, Data curation. SW: Writing – review & editing, Validation, Formal analysis. RM: Writing – review & editing, Validation, Formal analysis. RQ: Writing – review & editing, Funding acquisition.
Funding
The author(s) declare financial support was received for the research, authorship, and/or publication of this article. Data collection was undertaken by Adelphi Real World as part of an independent survey, entitled the Adelphi Real World Diffuse Large B-cell Lymphoma Disease Specific Programme. Regeneron Pharmaceuticals Inc., did not influence the original survey through either contribution to the design of questionnaires or data collection. The analysis described here used data from the Adelphi Diffuse Large B-cell Lymphoma DSP. The DSP is a wholly owned Adelphi product. Regeneron Pharmaceuticals Inc., are one of multiple subscribers to the DSP. Open access publication fees were paid by Open Health Communications and reimbursed by Regeneron Pharmaceuticals Inc.
Acknowledgments
Medical writing and editorial assistance were provided by Sue Libretto, PhD, of Sue Libretto Publications Consultant Ltd (Hertfordshire, UK) on behalf of Adelphi Real World, in accordance with Good Publication Practice (GPP3) guideline (57), funded by Regeneron Pharmaceuticals Inc.
Conflict of interest
PJ works at the Cancer Center, Massachusetts General Hospital, Boston, MA, USA, and is a consultant for AstraZeneca Plc, Seagen, and ADC Therapeutics and reports research funding from Medically Home. QM is an employee of Regeneron Pharmaceuticals Inc., Tarrytown, NY, USA, and has ownership interest in Regeneron Pharmaceuticals Inc. RQ is an employee of Regeneron Pharmaceuticals Inc., Tarrytown, NY, USA, and has ownership interest in Amgen Inc., Pfizer Inc., and Regeneron Pharmaceuticals Inc. AB, NM, IS, JB, SW and RM are employees of Adelphi Real World and were paid consultants to Regeneron Pharmaceuticals Inc., in connection with the development of this manuscript. The authors declare that this study received funding from Adelphi Real World and Regeneron Pharmaceuticals Inc. Adelphi Real World had the following involvement in the study: study design, collection, analysis, interpretation of data, writing of this article and decision to submit it for publication. Regeneron Pharmaceuticals Inc. had the following involvement in the study: writing of this article and decision to submit it for publication.
Publisher’s note
All claims expressed in this article are solely those of the authors and do not necessarily represent those of their affiliated organizations, or those of the publisher, the editors and the reviewers. Any product that may be evaluated in this article, or claim that may be made by its manufacturer, is not guaranteed or endorsed by the publisher.
Glossary
ASCT: Autologous stem cell transplant
CAR-T: chimeric antigen receptor T-cell
DLBCL: diffuse large B-cell lymphoma
DSP: Disease Specific Programme
ECOG-PS: Eastern Cooperative Oncology Group Performance Status
EphMRA: European Pharmaceutical Marketing Research Association
EQ-5D-5L: EuroQol EQ-5D questionnaire
1L: first-line therapy
GHS: global health status
GPP3: Good Publication Practice
HITECH: Health Information Technology
HRQoL: health-related quality of life
IPI: International Prognostic Index score
MID: minimally important differences
NHL: Non-Hodgkin lymphoma
PRO: patient-reported outcomes
QoL: quality of life
2L: second-line therapy
SD: standard deviations
3L+: third-line therapy and beyond
UK: United Kingdom
US: United States
VAS: visual analogue score
WPAI: Work Productivity and Activity Impairment questionnaire.
References
1. EuroQol G. EuroQol–a new facility for the measurement of health-related quality of life. Health Policy. (1990) 16:199–208. doi: 10.1016/0168-8510(90)90421-9
2. Thandra KC, Barsouk A, Saginala K, Padala SA, Barsouk A, Rawla P. Epidemiology of non-Hodgkin's lymphoma. Med Sci (Basel). (2021) 9. doi: 10.3390/medsci9010005
3. Tilly H, Gomes da Silva M, Vitolo U, Jack A, Meignan M, Lopez-Guillermo A, et al. Diffuse large B-cell lymphoma (DLBCL): ESMO Clinical Practice Guidelines for diagnosis, treatment and follow-up. Ann Oncol. (2015) 26 Suppl 5:v116–25. doi: 10.1093/annonc/mdv304
4. Susanibar-Adaniya S, Barta SK. 2021 Update on Diffuse large B cell lymphoma: A review of current data and potential applications on risk stratification and management. Am J Hematol. (2021) 96:617–29. doi: 10.1002/ajh.26151
5. Miura K, Takahashi H, Nakagawa M, Hamada T, Uchino Y, Iizuka K, et al. Ideal dose intensity of R-CHOP in diffuse large B-cell lymphoma. Expert Rev Anticancer Ther. (2022) 22:583–95. doi: 10.1080/14737140.2022.2071262
6. Yang X, Laliberte F, Germain G, Raut M, Duh MS, Sen SS, et al. Real-world characteristics, treatment patterns, health care resource use, and costs of patients with diffuse large B-cell lymphoma in the U.S. Oncologist. (2021) 26:e817–e26. doi: 10.1002/onco.13721
7. Coiffier B, Sarkozy C. Diffuse large B-cell lymphoma: R-CHOP failure-what to do? Hematol Am Soc Hematol Educ Program. (2016) 1):366–78. doi: 10.1182/asheducation-2016.1.366
8. Iacoboni G, Villacampa G, Martinez-Cibrian N, Bailen R, Lopez Corral L, Sanchez JM, et al. Real-world evidence of tisagenlecleucel for the treatment of relapsed or refractory large B-cell lymphoma. Cancer Med. (2021) 10:3214–23. doi: 10.1002/cam4.3881
9. Byrne M, Oluwole OO, Savani B, Majhail NS, Hill BT, Locke FL. Understanding and managing large B cell lymphoma relapses after chimeric antigen receptor T cell therapy. Biol Blood Marrow Transpl. (2019) 25:e344–e51. doi: 10.1016/j.bbmt.2019.06.036
10. Hopfinger G, Jager U, Worel N. CAR-T cell therapy in diffuse large B cell lymphoma: hype and hope. Hemasphere. (2019) 3:e185. doi: 10.1097/HS9.0000000000000185
11. Gisselbrecht C, Schmitz N, Mounier N, Singh Gill D, Linch DC, Trneny M, et al. Rituximab maintenance therapy after autologous stem-cell transplantation in patients with relapsed CD20(+) diffuse large B-cell lymphoma: final analysis of the collaborative trial in relapsed aggressive lymphoma. J Clin Oncol. (2012) 30:4462–9. doi: 10.1200/JCO.2012.41.9416
12. Nagle SJ, Woo K, Schuster SJ, Nasta SD, Stadtmauer E, Mick R, et al. Outcomes of patients with relapsed/refractory diffuse large B-cell lymphoma with progression of lymphoma after autologous stem cell transplantation in the rituximab era. Am J Hematol. (2013) 88:890–4. doi: 10.1002/ajh.23524
13. Rampotas A, Sangha G, Collins GP. Integration of cell therapies and bispecific antibodies into the treatment pathway of relapsed diffuse large B-cell lymphoma. Ther Adv Hematol. (2021) 12:20406207211053120. doi: 10.1177/20406207211053120
14. Huang J, Pang WS, Lok V, Zhang L, Lucero-Prisno DE 3rd, Xu W, et al. Incidence, mortality, risk factors, and trends for Hodgkin lymphoma: a global data analysis. J Hematol Oncol. (2022) 15:57. doi: 10.1186/s13045-022-01281-9
15. Efficace F, Gaidano G, Lo-Coco F. Patient-reported outcomes in hematology: is it time to focus more on them in clinical trials and hematology practice? Blood. (2017) 130:859–66. doi: 10.1182/blood-2017-03-737403
16. Basch E, Deal AM, Dueck AC, Scher HI, Kris MG, Hudis C, et al. Overall survival results of a trial assessing patient-reported outcomes for symptom monitoring during routine cancer treatment. JAMA. (2017) 318:197–8. doi: 10.1001/jama.2017.7156
17. Lenz G, Rutherford SC, Davies A, Zinzani PL, Salles G, Hasskarl J, et al. The burden of relapsed/refractory (R/R) diffuse large B-cell lymphoma (DLBCL): A systematic literature review (SLR). Blood. (2018) 132:2241. doi: 10.1182/blood-2018-99-112878
18. Bailey H, Lee A, Eccles L, Yuan Y, Burlison H, Forshaw C, et al. Treatment patterns and outcomes of patients with metastatic non-small cell lung cancer in five European countries: a real-world evidence survey. BMC Cancer. (2023) 23:603. doi: 10.1186/s12885-023-11074-z
19. Anderson P, Benford M, Harris N, Karavali M, Piercy J. Real-world physician and patient behaviour across countries: Disease-Specific Programmes - a means to understand. Curr Med Res Opin. (2008) 24:3063–72. doi: 10.1185/03007990802457040
20. Babineaux SM, Curtis B, Holbrook T, Milligan G, Piercy J. Evidence for validity of a national physician and patient-reported, cross-sectional survey in China and UK: the Disease Specific Programme. BMJ Open. (2016) 6:e010352. doi: 10.1136/bmjopen-2015-010352
21. Higgins V, Leith A, Siddall J, Gillespie A, Benford M. Trends in medication use in patients with type 2 diabetes mellitus (T2DM): a long-term view of real-world treatment between 2000 and 2015. Diabetes. (2016) 65:A91–A. doi: 10.2147/DMSO
22. Xiao H, Bertwistle D, Khela K, Middleton-Dalby C, Hall J. Global retrospective analysis of clinician- and patient-reported clinical characteristics and humanistic burden of patients with gastroesophageal cancers on first-line treatment. BMC Cancer. (2023) 23:186. doi: 10.1186/s12885-023-10553-7
23. Manual for the use of EORTC measures in daily clinical practice (2016). Available online at: https://www.eortc.org/app/uploads/sites/2/2018/02/EORTC_QLQ_Clinical_Practice_User_Manual-1.0.pdf.
24. Fayers P AN, Bjordal K, Groenvold M, Curran D, Bottomley A. EORTC QLQ-C30 Scoring Manual. Brussels: European Organisation for Research and Treatment of Cancer (2001).
25. Scott NWF PM, Aaronson NK, Bottomley A, de Graeff A, Groenvold M, Gundy C, et al. EORTC QLQ-C30 Reference Values (2008). Available online at: https://www.eortc.org/app/uploads/sites/2/2018/02/reference_values_manual2008.pdf.
26. Giesinger JM, Kuijpers W, Young T, Tomaszewski KA, Friend E, Zabernigg A, et al. Thresholds for clinical importance for four key domains of the EORTC QLQ-C30: physical functioning, emotional functioning, fatigue and pain. Health Qual Life Outcomes. (2016) 14:87. doi: 10.1186/s12955-016-0489-4
27. Reilly MC, Zbrozek AS, Dukes EM. The validity and reproducibility of a work productivity and activity impairment instrument. Pharmacoeconomics. (1993) 4:353–65. doi: 10.2165/00019053-199304050-00006
28. EuroQol Research Foundation EQ-5D-5L User Guide.v3 (2019). Available online at: https://euroqol.org/publications/user-guides/.
29. van Hout B, Janssen MF, Feng YS, Kohlmann T, Busschbach J, Golicki D, et al. Interim scoring for the EQ-5D-5L: mapping the EQ-5D-5L to EQ-5D-3L value sets. Value Health. (2012) 15:708–15. doi: 10.1016/j.jval.2012.02.008
30. Associates R. Reilly associates health outcomes research (2019). Available online at: http://www.reillyassociates.net/WPAI_Scoring.html.
31. Scott NW, Fayers PM, Aaronson NK, Bottomley A, de Graeff A, Groenvold M. EORTC QLQ-C30 Reference Values (2008), NW S. Available at: https://www.eortc.org/app/uploads/sites/2/2018/02/reference_values_manual2008.pdf.
33. Pickard AS, Neary MP, Cella D. Estimation of minimally important differences in EQ-5D utility and VAS scores in cancer. Health Qual Life Outcomes. (2007) 5:70. doi: 10.1186/1477-7525-5-70
34. Crump M, Neelapu SS, Farooq U, Van Den Neste E, Kuruvilla J, Westin J, et al. Outcomes in refractory diffuse large B-cell lymphoma: results from the international SCHOLAR-1 study. Blood. (2017) 130:1800–8. doi: 10.1182/blood-2017-03-769620
35. Vannata B, Conconi A, Winkler J, Cascione L, Margiotta Casaluci G, Nassi L, et al. Late relapse in patients with diffuse large B-cell lymphoma: impact of rituximab on their incidence and outcome. Br J Haematol. (2019) 187:478–87. doi: 10.1111/bjh.16106
36. International Non-Hodgkin's Lymphoma Prognostic Factors Project. A predictive model for aggressive non-Hodgkin's lymphoma. N Engl J Med. (1993) 329:987–94. doi: 10.1056/NEJM199309303291402
37. Coiffier B, Thieblemont C, Van Den Neste E, Lepeu G, Plantier I, Castaigne S, et al. Long-term outcome of patients in the LNH-98.5 trial, the first randomized study comparing rituximab-CHOP to standard CHOP chemotherapy in DLBCL patients: a study by the Groupe d'Etudes des Lymphomes de l'Adulte. Blood. (2010) 116:2040–5. doi: 10.1182/blood-2010-03-276246
38. Kamdar M, Solomon SR, Arnason J, Johnston PB, Glass B, Bachanova V, et al. Lisocabtagene maraleucel versus standard of care with salvage chemotherapy followed by autologous stem cell transplantation as second-line treatment in patients with relapsed or refractory large B-cell lymphoma (TRANSFORM): results from an interim analysis of an open-label, randomised, phase 3 trial. Lancet. (2022) 399:2294–308. doi: 10.1016/S0140-6736(22)00662-6
39. Locke FL, Miklos DB, Jacobson CA, Perales MA, Kersten MJ, Oluwole OO, et al. Axicabtagene ciloleucel as second-line therapy for large B-cell lymphoma. N Engl J Med. (2022) 386:640–54. doi: 10.1056/NEJMoa2116133
40. Johnson NA, Slack GW, Savage KJ, Connors JM, Ben-Neriah S, Rogic S, et al. Concurrent expression of MYC and BCL2 in diffuse large B-cell lymphoma treated with rituximab plus cyclophosphamide, doxorubicin, vincristine, and prednisone. J Clin Oncol. (2012) 30:3452–9. doi: 10.1200/JCO.2011.41.0985
41. European Pharmaceutical Market Research Association (EphMRA). European Pharmaceutical Market Research Association (EphMRA) Code of Conduct (2022). Available online at: https://www.ephmra.org/sites/default/files/2022-08/EPHMRA%202022%20Code%20of%20Conduct.pdf.
42. Health Information Technology (HITECH). Health Information Technology Act (2009). Available online at: https://www.healthit.gov/sites/default/files/hitech_act_excerpt_from_arra_with_index.pdf.
43. Oerlemans S, Mols F, Nijziel MR, Lybeert M, van de Poll-Franse LV. The impact of treatment, socio-demographic and clinical characteristics on health-related quality of life among Hodgkin's and non-Hodgkin's lymphoma survivors: a systematic review. Ann Hematol. (2011) 90:993–1004. doi: 10.1007/s00277-011-1274-4
44. Jerkeman M, Kaasa S, Hjermstad M, Kvaloy S, Cavallin-Stahl E. Health-related quality of life and its potential prognostic implications in patients with aggressive lymphoma: a Nordic Lymphoma Group Trial. Med Oncol. (2001) 18:85–94. doi: 10.1385/MO:18:1
45. Paunescu AC, Copie CB, Malak S, Gouill SL, Ribrag V, Bouabdallah K, et al. Quality of life of survivors 1 year after the diagnosis of diffuse large B-cell lymphoma: a LYSA study. Ann Hematol. (2022) 101:317–32. doi: 10.1007/s00277-021-04689-4
46. Pluta-Fuerst A, Petrovic K, Berger T, Fryze W, Fuchs S, Gold R, et al. Patient-reported quality of life in multiple sclerosis differs between cultures and countries: a cross-sectional Austrian-German-Polish study. Mult Scler. (2011) 17:478–86. doi: 10.1177/1352458510391341
47. Carnio S, Di Stefano RF, Novello S. Fatigue in lung cancer patients: symptom burden and management of challenges. Lung Cancer (Auckl). (2016) 7:73–82. doi: 10.2147/LCTT
48. Cheng R, Scippa K, Locke FL, Snider JT, Jim H. Patient perspectives on health-related quality of life in diffuse large B-cell lymphoma treated with car T-cell therapy: a qualitative study. Oncol Ther. (2022) 10:123–41. doi: 10.1007/s40487-021-00174-0
49. Khamboon T, Pakanta I. Intervention for Symptom Cluster Management of Fatigue, Loss of Appetite, and Anxiety among Patients with Lung Cancer undergoing Chemotherapy. Asia Pac J Oncol Nurs. (2021) 8:267–75. doi: 10.4103/2347-5625.311003
50. Hariyanto TI, Kurniawan A. Appetite problem in cancer patients: Pathophysiology, diagnosis, and treatment. Cancer Treat Res Commun. (2021) 27:100336. doi: 10.1016/j.ctarc.2021.100336
51. Lin V, Oak B, Snider J, Epstein J. Health-related quality of life (HRQOL) burden in patients with relapsed/refractory diffuse large B-cell lymphoma (RR-DLBCL) and non-Hodgkin's lymphoma (RR-NHL). J Clin Oncol. (2020) 38:e20070–e. doi: 10.1200/JCO.2020.38.15_suppl.e20070
52. Herbert MA, Prince SL, Williams JL, Magee MJ, Mack MJ. Are unaudited records from an outcomes registry database accurate? Ann Thorac Surg. (2004) 77:1960–4; discussion 4-5. doi: 10.1016/j.athoracsur.2003.12.018
53. Ueda K, Ye W, Lombard L, Kuga A, Kim Y, Cotton S, et al. Real-world treatment patterns and patient-reported outcomes in episodic and chronic migraine in Japan: analysis of data from the Adelphi migraine disease specific programme. J Headache Pain. (2019) 20:68. doi: 10.1186/s10194-019-1012-1
54. Holdsworth EA, Donaghy B, Fox KM, Desai P, Collier DH, Furst DE. Biologic and targeted synthetic DMARD utilization in the United States: Adelphi real world disease specific programme for rheumatoid arthritis. Rheumatol Ther. (2021) 8:1637–49. doi: 10.1007/s40744-021-00357-1
55. Ravens-Sieberer U, Kaman A, Erhart M, Devine J, Schlack R, Otto C. Impact of the COVID-19 pandemic on quality of life and mental health in children and adolescents in Germany. Eur Child Adolesc Psychiatry. (2022) 31:879–89. doi: 10.1007/s00787-021-01726-5
56. Groarke JM, Berry E, Graham-Wisener L, McKenna-Plumley PE, McGlinchey E, Armour C. Loneliness in the UK during the COVID-19 pandemic: Cross-sectional results from the COVID-19 Psychological Wellbeing Study. PLoS One. (2020) 15:e0239698. doi: 10.1371/journal.pone.0239698
Keywords: diffuse large B-cell lymphoma, disease burden, quality of life, cross-sectional study, patient reported outcome measures
Citation: Johnson PC, Bailey A, Ma Q, Milloy N, Butcher J, Sanderson I, Weatherby S, Meadows R and Quek RGW (2024) Real-world evaluation of health-related quality of life in patients with diffuse large B-cell lymphoma based on a multinational survey. Front. Oncol. 14:1402992. doi: 10.3389/fonc.2024.1402992
Received: 18 March 2024; Accepted: 27 May 2024;
Published: 24 June 2024.
Edited by:
Pasquale Niscola, Sant’Eugenio Hospital of Rome, ItalyReviewed by:
Lucia Gozzo, Gaspare Rodolico Hospital, ItalyClaudio Fozza, University of Sassari, Italy
Copyright © 2024 Johnson, Bailey, Ma, Milloy, Butcher, Sanderson, Weatherby, Meadows and Quek. This is an open-access article distributed under the terms of the Creative Commons Attribution License (CC BY). The use, distribution or reproduction in other forums is permitted, provided the original author(s) and the copyright owner(s) are credited and that the original publication in this journal is cited, in accordance with accepted academic practice. No use, distribution or reproduction is permitted which does not comply with these terms.
*Correspondence: Jake Butcher, amFrZS5idXRjaGVyQGFkZWxwaGlncm91cC5jb20=
†ORCID: P. Connor Johnson, orcid.org/0000-0002-3943-6608
Abigail Bailey, orcid.org/0000-0002-0238-6723
Qiufei Ma, orcid.org/0000-0003-4270-3487
Neil Milloy, orcid.org/0000-0002-6811-6312
Jake Butcher, orcid.org/0000-0002-0169-1443
Isaac Sanderson, orcid.org/0000-0003-4377-6709
Sarah Weatherby, orcid.org/0009-0009-6750-2666
Rachael Meadows, orcid.org/0000-0001-9047-4733
Ruben G. W. Quek, orcid.org/0000-0001-9602-3239