 Xinlian Du1†
 Xinxin Zang2†Hanbo Zhang1†Lijia Liu1Ying Xu1Xuedong Li1Ruishu Mou1
 Haitao Xu2*
 Jiuxin Zhu3*
 Rui Xie1*
- 1Department of Digestive Internal Medicine, Harbin Medical University Cancer Hospital, Harbin Medical University, Harbin, Heilongjiang, China
- 2Department of Hepatobiliary and Pancreatic Surgery, Harbin Medical University Cancer Hospital, Harbin Medical University, Harbin, Heilongjiang, China
- 3College of Pharmacy, Harbin Medical University, Harbin, Heilongjiang, China
Purpose: The aim of this study is to compare mean platelet volume/platelet count ratio (PVPR) and other indicators’ predictive abilities. Simultaneously, a new nomogram for predicting recurrence-free survival (RFS) after gastrointestinal stromal tumors (GISTs) R0 resection was developed.
Methods: From January 2010 to July 2019, 295 patients with GIST who were operated on at Harbin Medical University Cancer Hospital were retrospectively reviewed. With a 4-year RFS as the end point, using the Kaplan–Meier methods and log rank test, and then conducting Cox regression analysis, we compared and identified meaningful indicators for predicting prognosis. Finally, a nomogram was developed and validated using calibration curves.
Results: The receiver operating characteristic curve indicated that a cutoff point of 0.044 was the ideal threshold for PVPR, and patients were divided into a high-PVPR group (≤0.044) and a low-PVPR group (>0.044). Kaplan–Meier curves suggested that PVPR>0.044 had obvious associations with better RFS (p < 0.001). In accordance with multivariate analysis, PVPR (>0.044 vs. ≤0.044) (p = 0.005), National Institutes of Health (NIH) risk category (p < 0.001), and Ki-67 (p = 0.005) were the independent prognostic indicators of RFS. Tumor size, gastrointestinal bleeding, mitotic index, NIH risk category, CD34, and Ki-67 all exhibited an obvious correlation with PVPR (all p < 0.05). The nomogram’s probability of concordance was 0.823, indicating that the nomogram predictions were well calibrated.
Conclusion: In GISTs, RFS can be independently predicted by PVPR. Patients with higher PVPR have better RFS. The nomogram including PVPR could be used to assist clinical treatment decision-making.
1 Introduction
Gastrointestinal stromal tumors (GISTs) are one of the most frequently occurring sarcomas. Typically, GISTs originate from the stromal cells of Cajal, in which the occurrence rate is relatively low in the population (1) and the most common cause is mutations in receptor tyrosine kinases, especially in people with KIT proto-oncogene receptor tyrosine kinase (KIT) or Platelet-derived growth factor receptor alpha (PDGFRA) gene mutations (2). GISTs have been reported case in all age groups and are common in adults over 40 years old (3). It can appear everywhere in the digestive tract and usually in the stomach (60%–65%); next is the small intestine (20%–25%); a few are found in areas outside the gastrointestinal tract, such as the peritoneum, mesentery, and omentum. The clinical manifestations of GIST are non-specific, and bleeding, pain, and obstruction are common clinical manifestations (4). Comprehensive judgment is required on the basis of imaging examination, endoscopic examination, pathological tissue, immunohistochemistry, and genetic protein. The classification of GIST mainly applies NIH risk classification (5). GIST treatment includes endoscopic treatment, surgical treatment, and medication treatment. Small molecular tyrosine kinase inhibitors are the most frequently used therapeutic drugs of GISTs, and patients’ long-term prognosis can be vastly enhanced (6). However, patients with GIST still have a certain recurrence rate after surgery.
Currently, some GIST basic indicators, such as primary tumor location, mitotic index, tumor size, and tumor rupture, have been applied to estimate the probabilities of GIST recurrence (7, 8). Although the results obtained from the risk classification of NIH are identical, the prognosis of GIST varies significantly. Moreover, these indicators require invasive examination to obtain. Therefore, discovering a simple, non-invasive, acceptable, and affordable indicator to direct the treatment plan and pinpoint patients who are at a greater risk of recurrence is very necessary.
Nowadays, an essential part of the pathogenesis of malignant tumors is inflammation.
Chronic systemic inflammation is closely correlated to the long-term prognosis of many kinds of cancers. In addition to promoting tumor cells to elude immune monitoring, systemic inflammation can compromise the body’s immune response and accelerate angiogenesis, invasion, and metastasis (9). Some markers of systemic inflammation, such as Lymphocyte - to - White Blood Cell Ratio (LWR) and Systemic Inflammatory Response Index (SIRI), are based on lymphocyte, neutrophils, and monocyte, previous studies have confirmed their prognostic potential in malignant tumors (10, 11). Meanwhile, some studies have analyzed the ability of inflammatory markers such as platelet volume/platelet count ratio (PVPR), High - Reactivity Platelet - related factor (HPR), and Red Cell Platelet Ratio (RPR) based on hemoglobin, red cells, and platelets to reflect the impact of platelet activation on the progression of malignant tumors (12, 13). A number of studies to date have suggested that PVPR is associated with a wide range of tumors and that reduced PVPR is a hallmark of poor chemotherapy outcomes in advanced Gastric Cancer (GC) and is associated with long PFS in glioblastoma, as well as poor lung cancer diagnosis and reduced overall survival (14–16). However, it is unclear whether PVPR is associated with the risk of postoperative recurrence in patients with GIST. Therefore, we evaluated the prognostic value of PVPR, LWR, HPR, SIRI, and RPR in GISTs and contrasted their ability to forecast survival in this research.
2 Materials and methods
2.1 Patients
This study retrospectively analyzed patients with GIST who underwent surgical treatment at the Cancer Hospital of Harbin Medical University from January 2010 to July 2019. Each individual was pathologically given a GIST diagnosis and underwent R0 resection surgery with ECOG <2, aged between 18 and 85 years old. Patients who had incomplete preoperative clinical records or hematological examination data, simultaneously suffering from other tumors, experiencing infection and non-cancerous inflammatory disorders, and utilizing tyrosine kinase inhibitor (TKI)–based neoadjuvant treatment, were excluded. In total, 295 patients with GIST were ultimately included in this retrospective study (Figure 1). This retrospective study was approved by the Ethics Committee of Harbin Medical University Cancer Hospital, and all patients signed informed consent forms. This study complies with the Helsinki Declaration.
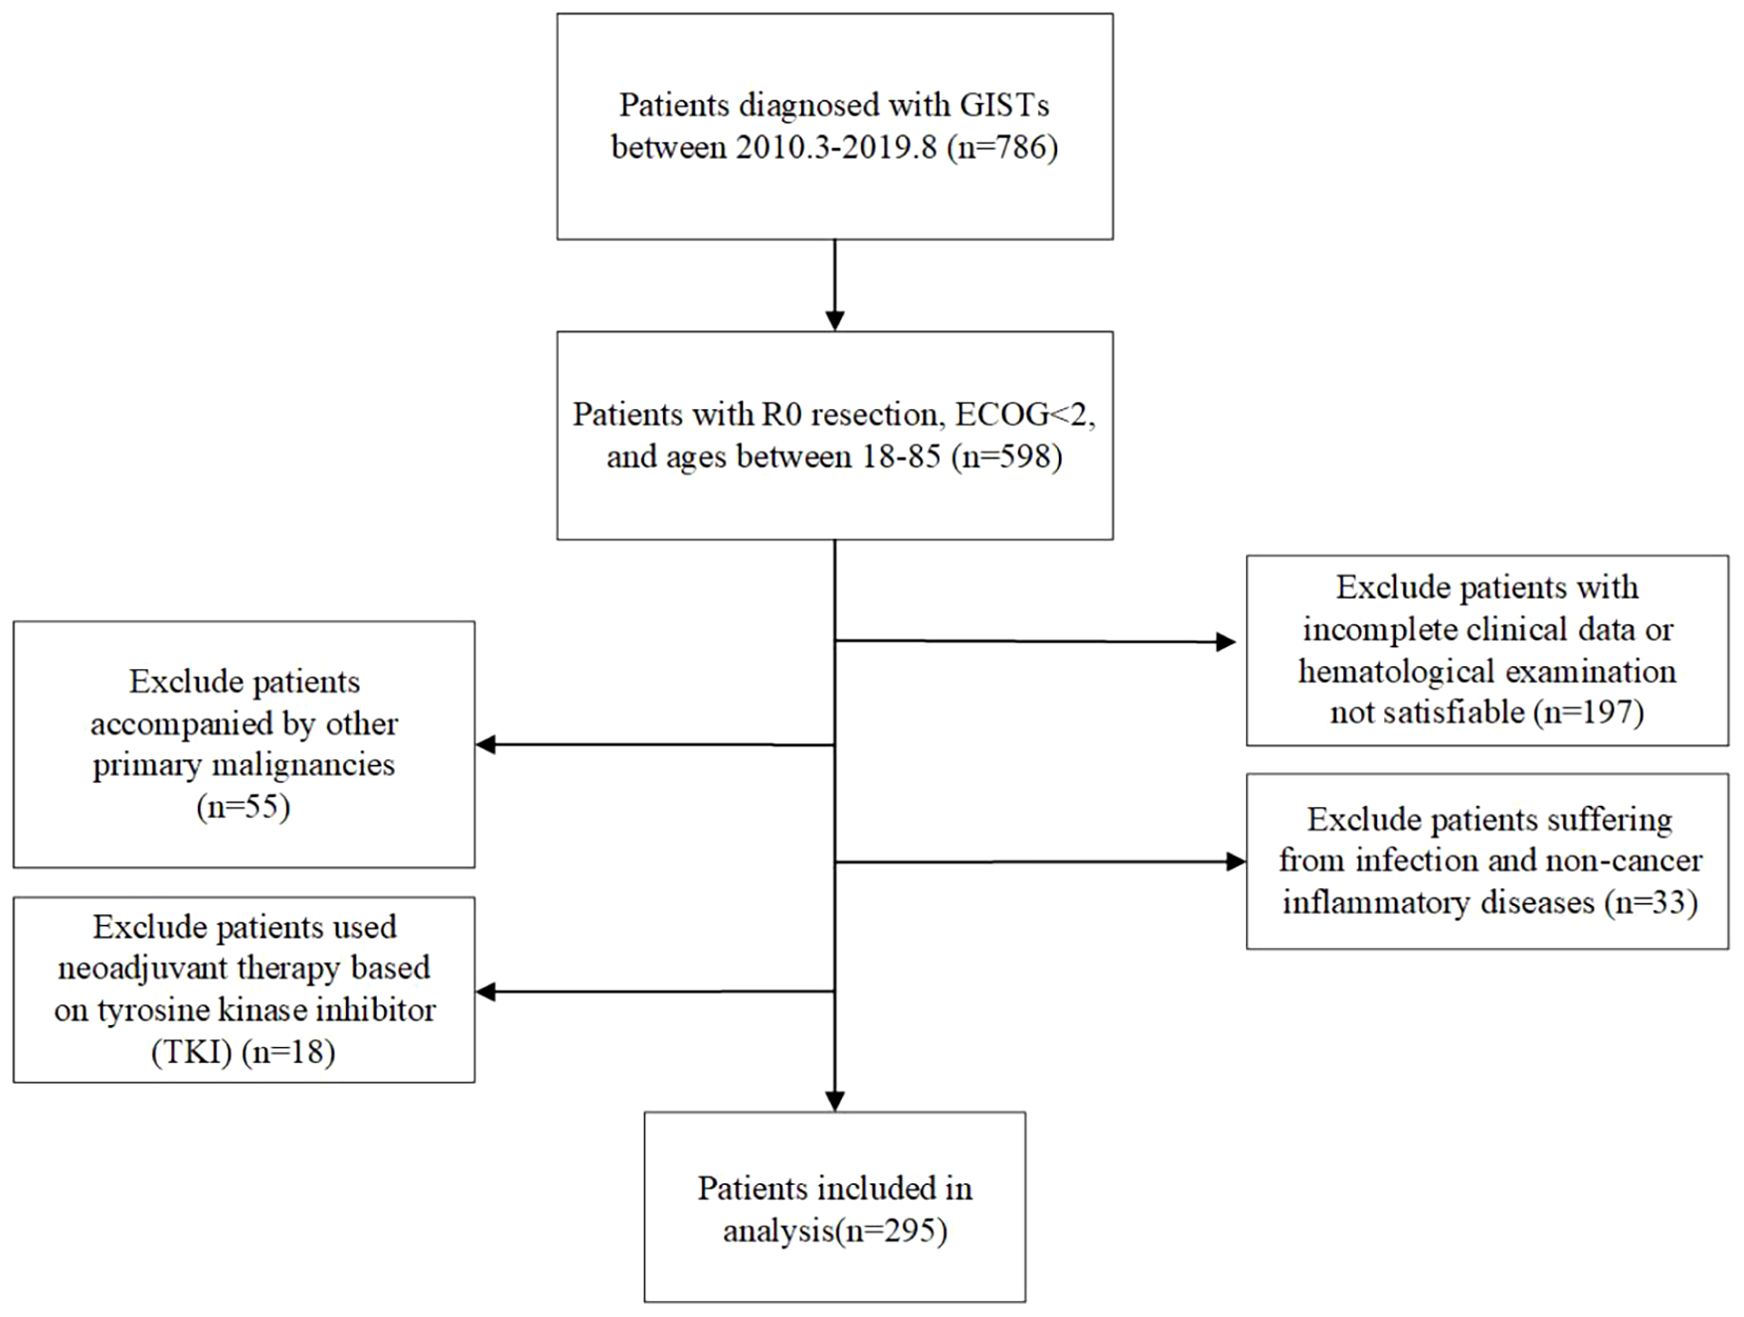
Figure 1. The flowchart of this study.
2.2 Indicators
The fundamental patient parameters, such as age, gender, tumor site, NIH risk category, tumor size, and mitotic index [mitosis/50 high-power field (HPF)], morphology, immunohistochemistry, molecular markers were recorded. The period elapsed between surgery and the first recorded occurrence of tumor or death is known as the recurrence-free survival (RFS). The data were collected from peripheral blood tests 2 weeks before surgery, including neutrophils, lymphocytes, white blood cells, platelet counts (PCs), hemoglobin, mean platelet volume (MPV), and red cell distribution width and monocyte count. The PVPR, LWR, HPR, SIRI, and RPR were calculated using the following formulas: PVPR = MPV (fL)/PC (109/L); LWR = lymphocyte numbers (109/L)/white blood cells (109/L); HPR = hemoglobin (g/L)/PC (109/L); SIRI = neutrophils (109/L) × monocyte count (109/L)/lymphocyte count (109/L); RPR = red cell distribution width/PC (109/L). In this trial, no patient passed away within 30 days following surgery.
2.3 Follow-up
During the first 3 years following the procedure, abdominal/pelvic computed tomography or magnetic resonance imaging was done every 3 to 6 months. After that, it was done every 6 to 12 months until 5 years later and then once a year until recurrence. The last follow-up date was July 2023.
2.4 Statistical analysis
We determined the ideal cutoff values of PVPR, LWR, HPR, SIRI, and RPR by using the maximum value of the Youden index (sensitivity + specificity − 1) in accordance with the receiver operating characteristic (ROC) curve for predicting 4-year RFS (14).
After that, we calculated the area under the curve (AUC) to compare the biomarkers’ projected values. We split the patients into two groups on the basis of the cutoff values of each indicator. Continuous variables that conform to a normal distribution are represented by the mean ± standard deviation, whereas, conversely, the median and quartile are used. The categorical variables are displayed as absolute values and analyzed using chi-square tests. We use Kaplan–Meier method to calculate the survival curve of RFS and compare it through log-rank tests. Using the Cox proportional hazards regression model and the stepwise forward method for variable selection, we performed univariate and multivariate analyses of survival. The hazard ratio (HR), which is determined as relative risk based on Cox analysis, was reported along with its associated 95% confidence interval (CI). Inflammatory markers with a P-value less than 0.05 were considered statistically significant in univariate analysis and designated for further multivariate analysis.
We constructed a nomogram using the independent risk variables of RFS discovered using multivariate Cox regression analysis. To evaluate nomogram’s performance, we employed a calibration curve on the basis of the Bootstrap sampling, which was repeated 1,000 times. The Harrell consistency index (C-index) is used to evaluate the predictive ability of column chart models. We used SPSS (version 25.0), GraphPad Prism 9.0, and R (version 4.3.1). The R packages rms, survival, mstate, Hmisc, dcurves, and ggplot2 (available at URL: http://cran.r-project.org/web/packages/) were used to do analysis of data.
3 Results
3.1 Optimal cutoff value of inflammatory indicators
We determined the PVPR, LWR, HPR, SIRI, and RPR best cutoff values utilizing the ROC curves. Our results indicated that the optimal cutoff values of PVPR, LWR, HPR, SIRI, and RPR for predicting RFS were 0.044, 0.218, 0.607, 0.745, and 0.058, respectively. Patients were divided into two groups (PVPR >0.044 vs. ≤0.044; LWR >0.218 vs. ≤0.218; HPR >0.607 vs. ≤0.607; SIRI >0.745 vs. ≤0.745; RPR >0.058 vs. ≤0.058) for RFS analysis. Their AUC values are 0.721, 0.636, 0.713, 0.655, and 0.662, respectively, and all of their p-values are less than 0.001. PVPR outperformed LWR, HPR, RPR, or SIRI in terms of prognostic usefulness for patients with GIST, as evidenced by its higher AUC values when forecasting the 4-year survival rates for GISTs in comparison to other systemic inflammatory biomarkers (Figure 2).

Figure 2. The receiver operating characteristic (ROC) analysis of LWR, RPR, PVPR, HPR, and SIRI. The areas under the curve (AUC) for RFS were 0.636 (p = 0.001), 0.662 (p < 0.001), 0.721 (p < 0.001), 0.713 (p < 0.001), and 0.655 (p < 0.001) for LWR, RPR, PVPR, HPR, and SIRI, respectively.
3.2 Patients and basic characteristics
Table 1 enumerates the clinical features. We accepted 295 individuals according to the inclusion criteria, including 135 men (45.8%) and 160 women (54.2%), and the ratio is approximately 1:1. Ages varied from 28 to 84, with stomach being the most often seen tumor location (198, 67.1%), then the small intestine (66, 22.4%), and colorectum (11, 3.7%); some are located extra-gastrointestinal 20 (6.8%), including esophagus, peritoneum, abdominal and pelvic cavity, pancreas, and liver. According to tumor size, the tumor’s maximal diameter on average was 6.0 cm. Patients were categorized into ≤4-cm, 4.1- to 6-cm, 6.1- to 9-cm, and ≥9-cm groups; each group has 93 (31.5%), 73 (24.7%), 72 (24.4%), 57 (19.4%) people, respectively. Most patients accepted open surgery (255, 86.4%). On the basis of the clinical data, 61 (20.7%) patients had gastrointestinal bleeding. According to the updated NIH GIST risk categorization standards, 108 (36.6%) patients were high risk, 73 (24.7%) patients were intermediate risk, 91 (30.8%) patients were low risk, and 23 (7.9%) patients were very low risk. For the majority of patients (214, 72.5%), histologic subtypes were spindle; the rest were mixed (72, 24.4%) and epithelioid (9, 3.1%). According to our research, whether the patients are using imatinib or sunitinib was investigated, up to 120 patients who explicitly used postoperative adjuvant were successfully followed up, and common adverse reactions include systemic or local edema gastrointestinal reaction and rash.

Table 1. Baseline characteristics of the patients with GIST enrolled in the study.
3.3 Univariate and multivariate survival analyses
The predictive value of inflammatory biomarkers was examined using univariate analysis and Kaplan–Meier survival analysis. The Kaplan–Meier survival curves of the PVPR, LWR, HPR, SIRI, and RPR indices are presented in Figures 3A–E. Compared to that in the PVPR-low group, the RFS rate in the PVPR-high group was much greater. Moreover, the results of the other four indicators in evaluating the prognosis of patients with GIST are statistically significant. Table 2 presents the results of the univariate and multivariate analyses. The results of the univariate analyses showed that the mitotic index (P < 0.001), tumor size (P < 0.001), tumor site (P = 0.01), NIH risk category (P < 0.001), surgery (P = 0.028), adjuvant therapy (P = 0.003), CD34 (P = 0.003), DOG-1 (P = 0.001), Ki-67 (P < 0.001), RPR (HR = 0.334, 95% CI: 0.186–0.601, P < 0.001), PVPR (HR = 0.155, 95% CI: 0.066–0.360, P < 0.001), HPR (HR = 0.155, 95% CI: 0.066–0.360, P < 0.001), LWR (HR = 0.316, 95% CI: 0.183–0.548, P < 0.001), and SIRI (HR = 2.601, 95% CI: 1.445–4.682, P = 0.001) were remarkable predictors of RFS. The Cox multivariate analysis, which selected variables using a forward stepwise method, revealed that the NIH risk category (P < 0.001), Ki-67 (P = 0.005), and PVPR (HR = 0.281, 95% CI: 0.117–0.675, P = 0.005) were the independent prognostic factors of RFS.
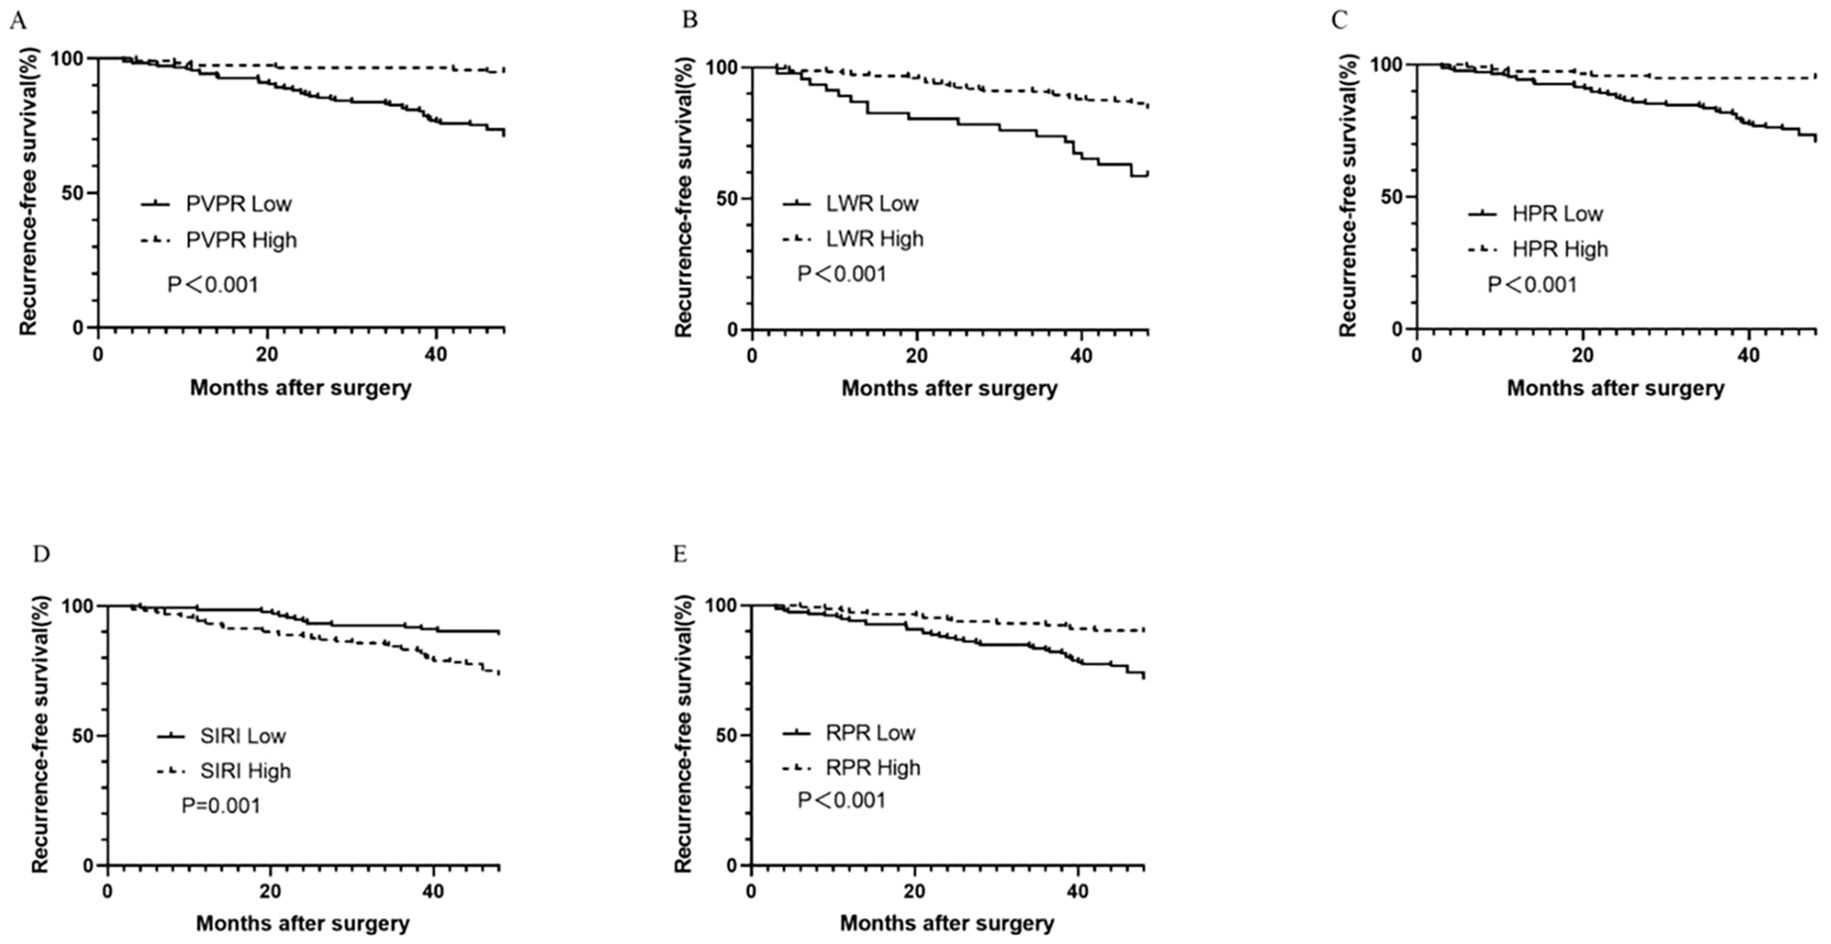
Figure 3. Kaplan–Meier survival curves for RFS according to PVPR (A), LWR (B), HPR (C), SIRI (D), and RPR (E) in patients with GIST.
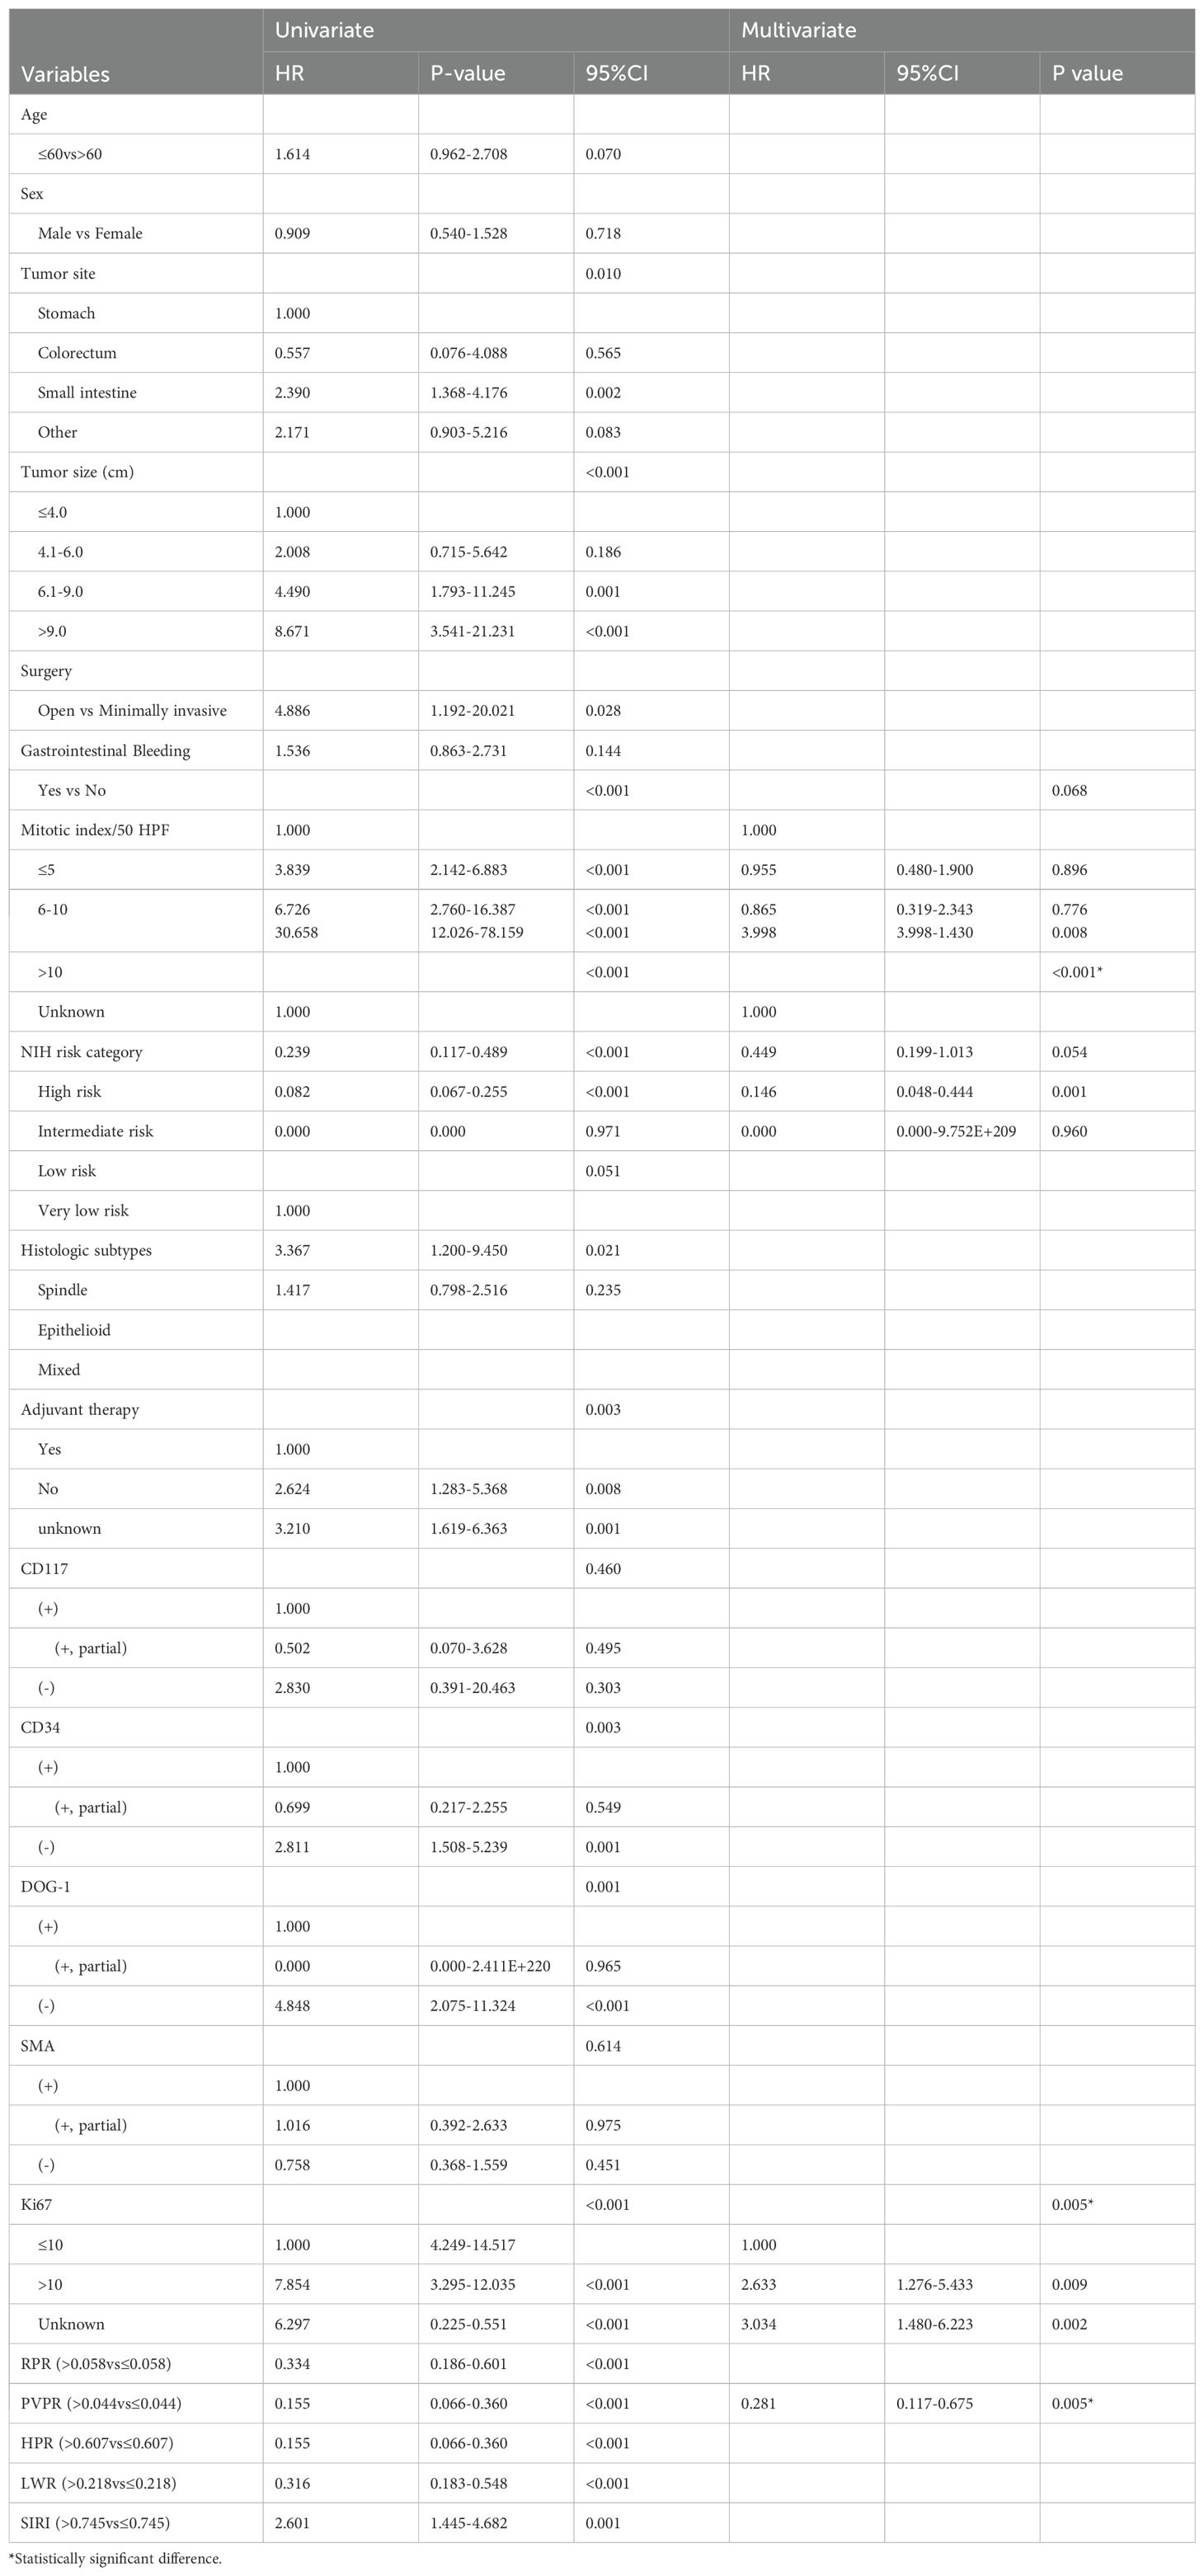
Table 2. Univariate and multivariate analysis of the prognostic factors for recurrence-free survival in patients with GIST.
Our results from the subgroup analysis showed that patients in the high-PVPR group in the high-risk subgroup had prolonged RFS (P < 0.001); however, this was not the case in the intermediate subgroup and the low and very low subgroups (P = 0.279 and 0.063), respectively (Figure 4).
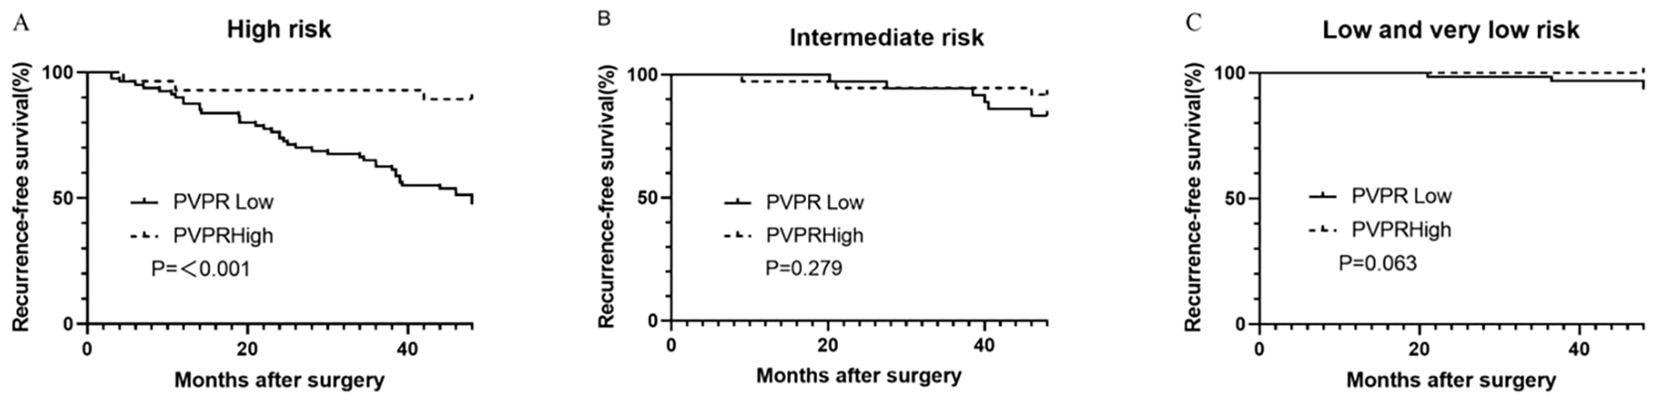
Figure 4. Kaplan–Meier survival curves for recurrence-free survival according to the PVPR in high- (A), intermediate- (B), and low- and very-low-risk (C) subgroups.
3.4 Correlation between inflammatory markers and clinical characteristics
Because of the strong correlations shown between PVPR and prognosis, the clinical characteristics of patients categorized by PVPR were adopted and displayed in Table 3. According to our research, there was a strong and positive association between PVPR and tumor size (P = 0.006), gastrointestinal bleeding (P < 0.001), mitotic index (P = 0.002), NIH risk category (P = 0.001), CD34 (P = 0.027), Ki-67 (P < 0.001), HPR (P < 0.001), and RPR (P < 0.001). Due to the lack of clear association between RPR, LWR, SIRI, HPR, and prognosis, there was no presentation of the patient features broken down by RPR, LWR, SIRI, and HPR.
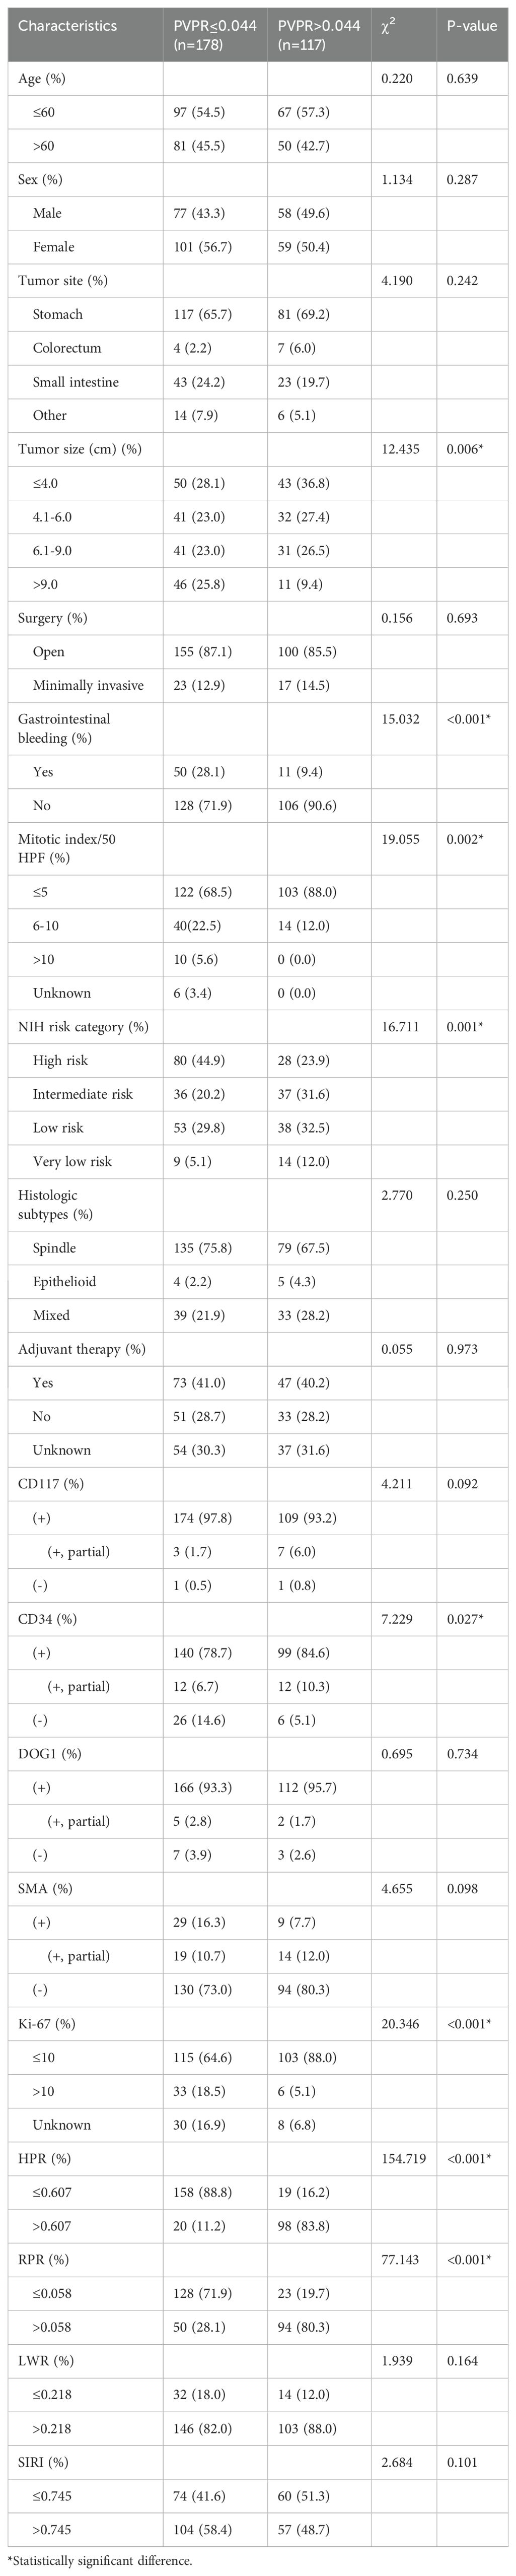
Table 3. Relationship between PVPR and clinicopathological features in patients with GIST.
3.5 Construction and validation of the nomogram
We created a nomogram using the results of multivariate COX analysis, including PVPR, NIH risk categories, and Ki-67. We can forecast each patient’s 2-, 3-, and 4-year RFS probability by adding the scores for each variable (Figure 5). To evaluate its functionality, 1,000 bootstrap re-samples were performed on the nomogram for calibration plot–based internal validation. We also assessed how well the nomogram predicted the chance of recurrence following R0 resection of GISTs. The nomogram’s concordance probability was 0.823 (0.795–0.851). The calibration curve results of the prediction model show that the calibration curve of the 3-year survival rate is relatively close to the actual value, and the prediction model has high accuracy (p < 0.01) (Figure 6). Constructing decision curve analysis (DCA) for evaluating the clinical effectiveness of nomogram shows a good clinical effectiveness. The DCA constructed by the predicted model of 4 years after surgery is above the horizontal line at a threshold probability of 0–0.15, indicating the highest return over a large range (Figure 7). This model predicts patient prognosis and improves clinical outcomes.

Figure 5. Nomogram to predict the probabilities of 2-, 3-, and 4-year recurrence-free survival (RFS) of primary GIST. The nomogram is based on NIH risk, mitotic index, and PVPR to predict the survival of GISTs, by summing the points of each independent factor, plotted on the “Total points” line, which corresponds to predictions of recurrence-free survival.
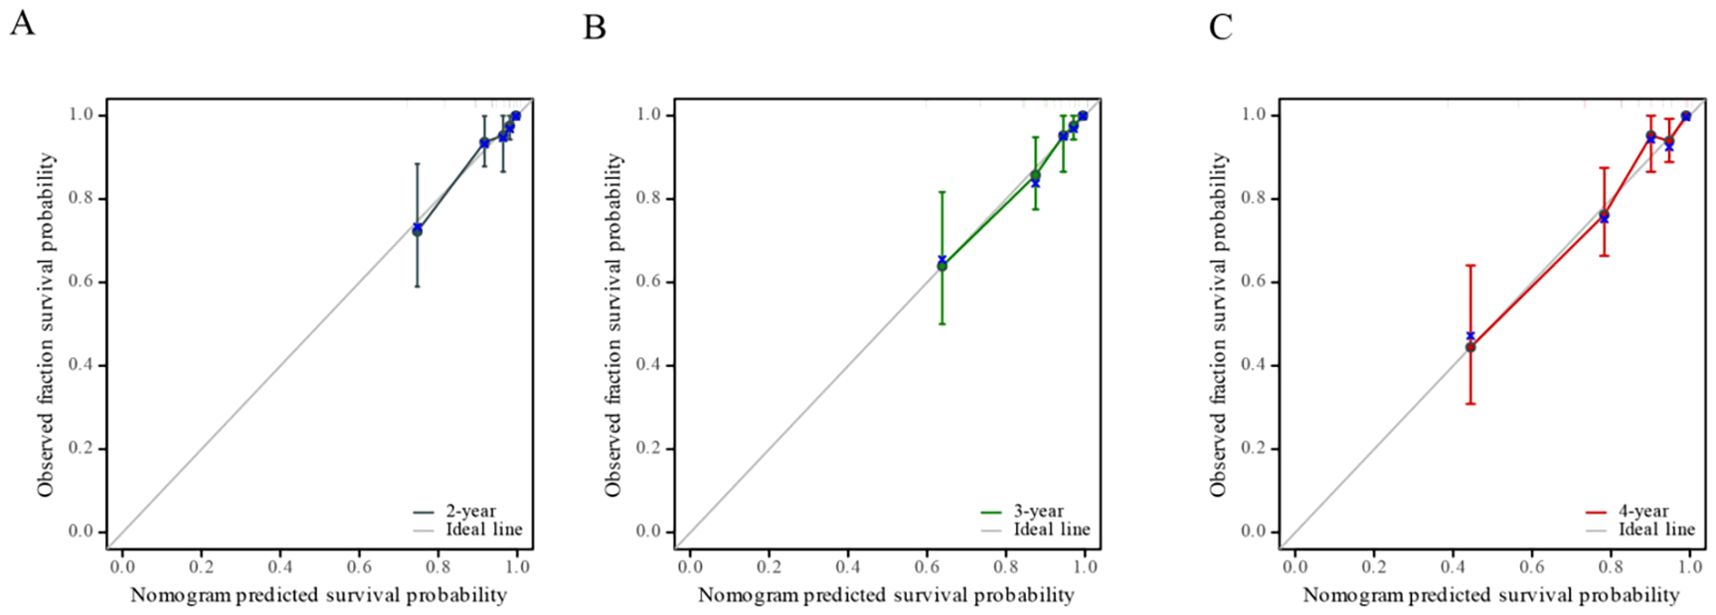
Figure 6. Calibration curve of nomogram-predicted recurrence-free survival (RFS), including the calibration curves of 2-year (A), 3-year (B), and 4-year (C) survival rates respectively.
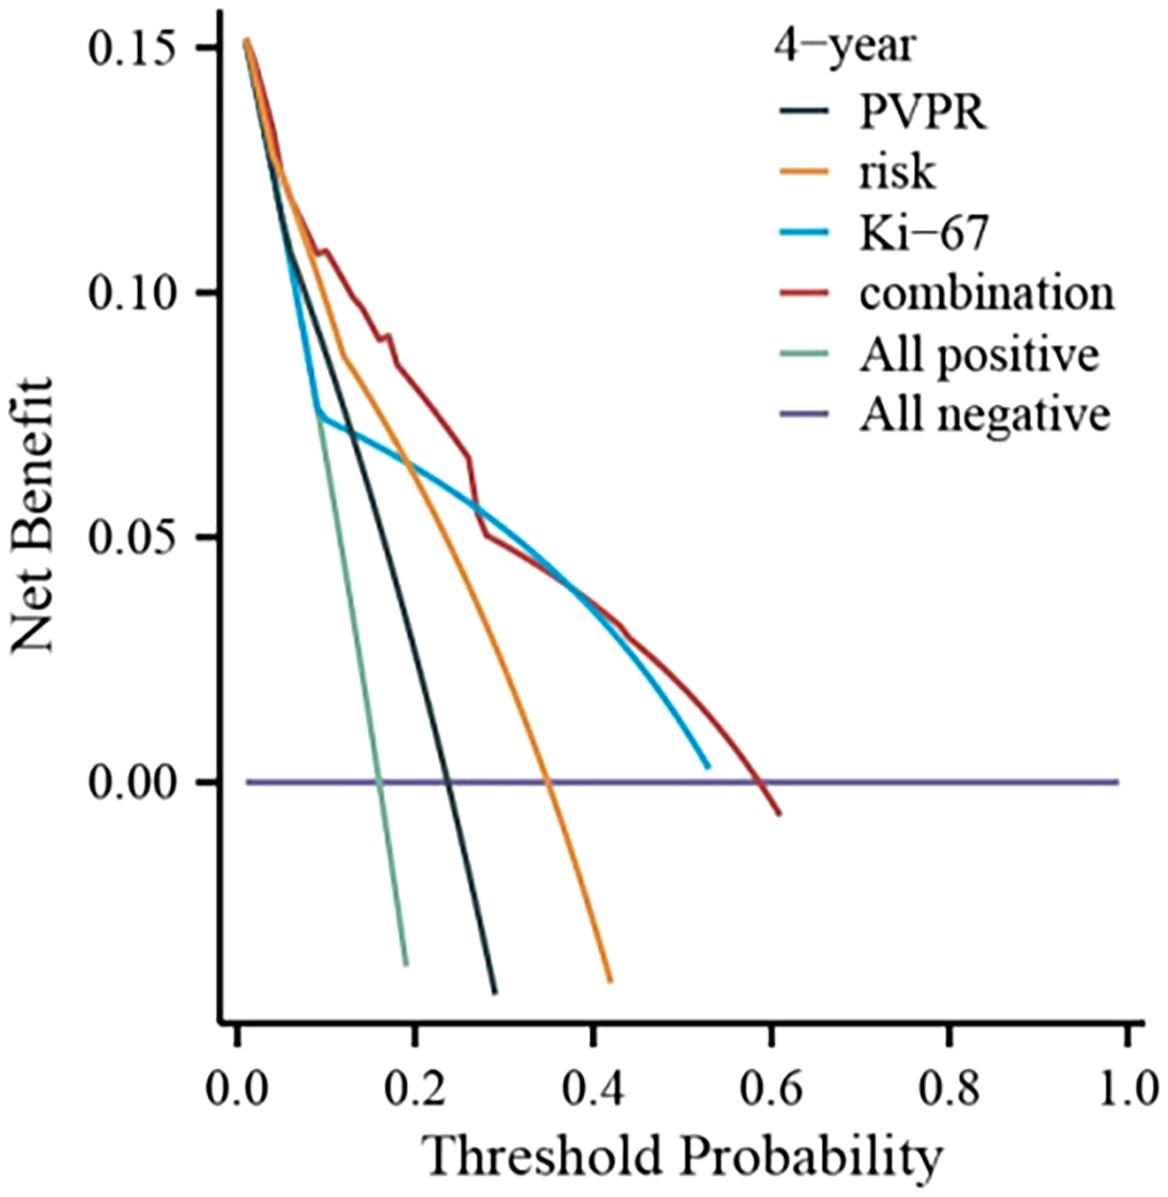
Figure 7. DCA curve of the nomogram.
4 Discussion
GIST is the most common in gastrointestinal sarcoma, and the most effective treatment method now is surgical resection. However, the recurrence and metastasis of primary diseases after surgery result in a shortened survival time. Therefore, predicting the risk of recurrence and metastasis can help early clinical screening of patients with a poor prognosis, timely intervention, and subsequent treatment, which is particularly important. Currently, numerous research works have found that systemic inflammation and local immune response influence tumor development and the survival of patients with cancer (9). The biological behavior of the occurrence, development, and invasion of malignant tumors depends on the malignant characteristics, in addition to the tumor microenvironment. Regarded as a crucial element of the tumor microenvironment, inflammatory cells facilitate invasion and metastasis by upsetting the immune system and ultimately allowing tumor cells to evade immune recognition (15, 18).
Up to now, multiple investigations have demonstrated a correlation between inflammatory biomarkers and prognosis of patients with GIST (16, 17, 19, 20), but, which index is better, there is no consistent conclusion. Li et al. found that platelet-to-lymphocyte ratio, SIRI is an independent risk factor of recurrence after surgery (18, 21). Monocyte-to-lymphocyte ratio and neutrophil-to-lymphocyte ratio are also confirmed as independent prognostic factors for disease-free survival in GISTs (14, 19). Some nutritional indicators such as Geriatric Nutrition Risk Index (20, 22) are considered as a prognostic factor (21, 23).
MPV and PC are the two most significant platelet indices, and, lately, its integration into the PVPR index has been applied to the assessment of patients’ prognoses for malignant tumors. According to Gu et al., Hepatocellular Carcinoma (HCC) patients with low MPV/PC had noticeably better overall survival (14, 24). Poor ratios of MPV/PC were linked to poor cancer-specific survival, according to Feng et al. (22, 25). In colorectal cancer, Wu et al. demonstrated the predictive utility of MPV/PC (23, 26). In cervical cancer, the patients with low MPV/PC had a considerably better overall survival than those who had high MPV/PC, and MPV/PC was a stand-alone predictive marker for cervical cancer (24, 27). However, the predictive role of PVPR in patients with GIST has not been explored yet. So, we conducted a retrospective study on patients with GIST after R0 resection and mainly compared the predictive ability of five inflammatory indicators—LWR, HPR, SIRI, PVPR, and RPR—in RFS of GISTs.
In our research, we tested their ROC curves; these indicators all have predictive significance (p < 0.05), but the AUC of PVPR is maximum, which reached 0.721, representing its good predictive function for RFS. Kaplan–Meier curves also indicated that RFS was significantly better in the high-PVPR group. Whether in univariate or multivariate analysis, compared with other inflammatory biomarkers such as LWR, HPR, SIRI, and RPR, PVPR was an independent prognostic indicator for patients with GIST. Although LWR, HPR, SIRI, and RPR are associated with RFS univariate analysis, they are not independent prognostic indicators. However, in subgroup analysis, only in the patients with high risk, PVPR has shown a good ability to distinguish patients with different prognosis. These results demonstrated that PVPR was a better inflammatory indicator than other ones for predicting survival in patients with GIST. In the comparison of PVPR with baseline clinical features, we also found that PVPR was significantly related to tumor size, gastrointestinal bleeding, mitotic index, NIH risk category, CD34, and Ki-67.
We have now confirmed that PVPR can predict the prognosis of GISTs, but the mechanism has not been fully elucidated. It might be connected to the following elements. Firstly, PVPR is calculated by MPV and PC. Platelets are discoid-shaped fragments derived from bone marrow megakaryocytes (25, 28). Although not strictly appointed within the inflammatory pathway, the platelet can be viewed as an extension of the cellular immune system, and the platelet in the middle of diverse inflammatory processes influences normal leukocyte biology and inflammatory signals (26, 29). Platelets get activated and aggregated in response to circulating tumor cells (CTCs), and these activated platelets collect and shield CTCs from natural killer cells and shear stress. Last but not least, platelets promote CTC resistance to anoikis, angiogenesis, extravasation, and, ultimately, metastasis (27). MPV has been shown to be a good predictor of platelet activity, and it is linked to a number of prothrombotic and proinflammatory illnesses (28, 31). In physiological conditions, MPV is inversely proportional to the PC, which is associated with hemostasis maintenance and preservation of constant platelet mass (29, 32). Therefore, the ratio of MPV to PC is often studied as a whole. Secondly, research had shown that patients with cancer have a higher PC and are more likely to experience thromboembolism, which is linked to significant morbidity and death. Indirectly acting on endothelial cells or leukocytes, cancer cells can also stimulate platelets by the contact of a membrane protein on their surface with a particular receptor on platelets to promote thrombus formation. They release proinflammatory cytokines that stimulate prothrombotic alteration in endothelial cells, such as interleukin-1b and tumor necrosis factor–a (30, 33). In other words, platelets are not only a consequence of malignant tumors but also a part of their development process. In general, platelet wear during coagulation may cause the count to drop, but proinflammatory cytokines can activate megakaryocytes, which can result in a significant increase in thrombocyte synthesis and release. Platelet parameters can serve as diagnostic indicators for certain disorders because they exhibit distinct variations (28, 31).
At the end of this study, we incorporated the independent prognostic factors such as PVPR, NIH risk category, and Ki-67 to assemble the nomogram. The nomogram demonstrated a high degree of accuracy in predicting GIST survival (C-index = 0.823). More investigation is required to enhance the nomogram through the analysis of more thorough prognostic data, and this model’s efficacy need to be assessed in upcoming clinical uses.
The significance of our research lies in finding an auxiliary prediction tool that can be used in addition to mitotic index, Ki-67, and danger levels. It is simple and easy to obtain and has the potential to be applied in clinical work in the future. Antiplatelet drugs may lower infection-related mortality, according to recent research, which raises the possibility that altering platelet responses to inflammation has therapeutic value (25, 28). So, we look forward to more research and application of antiplatelet drugs in gastrointestinal tumors in the future.
There are several restrictions on this study. To begin with, our study had a medium sample size and was a retrospective single-center investigation. Due to limited data, it is not possible to investigate 5-year RFS, and there is a lack of longitudinal comparative data, which may result in a certain degree of deviation. Secondly, the study included patients who accept TKI adjuvant therapy after surgery, and it could significantly prolong RFS. Thirdly, the nomogram was lack of external validation, which may lead to inaccurate models.
5 Conclusion
Through the above research, we found that PVPR is an independent prognostic indicator for RFS after GIST R0 resection, especially for high-risk patients. It has superior prognostic ability than LWR, HPR, SIRI, and RPR. Meanwhile, PVPR is easy to obtain, is cost-effective, and has good predictive performance. PVPR > 0.044 can help predict recurrence and assess patient risk stratification.
Data availability statement
The raw data supporting the conclusions of this article will be made available by the authors, without undue reservation.
Ethics statement
The studies involving humans were approved by Ethics committee of Harbin Medical University Cancer Hospital. The studies were conducted in accordance with the local legislation and institutional requirements. The human samples used in this study were acquired from primarily isolated as part of your previous study for which ethical approval was obtained. Written informed consent for participation was not required from the participants or the participants’ legal guardians/next of kin in accordance with the national legislation and institutional requirements. Written informed consent was obtained from the individual(s) for the publication of any potentially identifiable images or data included in this article.
Author contributions
XD: Data curation, Formal analysis, Investigation, Methodology, Project administration, Writing – original draft, Writing – review & editing. XZ: Data curation, Project administration, Writing – review & editing. HZ: Methodology, Writing – review & editing. LL: Data curation, Investigation, Writing – review & editing. YX: Resources, Writing – review & editing. XL: Investigation, Writing – review & editing. RM: Investigation, Writing – review & editing. HX: Funding acquisition, Project administration, Writing – review & editing. JZ: Funding acquisition, Project administration, Writing – review & editing. RX: Conceptualization, Funding acquisition, Methodology, Project administration, Supervision, Writing – review & editing.
Funding
The author(s) declare financial support was received for the research, authorship, and/or publication of this article. This study was supported by Haiyan Foundation of Harbin Medical University Cancer Hospital (Grant No.JJZD2024-29).
Conflict of interest
The authors declare that the research was conducted in the absence of any commercial or financial relationships that could be construed as a potential conflict of interest.
Publisher’s note
All claims expressed in this article are solely those of the authors and do not necessarily represent those of their affiliated organizations, or those of the publisher, the editors and the reviewers. Any product that may be evaluated in this article, or claim that may be made by its manufacturer, is not guaranteed or endorsed by the publisher.
References
1. Becker EC, Ozcan G, Wu GY. Primary hepatic extra-gastrointestinal Stromal tumors: molecular pathogenesis, immunohistopathology, and treatment. J Clin Transl Hepatol. (2023) 000:000–0. doi: 10.14218/JCTH.2022.00173
2. Unk M, Jezeršek Novaković B, Novaković S. Molecular mechanisms of gastrointestinal stromal tumors and their impact on systemic therapy decision. Cancers. (2023) 15:1498. doi: 10.3390/cancers15051498
3. Goettsch WG, Bos SD, Breekveldt-Postma N, Casparie M, Herings RMC, Hogendoorn PCW. Incidence of gastrointestinal stromal tumours is underestimated: Results of a nation-wide study. Eur J Cancer. (2005) 41:2868–72. doi: 10.1016/j.ejca.2005.09.009
4. Blay JY, YK K, Nishida T, Von Mehren M. Gastrointestinal stromal tumours. Nat Rev Dis Primers. (2021) 7:22. doi: 10.1038/s41572-021-00254-5
5. Li J, Ye Y, Wang J, Zhang B, Qin S, Shi Y, et al. Chinese consensus guidelines for diagnosis and management of gastrointestinal stromal tumor. Chin J Cancer Res. (2017) 29:281–93. doi: 10.21147/j.issn.1000-9604.2017.04.01
6. DeMatteo RP, Ballman KV, Antonescu CR, Corless C, Kolesnikova V, von Mehren M, et al. Long-term results of adjuvant imatinib mesylate in localized, high-risk, primary gastrointestinal stromal tumor: ACOSOG Z9000 (Alliance) intergroup phase 2 trial. Ann Surg. (2013) 258:422–9. doi: 10.1097/SLA.0b013e3182a15eb7
7. Casali PG, Abecassis N, Aro HT, Bauer S, Biagini R, Bielack S, et al. Gastrointestinal stromal tumours: ESMO–EURACAN Clinical Practice Guidelines for diagnosis, treatment and follow-up. Ann Oncol. (2018) 29:iv68–78. doi: 10.1093/annonc/mdy095
8. Koo DH, Ryu M-H, Kim K-M, Yang H-K, Sawaki A, Hirota S, et al. Asian consensus guidelines for the diagnosis and management of gastrointestinal stromal tumor. Cancer Res Treat. (2016) 48:1155–66. doi: 10.4143/crt.2016.187
9. Diakos CI, KA C, DC M, Clarke SJ. Cancer-related inflammation and treatment effectiveness. Lancet Oncol. (2014) 15:e493–503. doi: 10.1016/S1470-2045(14)70263-3
10. Ang JJ, Chia DKA, Chan DKH. Lymphocyte-white cell ratio is a novel marker of morbidity following colorectal cancer surgery. J Surg Res. (2021) 259:71–8. doi: 10.1016/j.jss.2020.11.027
11. Xin Y, Zhang X, Li Y, Yang Y, Chen Y, Wang Y, et al. A systemic inflammation response index (SIRI)-based nomogram for predicting the recurrence of early stage hepatocellular carcinoma after radiofrequency ablation. Cardiovasc Intervent Radiol. (2022) 45:43–53. doi: 10.1007/s00270-021-02965-4
12. Cho SY, Yang JJ, You E, Kim B-H, Shim J, Lee HJ, et al. Mean platelet volume/platelet count ratio in hepatocellular carcinoma. Platelets. (2013) 24:375–7. doi: 10.3109/09537104.2012.701028
13. Hu Z, Tan S, Chen S, Qin S, Chen H, Qin S, et al. Diagnostic value of hematological parameters platelet to lymphocyte ratio and hemoglobin to platelet ratio in patients with colon cancer. Clinica Chimica Acta. (2020) 501:48–52. doi: 10.1016/j.cca.2019.11.036
14. Cananzi FCM, Minerva EM, Samà L, Ruspi L, Sicoli F, Conti L, et al. Preoperative monocyte-to-lymphocyte ratio predicts recurrence in gastrointestinal stromal tumors. J Surg Oncol. (2019) 119:12–20. doi: 10.1002/jso.25290
15. Wach J, Apallas S, Schneider M, Weller J, Schuss P, Vatter H, et al. Mean platelet volume/platelet count ratio and risk of progression in glioblastoma. Front Oncol. (2021) 11:695316. doi: 10.3389/fonc.2021.695316
16. Omar M, Tanriverdi O, Cokmert S, Oktay E, Yersal O, Pilancı KN, et al. Role of increased mean platelet volume (MPV) and decreased MPV/platelet count ratio as poor prognostic factors in lung cancer. Clin Respir J. (2017) 12:922–9. doi: 10.1111/crj.12605
17. Schisterman EF, Faraggi D, Reiser B, Hu J. Youden Index and the optimal threshold for markers with mass at zero. Stat Med. (2008) 27:297–315. doi: 10.1002/sim.2993
18. Elinav E, Nowarski R, CA T, Hu B, Jin C, Flavell RA. Inflammation-induced cancer: crosstalk between tumours, immune cells and microorganisms. Nat Rev Cancer. (2013) 13:759–71. doi: 10.1038/nrc3611
19. Guo Y, Liu J, Zhang W, Xiao S, Zheng G, Liu S, et al. Prognostic value of fibrinogen and lymphocyte count in intermediate and high risk gastrointestinal stromal tumors. CMAR. (2020) 12:8149–57. doi: 10.2147/CMAR.S262570
20. Cai HX, XQ Li, Wang SF. Prognostic value of fibrinogen and D-dimer-fibrinogen ratio in resectable gastrointestinal stromal tumors. WJG. (2018) 24:5046–56. doi: 10.3748/wjg.v24.i44.5046
21. Li W, Peng QW, Lin Y, Wan WZ, Zeng XY, Sun X, et al. A model to predict the recurrence of middle-high risk gastrointestinal stromal tumors based on preoperative fibrinogen and peripheral blood inflammatory indexes. Zhonghua Wei Chang Wai Ke Za Zhi. (2020) 23:896–903. doi: 10.3760/cma.j.cn.441530-20200613-00355
22. Cao X, Cui J, Yu T, Li Z, Zhao G. Fibrinogen/albumin ratio index is an independent prognosis predictor of recurrence-free survival in patients after surgical resection of gastrointestinal stromal tumors. Front Oncol. (2020) 10:1459. doi: 10.3389/fonc.2020.01459
23. Lu Z, Li R, Cao X, Liu C, Sun Z, Shi X, et al. Assessment of systemic inflammation and nutritional indicators in predicting recurrence-free survival after surgical resection of gastrointestinal stromal tumors. Front Oncol. (2021) 11:710191. doi: 10.3389/fonc.2021.710191
24. Gu J, Zhang X, Wang Z, Cui R, Zhang J, Jia Y, et al. Simplified nomograms based on platelet-associated models for survival prediction in Asian hepatocellular carcinoma patients after surgery. Surg Oncol. (2019) 30:131–8. doi: 10.1016/j.suronc.2019.07.008
25. Feng JF, Sheng C, Zhao Q, Chen P. Prognostic value of mean platelet volume/platelet count ratio in patients with resectable esophageal squamous cell carcinoma: a retrospective study. PeerJ. (2019) 7:e7246. doi: 10.7717/peerj.7246
26. Wu YY, Zhang X, Qin Y-Y, Qin J-Q, Lin F-Q. Mean platelet volume/platelet count ratio in colorectal cancer: a retrospective clinical study. BMC Cancer. (2019) 19:314. doi: 10.1186/s12885-019-5504-9
27. Deng Q, Long Q, Liu Y, Yang Z, Du Y, Chen X. Prognostic value of preoperative peripheral blood mean platelet volume/platelet count ratio (MPV/PC) in patients with resectable cervical cancer. BMC Cancer. (2021) 21:1282. doi: 10.1186/s12885-021-09016-8
28. Thomas MR, Storey RF. The role of platelets in inflammation. Thromb Haemost. (2015) 114:449–58. doi: 10.1160/TH14-12-1067
29. Franco AT, Corken A, Ware J. Platelets at the interface of thrombosis, inflammation, and cancer. Blood. (2015) 126:582–8. doi: 10.1182/blood-2014-08-531582
30. Liu Y, Zhang Y, Ding Y, Zhuang R. Platelet-mediated tumor metastasis mechanism and the role of cell adhesion molecules. Crit Rev Oncology/Hematology. (2021) 167:103502. doi: 10.1016/j.critrevonc.2021.103502
31. Detopoulou P, GI P, Mantoglou M, Michailidis P, Pantazi I, Papadopoulos S, et al. Relation of mean platelet volume (MPV) with cancer: A systematic review with a focus on disease outcome on twelve types of cancer. Curr Oncol. (2023) 30:3391–420. doi: 10.3390/curroncol30030258
32. Korniluk A, OM K-L, Kamińska J, Kemona H, Dymicka-Piekarska V. Mean platelet volume (MPV): new perspectives for an old marker in the course and prognosis of inflammatory conditions. Mediators Inflammation. (2019) 2019:9213074. doi: 10.1155/2019/9213074
Keywords: mean platelet volume/platelet count ratio, PVPR, recurrence-free survival, gastrointestinal stromal tumors, prognosis, nomogram
Citation: Du X, Zang X, Zhang H, Liu L, Xu Y, Li X, Mou R, Xu H, Zhu J and Xie R (2024) Mean platelet volume/platelet count ratio can predict the recurrence-free survival rate of patients after complete resection of gastrointestinal stromal tumors. Front. Oncol. 14:1465283. doi: 10.3389/fonc.2024.1465283
Received: 16 July 2024; Accepted: 15 October 2024;
Published: 08 November 2024.
Edited by:
Wenle Li, Xiamen University, ChinaCopyright © 2024 Du, Zang, Zhang, Liu, Xu, Li, Mou, Xu, Zhu and Xie. This is an open-access article distributed under the terms of the Creative Commons Attribution License (CC BY). The use, distribution or reproduction in other forums is permitted, provided the original author(s) and the copyright owner(s) are credited and that the original publication in this journal is cited, in accordance with accepted academic practice. No use, distribution or reproduction is permitted which does not comply with these terms.
*Correspondence: Rui Xie, cnhpZUBocmJtdS5lZHUuY24=; Jiuxin Zhu, emh1aml1eGluQGhyYm11LmVkdS5jbg==; Haitao Xu, ZG9jdG9yMUAxMjYuY29t
†These authors have contributed equally to this work and share first authorship